Attached files
| file | filename |
|---|---|
| EX-32 - EXHIBIT 32 - CERTIFICATION - TECHE HOLDING CO | ex-32.htm |
| EX-23 - EXHIBIT 23 - CONSENT OF AUDITORS - TECHE HOLDING CO | ex-23.htm |
| EX-31.2 - EXHIBIT 31.2 - CERTIFICATION OF CFO - TECHE HOLDING CO | ex-31_2.htm |
| EX-31.1 - EXHIBIT 31.1 - CERTIFICATION OF CEO - TECHE HOLDING CO | ex-31_1.htm |
| 10-K - FORM 10-K 09-30-10 TECHE HOLDING COMPANY - TECHE HOLDING CO | f10k_093010-0123.htm |
|
Teche Holding Company
|
New Iberia
|
Baton Rouge
|
|
1120 Jefferson Terrace Boulevard
|
142 W. St. Peter Street
|
Wal-Mart Neighborhood Market
|
|
New Iberia, LA 70560
|
New Iberia, LA 70560
|
9830 Old Hammond Highway
|
|
PHONE (337) 560-7151
|
(337) 364-5528
|
Baton Rouge, LA 70816
|
|
FAX (337) 365-7130
|
(225) 926-7378
|
|
|
Lafayette
|
||
|
New Iberia
|
Broadmoor
|
Breaux Bridge
|
|
1120 Jefferson Terrace Boulevard
|
5121 Johnston Street
|
601 East Bridge Street
|
|
New Iberia, LA 70560
|
Lafayette, LA 70503
|
Breaux Bridge, LA 70517
|
|
(337) 365-0366
|
(337) 981-1887
|
(337) 332-2149
|
|
Call Center (800) 897-0315
|
||
|
Lafayette
|
Houma
|
|
|
Franklin
|
Downtown
|
706 Barrow Street
|
|
211 Willow Street
|
1001 Johnston Street
|
Houma, LA 70360
|
|
Franklin, LA 70538
|
Lafayette, LA 70501
|
(985) 868-8766
|
|
(337) 828-3212
|
(337) 232-6463
|
|
|
Houma
|
||
|
Franklin Drive-Thru
|
Lafayette
|
912 Grand Caillou Road
|
|
1823 Main Street
|
2200 W. Pinhook Road
|
Houma, LA 70363
|
|
Franklin, LA 70538
|
Lafayette, LA 70508
|
(985) 857-9990
|
|
(337) 828-4177
|
(337) 232-3419
|
|
|
Thibodaux
|
||
|
Morgan City
|
Baton Rouge
|
921 Canal Boulevard
|
|
1001 7th Street
|
3524 S. Sherwood Forest Boulevard
|
Thibodaux, LA 70301
|
|
Morgan City, LA 70380
|
Baton Rouge, LA 70816
|
(985) 446-6707
|
|
(985) 384-0653
|
(225) 293-0954
|
|
|
Opelousas
|
||
|
Bayou Vista
|
Baton Rouge
|
428 E. Landry Street
|
|
206 Arlington Street
|
Wal-Mart Supercenter
|
Opelousas, LA 70570
|
|
Bayou Vista, LA 70380
|
2171 O’Neal Lane
|
(337) 942-5748
|
|
(985) 395-5244
|
Baton Rouge, LA 70816
|
|
|
(225) 751-0264
|
Eunice
|
|
|
New Iberia
|
840 E. Laurel Avenue
|
|
|
529 N. Lewis Street
|
Eunice, LA 70535
|
|
|
New Iberia, LA 70563
|
(337) 457-9585
|
|
|
(337) 367-2516
|
||
|
www.teche.com
|
|
Table of Contents
|
|
|
President’s Message
|
2
|
|
Selected Financial Data
|
6
|
|
Business of the Bank - Business of the Company
|
7
|
|
Summary of Quarterly Operating Results
|
7
|
|
Market and Dividend Information
|
8
|
|
Management’s Discussion and Analysis of Financial
|
|
|
Condition and Results of Operations
|
9
|
|
Management’s Report
|
17
|
|
Report of Independent Registered Public Accounting Firm
|
18
|
|
Consolidated Balance Sheets
|
19
|
|
Consolidated Statements of Income
|
20
|
|
Consolidated Statements of Stockholders’ Equity
|
21
|
|
Consolidated Statements of Cash Flows
|
22
|
|
Notes to Consolidated Financial Statements
|
24
|
|
Directors and Officers
|
58
|
1
Message from Patrick Little, Chairman and CEO
|
|
 |
 |
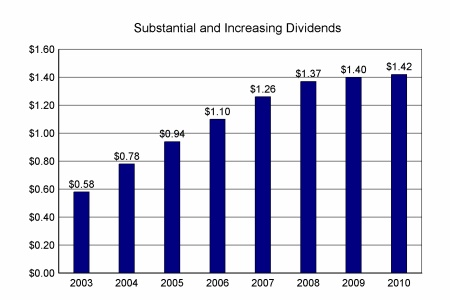
Teche achieved superior results for our fiscal year 2010. We exceeded our record earnings of 2009, paid the highest dividend in our history to our shareholders, strengthened our capital position and maintained asset quality. Our team has consistently demonstrated profitability and returned profits to our shareholders with cash dividends since we have been a public company. |
| |
|
Results of Fiscal Year 2010
Teche Holding Company, parent of Teche Federal Bank set an earnings per share record in fiscal year 2010 of $3.36. Teche also paid a record cash dividend of $1.42 per share. We are proud of our results. These results were achieved, in spite of, a deep water oil drilling moratorium, national economic slowdown and anticipated regulatory changes.
Teche did not take TARP and our consistent earnings has put us in a strong capital position. Tangible equity increased to 9.48% of total assets compared to 8.90% in fiscal year 2009. Risk based capital was also a strong 13.52% compared to 12.72% in fiscal year 2009 and tangible book value increased to a record $34.43.
|
 |
|
Our SmartGrowth strategy of growing high quality, higher yielding and shorter term loans and lower cost core deposits again contributed to an increase in our net interest margin. Our net interest margin increased to 4.25% compared to 4.01% in 2009. SmartGrowth loans now comprise 78% of our loan portfolio whereas in 2001 SmartGrowth loans were only 27% of total loans and SmartGrowth deposits are 69% of total deposits compared to 29% in 2001. Over the course of 10 years we have significantly changed our loan and deposit mix with excellent results for our shareholders.
|
 |
|
Deposit Growth
This year as in the previous 10 years we have grown the “right kind of deposits.” SmartGrowth deposits increased $32.5 million or 8.8% from $367.7 million at fiscal year end in 2009 to $400.2 million at fiscal year end in 2010. Checking account balances alone increased $7.4 million or 4.5% in the last twelve months. Teche has continued its Totally Free Checking program and our customers have continued to respond. Savings accounts also increased significantly to $166.7 million at 2010 year end from $106.5 at 2009 year end, an increase of 57%.
|
 |
2
|
Loan Growth
Teche this year as in the previous 10 years grew the “right kinds of loans.” SmartGrowth loans increased to $464.9 million in fiscal year 2010. SmartGrowth loans consist of consumer, commercial, home equity and SmartMortgages. Consumer loans grew 3.3%, commercial loan balances increased 1.3% and SmartMortgages grew by 3.8% reversing the decline that the bank saw in this segment during 2009. SmartMortgages are mortgages which don’t fit the customary home mortgage profile and have slightly higher rates of interest. They are NOT ‘subprime mortgages’ and the borrowers have passed the high standards of credit that Teche requires. Home equity loans declined by 8.5% as home owners retained the equity in their homes as part of the national trend of conservative spending and increased savings.
|
 |
Teche has $131 million in traditional fixed or adjustable rate mortgages and these have decreased slightly over the last twelve months as Teche sold a portion of its originated loans.
Asset Quality
Teche did not take TARP funds. Teche has continued the Company’s strong commitment to asset quality with sound underwriting standards, excellent servicing and diligent collection efforts. Non-performing assets to total assets were 2.06% at fiscal year end. This is a quality metric that favorably compares to 68 other southern banks with an average of 3.65% in non-performing assets to total assets in the last twelve months. Teche’s net charge-offs to average loans were 0.24% at fiscal year end compared to 0.29% in 2009. The average of net charge-offs to average loans at 66 other southern banks was 1.65%.
While asset quality at the company has remained strong overall, Teche feels that a prudent policy of provisioning is the correct path in this current economy and has increased the allowance for loan losses to $9.2 million from $6.8 million in the last twelve months.
Technology and Efficiency
Teche recognizes that smartly deployed technology is critical to superior customer service and cost containment in a highly competitive banking future. As part of our strategic plan, we initiated several improvements this year. We implemented a state-of-the-art content management and document imaging system which allows for more streamlined processing and improved efficiency in all aspects of our operations. In a concentrated effort to deliver the products and services that our business customers need to succeed, we introduced several exciting business services such as remote deposit capture and enhanced cash management tools. In 2011 these efforts continue as we embark on a significant upgrade to our core banking platforms and electronic delivery channels. Our investment in new technology increases the Bank’s capacity for future growth with high levels of efficiency.
Regulatory Changes
In 2010 a regulatory reform bill was passed by Congress and signed into law on July 21, 2010. It is anticipated that this legislation will have wide ranging effects on the financial industry. The media has focused on the effects of the bill on large financial firms, however, some aspects of this new law will affect community banks like Teche Federal Bank. For example, the Consumer Financial Protection Bureau created by the bill may alter the relationship between individuals and all financial providers including community banks like Teche.
The new law is complex and it will take a considerable amount of time to enact all of its parts. One aspect of the law, the Durbin amendment, gives the Federal Reserve control over the pricing of interchange fees between merchants and banks and its effective date is July 21, 2011. Another part of the bill that will be also effective on July 21, 2011 will be the absorption of the authority and duties of The Office of Thrift Supervision, Teche’s current regulator, by the Office of the Comptroller of the Currency. We will closely monitor the implementation of all aspects of this law as it evolves and respond in the best interests of our customers and shareholders.

3
Louisiana Economy
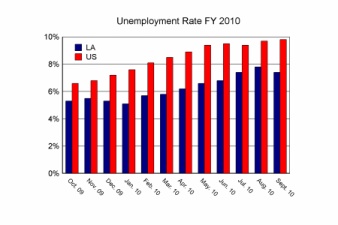
Louisiana, in recent years, has had lower unemployment rates than the rest of the country. Louisiana’s unemployment rate in September 2010 was 7.8% while the U.S. rate was 9.6%. The MSAs of Teche’s locations have comparatively low unemployment rates as well. Houma is the lowest with 5.5%, Lafayette’s rate was 6.2% and Baton Rouge’s rate was 7.8% in September of 2010. The deep water oil exploration moratorium is now lifted, however, the long term effects are still to be determined. Teche up to this point has had minimal direct exposure. In addition, onshore oil and gas exploration has remained active in Louisiana and unaffected by offshore restrictions. Teche believes that continued demand for oil and gas will accrue benefits in our markets.
Louisiana is the number one state for oil exploration and numerous oil platforms are operating off of Louisiana’s coast in both deep and shallow water. The energy industry is important to our economy. Up until the BP Horizon event, 55,000 wells had been drilled in the Gulf of Mexico without a single major spill as defined by the Minerals Management Service according to Dr. Loren Scott’s “Louisiana Economic Outlook, 2011-2012.” The Industry record overall is a good one for safety and this industry will continue to supply the energy needs of our country.
|
The petrochemical industry is also a large supplier of economic vitality and jobs especially in the Baton Rouge to New Orleans region. Baton Rouge has a heavy concentration of the industry with 78 manufacturing plants employing ~12,000 people in a nine parish (county) area.
New projects by ExxonMobil, SNF Polymer and Westlake Chemicals combine for a future investment of $912 million in the region. Improvements in the Huey P. Long and Twin Span Bridges for a $2.0 billion investment and the completion of the Audubon Bridge north of Baton Rouge for $406 million will enhance the transportation network that is vital to the petrochemical industry.
Louisiana has also strategically diversified its economy. The generous state incentive of 30% for movie production is now permanent and Louisiana is the third largest producer of movies after California and New York. The Louisiana Office of Entertainment reported that in-state spending was $803 million in 2009 and they are predicting $1.3 billion in 2010. The Baton Rouge area is also seeing major expansions of Woman’s Hospital, one of the largest specialty hospitals in the country, with a $300 million investment in a new facility which is under construction. In addition two hospitals - Our Lady of the Lake and Lane Memorial have expansions and improvements underway for a $70 million investment in the area.
|
  |
Houma and Lafayette both are affected to some degree by the oil drilling moratorium. Houma however sees expansion and development in its shipbuilding and fabrication industries with Edison Chouest completing its new shipyard this year which will employ 1000 people. Lafayette is experiencing expansion with a $70 million building project for Lafayette General Hospital and growth in employment at Stuller Settings and Bruce Foods. However Lafayette’s growth in the next two years will be related to the return of offshore oil drilling activities.
4
|
Shareholder Return
Teche has been consistently profitable since becoming a public company. Warren Buffet said, “A good CEO has the mind of an investor and a good investor has the mind of a CEO.” Our directors and employees have the minds of investors because many are investors in the Company’s stock. Insider ownership including employees is 36%. Our goals are aligned with our investors in a very real way. We paid a record dividend for fiscal year 2010 of $1.42 and we have paid dividends for sixty-one consecutive quarters. Our dividend yield was 4.58% and our payout ratio was 41.77% for fiscal year 2010. These metrics favorably compare to 1.76% average dividend yield for 72 other southern banks and 26.88% average payout ratio for 55 other southern banks. In addition our board has approved a plan to repurchase up to 3% of the Company’s stock. If you purchased 100 shares of Teche’s stock at the end of fiscal year 2000 and sold those shares at the end of fiscal year 2010 you would have a gain of 208% pre-tax income. This year our annualized return on average equity was 9.43% and our annualized return on average tangible equity was 9.94%. We believe that shareholders who learn our story and monitor our consistent results will understand that we have their interests foremost in our minds.
|
 |
Consistency and Resiliency
Throughout my remarks I have alluded to Teche’s 10 year strong track record of results. I believe the resiliency and growth of our Company is attributable to our focus on our successful SmartGrowth strategy, our talented leadership team and the support and training that we provide to our employees. Year after year our employees service our customers and ask them for more of their business. Our growth is mainly due to increasing market share in our current markets and we have more room to expand in those areas. We are always looking for new ways to continue to increase the value of our Company.
We are proud of our progress this year and we believe that we can continually improve and grow our institution in the future. We appreciate your investment and your support.
|
Sincerely,
 Patrick Little
Chairman and President/CEO
|
 |
|
5
SELECTED FINANCIAL DATA (Dollars in thousands, except per share data)
At or for the Year Ended September 30,
|
2010
|
2009
|
2008
|
2007
|
2006
|
||||||||||||||||
|
Assets
|
$ | 761,524 | $ | 765,071 | $ | 769,488 | $ | 719,367 | $ | 685,750 | ||||||||||
|
Loans Receivable, Net
|
586,635 | 588,527 | 584,139 | 561,623 | 520,185 | |||||||||||||||
|
Securities-Available for Sale
|
14,996 | 20,936 | 26,652 | 51,647 | 63,517 | |||||||||||||||
|
Securities-Held to Maturity
|
59,566 | 75,384 | 54,291 | 31,855 | 38,743 | |||||||||||||||
|
Cash and Cash Equivalents
|
40,655 | 23,675 | 50,112 | 21,811 | 17,528 | |||||||||||||||
|
Deposits
|
579,355 | 585,469 | 589,228 | 555,569 | 537,549 | |||||||||||||||
|
FHLB Advances
|
100,017 | 100,628 | 104,877 | 89,756 | 77,386 | |||||||||||||||
|
Stockholders’ Equity
|
75,513 | 71,485 | 68,044 | 67,006 | 63,929 | |||||||||||||||
|
SUMMARY OF OPERATIONS
|
||||||||||||||||||||
|
Interest Income
|
$ | 41,336 | $ | 44,237 | $ | 45,633 | $ | 43,041 | $ | 39,197 | ||||||||||
|
Interest Expense
|
11,704 | 15,297 | 19,733 | 19,857 | 16,720 | |||||||||||||||
|
Net Interest Income
|
29,632 | 28,940 | 25,900 | 23,184 | 22,477 | |||||||||||||||
|
Provision for Loan Losses
|
3,896 | 3,026 | 825 | 605 | 210 | |||||||||||||||
|
Net Interest Income after
|
||||||||||||||||||||
|
Provision for Loan Losses
|
25,736 | 25,914 | 25,075 | 22,579 | 22,267 | |||||||||||||||
|
Non-Interest Income
|
15,923 | 15,951 | 16,001 | 14,572 | 13,031 | |||||||||||||||
|
Non-Interest Expense
|
31,229 | 31,372 | 30,740 | 27,464 | 24,364 | |||||||||||||||
|
Income Before Gains (Losses) on
|
||||||||||||||||||||
|
Securities and Income Taxes
|
10,430 | 10,493 | 10,336 | 9,687 | 10,934 | |||||||||||||||
|
Gains (Losses) on Sales of Securities
|
37 | (99 | ) | (2,580 | ) | 164 | 34 | |||||||||||||
|
Income Tax Expense
|
3,366 | 3,258 | 2,047 | 3,170 | 3,651 | |||||||||||||||
|
Net Income
|
$ | 7,101 | $ | 7,136 | $ | 5,709 | $ | 6,681 | $ | 7,317 | ||||||||||
|
SELECTED FINANCIAL RATIOS
|
||||||||||||||||||||
|
Ratio of Equity to Assets
|
9.92 | % | 9.34 | % | 8.84 | % | 9.31 | % | 9.32 | % | ||||||||||
|
Book Value/Common Share
|
$ | 36.19 | $ | 34.09 | $ | 32.12 | $ | 30.42 | $ | 28.68 | ||||||||||
|
Dividends declared per Share
|
$ | 1.42 | $ | 1.41 | $ | 1.37 | $ | 1.26 | $ | 1.10 | ||||||||||
|
Basic Income per Common Share
|
$ | 3.40 | $ | 3.38 | $ | 2.65 | $ | 3.01 | $ | 3.22 | ||||||||||
|
Diluted Income per Common Share
|
$ | 3.37 | $ | 3.36 | $ | 2.63 | $ | 2.94 | $ | 3.15 | ||||||||||
|
Return on Average Assets
|
0.93 | % | 0.91 | % | 0.76 | % | 0.95 | % | 1.07 | % | ||||||||||
|
Return on Average Equity
|
9.43 | % | 9.98 | % | 8.29 | % | 10.24 | % | 11.79 | % | ||||||||||
|
Net Interest Margin
|
4.25 | % | 4.01 | % | 3.71 | % | 3.57 | % | 3.53 | % | ||||||||||
|
Non-Interest Expense/Average Assets
|
4.10 | % | 4.02 | % | 4.07 | % | 3.89 | % | 3.54 | % | ||||||||||
|
Non-Interest Income/Average Assets
|
2.11 | % | 2.08 | % | 2.11 | % | 2.06 | % | 1.89 | % | ||||||||||
|
Non-Performing Loans/Loans (1)
|
2.47 | % | 1.21 | % | 1.09 | % | 0.68 | % | 0.74 | % | ||||||||||
|
Allowance for Loan Losses/Loans (1)
|
1.55 | % | 1.14 | % | 0.94 | % | 0.90 | % | 0.93 | % | ||||||||||
|
Dividend Payout
|
42.14 | % | 41.32 | % | 51.90 | % | 41.66 | % | 33.65 | % | ||||||||||
(1) Total loans before allowance for loan losses
6
Business of the Bank
Teche Federal Bank (the "Bank") attracts savings deposits from the general public and uses such deposits to originate primarily residential mortgage loans, commercial mortgage loans and consumer loans. Additionally, the Bank invests in mortgage-backed and investment securities. (See “Management Strategy” on page 9)
It is the Bank's intention to remain an independent community savings bank serving the local banking needs of its primary market area, which presently includes twenty offices in the Louisiana Parishes of St. Mary, Iberia, Lafayette, St. Landry, St. Martin, Terrebonne, Lafourche, East Baton Rouge and Ascension. The FDIC insures deposits at the Bank up to the maximum legal amount.
Business of the Company
Teche Holding Company (the "Company") is a Louisiana corporation organized in December 1994 at the direction of the Board of Directors of the Bank to acquire all of the capital stock that the Bank issued upon its conversion from the mutual to stock form of organization.
Summary of Quarterly Operating Results
|
2010
|
2009
|
|||||||||||||||||||||||||||||||
|
First
|
Second
|
Third
|
Fourth
|
First
|
Second
|
Third
|
Fourth
|
|||||||||||||||||||||||||
|
(Amounts in thousands, except per share data)
|
||||||||||||||||||||||||||||||||
|
Interest Income
|
$ | 10,500 | $ | 10,374 | $ | 10,299 | $ | 10,163 | $ | 11,214 | $ | 11,013 | $ | 11,130 | $ | 10,880 | ||||||||||||||||
|
Interest Expense
|
3,067 | 2,940 | 2,969 | 2,728 | 4,378 | 3,950 | 3,583 | 3,386 | ||||||||||||||||||||||||
|
Net Interest Income
|
7,433 | 7,434 | 7,330 | 7,435 | 6,836 | 7,063 | 7,547 | 7,494 | ||||||||||||||||||||||||
|
Provision for Loan Losses
|
1,196 | 900 | 900 | 900 | 155 | 1,035 | 550 | 1,286 | ||||||||||||||||||||||||
|
Income before
|
2,574 | 2,502 | 2,713 | 2,678 | 2,602 | 2,482 | 2,395 | 2,915 | ||||||||||||||||||||||||
|
Income Taxes
|
||||||||||||||||||||||||||||||||
|
Net Income
|
1,733 | 1,700 | 1,821 | 1,847 | 1,764 | 1,656 | 1,733 | 1,983 | ||||||||||||||||||||||||
|
Basic Income
|
0.83 | 0.81 | 0.87 | 0.89 | 0.83 | 0.78 | 0.82 | 0.95 | ||||||||||||||||||||||||
|
per Common Share
|
||||||||||||||||||||||||||||||||
|
Diluted Income
|
0.82 | 0.80 | 0.87 | 0.88 | 0.83 | 0.78 | 0.81 | 0.94 | ||||||||||||||||||||||||
|
per Common Share
|
||||||||||||||||||||||||||||||||
7
Market and Dividend Information
Teche Holding Company's common stock trades on the NYSE Amex under the symbol "TSH.” The following sets forth the high and low closing prices and cash dividends declared for the common stock for the last two fiscal years.
|
Quarter ended
|
Closing Price
|
Period End Close
|
Cash Dividend Declared
|
Date Declared
|
|||||||||||||
|
High
|
Low
|
||||||||||||||||
|
December 31, 2008
|
$ | 31.81 | $ | 22.90 | $ | 25.01 | $ | 0.35 |
November 20, 2008
|
||||||||
|
March 31, 2009
|
$ | 30.95 | $ | 22.40 | $ | 30.50 | $ | 0.35 |
February 19, 2009
|
||||||||
|
June 30, 2009
|
$ | 35.50 | $ | 28.85 | $ | 33.10 | $ | 0.35 |
May 29, 2009
|
||||||||
|
September 30, 2009
|
$ | 35.75 | $ | 31.90 | $ | 33.10 | $ | 0.355 |
August 27, 2009
|
||||||||
|
December 30, 2009
|
$ | 33.40 | $ | 30.75 | $ | 31.71 | $ | 0.355 |
November 19, 2009
|
||||||||
|
March 31, 2010
|
$ | 33.40 | $ | 30.80 | $ | 32.90 | $ | 0.355 |
February 17, 2010
|
||||||||
|
June 30, 2010
|
$ | 33.00 | $ | 28.10 | $ | 28.10 | $ | 0.355 |
May 26, 2010
|
||||||||
|
September 30, 2010
|
$ | 31.56 | $ | 26.60 | $ | 31.00 | $ | 0.355 |
August 23, 2010
|
||||||||
According to the records of the Company's transfer agent, there were 429 registered stockholders of record at November 30, 2010. This number does not include any persons or entities that hold their stock in nominee or "street" name through various brokerage firms.
The Company's ability to pay dividends is substantially dependent upon the dividends it receives from the Bank. Under current regulations, the Bank is not permitted to pay dividends if its regulatory capital would thereby be reduced below (1) the amount then required for the liquidation account established in connection with the Bank's conversion from mutual to stock form, or (2) the regulatory capital requirements imposed by the Office of Thrift Supervision ("OTS"). Capital distributions are also subject to certain limitations based on the Bank's net income. See Notes 18 and 19 of Notes to Consolidated Financial Statements. The Bank's total capital at September 30, 2010 exceeded the amounts of its liquidation account and regulatory capital requirements.
8
MANAGEMENT'S DISCUSSION AND ANALYSIS OF FINANCIAL CONDITION AND RESULTS OF OPERATIONS
General
The Private Securities Litigation Reform act of 1995 contains safe harbor provisions regarding forward-looking statements. When used in this discussion, the words “believe”, “anticipates”, “contemplates”, “expects”, and similar expressions are intended to identify forward-looking statements. Such statements are subject to certain risks and uncertainties that could cause actual results to differ materially from those projected. Those risks and uncertainties include changes in interest rates, risk associated with the effect of opening new branches, the ability to control costs and expenses, and general economic conditions. The Company undertakes no obligation to publicly release the results of any revisions to those forward-looking statements that may be made to reflect events or circumstances after the date hereof or to reflect the occurrences of unanticipated events.
The Company's consolidated results of operations are primarily dependent on the Bank's net interest income, or the difference between the interest income earned on its loan, mortgage-backed securities and investment securities portfolios, and the interest expense paid on its savings deposits and other borrowings. Net interest income is affected not only by the difference between the yields earned on interest-earning assets and the costs incurred on interest-bearing liabilities, but also by the relative amounts of such interest-earning assets and interest-bearing liabilities.
Other components of net income include: provisions for losses on loans and other assets, non-interest income (primarily, service charges on deposit accounts and other fees), and non-interest expenses (primarily, compensation and employee benefits, office occupancy expense, marketing expense and expenses associated with foreclosed real estate) and income taxes.
Earnings of the Company also are significantly affected by economic and competitive conditions, particularly changes in interest rates, government policies and regulations of regulatory authorities.
References to the "Bank" herein, unless the context requires otherwise, refer to the Company on a consolidated basis.
Overview
The Company’s net income remained relatively stable at $7.1 million for fiscal 2010 and 2009. Net income for fiscal 2009 compared to 2008 was higher due to an increase in net interest income of $3.0 million offset somewhat by an increase in provision for loan losses of $2.2 million. The Company’s assets in fiscal 2010 decreased $3.5 million to $761.5 million primarily due to decreases in both the loan and security portfolios.
Management Strategy
Management's strategy has been to maximize earnings and profitability through steady growth while maintaining asset quality. The Bank's lending strategy has historically focused on the origination of traditional one- to four-family mortgage loans with the primary emphasis on single-family residences in the Bank's primary market area. Additionally, management emphasizes a “SmartGrowth” strategy that focuses on the origination of consumer loans (primarily home equity and mobile home loans), SmartMortgage loans, commercial loans and commercial real estate loans for retention in the Company’s loan portfolio. SmartMortgage loans originated by the Bank are residential real estate loans that do not meet all of the Bank’s standard loan underwriting criteria for residential real estate loans. Consumer loans, commercial loans and commercial real estate loans generally have shorter terms to maturity and higher yields than residential real estate loans. While SmartMortgage loans, consumer loans, commercial loans, and commercial real estate loans have greater credit risk than conforming residential real estate loans, the Company believes its SmartGrowth strategy will have a favorable impact on the Company’s net interest margin, as well as assist in interest rate risk management. SmartGrowth also emphasizes growth in core deposits (primarily transaction accounts), which include demand deposits, NOW accounts, money market deposit accounts and savings accounts.
Asset and Liability Management
Interest Rate Sensitivity Analysis. Net interest income, the primary component of the Bank's net income, is derived from the difference between the interest income on interest-earning assets and the interest expense of interest-bearing liabilities. The Bank has sought to manage its exposure to changes in interest rates by monitoring the effective maturities or re-pricing characteristics of its interest-earning assets and interest-bearing liabilities. The matching of the Bank's assets and liabilities may be analyzed by examining the extent to which its assets and liabilities are interest rate sensitive and by monitoring the expected effects of interest rate changes on its net interest income and net portfolio value.
The ability to maximize net interest income is largely dependent upon achieving a positive interest rate spread that can be sustained during fluctuations in prevailing interest rates. The Bank is exposed to interest rate risk as a result of the difference in the maturity of interest-bearing liabilities and interest-earning assets and the volatility of interest rates. Because most deposit accounts
9
react more quickly to market interest rate movements than do traditional mortgage loans due to their shorter terms to maturity, increases in interest rates may have an adverse effect on the Bank's earnings. Conversely, this same mismatch will generally benefit the Bank's earnings during periods of declining or stable interest rates.
The Bank attempts to manage its interest rate exposure by shortening the maturities of its interest-earning assets by emphasizing adjustable rate mortgages ("ARMs"), periodically selling loans from the portfolio of long term fixed rate mortgages, originating shorter term loans such as residential construction, consumer, home equity and commercial loans and the investment of excess liquidity in purchased loans, adjustable rate mortgage-backed securities and other securities with relatively short terms to maturity. Furthermore, the Bank works to manage the interest rates it pays on deposits while maintaining a stable deposit base and providing quality services to its customers. In recent years, the Bank has used borrowings while continuing to rely primarily upon deposits as its source of funds. At September 30, 2010, the weighted average term to re-pricing of the Bank’s ARM loan and ARM mortgage-backed securities portfolio was approximately 17 months. In contrast, at September 30, 2010, $70.8 million of the Bank's certificate accounts and $400.2 million of the Bank's regular deposit accounts (e.g. demand, NOW, money market, savings), out of $579.4 million of total deposits, were scheduled to mature or re-price within one year or sooner.
Management believes that it has adequate capital to accept a certain degree of interest rate risk. Should interest rates rise management believes the Bank's capital position will enable it to withstand the negative impact on earnings.
Rate/Volume Analysis. The table below sets forth certain information regarding changes in interest income and interest expense of the Bank for the periods indicated. For each category of interest-earning assets and interest-bearing liabilities, information is provided on changes attributable to (i) changes in volume (changes in average volume multiplied by old rate); (ii) changes in rates (changes in rate multiplied by old average volume); and (iii) the net change. The changes attributable to the combined impact of volume and rate have been allocated proportionately to the changes due to volume and the changes due to rate.
| September 30, | September 30, | |||||||||||||||||||||||
| 2010 vs. 2009 | 2009 vs. 2008 | |||||||||||||||||||||||
| Increase (Decrease) Due to | Increase (Decrease) Due to | |||||||||||||||||||||||
| Volume | Rate | Net | Volume | Rate | Net | |||||||||||||||||||
| (Dollars in thousands) | ||||||||||||||||||||||||
| Interest-Earning Assets: | ||||||||||||||||||||||||
|
Securities (1)
|
$ | (522 | ) | $ | (664 | ) | $ | (1,186 | ) | $ | 90 | $ | (115 | ) | $ | (25 | ) | |||||||
|
Loans Receivable, Net
|
(505 | ) | (1,279 | ) | (1,784 | ) | 1,200 | (2,290 | ) | (1,090 | ) | |||||||||||||
|
Other Interest-Earning Assets (2)
|
(39 | ) | 108 | 69 | 304 |
(585)
|
(281 | ) | ||||||||||||||||
|
Total Interest-Earning Assets
|
(1,066 | ) | (1,835 | ) | (2,901 | ) | 1,594 | (2,990 | ) | (1,396 | ) | |||||||||||||
|
Interest-Bearing Liabilities
|
||||||||||||||||||||||||
|
Deposits
|
(293 | ) | (3,070 | ) | (3,363 | ) | 130 | (4,891 | ) | (4,761 | ) | |||||||||||||
|
FHLB Advances
|
(126 | ) | (104 | ) | (230 | ) | 447 | (122 | ) | 325 | ||||||||||||||
|
Total Interest-Bearing Liabilities
|
(419 | ) | (3,174 | ) | (3,593 | ) | 577 | (5,013 | ) | (4,436 | ) | |||||||||||||
| Net Change in Net Interest Income | $ | (647 | ) | $ | 1,339 | $ | 692 | $ | 1,017 | $ | 2,023 | $ | 3,040 | |||||||||||
(1) Includes investment securities and FHLB stock.
(2) Includes certificates of deposit and other interest-bearing accounts.
10
Average Balance Sheet. The following table sets forth certain information relating to the Company's average balance sheet and reflects the average yield on assets and average cost of liabilities for the periods indicated. Such yields and costs are derived by dividing income or expenses by the average balance of assets or liabilities, respectively, for the periods presented. Average balances are derived from daily average balances.
|
Year Ended September 30,
|
||||||||||||||||||||||||||||||||||||
|
2010
|
2009
|
2008
|
||||||||||||||||||||||||||||||||||
|
Average
|
Average
|
Average
|
Average
|
Average
|
Average
|
|||||||||||||||||||||||||||||||
|
Balance
|
Interest
|
Yield/Cost
|
Balance
|
Interest
|
Yield/Cost
|
Balance
|
Interest
|
Yield/Cost
|
||||||||||||||||||||||||||||
|
(Dollars in Thousands)
|
||||||||||||||||||||||||||||||||||||
|
Assets
|
||||||||||||||||||||||||||||||||||||
|
Interest-Earning Assets
|
||||||||||||||||||||||||||||||||||||
|
Securities (1)
|
$ | 74,519 | $ | 2,662 | 3.57 | % | $ | 86,215 | $ | 3,848 | 4.46 | % | $ | 84,249 | $ | 3,872 | 4.60 | % | ||||||||||||||||||
|
Loans Receivable (2) (3)
|
599,134 | 38,406 | 6.41 | % | 606,751 | 40,190 | 6.62 | % | 589,614 | 41,280 | 7.00 | % | ||||||||||||||||||||||||
|
Other Interest-Earning Assets (4)
|
23,662 | 268 | 1.13 | % | 29,443 | 199 | 0.67 | % | 18,043 | 481 | 2.67 | % | ||||||||||||||||||||||||
|
Total Interest-Earning Assets
|
697,315 | $ | 41,336 | 5.93 | % | 722,409 | $ | 44,237 | 6.12 | % | 691,906 | $ | 45,633 | 6.60 | % | |||||||||||||||||||||
|
Non-Interest Earning Assets
|
65,040 | 58,778 | 57,919 | |||||||||||||||||||||||||||||||||
|
Total Assets
|
$ | 762,355 | $ | 781,187 | $ | 749,825 | ||||||||||||||||||||||||||||||
|
Liabilities and Stockholders’ Equity
|
||||||||||||||||||||||||||||||||||||
|
Interest-Bearing Liabilities
|
||||||||||||||||||||||||||||||||||||
|
NOW Accounts
|
$ | 104,176 | $ | 427 | 0.41 | % | $ | 100,817 | $ | 538 | 0.53 | % | $ | 83,515 | $ | 456 | 0.55 | % | ||||||||||||||||||
|
Statement & Regular Savings Accounts
|
143,408 | 1,301 | 0.91 | % | 76,214 | 664 | 0.87 | % | 52,851 | 409 | 0.77 | % | ||||||||||||||||||||||||
|
Money Funds Accounts
|
71,958 | 282 | 0.39 | % | 115,721 | 1,440 | 1.24 | % | 125,905 | 3,190 | 2.53 | % | ||||||||||||||||||||||||
|
Certificates of Deposit
|
192,591 | 5,151 | 2.67 | % | 240,270 | 7,882 | 3.28 | % | 264,185 | 11,230 | 4.25 | % | ||||||||||||||||||||||||
|
Total Deposits
|
512,133 | 7,161 | 1.40 | % | 533,022 | 10,524 | 1.97 | % | 526,456 | 15,285 | 2.90 | % | ||||||||||||||||||||||||
|
FHLB Advances
|
102,254 | 4,543 | 4.44 | % | 105,060 | 4,773 | 4.54 | % | 95,225 | 4,448 | 4.67 | % | ||||||||||||||||||||||||
|
Total Interest-Bearing Liabilities
|
614,387 | $ | 11,704 | 1.90 | % | 638,082 | $ | 15,297 | 2.40 | % | 621,681 | $ | 19,733 | 3.17 | % | |||||||||||||||||||||
|
Non-Interest-Bearing Liabilities
|
72,689 | 71,626 | 59,311 | |||||||||||||||||||||||||||||||||
|
Total Liabilities
|
687,076 | 709,708 | 680,992 | |||||||||||||||||||||||||||||||||
|
Stockholders’ Equity
|
75,279 | 71,479 | 68,833 | |||||||||||||||||||||||||||||||||
|
Total Liabilities and Stockholders’ Equity
|
$ | 762,355 | $ | 781,187 | $ | 749,825 | ||||||||||||||||||||||||||||||
|
Net Interest Income/Interest Rate Spread (5)
|
$ | 29,632 | 4.02 | % | $ | 28,940 | 3.72 | % | $ | 25,900 | 3.42 | % | ||||||||||||||||||||||||
|
Net Interest Margin (6)
|
4.25 | % | 4.01 | % | 3.74 | % | ||||||||||||||||||||||||||||||
|
Interest-Earning Assets/
|
||||||||||||||||||||||||||||||||||||
|
Interest-Bearing Liabilities
|
113.50 | % | 113.22 | % | 112.15 | % | ||||||||||||||||||||||||||||||
(1) Includes securities and Federal Home Loan Bank (“FHLB”) stock.
(2) Amount is net of deferred loan fees, loan discounts and premiums and loans-in-process and includes non-accruing loans.
(3) Interest income includes loan fees of approximately $555,000 in 2010, $585,000 in 2009 and $565,000 in 2008.
(4) Amount includes certificates of deposit and other interest-bearing deposits.
(5) Interest rate spread represents the difference between the yield on average interest-earning assets and the cost of average interest-bearing liabilities.
(6) Net interest margin represents net interest income divided by average interest-earning assets
11
Changes in Financial Condition from September 30, 2009 to September 30, 2010
General. Total assets decreased $3.6 million, or 0.5% to $761.5 million at September 30, 2010 from $765.1 million at September 30, 2009, due to reductions in securities and loan portfolios offset somewhat by increases in cash and interest bearing deposits.
Cash and Cash Equivalents. Cash increased $17.0 million from $23.7 million at September 30, 2009 to $40.7 million at September 30, 2010. The increase resulted primarily from loan repayments along with principal payments on securities.
Securities Available-for-Sale and Held to Maturity. Securities available-for-sale decreased $5.9 million from $20.9 million at September 30, 2009 to $15.0 million at September 30, 2010 due primarily to repayments on existing mortgage backed securities. Securities held-to-maturity decreased $15.8 million from $75.4 million to $59.6 million due primarily to repayments on existing mortgage backed securities along with maturities of government sponsored agency securities, offset somewhat by purchases of time deposits at other banks. (See Note 3 of the Consolidated Financial Statements.)
Loans Receivable, Net. The Bank’s net loans receivable decreased $1.9 million or 0.3% to $586.6 million from $588.5 million at September 30, 2009 due primarily to decreases in home equity loans and loans on savings accounts offset by growth in one-to-four family mortgage loans, mobile home loans, and travel trailer loans. (See Note 4 of the Consolidated Financial Statements for a comparative breakdown of the Bank’s loan portfolio.)
Premises and Equipment, Net. Premises and equipment decreased $0.5 million or 1.7% due to depreciation offset by equipment purchases.
Deposits. The Bank’s deposits decreased $6.1 million or 1.0% to $579.4 million at September 30, 2010, from $585.5 million at September 30, 2009. SmartGrowth deposits which consist of non-interest bearing checking, interest-bearing checking, savings accounts, and money market accounts increased $32.4 million during the fiscal year. Time deposits decreased $38.5 million from $217.7 million to $179.2 million. (See Note 7 of the Consolidated Financial Statements for a comparative breakdown of the Bank’s deposit portfolio.)
Advances from FHLB. Advances from the Federal Home Loan Bank of Dallas decreased $0.6 million, or 0.6% to $100.0 million from $100.6 million at September 30, 2009. The decrease was due to repayments on existing advances along with advance maturities offset by advance purchases.
Stockholders’ Equity. Stockholders’ equity increased $4.0 million, or 5.6% from $71.5 million at September 30, 2009, to $75.5 million at September 30, 2010. The increase was due primarily to net income less dividends and the purchase of treasury stock.
Comparison of Operating Results for Years Ended September 30, 2010, 2009 and 2008
Analysis of Net Income
General. The Company had net income of $7.1million, $7.1 million and $5.7 million for the years ended 2010, 2009 and 2008. Fiscal 2010 net income remained relatively the same as fiscal 2009. The $1.4 million increase during fiscal 2009 was primarily due to $3.0 million increase in net interest income, offset by an increase in the provision for loan losses of $2.2 million.
Operating Revenue. Operating revenue for the fiscal year ended September 30, 2010, consisting of net interest income (before provision for loan losses and gain (loss) on securities and sale of loans) plus non-interest income, amounted to $45.7 million, $45.3 million and $42.4 million for the years ended 2010, 2009 and 2008, respectively. The $0.4 million increase during fiscal 2010 was primarily due to a reduction in total interest expense of $3.6 million offset by a decrease of $2.9 million in interest income. The $3.5 million increase during fiscal 2009 was primarily due to a reduction in total interest expense of $4.4 million offset somewhat by a decrease in interest income on loans of $1.1 million.
Interest Income. Interest income amounted to $41.3 million, $44.2 million and $45.6 million for the years ended 2010, 2009 and 2008, respectively. The $2.9 million decrease during fiscal 2010 was primarily due to a decrease in interest rates along with a decrease in average balances on earning assets. The $1.4 million decrease during fiscal 2009 was primarily due to a decrease in interest rates offset by an increase in the average balance on earning assets.
The average balance of loans decreased during fiscal 2010 by $7.6 million, or 1.3% while increasing in fiscal 2009 by $17.1 million, or 2.9%.
Interest Expense. Interest expense totaled $11.7 million, $15.3 million and $19.7 million for the years ended September 30, 2010, 2009 and 2008. The $3.6 million decrease from fiscal 2009 to fiscal 2010 was primarily due to lower interest rates on deposits. The $4.4 million decrease from fiscal 2008 to fiscal 2009 was primarily due to lower interest rates offset by a modest increase in both deposit and FHLB advance average balances.
12
Net Interest Income. Net interest income increased $0.7 million to $29.6 million during the year ended September 30, 2010 primarily due to lower rates on interest bearing liabilities offset somewhat by lower rates on interest bearing assets. Net interest income increased $3.1 million to $28.9 million during the year ended September 30, 2009 primarily due to a decrease in interest expense on deposits and FHLB advances, offset by a decrease in interest income on loans.
Provision for Loan Losses. The Bank provided $3.9 million, $3.0 million and $825,000 to the allowance for loan losses for the years ended September 30, 2010, 2009 and 2008 respectively. The provision increased in fiscal 2010 and 2009 due to an increase in historical charge-off rates and qualitative adjustments necessary to address negative economic and credit quality trends. The provision increased in fiscal 2008 primarily due to growth in the loan portfolio as well as changes to the qualitative and quantitative factors considered during the analysis of the allowance for loan losses.
Management periodically estimates the likely level of losses to determine whether the allowance for loan losses is adequate to absorb probable losses inherent in the existing portfolio. Based on these estimates, an amount is charged or credited to the provision for loan losses and credited or charged to the allowance for loan losses in order to adjust the allowance to a level determined to adequately absorb probable inherent losses.
While the Bank maintains its allowance for losses at a level that it considers to be adequate to provide for existing losses, there can be no assurance that further additions will not be made to the loss allowances and that such losses will not exceed the estimated amounts. (See Note 1 to the Consolidated Financial Statements.)
Non-Interest Income. Non-interest income during the years ended September 30, 2010, 2009 and 2008 amounted to $16.0 million, $15.9 million and $13.4 million respectively. Non-interest income in fiscal 2010 increased slightly from fiscal 2009 due to reductions in impairment charges on certain securities offset somewhat by decreases in gains on the sale of loans. Non-interest income in fiscal 2008 and 2009 included charges for certain investment securities in the investment portfolio in the amount of $3.0 million and $1.0 million respectively. Non-interest income in fiscal 2009 included a gain of $559,000 on the sale of $26 million of conforming loans. (See Loans Receivable, Net) Excluding these charges, non-interest income remained relatively stable between fiscal 2008 and 2009.
Non-Interest Expense. Non-interest expense totaled $31.2 million, $31.4 million and $30.7 million during the years ended September 30, 2010, 2009 and 2008, respectively. Non-interest expenses remained relatively stable in fiscal 2010 compared to fiscal 2009. The $0.7 million increase during fiscal 2009 was primarily due to an increase in deposit insurance premiums.
The Bank is subject to the Louisiana Shares Tax, which amounted to an expense of $513,000, $567,000 and $666,000 in the fiscal years ended September 30, 2010, 2009 and 2008, respectively.
Gain (loss) on Sale of Securities. In the years ended September 30, 2010, 2009 and 2008, gain (losses) on the sale of securities amounted to $37,000, ($99,000) and ($2,580,000), respectively. The $37,000 gain recorded in 2010 resulted from the sale of some equity securities. The loss recorded in 2009 resulted from the Company’s recording an impairment loss on an equity security for $175,000, offset by a gain on sale of equity securities of $76,000. The loss recorded in 2008 resulted from the Company’s withdrawal of a $16.1 million investment in a mortgage mutual fund that had continued to decline in value during the year as a result of the turmoil that existed in the mortgage markets in general. (See Note 3 of the Consolidated Financial Statements.)
Income Tax Expense. For the years ended September 30, 2010, 2009 and 2008, the Company incurred income tax expense of $3.4 million, $3.3 million and $2.0 million, respectively. There was a slight increase in the effective tax rate in 2010 due to a decrease in the benefits of tax credits as compared to 2009. There was an increase in the effective tax rate in 2009 due to higher pre-tax income and the benefit of tax credits were lower than in 2008. (See Note 10 of the Consolidated Financial Statements for further explanation.)
Liquidity and Capital Resources
The Bank's average liquidity ratio is based on deposits and was approximately 16.0% percent during September 2010. The liquidity ratio is calculated by dividing cash and cash equivalents plus securities less securities pledged by total assets. The Bank manages its average liquidity ratio to meet its funding needs, including: deposit outflows; disbursement of payments collected from borrowers for taxes and insurance; repayment of Federal Home Loan Bank advances and other borrowings; and loan principal disbursements. The Bank also monitors its liquidity position in accordance with its asset/liability management objectives.
In addition to funds provided from operations, the Bank's primary sources of funds are: savings deposits, principal repayments on loans and mortgage-backed securities, and matured or called investment securities. The Bank also borrows funds from the Federal Home Loan Bank of Dallas (the “FHLB”).
Scheduled loan repayments and maturing investment securities are a relatively predictable source of funds. However, savings deposit flows and prepayments on loans and mortgage-backed securities are significantly influenced by changes in market interest rates, economic conditions and competition. The Bank strives to manage the pricing of its deposits to maintain a balanced stream of cash flows commensurate with its loan commitments and other predictable funding needs.
13
The Bank usually maintains a portion of its cash on hand in interest-bearing demand deposits with the FHLB and other correspondent banks to meet immediate loan commitment and savings withdrawal funding requirements. When applicable, cash in excess of immediate funding needs is invested into longer-term investment and mortgage-backed securities, some of which may also qualify as liquid investments under current OTS regulations.
Funds available under existing credit facilities from the FHLB totaled $167.1 million. The Bank has total FHLB borrowings of $100.0 million, or 13.1% of the Bank’s assets. Approximately $21.6 million is due in the year ending September 30, 2011.
Management believes the Bank has sufficient resources available to meet its foreseeable funding requirements. At September 30, 2010, the Bank had outstanding loan commitments of $48.8 million, and certificates of deposit scheduled to mature within one year of $70.8 million, much of which management expects, based on past experience, will remain with the Bank upon maturity.
Regulations of the OTS require the Bank to meet or exceed three separate standards of capital adequacy. These regulations require financial institutions to have minimum tangible capital equal to 1.5% of total adjusted assets; minimum core capital equal to 4.0% of total adjusted assets; and risk-based capital equal to 8.0% of total risk-weighted assets. At September 30, 2010, the Bank exceeded all regulatory capital requirements. (See Note 18 to the Consolidated Financial Statements.)
Net Portfolio Value Analysis - Interest Rate Risk
The Bank is subject to interest rate risk to the degree that its interest-bearing liabilities, primarily deposits with short- and medium-term maturities, mature or re-price at different rates than our interest-earning assets. Although having liabilities that mature or re-price less frequently on average than assets will be beneficial in times of rising interest rates, such an asset/liability structure will result in lower net income during periods of declining interest rates, unless offset by other factors.
The Bank believes it is critical to manage the relationship between interest rates and the effect on its net portfolio value (“NPV”). This approach calculates the difference between the present value of expected cash flows from assets and the present value of expected cash flows from liabilities, as well as cash flows from off-balance sheet contracts. The Bank manages assets and liabilities within the context of the marketplace, regulatory limitations and within its limits on the amount of change in NPV which is acceptable given certain interest rate changes.
The OTS requires all regulated thrift institutions to calculate the estimated change in the institution’s NPV assuming instantaneous parallel shifts in the Treasury yield curve of 100 to 300 basis points either up or down in 100 basis point increments. The NPV is defined as the present value of expected cash flows from existing assets less the present value of expected cash flows from existing liabilities plus the present value of net expected cash inflows from existing off-balance sheet contracts.
The OTS provides an interest rate sensitivity report of NPV to all institutions that file with the OTS a Consolidated Maturity & Rate Schedule (“CMR”) as a part of the institution’s quarterly Thrift Financial Report. The OTS simulation model uses a discounted cash flow analysis and an option-based pricing approach to measuring the interest rate sensitivity of NPV. The OTS model estimates the economic value of each type of asset, liability, and off-balance sheet contract under the assumption that the Treasury yield curve shifts instantaneous and parallel up and down 100 to 300 basis points in 100 basis point increments. The OTS allows thrifts with under $1 billion in total assets to use the results of their interest rate sensitivity model, which is based on information provided by the institution, to estimate the sensitivity of NPV.
The OTS model utilizes an option-based pricing approach to estimate the sensitivity of mortgage loans. The most significant embedded option in these types of assets is the prepayment option of the borrowers. The OTS model uses various price indications and prepayment assumptions to estimate sensitivity of mortgage loans.
In the OTS model, the value of deposit accounts appears on the asset and liability side of the NPV analysis. In estimating the value of certificates of deposit accounts (“CD”), the liability portion of the CD is represented by the implied value when comparing the difference between the CD face rate and available wholesale CD rates. On the asset side of the NPV calculation, the value of the “customer relationship” due to the rollover of retail CD deposits represents an intangible asset in the NPV calculation.
Other deposit accounts such as NOW accounts, money market demand accounts, passbook accounts, and non-interest-bearing accounts also are included on the asset and liability side of the NPV calculation in the OTS model. These accounts are valued at 100% of the respective account balances on the liability side. On the asset side of the analysis, the value of the “customer relationship” of the various types of deposit accounts is reflected as a deposit intangible.
The NPV sensitivity of borrowed funds is estimated by the OTS model based on a discounted cash flow approach.
The OTS uses, as a critical point, a change of plus or minus 200 basis points in order to set its “normal” institutional results and peer comparisons. A resulting change in NPV of more than 2% of the estimated market value of its assets will require the institution to deduct from its capital 50% of that excess change. The rules provide that the OTS will calculate the IRR component quarterly for each institution. The
14
greater the change, positive or negative, in NPV, the more interest rate risk is assumed to exist with the institution. The following table lists the Bank’s latest percentage change in NPV assuming an immediate change of plus or minus 100, 200, and 300 basis points from the level of interest rates at September 30, 2010.
| Net Portfolio Value | NPV as % of PV of Assets | |||||||||||||||||||||
|
Change
In Rates
|
$ Amount | $ Change (2) | % of Change (3) |
NPV
Ratio
|
Change (5) | |||||||||||||||||
| +300 | bp | $ | 101,723 | $ | 5,969 | +6% | 12.87 | % | +101 | bp | ||||||||||||
| +200 | bp | 103,190 | 7,437 | +8% | 12.92 | % | +106 | bp | ||||||||||||||
| +100 | bp | 101,744 | 5,990 | +6% | 12.64 | % | +78 | bp | ||||||||||||||
| +50 | bp | 99,148 | 3,395 | +4% | 12.29 | % | +43 | bp | ||||||||||||||
| 0 | bp | 95,754 | 11.86 | % | ||||||||||||||||||
| -50 | bp | 92,525 | -3,229 | -3% | 11.45 | % | -41 | bp | ||||||||||||||
| -100 | bp | 90,124 | -5,630 | -6% | 11.13 | % | -73 | bp | ||||||||||||||
|
(1)
|
The -200bp and -300bp scenarios are not shown due to low interest rate environment.
|
|
(2)
|
Represents the excess (deficiency) of the estimated NPV assuming the indicated change in interest rates minus the estimated NPV assuming no change in interest rates.
|
|
(3)
|
Calculated as the amount of change in the estimated NPV divided by the estimated NPV assuming no change in interest rates.
|
|
(4)
|
Calculated as the estimated NPV divided by average total assets.
|
|
(5)
|
Calculated as the excess (deficiency) of the NPV ratio assuming the indicated change in interest rates over the estimated NPV ratio assuming no change in interest rates.
|
|
September 30,
2010
|
September 30,
2009
|
||||
|
*** RISK MEASURES: +200 BP RATE SHOCK ***
|
|||||
|
Pre-Shock NPV Ratio: NPV as % of PV of Assets
|
11.86
|
%
|
12.02
|
%
|
|
|
Exposure Measure: Post-Shock NPV Ratio
|
12.92
|
%
|
12.35
|
%
|
|
|
Sensitivity Measure: Increase in NPV Ratio
|
106
|
bp
|
33
|
bp
|
|
|
*** CALCULATION OF CAPITAL COMPONENT ***
|
|||||
|
Change in NPV as % of PV of Assets
|
0.50
|
%
|
0.11
|
%
|
As the table shows, increases in interest rates would result in net increases in the Bank’s NPV. The Bank’s NPV increases by 7.8% if interest rates increase by 200 basis points. Certain shortcomings are inherent in the methodology used in the above table. Modeling changes in NPV requires the making of certain assumptions that may tend to oversimplify the manner in which actual yields and costs respond to changes in market interest rates. First, the models assume that the composition of the Bank’s interest sensitive assets and liabilities existing at the beginning of a period remains constant over the period being measured. Second, the models assume that a particular change in interest rates is reflected uniformly across the yield curve regardless of the duration to maturity or re-pricing of specific assets and liabilities. Accordingly, although the NPV measurements do provide an indication of the Bank’s interest rate risk exposure at a particular point in time, such measurements are not intended to provide a precise forecast of the effect of changes in market interest rates on the Bank’s net interest income.
In times of increasing interest rates, the value of fixed-rate assets could decrease in value and the lag in re-pricing of interest rate sensitive assets could be expected to have a negative effect on the Bank.
Contractual Obligations
The Company has various contractual obligations related to borrowings, deposits and operating lease payments. These obligations are outlined in Notes 6, 7 and 8 in the Consolidated Financial Statements of the Company.
Critical Accounting Policies
Certain critical accounting policies affect the more significant judgments and estimates used in the preparation of the consolidated financial statements. The Company’s most critical accounting policies are as follows:
Allowance for Loan Losses - The allowance for loan losses is a valuation allowance available for losses incurred on loans. Any losses are charged to the allowance for loan losses when the loss actually occurs or when a determination is made that a loss is probable to occur. Recoveries are credited to the allowance at the time of recovery.
15
Management estimates the likely level of losses to determine whether the allowance for loan losses is adequate to absorb losses inherent in the existing portfolio. Based on the estimates, an amount is charged to or recovered from the provision for loan losses and credited or debited to the allowance for loan losses in order to adjust the allowance to a level determined to be adequate to absorb such losses.
Management’s judgment as to the level of losses on existing loans involves the consideration of current and anticipated economic conditions and their potential effects on specific borrowers; an evaluation of the existing relationships among loans, known and inherent risks in the loan portfolio, and the present level of the allowance; results of examination of the loan portfolio by regulatory agencies; and management’s internal review of the loan portfolio. In determining the collectability of certain loans, management also considers the fair value of any underlying collateral.
It should be understood that estimates of loan losses involve an exercise of judgment. During the fiscal year ending September 30, 2009, the company made changes to the allowance model. These changes included using a three year rolling average charge-off history instead of five years, switching to actual charge-off history instead of a blend with peer rates and increased the qualitative factors due to an overall negative economic environment and credit quality trends in the banks portfolio. While it is possible that in particular periods the Company may sustain losses, which are substantial relative to the allowance for loan losses, it is the judgment of management that the allowance for loan losses reflected in the consolidated balance sheets is adequate to absorb probable losses inherent in the existing loan portfolio.
Goodwill – Goodwill does not require amortization but is subject to at least an annual assessment for impairment unless interim events or circumstances make it more likely than not that an impairment loss has occurred. Impairment is defined at that amount by which the implied fair value of the goodwill is less than the goodwill’s carrying value. Impairment losses would be charged to operating expense. Goodwill is not deductible for income tax purposes. The Company’s market value based upon the last trade on the last working day of the fiscal quarter was $31.00 or $3.46 below tangible book value. The turmoil in the financial markets and stock markets in general continues to have a negative impact on the Company’s stock price which does not reflect the fundamental performance of the Company. For the quarter ended September 30, 2010, the Company recorded record earnings of $1.8 million. Management reviews various bank peer data to aid in management’s analysis of goodwill for possible impairment. Management’s judgment is that goodwill is not impaired and no adjustment is necessary.
Impact of Off-Balance Sheet Instruments
The Company has certain off-balance-sheet instruments in the form of contractual commitments to extend credit to customers. These legally binding commitments have set expiration dates and are at predetermined interest rates. The underwriting criteria for these commitments are the same as for loans in our loan portfolio. Collateral is also obtained, if necessary, based on the credit evaluation of each borrower. Although many of the commitments will expire unused, management believes that we have the necessary resources to fund these commitments. (See Note 16 in the accompanying Consolidated Financial Statements.)
16
MANAGEMENT’S REPORT ON INTERNAL CONTROL
OVER FINANCIAL REPORTING
Management is responsible for establishing and maintaining adequate internal control over financial reporting, as such term is defined in Exchange Act Rule 13a- 15(f). The Company’s internal control over financial reporting includes those policies and procedures that (i) pertain to the maintenance of records that, in reasonable detail, accurately and fairly reflect the transactions and dispositions of the assets of the Company; (ii) provide reasonable assurance that transactions are recorded as necessary to permit preparation of financial statements in accordance with generally accepted accounting principles, and that receipts and expenditures of the Company are being made only in accordance with authorization of management and directors of the Company; and (iii) provide reasonable assurance regarding prevention or timely detection of unauthorized acquisition, use, or disposition of the Company’s assets that could have a material effect on the financial statements.
Internal control over financial reporting is designed to provide reasonable assurance regarding the reliability of financial reporting and the preparation of financial statements prepared for external purposes in accordance with generally accepted accounting principles. Because of inherent limitations, internal control over financial reporting may not prevent or detect misstatements. Also, projections of any evaluation of effectiveness to future periods are subject to the risk that controls may become inadequate because of changes in conditions, or that the degree of compliance with the policies and procedures may deteriorate.
Under supervision and with the participation of management, including our principal executive officer and principal financial officer, we conducted an evaluation of the effectiveness of our internal control over financial reporting based on the framework in Internal Control- Integrated Framework issued by the Committee of Sponsoring Organizations of the Treadway Commission. Based on our evaluation under the framework in Internal Control- Integrated Framework, management concluded that our internal control over financial reporting was effective as of September 30, 2010.
This annual report does not include an attestation report of the Company’s registered public accounting firm regarding internal control over financial reporting. Management’s report was not subject to attestation by the Company’s registered public accounting firm pursuant to rules of the Securities and Exchange Commission that permit the Company to provide only management’s report in this annual report.
 |
 |
|
|
Patrick Little
President and Chief Executive Officer
|
J. L. Chauvin
Senior Vice President and Chief Financial Officer
|
17
Report of Independent Registered Public Accounting Firm
To the Board of Directors and Stockholders
Teche Holding Company
Franklin, Louisiana
We have audited the accompanying consolidated balance sheets of Teche Holding Company and subsidiary (hereinafter referred to as the “Company”) as of September 30, 2010 and 2009, and the related consolidated statements of income, stockholders’ equity and cash flows for each of the years in the three-year period ended September 30, 2010. These consolidated financial statements are the responsibility of the Company’s management. Our responsibility is to express an opinion on these consolidated financial statements based on our audits.
We conducted our audits in accordance with the standards of the Public Company Accounting Oversight Board (United States). Those standards require that we plan and perform the audit to obtain reasonable assurance about whether the financial statements are free of material misstatement. We were not engaged to perform an audit of the Company’s internal control over financial reporting. Our audit included consideration of internal control over financial reporting as a basis for designing audit procedures that are appropriate in the circumstances, but not for the purpose of expressing an opinion on the effectiveness of the Company’s internal control over financial reporting. Accordingly, we express no such opinion. An audit includes examining, on a test basis, evidence supporting the amounts and disclosures in the financial statements. An audit also includes assessing the accounting principles used and significant estimates made by management, as well as evaluating the overall financial statement presentation. We believe that our audits provide a reasonable basis for our opinion.
In our opinion, the consolidated financial statements referred to above present fairly, in all material respects, the financial position of Teche Holding Company and subsidiary as of September 30, 2010 and 2009, and the results of their operations and their cash flows for each of the years in the three-year period ended September 30, 2010, in conformity with accounting principles generally accepted in the United States of America.

Atlanta, Georgia
December 17, 2010

18
TECHE HOLDING COMPANY AND SUBSIDIARY
CONSOLIDATED BALANCE SHEETS
September 30, 2010 and 2009
|
2010
|
2009
|
|||||||
|
ASSETS
|
(Amounts in thousands,
|
|||||||
|
Except share and per share data)
|
||||||||
|
Cash and due from banks
|
$ | 15,420 | $ | 13,958 | ||||
|
Interest-bearing deposits
|
25,235 | 9,717 | ||||||
|
Securities available-for-sale - at estimated fair value
|
||||||||
|
(amortized cost of $ 14,307 in 2010 and $20,277 in 2009)
|
14,996 | 20,936 | ||||||
|
Securities held-to-maturity—at amortized cost (estimated fair
|
||||||||
|
value of $61,711 in 2010 and $76,887 in 2009)
|
59,566 | 75,384 | ||||||
|
Loans receivable—net of allowance for loan losses of
|
||||||||
|
$9,256 in 2010 and $6,806 in 2009
|
586,635 | 588,527 | ||||||
|
Accrued interest receivable
|
2,480 | 2,622 | ||||||
|
Investment in Federal Home Loan Bank stock, at cost
|
5,402 | 5,063 | ||||||
|
Real estate owned, net
|
1,181 | 1,953 | ||||||
|
Prepaid expenses and other assets
|
6,898 | 3,321 | ||||||
|
Goodwill
|
3,647 | 3,647 | ||||||
|
Life insurance contracts
|
13,310 | 12,724 | ||||||
|
Premises and equipment, net
|
26,754 | 27,219 | ||||||
|
TOTAL ASSETS
|
$ | 761,524 | $ | 765,071 | ||||
|
LIABILITIES AND STOCKHOLDERS’ EQUITY
|
||||||||
|
Deposits
|
579,355 | $ | 585,469 | |||||
|
Advances from Federal Home Loan Bank
|
100,017 | 100,628 | ||||||
|
Advance payments by borrowers for taxes and insurance
|
2,463 | 2,433 | ||||||
|
Accrued interest payable
|
429 | 743 | ||||||
|
Accounts payable and other liabilities
|
3,747 | 4,313 | ||||||
|
TOTAL LIABILITIES
|
686,011 | 693,586 | ||||||
|
COMMITMENTS AND CONTINGENCIES
|
||||||||
|
STOCKHOLDERS’ EQUITY:
|
||||||||
|
Preferred stock, 5,000,000 shares authorized, none issued
|
— | — | ||||||
|
Common stock, $.01 par value, 10,000,000 shares authorized;
|
||||||||
|
4,672,567 and 4,666,950 shares issued
|
47 | 47 | ||||||
|
Additional paid-in capital
|
52,685 | 52,285 | ||||||
|
Retained earnings
|
73,942 | 69,786 | ||||||
|
Unearned compensation
|
(326 | ) | (586 | ) | ||||
|
Treasury stock 2,591,081 and 2,570,296 shares - at cost
|
(50,862 | ) | (50,234 | ) | ||||
|
Accumulated other comprehensive loss on held-to-maturity
|
||||||||
|
securities
|
(428 | ) | (247 | ) | ||||
|
Accumulated other comprehensive income on available for sale
|
||||||||
|
Securities
|
455 | 434 | ||||||
|
TOTAL STOCKHOLDERS’ EQUITY
|
75,513 | 71,485 | ||||||
|
TOTAL LIABILITIES AND STOCKHOLDERS’ EQUITY
|
$ | 761,524 | $ | 765,071 | ||||
See notes to consolidated financial statements
19
TECHE HOLDING COMPANY AND SUBSIDIARY
CONSOLIDATED STATEMENTS OF INCOME
Years Ended September 30, 2010, 2009 and 2008
|
2010
|
2009
|
2008
|
||||||||||
|
(Amounts in thousands, except per share amounts)
|
||||||||||||
|
INTEREST INCOME:
|
||||||||||||
|
Interest and fees on loans
|
$ | 38,406 | $ | 40,190 | $ | 41,280 | ||||||
|
Interest and dividends on securities
|
2,662 | 3,848 | 3,873 | |||||||||
|
Other interest income
|
268 | 199 | 480 | |||||||||
|
TOTAL INTEREST INCOME
|
41,336 | 44,237 | 45,633 | |||||||||
|
INTEREST EXPENSE:
|
||||||||||||
|
Deposits
|
7,161 | 10,524 | 15,285 | |||||||||
|
Advances from Federal Home Loan Bank
|
4,543 | 4,773 | 4,448 | |||||||||
|
TOTAL INTEREST EXPENSE
|
11,704 | 15,297 | 19,733 | |||||||||
|
NET INTEREST INCOME
|
29,632 | 28,940 | 25,900 | |||||||||
|
PROVISION FOR LOAN LOSSES
|
3,896 | 3,026 | 825 | |||||||||
|
NET INTEREST INCOME AFTER
|
||||||||||||
|
PROVISION FOR LOAN LOSSES
|
25,736 | 25,914 | 25,075 | |||||||||
|
NON-INTEREST INCOME:
|
||||||||||||
|
Total other-than temporary impairment losses
|
(451 | ) | (1,311 | ) | (408 | ) | ||||||
|
Portion of impairment losses recognized in other
|
||||||||||||
|
comprehensive loss
|
274 | 375 | -- | |||||||||
|
Net impairment losses recognized in earnings
|
(177 | ) | (936 | ) | (408 | ) | ||||||
|
Service charges and other
|
15,227 | 15,415 | 15,482 | |||||||||
|
Gain on sale of premises and equipment
|
— | 10 | 1 | |||||||||
|
Gain (Loss) on sale and impairments of equity securities
|
37 | (99 | ) | (2,580 | ) | |||||||
|
Gain (Loss) on sale of loans
|
13 | 559 | (172 | ) | ||||||||
|
Other income
|
860 | 903 | 1,098 | |||||||||
|
TOTAL NON-INTEREST INCOME
|
15,960 | 15,852 | 13,421 | |||||||||
|
NON-INTEREST EXPENSE:
|
||||||||||||
|
Compensation and employee benefits
|
16,414 | 16,418 | 16,746 | |||||||||
|
Occupancy, equipment and data processing expense
|
6,329 | 6,244 | 6,084 | |||||||||
|
Marketing and professional fees
|
2,558 | 2,743 | 2,986 | |||||||||
|
Deposit insurance premiums
|
1,081 | 1,082 | 74 | |||||||||
|
Louisiana shares tax
|
513 | 567 | 666 | |||||||||
|
Other operating expenses
|
4,334 | 4,318 | 4,184 | |||||||||
|
TOTAL NON-INTEREST EXPENSE
|
31,229 | 31,372 | 30,740 | |||||||||
|
INCOME BEFORE INCOME TAXES
|
10,467 | 10,394 | 7,756 | |||||||||
|
INCOME TAXES
|
3,366 | 3,258 | 2,047 | |||||||||
|
NET INCOME
|
$ | 7,101 | $ | 7,136 | $ | 5,709 | ||||||
|
BASIC INCOME PER COMMON SHARE
|
$ | 3.40 | $ | 3.38 | $ | 2.65 | ||||||
|
DILUTED INCOME PER COMMON SHARE
|
$ | 3.37 | $ | 3.36 | $ | 2.63 | ||||||
|
DIVIDENDS PER SHARE
|
$ | 1.42 | $ | 1.41 | $ | 1.37 | ||||||
See notes to consolidated financial statements.
20
TECHE HOLDING COMPANY AND SUBSIDIARY
CONSOLIDATED STATEMENTS OF STOCKHOLDERS’ EQUITY
Years Ended September 30, 2010, 2009 and 2008
|
Accumulated
|
||||||||||||||||||||||||||||
|
Additional
|
|
other
|
||||||||||||||||||||||||||
|
Common
|
paid-in
|
Retained
|
Unearned
|
Treasury
|
comprehensive
|
|||||||||||||||||||||||
|
stock
|
capital
|
earnings
|
(compensation)
|
Stock
|
loss
|
Total
|
||||||||||||||||||||||
|
(Dollars in thousands, except per share amounts
|
||||||||||||||||||||||||||||
|
BALANCE - October 1, 2007
|
$ | 46 | $ | 51,366 | $ | 62,646 | $ | — | $ | (46,049 | ) | $ | (1,003 | ) | $ | 67,006 | ||||||||||||
|
Exercise of stock options, including tax benefit
|
1 | 256 | — | — | — | — | 257 | |||||||||||||||||||||
|
Stock based compensation
|
— | 351 | — | — | — | — | 351 | |||||||||||||||||||||
|
Cumulative effect adjustment
|
— | — | 208 | — | — | — | 208 | |||||||||||||||||||||
|
Purchase of common stock for treasury
|
— | — | — | — | (3,264 | ) | — | (3,264 | ) | |||||||||||||||||||
|
Dividends declared - $1.37 per share
|
— | — | (2,963 | ) | — | — | — | (2,963 | ) | |||||||||||||||||||
|
Comprehensive income:
|
||||||||||||||||||||||||||||
|
Net income
|
— | — | 5,709 | — | — | — | 5,709 | |||||||||||||||||||||
|
Change in unrealized loss on securities available-for-sale, net
|
740 | 740 | ||||||||||||||||||||||||||
|
Total comprehensive income
|
6,449 | |||||||||||||||||||||||||||
|
BALANCE - September 30, 2008
|
47 | 51,973 | 65,600 | — | (49,313 | ) | (263 | ) | 68,044 | |||||||||||||||||||
|
Unearned ESOP compensation
|
— | — | — | (586 | ) | — | — | (586 | ) | |||||||||||||||||||
|
Exercise of stock options, including tax benefit
|
— | 14 | — | — | — | — | 14 | |||||||||||||||||||||
|
Tax effect of restricted stock vesting
|
— | (28 | ) | — | — | — | — | (28 | ) | |||||||||||||||||||
|
Stock based compensation
|
— | 326 | — | — | — | — | 326 | |||||||||||||||||||||
|
Purchase of common stock for treasury
|
— | — | — | — | (921 | ) | — | (921 | ) | |||||||||||||||||||
|
Dividends declared - $1.41 per share
|
— | — | (2,950 | ) | — | — | — | (2,950 | ) | |||||||||||||||||||
|
Comprehensive income:
|
||||||||||||||||||||||||||||
|
Net income
|
— | — | 7,136 | — | — | — | 7,136 | |||||||||||||||||||||
|
Accumulated other comprehensive income, net (Note 12)
|
450 | 450 | ||||||||||||||||||||||||||
|
Total comprehensive income
|
7,586 | |||||||||||||||||||||||||||
|
BALANCE - September 30, 2009
|
$ | 47 | $ | 52,285 | $ | 69,786 | $ | (586 | ) | $ | (50,234 | ) | $ | 187 | $ | 71,485 | ||||||||||||
|
Unearned ESOP compensation
|
— | 20 | — | 260 | — | — | 280 | |||||||||||||||||||||
|
Exercise of stock options, including tax benefit
|
— | 29 | — | — | — | — | 29 | |||||||||||||||||||||
|
Tax effect of restricted stock vesting
|
— | (53 | ) | — | — | — | — | (53 | ) | |||||||||||||||||||
|
Stock based compensation
|
— | 404 | — | — | — | — | 404 | |||||||||||||||||||||
|
Purchase of common stock for treasury
|
— | — | — | — | (628 | ) | — | (628 | ) | |||||||||||||||||||
|
Dividends declared - $1.42 per share
|
— | — | (2,945 | ) | — | — | — | (2,945 | ) | |||||||||||||||||||
|
Comprehensive income:
|
||||||||||||||||||||||||||||
|
Net income
|
— | — | 7,101 | — | — | — | 7,101 | |||||||||||||||||||||
|
Accumulated other comprehensive income, net (Note 12)
|
(160 | ) | (160 | ) | ||||||||||||||||||||||||
|
Total comprehensive income
|
6,941 | |||||||||||||||||||||||||||
|
BALANCE - September 30, 2010
|
$ | 47 | $ | 52,685 | $ | 73,942 | $ | (326 | ) | $ | (50,862 | ) | $ | 27 | $ | 75,513 | ||||||||||||
See notes to consolidated financial statements.
21
TECHE HOLDING COMPANY AND SUBSIDIARY
NOTES TO CONSOLIDATED STATEMENTS OF CASH FLOWS
Years Ended September 30, 2010, 2009 and 2008
(in thousands except share and per share data)
| 2010 | 2009 | 2008 | ||||||||||
| (Dollars in thousands) | ||||||||||||
|
CASH FLOWS FROM OPERATING ACTIVITIES:
|
||||||||||||
|
Net income
|
$ | 7,101 | $ | 7,136 | $ | 5,709 | ||||||
|
Adjustments to reconcile net income
|
||||||||||||
|
to net cash provided by operating activities:
|
||||||||||||
|
(Accretion of discount) amortization of premium
|
||||||||||||
|
on investments and mortgage-backed securities
|
(213 | ) | (295 | ) | 37 | |||||||
|
Provision for loan losses
|
3,896 | 3,026 | 825 | |||||||||
|
Provision for loss on real estate owned
|
198 | 221 | 54 | |||||||||
|
Stock-based compensation
|
404 | 326 | 351 | |||||||||
|
Deferred income tax (benefit) expense
|
(1,182 | ) | (925 | ) | 58 | |||||||
|
(Gain) Loss on sale of loans
|
(13 | ) | (559 | ) | 172 | |||||||
|
Loss on sale and impairment of equity securities
|
(37 | ) | 99 | 2,580 | ||||||||
|
Gains on sale of premises and equipment
|
— | (10 | ) | (1 | ) | |||||||
|
Loss on sale of real estate owned
|
103 | 16 | 38 | |||||||||
|
Impairment of securities
|
177 | 936 | 408 | |||||||||
|
Depreciation
|
1,560 | 1,536 | 1,533 | |||||||||
|
Increase in bank owned life insurance
|
(586 | ) | (597 | ) | (635 | ) | ||||||
|
Amortization of intangible assets
|
28 | 41 | 54 | |||||||||
|
Change in prepaid expenses and other assets
|
(2,427 | ) | 308 | (1,379 | ) | |||||||
|
Decrease in accrued interest receivable
|
142 | 349 | 109 | |||||||||
|
Change in accounts payable and other liabilities
|
(566 | ) | 725 | 410 | ||||||||
|
Decrease in accrued interest payable
|
(314 | ) | (132 | ) | (566 | ) | ||||||
|
Other, net
|
(138 | ) | 775 | (287 | ) | |||||||
|
NET CASH PROVIDED BY OPERATING ACTIVITIES
|
8,133 | 12,976 | 9,470 | |||||||||
|
CASH FLOWS FROM INVESTING ACTIVITIES:
|
||||||||||||
|
Proceeds from sales of investment securities
|
||||||||||||
|
available-for-sale
|
577 | 201 | 2,357 | |||||||||
|
Purchase of securities available-for-sale
|
(178 | ) | (12 | ) | (499 | ) | ||||||
|
Principal repayments on securities available-for-sale
|
5,517 | 6,299 | 10,311 | |||||||||
|
Purchase of securities held-to-maturity
|
(18,120 | ) | (33,954 | ) | (18,374 | ) | ||||||
|
Principal repayments on securities held-to-maturity
|
34,036 | 11,855 | 6,743 | |||||||||
|
Net loan originations
|
(4,255 | ) | (33,056 | ) | (62,811 | ) | ||||||
|
Purchase of loans
|
(1,358 | ) | (4,684 | ) | (3,474 | ) | ||||||
|
Proceeds from sales of loans
|
1,536 | 28,654 | 42,952 | |||||||||
|
Investment in FHLB stock, net
|
(339 | ) | (299 | ) | (421 | ) | ||||||
|
Purchase of premises and equipment
|
(1,094 | ) | (1,855 | ) | (2,287 | ) | ||||||
|
Proceeds from sale of premises and equipment
|
— | 10 | 1 | |||||||||
|
Proceeds from sale of real estate owned
|
2,557 | 350 | 855 | |||||||||
|
NET CASH PROVIDED (USED) IN
|
||||||||||||
|
INVESTING ACTIVITIES
|
18,879 | (26,491 | ) | (24,647 | ) | |||||||
See notes to consolidated financial statements.
22
TECHE HOLDING COMPANY AND SUBSIDIARY
CONSOLIDATED STATEMENTS OF CASH FLOWS
Years Ended September 30, 2010, 2009 and 2008
|
2010
|
2009
|
2008
|
||||||||||
|
(Dollars in thousands)
|
||||||||||||
|
CASH FLOWS FROM FINANCING ACTIVITIES:
|
||||||||||||
|
Dividends paid
|
$ | (2,945 | ) | $ | (2,950 | ) | $ | (2,963 | ) | |||
|
Repayment (loan to) ESOP
|
260 | (586 | ) | - | ||||||||
|
Net increase (decrease) in deposits
|
(6,114 | ) | (3,759 | ) | 33,659 | |||||||
|
Proceeds of long-term FHLB advances
|
10,000 | 5,000 | 43,000 | |||||||||
|
Repayment of long-term FHLB advances
|
(10,611 | ) | (9,249 | ) | (5,379 | ) | ||||||
|
Net increase (decrease) in short-term FHLB advances
|
- | - | (22,500 | ) | ||||||||
|
Cash paid for purchase of common stock for treasury
|
(628 | ) | (921 | ) | (3,264 | ) | ||||||
|
Proceeds from exercise of stock options
|
29 | 14 | 107 | |||||||||
|
Excess tax benefit (expense)from share-based payment
|
||||||||||||
|
arrangements
|
(53 | ) | (28 | ) | 150 | |||||||
|
Change in advance payments by
|
||||||||||||
|
borrowers for taxes and insurance
|
30 | (443 | ) | 668 | ||||||||
|
NET CASH (USED) PROVIDED
|
||||||||||||
|
BY FINANCING ACTIVITIES
|
(10,032 | ) | (12,922 | ) | 43,478 | |||||||
|
NET INCREASE (DECREASE) IN
|
||||||||||||
|
CASH AND CASH EQUIVALENTS
|
16,980 | (26,437 | ) | 28,301 | ||||||||
|
CASH AND CASH EQUIVALENTS
|
||||||||||||
|
Beginning of year
|
23,675 | 50,112 | 21,811 | |||||||||
|
CASH AND CASH EQUIVALENTS
|
||||||||||||
|
End of year
|
$ | 40,655 | $ | 23,675 | $ | 50,112 | ||||||
|
SUPPLEMENTAL DISCLOSURE OF CASH
|
||||||||||||
|
FLOW INFORMATION
|
||||||||||||
|
Cash paid for interest
|
$ | 12,018 | $ | 15,429 | $ | 20,299 | ||||||
|
Cash paid for taxes
|
$ | 4,600 | $ | 3,800 | $ | 2,675 | ||||||
|
SUPPLEMENTAL SCHEDULE OF NON-CASH
|
||||||||||||
|
INVESTING ACTIVITIES:
|
||||||||||||
|
Accumulated other comprehensive income,
|
$ | 160 | $ | 450 | $ | 740 | ||||||
|
net of income taxes
|
||||||||||||
|
Transfer from loans to real estate owned
|
$ | 3,572 | $ | 2,212 | $ | 727 | ||||||
|
Loans originated to sell real estate owned
|
$ | 1,486 | $ | 15 | $ | 620 | ||||||
|
Investment securities received from Ultra Short AMF
|
||||||||||||
|
Fund Redemption
|
$ | - | $ | - | $ | 11,193 | ||||||
|
Cumulative effect adjustment (Note 1)
|
$ | - | $ | - | $ | 208 | ||||||
See notes to consolidated financial statements.
23
TECHE HOLDING COMPANY AND SUBSIDIARY
NOTES TO CONSOLIDATED FINANCIAL STATEMENTS
Years Ended September 30, 2010, 2009, and 2008
(in thousands except share and per share data)
|
1.
|
SUMMARY OF SIGNIFICANT ACCOUNTING POLICIES
|
The significant accounting policies of the Company are described below.
Principles of Consolidation - The consolidated financial statements include the accounts of Teche Holding Company and its wholly-owned subsidiary, Teche Federal Bank (collectively “the Company”). All significant intercompany balances and transactions have been eliminated in consolidation. The Company operates principally in the community savings bank segment by attracting deposits from the general public and using such deposits primarily to originate loans. These loans include those secured by first mortgages on owner-occupied, family residences as well as home improvement and other consumer loans. The Company also makes commercial mortgage loans.
Concentrations of Credit Risk – The Company makes loans to individuals and small businesses located primarily in southern Louisiana for various personal and commercial purposes. The Company has a diversified loan portfolio and the borrowers’ ability to repay their loans is not directly dependent upon any specific economic sector. The Company will from time to time purchase loans from outside the market area.
Use of Estimates - The preparation of financial statements in conformity with accounting principles generally accepted in the United States of America “GAAP” requires management to make estimates and assumptions that affect the reported amounts of assets and liabilities and disclosure of contingent assets and liabilities at the date of the financial statements and the reported amounts of revenues and expenses during the reporting period. Actual results could differ from those estimates.
Cash and Cash Equivalents - Cash and cash equivalents comprise cash on hand and non-interest bearing and interest bearing demand deposits with other financial institutions. The Company is required to maintain certain cash reserves relating to its deposit liabilities.
Securities - Securities are classified as held-to-maturity or available-for-sale. Management determines the classification of securities when they are purchased and reevaluates this classification periodically as conditions change that could require reclassification.
Securities which the Company both positively intends and has the ability to hold to maturity are classified as securities held-to-maturity and are carried at amortized cost. Intent and ability to hold are not considered satisfied when a security is available to be sold in response to changes in interest rates, prepayment rates, liquidity needs or other reasons as part of an overall asset/liability management strategy.
Securities not meeting the criteria to be classified as securities held-to-maturity are classified as available-for-sale and are carried at fair value. Net unrealized holding gains or losses are excluded from net income and are recognized, net of income taxes, in other comprehensive income and in accumulated other comprehensive income, a separate component of stockholders’ equity.
Premiums and discounts on securities, both those held-to-maturity and those available-for-sale, are amortized and accreted to income as an adjustment to the securities’ yields using the interest method. Realized gains and losses on securities, including declines in value judged to be other than temporary, are reported as a component of income. The cost of securities sold is specifically identified for use in calculating realized gains and losses.
24
TECHE HOLDING COMPANY AND SUBSIDIARY
NOTES TO CONSOLIDATED FINANCIAL STATEMENTS
Years Ended September 30, 2010, 2009, and 2008
(in thousands except share and per share data)
If the fair value of a debt security is below its amortized cost basis at the quarter end, the security is evaluated for other-than-temporary impairment (OTTI). For debt securities, the Company considers its intention to sell the security. If the Company does not intend on selling the security, then it is evaluated whether it is more likely than not it will be required to sell the security before recovery of the amortized cost. If the Company fails either of those tests, then the Company records OTTI for the affected security equal to the difference between the fair value and amortized cost.
If it is not more likely than not that the Company be required to sell a debt security, then it goes to the next step to determine if OTTI exists. In determining if OTTI exists, management considers: (1) the length of time and the extent to which the fair value has been less than cost, (2) adverse conditions related to the security, industry or geographic area, (3) the financial condition and near-term prospects of the issuer, (4) failure of the issuer to make scheduled interest or principal payments and the outlook for receiving the contractual cash flows of the investments, (5) changes in the rating of the security (for purposes of the evaluation, a drop in the rating below AA is considered adverse) and (6) historical and subsequent volatility of fair value of the security. If these conditions provide an indication of a reduction in expected cash flows, then cash flows are evaluated to determine the amount of credit related impairment equal to the present value of cash flows not expected to be received. If OTTI has been identified, the credit related impairment, to the extent it does not reduce the security below fair value, is charged to earnings and the non-credit-related impairment is adjusted through other comprehensive income for both held to maturity and available-for-sale securities.
For marketable equity securities, the Company evaluates its ability to retain its investment in the issuer for a period of time sufficient to allow for any anticipated recovery in fair value. Evidence considered to determine anticipated recovery are analysts reports on the issuer and the financial condition of the issuer or the industry. If OTTI is identified, the security is adjusted to fair value through a charge to earnings.
During the years ended September 30, 2009 and 2010, the Company recognized non-credit impairment charges in other comprehensive loss related to certain held-to-maturity securities. The cumulative amount of these charges created a separate accumulated other comprehensive loss for held to maturity securities. This accumulated other comprehensive loss will be accreted to other comprehensive income over the remaining life of the security in a prospective manner on the basis of the amount and timing of future estimated cash flows. See Note 3 for further discussion of OTTI on investment securities, and Note 12 for more information on impairment losses recognized in Other Comprehensive Income (Loss).
Loans Receivable - Loans receivable are stated at the unpaid principal balances, less the allowance for loan losses, net deferred loan fees, and unearned premiums and discounts. The unearned premiums and discounts relate principally to purchased loans. Interest on loans is credited to income based on the principal amount outstanding using the interest method.
When doubt exists as to collectability of a loan (typically 90 days delinquent or impaired), the loan is placed on non-accrual status. When a loan is placed on non-accrual status, interest accrued prior to the judgment of uncollectibility is reversed from income. Loans are returned to an accruing status only as payments are received and when collection of all principal and interest is no longer in doubt, usually after 6 months of satisfactory performance. Payments received on such non-accrual loans are applied first to recovery of lost interest and next to outstanding loan amounts.
The Company considers a loan to be impaired when, based upon current information and events, it believes it is probable that the Company will be unable to collect all amounts due according to the
25
TECHE HOLDING COMPANY AND SUBSIDIARY
NOTES TO CONSOLIDATED FINANCIAL STATEMENTS
Years Ended September 30, 2010, 2009, and 2008
(in thousands except share and per share data)
contractual terms of the loan agreement. The Company’s impaired loans include troubled debt restructurings and non-homogeneous loans in which full payment of all scheduled amounts due is not expected. The Company calculates a reserve required for impaired loans based on the present value of expected future cash flows discounted at the loan’s effective interest rate, the loan’s observable market price or the fair value of its collateral if the loan is collateral dependent.
Allowance for Loan Losses - The allowance for loan losses is a valuation allowance available for losses incurred on loans. Any losses are charged to the allowance for loan losses when the loss is confirmed. Recoveries are credited to the allowance at the time of recovery.
Management estimates the level of losses that is adequate to absorb probable losses inherent in the existing portfolio. Based on these estimates, an amount is charged to or recovered from the provision for loan losses and credited or debited to the allowance for loan losses in order to adjust the allowance to a level determined to be adequate to absorb such losses.
Management’s judgment as to the level of losses on existing loans involves the consideration of current economic conditions and their potential effects on specific borrowers; an evaluation of the existing relationships among loans, known and inherent risks in the loan portfolio, and the present level of the allowance; results of examination of the loan portfolio by regulatory agencies; and management’s internal review of the loan portfolio. In determining the collectability of certain loans, management also considers the fair value of any underlying collateral.
It should be understood that estimates of loan losses involve an exercise of judgment. While it is possible that in particular periods the Company may sustain losses which are substantially different from the allowance for loan losses, it is the judgment of management that the allowance for loan losses reflected in the consolidated balance sheets is adequate to absorb probable losses inherent in the loan portfolio.
Loan Fees, Loan Costs, Discounts and Premiums - Loan origination fees, certain direct loan origination costs and discounts and premiums on loans are deferred and amortized as an adjustment to the related loan’s yield using the interest method over the contractual life of the loan.
Federal Home Loan Bank Stock - Federal Home Loan Bank (FHLB) stock is recorded at cost and is periodically reviewed for impairment. The Company owns stock in the FHLB of Dallas in order to gain access to cost effective funding and liquidity sources. The Company considers the capital position of the FHLB of Dallas as well as recent redemptions of the common stock when considering whether or not the investment is impaired. As of September 30, 2010, the FHLB of Dallas was in compliance with its regulatory capital requirements, and was still redeeming excess activity-based common stock, therefore the Company concluded that the investment was not impaired. The FHLB received a rating of Aaa which reflects its consistent risk-adjusted earnings, superior asset quality, and unique position as a key funding source to its member institutions, as well as the substantial support of the U.S. Government.
No ready market exists for the FHLB stock. It has no quoted market value and is carried at cost. Cost approximates fair market value based upon the redemption policies and practices of the FHLB, which provide redemption at par.
Goodwill - Goodwill does not require amortization but is subject to at least an annual assessment for impairment, unless interim events or circumstances make it more likely than not that an impairment loss has occurred. Impairment is defined as that amount by which the implied fair value of the goodwill is less
26
TECHE HOLDING COMPANY AND SUBSIDIARY
NOTES TO CONSOLIDATED FINANCIAL STATEMENTS
Years Ended September 30, 2010, 2009, and 2008
(in thousands except share and per share data)
than the goodwill’s carrying value. Impairment losses would be charged to operating expense. The existing goodwill is not deductible for income tax purposes. For the purposes of evaluating goodwill, the Company has determined that it operates only one reporting unit. The Company has performed its annual test as of September 30, 2010 for goodwill and has determined that goodwill is not impaired.
Core Deposit Intangible - The core deposit intangible with a cost of $520 and accumulated amortization of $480 and $452 at September 30, 2010 and 2009, respectively, is included in prepaid expenses and other assets on the consolidated balance sheets.
Premises and Equipment - Land is carried at cost. Buildings and equipment are carried at cost less accumulated depreciation. The Company computes depreciation generally on the straight-line method for financial reporting. The estimated useful lives used to compute depreciation are: buildings and improvements, twenty to forty years; and furniture, fixtures and equipment, three to ten years.
Real Estate Owned - Real estate acquired through, or in lieu of, foreclosure is initially recorded at the fair value at the time of foreclosure, less estimated selling costs, and any related write-down is charged to the allowance for loan losses. Valuations are periodically performed by management and provisions for estimated losses on real estate owned are charged to income when fair value is determined to be less than the carrying value. Costs relative to the development and improvement of properties are capitalized to the extent realizable, whereas, ordinary upkeep disbursements are charged to expense. The ability of the Company to recover the carrying value of real estate is based upon future sales of the real estate owned. The ability to affect such sales is subject to market conditions and other factors, many of which are beyond the Company’s control. Operating income of such properties, net of related expenses, and gains and losses on their disposition are included in the accompanying consolidated statements of income.
Life Insurance Contracts - Life insurance contracts represent single premium life insurance contracts on the lives of certain officers of the Company. The Company is the beneficiary of these policies. These contracts are reported at their cash surrender value and changes in the cash surrender value are included in other non-interest income.
Defined Benefit Plan - The expense of the multi-employer defined benefit plans in which the Company participates equals the amount of contributions required by the Company. In June 2008, the Company settled and transferred the obligations of its defined benefit plans to Hartford Insurance Co., resulting in a pre-tax charge of approximately $1,500.
Income Taxes - The Company follows the practice of filing a consolidated federal return. Income taxes are allocated to each company as if filed separately for federal purposes.
Certain items of income and expense for financial reporting are recognized differently for income tax purposes (principally the provision for loan losses and depreciation). Provisions for deferred taxes are made in recognition of such temporary differences using the liability method. Current income taxes are recorded based on amounts due with the current income tax returns. The need for a valuation allowance is considered when it is determined more likely than not that a deferred tax asset will not be realized.
The Company accounts for penalties and interest related to income tax liabilities as a component of other expense. The Company and its subsidiaries’ tax filings for the years ended September 30, 2006 through 2009 are currently open to audit under statutes of limitation by the Internal Revenue Service.
27
TECHE HOLDING COMPANY AND SUBSIDIARY
NOTES TO CONSOLIDATED FINANCIAL STATEMENTS
Years Ended September 30, 2010, 2009, and 2008
(in thousands except share and per share data)
Income Per Share - Basic net income per common share (EPS) is computed by dividing net income by the weighted-average number of common shares outstanding for the period. Shares controlled by the ESOP are not considered in the weighted average shares outstanding until the shares are committed for allocation to an employee’s individual account. Diluted EPS reflects the potential dilution that could occur if securities or other contracts to issue common stock were exercised or converted into common stock or resulted in the issuance of common stock that then shared in the net income of the Company. Diluted EPS is computed by dividing net income by the total of the weighted-average number of shares outstanding plus the effect of outstanding options and stock grants. The dilution effect of stock options and stock grants is determined using the treasury stock method. The effect of any anti-dilutive common stock equivalents is excluded from the diluted EPS computation.
Comprehensive Income - Comprehensive income includes net income and other comprehensive income or loss, which in the case of the Company includes only unrealized gains and losses on securities, net of related income taxes.
Stock-Based Compensation - The Company recognizes the cost of employee services received in exchange for an award of equity instruments in the financial statements over the period the employee is required to perform the services in exchange for the award (presumptively the vesting period). It also requires measurement of the cost of employee services received in exchange for an award based on the grant date fair value of the award. Excess tax benefits are reported as financing cash inflows, rather than as a reduction of taxes paid, which is included within operating cash flows.
New Accounting Pronouncements
ASC (860) Accounting for Transfers and Servicing of Financial Assets and Extinguishments of Liabilities, will require more information about transfers of financial assets, including securitization transactions, and where companies have continuing exposure to the risks related to transferred financial assets. This guidance also eliminates the concept of a qualifying special-purpose entity, and changes the requirements for derecognizing financial assets and requires additional disclosures.
ASC (860) will be adopted by the Company on October 1, 2010. Earlier application is prohibited. The recognition and measurement provisions shall be applied to transfers that occur on or after the effective date. The Company does not expect adoption of this standard to have a material impact on the consolidated financial statements.
ASU-Accounting Standards Update (2010-06) Fair Value Measurements and Disclosures (Topic 820): Improving Disclosures about Fair Value Measurements (Jan 2010). This update provides amendments to Topic 820 that will provide more robust disclosures about (1) the different classes of assets and liabilities measured at fair value, (2) the valuation techniques and inputs used, (3) the activity in Level 3 fair value measurements, and (4) the transfers between Levels 1, 2, and 3. The update is effective for interim and annual reporting periods beginning after December 15, 2009 except for the disclosures about purchases, sales, issuances, and settlements in the roll forward of activity in Level 3 fair value measurements. Those disclosures are effective for fiscal years beginning after December 15, 2010, and for interim periods within those fiscal years. The Company adopted the fair value disclosures guidance on January 1, 2010, except for the gross presentation of the Level 3 roll forward information which is not
28
TECHE HOLDING COMPANY AND SUBSIDIARY
NOTES TO CONSOLIDATED FINANCIAL STATEMENTS
Years Ended September 30, 2010, 2009, and 2008
(in thousands except share and per share data)
required to be adopted by the Company until January 1, 2011. The adoption requires additional disclosure.
The amendments in the ASU are effective for each reporting entity at the beginning of its first fiscal quarter beginning after June 15, 2010. Early adoption is permitted at the beginning of each entity’s first fiscal quarter beginning after March 5, 2010. The adoption of this update is not expected to have an impact on the consolidated financial statements.
ASU - Accounting Standards Update (2010-18), Receivables (Topic 310): Effect of a Loan Modification When the Loan Is Part of a Pool That Is Accounted for as a Single Asset. This ASU codifies the consensus reached in EITF Issue No. 09-I, “Effect of a Loan Modification When the Loan Is Part of a Pool That Is Accounted for as a Single Asset.” The amendments to the FASB Accounting Standards Codification™ (Codification) provide that modifications of loans that are accounted for within a pool under Subtopic 310-30 do not result in the removal of those loans from the pool even if the modification of those loans would otherwise be considered a troubled debt restructuring. An entity will continue to be required to consider whether the pool of assets in which the loan is included is impaired if expected cash flows for the pool change. ASU 2010-18 does not affect the accounting for loans under the scope of Subtopic 310-30 that are not accounted for within pools. Loans accounted for individually under Subtopic 310-30 continue to be subject to the troubled debt restructuring accounting provisions within Subtopic 310-40.
ASU 2010-18 is effective prospectively for modifications of loans accounted for within pools under Subtopic 310-30 occurring in the first interim or annual period ending on or after July 15, 2010. Early application is permitted. Upon initial adoption of ASU 2010-18, an entity may make a one-time election to terminate accounting for loans as a pool under Subtopic 310-30. This election may be applied on a pool-by-pool basis and does not preclude an entity from applying pool accounting to subsequent acquisitions of loans with credit deterioration. The adoption of this update is not expected to have an impact on the consolidated financial statements.
ASU - Accounting Standards Update (2010-20), Receivables (Topic 310): Disclosure about the Credit Quality of Financing Receivables and the Allowance for Credit Losses. The objective of this ASU is for an entity to provide disclosures that facilitate financial statement users’ evaluation of the following: (1) the nature of credit risk inherent in the entity’s portfolio of financing receivables; (2) how that risk is analyzed and assessed in arriving at the allowance for credit losses; and (3) the changes and reasons for those changes in the allowance for credit losses.
To achieve these objectives, an entity should provide disclosures on a disaggregated basis on two defined levels: (1) portfolio segment; and (2) class of financing receivable. The ASU makes changes to existing disclosure requirements and includes additional disclosure requirements about financing receivables, including: (1) credit quality indicators of financing receivables at the end of the reporting period by class of financing receivables; (2) the aging of past due financing receivables at the end of the reporting period by class of financing receivables; and (3) the nature and extent of troubled debt restructurings that occurred during the period by class of financing receivables and their effect on the allowance for credit losses.
For public entities, the disclosures as of the end of a reporting period are effective for interim and annual reporting periods ending on or after December 15, 2010. The disclosures about activity that occurs during a reporting period are effective for interim and annual reporting periods beginning on or after December 15, 2010. The adoption of this standard will require additional disclosures.
29
TECHE HOLDING COMPANY AND SUBSIDIARY
NOTES TO CONSOLIDATED FINANCIAL STATEMENTS
Years Ended September 30, 2010, 2009, and 2008
(in thousands except share and per share data)
|
2.
|
INTEREST RATE RISK
|
The Company is engaged principally in providing first mortgage and other types of loans to individuals and businesses. The shorter duration of interest-sensitive liabilities indicates that in a rising rate environment the Company is exposed to interest rate risk because liabilities may be re-pricing faster at higher interest rates, thereby reducing the market value of long-term assets and net interest income. In a falling rate environment the market value of long-term assets and net interest income may be increased.
Management has the intent to hold loans and has strategies to hedge interest rate risk. Management is pricing CD specials in the longer-term products and continues to focus on consumer and commercial loans, checking, savings and money market deposits to manage interest rate risk. Management may periodically decide to sell loans to manage changes in interest rates.
The Bank’s interest rate risk position is currently within the limits established by the Board of Directors.
30
TECHE HOLDING COMPANY AND SUBSIDIARY
NOTES TO CONSOLIDATED FINANCIAL STATEMENTS
Years Ended September 30, 2010, 2009, and 2008
(in thousands except share and per share data)
3. SECURITIES
The amortized cost and estimated fair values of securities available-for-sale are as follows:
|
September 30, 2010
|
||||||||||||||||
|
Gross
|
Gross
|
Estimated
|
||||||||||||||
|
Amortized
Cost
|
Unrealized
Gains
|
Unrealized Losses
|
Fair
Value
|
|||||||||||||
|
Mortgage-backed securities:
|
||||||||||||||||
|
Government National Mortgage Association
|
$ | 2,039 | $ | 59 | $ | — | $ | 2,098 | ||||||||
|
Federal Home Loan Mortgage Corporation
|
4,974 | 135 | — | 5,109 | ||||||||||||
|
Federal National Mortgage Association
|
4,448 | 221 | — | 4,669 | ||||||||||||
| 11,461 | 415 | — | 11,876 | |||||||||||||
|
Collateralized mortgage obligations
|
||||||||||||||||
|
CMO’s:
|
||||||||||||||||
|
Government National Mortgage Association
|
2,474 | 178 | — | 2,652 | ||||||||||||
|
Marketable equity securities
|
372 | 96 | — | 468 | ||||||||||||
|
Total
|
$ | 14,307 | $ | 689 | $ | — | $ | 14,996 | ||||||||
|
September 30, 2009
|
||||||||||||||||
|
Gross
|
Gross
|
Estimated
|
||||||||||||||
|
Amortized
Cost
|
Unrealized
Gains
|
Unrealized
Losses
|
Fair
Value
|
|||||||||||||
|
Mortgage-backed securities:
|
||||||||||||||||
|
Government National Mortgage Association
|
$ | 2,508 | $ | 41 | $ | — | $ | 2,549 | ||||||||
|
Federal Home Loan Mortgage Corporation
|
8,187 | 139 | (4 | ) | 8,322 | |||||||||||
|
Federal National Mortgage Association
|
5,809 | 211 | - | 6,020 | ||||||||||||
| 16,504 | 391 | (4 | ) | 16,891 | ||||||||||||
|
Collateralized mortgage obligations
|
||||||||||||||||
|
CMO’s:
|
||||||||||||||||
|
Government National Mortgage Association
|
3,181 | 136 | — | 3,317 | ||||||||||||
|
Marketable equity securities
|
592 | 159 | (23 | ) | 728 | |||||||||||
|
Total
|
$ | 20,277 | $ | 686 | $ | (27 | ) | $ | 20,936 | |||||||
31
TECHE HOLDING COMPANY AND SUBSIDIARY
NOTES TO CONSOLIDATED FINANCIAL STATEMENTS
Years Ended September 30, 2010, 2009, and 2008
(in thousands except share and per share data)
The amortized cost and estimated fair values of securities held-to-maturity are as follows:
|
September 30, 2010
|
||||||||||||||||
|
Gross
|
Gross
|
Estimated
|
||||||||||||||
|
Amortized
Cost
|
Unrealized
Gains
|
Unrealized Losses
|
Fair
Value
|
|||||||||||||
|
Investment securities:
|
||||||||||||||||
|
Federal Home Loan Bank
|
$ | 5,000 | $ | 3 | $ | — | $ | 5,003 | ||||||||
|
Time deposits other banks
|
24,219 | — | — | 24,219 | ||||||||||||
|
Mortgage-backed securities:
|
||||||||||||||||
|
Federal National Mortgage Association
|
17,873 | 1,069 | — | 18,942 | ||||||||||||
|
Federal Home Loan Mortgage Corporation
|
7,918 | 577 | — | 8,495 | ||||||||||||
|
Private Label
|
1,841 | 291 | (217 | ) | 1,915 | |||||||||||
|
CMOs:
|
||||||||||||||||
|
Federal Home Loan Mortgage Corporation
|
197 | 2 | — | 199 | ||||||||||||
|
Federal National Mortgage Association
|
1,343 | 67 | — | 1,410 | ||||||||||||
|
Private Label
|
1,175 | 361 | (8 | ) | 1,528 | |||||||||||
| $ | 59,566 | $ | 2,370 | $ | (225 | ) | $ | 61,711 | ||||||||
|
September 30, 2009
|
||||||||||||||||
|
Gross
|
Gross
|
Estimated
|
||||||||||||||
|
Amortized
Cost
|
Unrealized
Gains
|
Unrealized Losses
|
Fair
Value
|
|||||||||||||
|
Investment securities:
|
||||||||||||||||
|
Federal Home Loan Bank
|
$ | 16,476 | $ | 97 | $ | — | $ | 16,573 | ||||||||
|
Time deposits other banks
|
17,049 | 24 | — | 17,073 | ||||||||||||
|
Mortgage-backed securities:
|
||||||||||||||||
|
Federal National Mortgage Association
|
24,658 | 1,212 | (1 | ) | 25,869 | |||||||||||
|
Federal Home Loan Mortgage Corportion
|
10,770 | 709 | — | 11,479 | ||||||||||||
|
Private Label
|
2,572 | 146 | (588 | ) | 2,130 | |||||||||||
|
CMOs:
|
||||||||||||||||
|
Federal Home Loan Mortgage Corporation
|
341 | 6 | — | 347 | ||||||||||||
|
Federal National Mortgage Association
|
1,843 | 63 | — | 1,906 | ||||||||||||
|
Private Label
|
1,675 | 40 | (205 | ) | 1,510 | |||||||||||
| $ | 75,384 | $ | 2,297 | $ | (794 | ) | $ | 76,887 | ||||||||
32
TECHE HOLDING COMPANY AND SUBSIDIARY
NOTES TO CONSOLIDATED FINANCIAL STATEMENTS
Years Ended September 30, 2010, 2009, and 2008
(in thousands except share and per share data)
Details concerning securities with unrealized losses as of September 30, 2010 are as follows:
There were no available-for-sale securities with unrealized losses as of September 30, 2010.
|
Securities with losses
|
Securities with losses
|
|||||||||||||||||||||||
|
under 12 months
|
over 12 months
|
Total
|
||||||||||||||||||||||
|
Fair
value
|
Gross
unrealized
losses
|
Fair
value
|
Gross
unrealized
losses
|
Fair
value
|
Gross
unrealized
losses
|
|||||||||||||||||||
|
Held-to-Maturity
|
||||||||||||||||||||||||
|
Investment securities:
|
||||||||||||||||||||||||
|
Private Label
|
$ | 53 | $ | (18 | ) | $ | 809 | $ | (199 | ) | $ | 862 | $ | (217 | ) | |||||||||
|
CMOs:
|
||||||||||||||||||||||||
|
Private label
|
368 | (6 | ) | 8 | (2 | ) | 376 | (8 | ) | |||||||||||||||
| $ | 421 | $ | (24 | ) | $ | 817 | $ | (201 | ) | $ | 1,238 | $ | (225 | ) | ||||||||||
The Company has 316 investments at September 30, 2010 of which 31 had unrealized losses. These unrealized losses generally result from changes in market interest rates and as a result of the disruption in the existing mortgage securities market due to illiquidity in certain sectors of that market. The unrealized losses associated with investment securities issued by government sponsored enterprises (GSE’s) are caused by changes in interest rates and are not considered credit related since the contractual cash flows of these investments are guaranteed by these agencies.
GSE’s have access to additional capital and liquidity resources from the U.S. Treasury, which indicates that they will be able to honor their guarantees, related to the contractual cash flows of the mortgage-backed securities (MBS) that they have issued. In the case of securities issued by the Government National Mortgage Association, the securities are fully guaranteed by the U.S. Government.
For each private label security, duration of the impairment, credit support and cash flows were assessed to determine whether the security was temporarily or other than temporarily impaired. Management evaluates the actual mortgage delinquencies, foreclosures, and real estate owned for each security, as well as future expected losses in the underlying mortgage collateral to determine if there is a high probability for expected losses and contractual shortfalls of interest or principal, which could warrant recognition of other than temporary impairment. Based upon our evaluation, we have determined that some securities have been other-than-temporarily impaired. Consequently, during 2010 the value of these securities has been reduced with a corresponding charge to earnings of $177 which represents the credit portion of the loss. The remaining balances of the private label securities have been determined to have sufficient credit support and cash flows to repay the remaining principal of the security.
In September 2010, the Company redeemed, and recognized an immaterial gain, its investment in the unit investment trust which consisted of common stock in 16 community banks located around the nation and three single issue bank common stocks, typically obtained in a mutual to stock thrift conversions.
33
TECHE HOLDING COMPANY AND SUBSIDIARY
NOTES TO CONSOLIDATED FINANCIAL STATEMENTS
Years Ended September 30, 2010, 2009, and 2008
(in thousands except share and per share data)
Details concerning securities with unrealized losses as of September 30, 2009 are as follows:
|
Securities with losses
|
Securities with losses
|
|||||||||||||||||||||||
|
under 12 months
|
over 12 months
|
Total
|
||||||||||||||||||||||
|
Fair
value
|
Gross
unrealized
losses
|
Fair
value
|
Gross
unrealized
losses
|
Fair
value
|
Gross
unrealized
losses
|
|||||||||||||||||||
|
Available-for-sale
|
||||||||||||||||||||||||
|
Federal Home Loan Mortgage Corporation
|
$ | 1,463 | $ | (4 | ) | $ | — | $ | — | $ | 1,463 | $ | (4 | ) | ||||||||||
|
Marketable equity securities
|
64 | (12 | ) | 11 | (11 | ) | 75 | (23 | ) | |||||||||||||||
| $ | 1,527 | $ | (16 | ) | $ | 11 | $ | (11 | ) | $ | 1,538 | $ | (27 | ) | ||||||||||
|
Securities with losses
|
Securities with losses
|
|||||||||||||||||||||||
|
under 12 months
|
over 12 months
|
Total
|
||||||||||||||||||||||
|
|
Fair
value
|
Gross
unrealized
losses
|
Fair
value
|
Gross
unrealized
losses
|
Fair
value
|
Gross
unrealized
losses
|
||||||||||||||||||
|
Held-to-maturity
|
||||||||||||||||||||||||
|
Investment securities
|
||||||||||||||||||||||||
|
Federal Home Loan Bank
|
$ | — | $ | — | $ | — | $ | — | $ | — | $ | — | ||||||||||||
|
Time deposits other banks
|
||||||||||||||||||||||||
|
Mortgage-backed securities:
|
||||||||||||||||||||||||
|
Federal National Mortgage Association
|
272 | — | 122 | $ | (1 | ) | $ | 394 | $ | (1 | ) | |||||||||||||
|
Federal Home Loan Mortgage Corporation
|
||||||||||||||||||||||||
|
Private Label
|
459 | (82 | ) | 888 | (506 | ) | 1,347 | (588 | ) | |||||||||||||||
|
CMOs:
|
||||||||||||||||||||||||
|
Federal Home Loan Mortgage Corporation
|
||||||||||||||||||||||||
|
Federal National Mortgage Association
|
— | — | 33 | — | 33 | — | ||||||||||||||||||
|
Private Label
|
11 | (20 | ) | 1,019 | (185 | ) | 1,030 | (205 | ) | |||||||||||||||
| $ | 742 | $ | (102 | ) | $ | 2,062 | $ | (692 | ) | $ | 2,804 | $ | (794 | ) | ||||||||||
The Company had 290 investments at September 30, 2009 of which 52 had unrealized losses. These unrealized losses generally resulted from changes in market interest rates and as a result of the disruption in the existing mortgage securities market due to illiquidity in certain sectors of that market. The unrealized losses associated with investment securities issued by government sponsored enterprises (GSE’s) are caused by changes in interest rates and are not considered credit related since the contractual cash flows of these investments are guaranteed by these agencies.
.
34
TECHE HOLDING COMPANY AND SUBSIDIARY
NOTES TO CONSOLIDATED FINANCIAL STATEMENTS
Years Ended September 30, 2010, 2009, and 2008
(in thousands except share and per share data)
For each private label security, duration of the impairment, credit support and cash flows were assessed to determine whether the security was temporarily or other than temporarily impaired. Management evaluates the actual mortgage delinquencies, foreclosures, and real estate owned for each security, as well as future expected losses in the underlying mortgage collateral to determine if there is a high probability for expected losses and contractual shortfalls of interest or principal, which could warrant further recognition of impairment. Based upon our evaluation, we have determined that some securities have been other-than-temporarily impaired. Consequently, the value of these securities has been reduced with a corresponding charge to earnings of $936. The remaining balances of the private label securities have been determined to have sufficient credit support and cash flows to cover any projected underlying loan losses.
Marketable equity securities contain an unrealized loss of $23 at September 30, 2009, which consisted of a unit investment trust that consists of stock in 25 community banks around the nation and certain single issue bank common stocks, typically obtained in a mutual to stock thrift conversions. The state of the banking industry in general had contributed to the significant short term decline. Due to the short duration of the unrealized losses, the anticipated benefits from the U.S. Government liquidity and capital purchase programs, and the prospects of the companies that we have invested in, it has been determined that the securities are not other than temporarily impaired. Management will continue to monitor the securities and make an impairment adjustment if deemed necessary based upon the prospects for recovery and the duration and severity of the unrealized losses.
At September 30, 2010 and 2009, securities with a cost of approximately $19,350 and $18,950 were pledged to secure deposits and advances from the Federal Home Loan Bank of Dallas as required or permitted by law.
The amortized cost and estimated fair value of available-for-sale securities by contractual maturity at September 30, 2010, has not been presented due to the investment in mortgage-backed securities whose actual maturities will differ from contractual maturities because borrowers may have the right to call or prepay obligations without call or prepayment penalties.
The amortized cost and estimated fair value of held-to-maturity securities by contractual maturity at September 30, 2010, are shown below. Expected maturities may differ from contractual maturities because issuers may have the right to call or prepay obligations with or without call or prepayment penalties.
|
(In thousands)
|
Amortized
Cost
|
Fair
Value
|
||||||
|
Due within one year
|
$ | 22,979 | $ | 22,982 | ||||
|
Due after one year but within five years
|
6,240 | 6,240 | ||||||
|
Total
|
29,219 | 29,222 | ||||||
|
Mortgage-backed securities
|
30,347 | 32,489 | ||||||
| $ | 59,566 | $ | 61,711 | |||||
35
TECHE HOLDING COMPANY AND SUBSIDIARY
NOTES TO CONSOLIDATED FINANCIAL STATEMENTS
Years Ended September 30, 2010, 2009, and 2008
(in thousands except share and per share data)
The following table presents a roll-forward of the amount of credit losses on the Company’s investment securities recognized in earnings for the years ended September 30, 2010 and 2009.
|
Beginning balance of credit losses at October 1, 2009*
|
$
|
1,344
|
||
|
Other-than-temporary impairment credit losses on securities not previously OTTI
|
88
|
|||
|
Increases for additional credit losses on securities previously determined to be OTTI
|
99
|
|||
|
Reduction for increases in cash flows
|
(10
|
)
|
||
|
Reduction for realized losses
|
(79
|
)
|
||
|
Ending balance of cumulative credit losses recognized in earnings
|
$
|
1,442
|
*- The beginning balance includes credit related losses included in OTTI charges recognized on debt securities.
|
Beginning balance of credit losses at October 1, 2008*
|
$ | 408 | ||
|
Other-than-temporary impairment credit losses
|
936 | |||
|
Ending balance of cumulative credit losses recognized in earnings
|
$ | 1,344 |
*- The beginning balance includes credit related losses included in OTTI charges recognized on debt securities.
The amount of other-than-temporary impairment credit losses on securities in which we had previously recognized other than temporary impairment amounted to $99 and the amount related to losses on securities with no previous losses amounted to $88 at September 30, 2010. Debt securities with unrealized losses are reviewed for other-than temporary impairment at each reporting period. Management monitors these securities for evidence of credit deterioration that could indicate that an other-than-temporary impairment has occurred. Among other factors, changes in the security’s credit rating from a credit rating agency is considered as evidence of potential credit deterioration. For securities that have indications of credit related impairment, management analyzes future expected cash flows to determine if any credit related impairment is evident. Estimated cash flows are determined using management’s best estimate of future cash flows based on specific assumptions. The assumptions used to determine the cash flows were based on estimates of loss severity, credit default, and prepayment speeds. For each security, these assumptions were developed by taking the trailing six month historical average rate for the security.
Gains on sale of available for sale securities of $108, $76, and $0 were realized on sales of securities in the year ended September 30, 2010, 2009, and 2008 respectively. Proceeds of $577, $201, and $2,357 were received from the sale of securities during the twelve months ended September 30, 2010, 2009, and 2008 respectively. In June 2008, the Company withdrew or redeemed its investment in the AMF Ultra Short Mortgage Fund (the AMF Fund), resulting in a pre-tax charge of $2,580. The Company terminated its investment in the AMF Fund as a result of continuing declines in the market value of the securities
36
TECHE HOLDING COMPANY AND SUBSIDIARY
NOTES TO CONSOLIDATED FINANCIAL STATEMENTS
Years Ended September 30, 2010, 2009, and 2008
(in thousands except share and per share data)
held by the Fund. Upon termination of this investment, the Company received cash, and, in a like-kind exchange, a pro rata net distribution of private label and Government Sponsored Enterprise (GSE) securities held by the AMF Fund.
The following is the summary of the transaction:
|
Summary
|
In Millions
|
|||
|
Cash received
|
$ | 2.3 | ||
|
Private Label MBS’s and CMOs, at market
|
7.1 | |||
|
GSE MBS’s and CMOs, at market
|
4.1 | |||
|
Loss
|
2.6 | |||
|
Total
|
$ | 16.1 | ||
Non credit other than temporary impairment losses in accumulated other comprehensive income were $648 as of September 30, 2010. These losses were related to investments in private label CMOs.
4. LOANS RECEIVABLE
Loans receivable are summarized as follows:
|
September 30,
|
||||||||
|
2010
|
2009
|
|||||||
|
Residential real estate mortgage loans:
|
||||||||
|
One-to-four family units - Conforming
|
$ | 128,237 | $ | 131,735 | ||||
|
One-to-four family units - Commercial-Smart
|
44,139 | 39,652 | ||||||
|
One-to-four family units - Smart
|
86,959 | 83,775 | ||||||
|
Multi-family-Smart
|
24,354 | 25,253 | ||||||
|
Land loans-Smart
|
39,048 | 40,243 | ||||||
|
Construction loans
|
4,320 | 4,800 | ||||||
|
Commercial real estate loans-Smart
|
94,504 | 94,352 | ||||||
|
Commercial non-real estate loans-Smart
|
30,929 | 30,434 | ||||||
|
Home improvement and home equity loans-Smart
|
52,276 | 57,137 | ||||||
|
Loans on savings accounts-Smart
|
4,672 | 7,779 | ||||||
|
Auto loans-Smart
|
2,716 | 3,045 | ||||||
|
Mobile home loans-Smart
|
70,765 | 68,850 | ||||||
|
Other secured and unsecured-Smart
|
13,375 | 8,605 | ||||||
| 596,294 | 595,660 | |||||||
|
Less
|
||||||||
|
Allowance for loan losses
|
9,256 | 6,806 | ||||||
|
Deferred loan fees, net
|
403 | 327 | ||||||
| $ | 586,635 | $ | 588,527 | |||||
Smart one-to-four family mortgages represent those loans not meeting all of the Bank’s standard loan underwriting criteria for residential real estate loans. Smart mortgage loans consist primarily of smaller mortgage loans of $100,000 or less with higher interest rates, first time home buyer loans with 100% loan-to-value (LTVs), and loans with LTVs greater than 80% to conforming borrowers.
37
TECHE HOLDING COMPANY AND SUBSIDIARY
NOTES TO CONSOLIDATED FINANCIAL STATEMENTS
Years Ended September 30, 2010, 2009, and 2008
(in thousands except share and per share data)
Changes in the allowance for loan losses are as follows:
|
Year Ended September 30,
|
||||||||||||
|
2010
|
2009
|
2008
|
||||||||||
|
Beginning balance - October 1
|
$
|
6,806
|
$
|
5,545
|
$
|
5,083
|
||||||
|
Provision charged to operating expense
|
3,896
|
3,026
|
825
|
|||||||||
|
Recoveries
|
30
|
29
|
19
|
|||||||||
|
Loans charged off
|
(1,476
|
)
|
(1,794
|
)
|
(382
|
)
|
||||||
|
Ending balance - September 30
|
$
|
9,256
|
$
|
6,806
|
$
|
5,545
|
||||||
The amount of nonaccrual loans at September 30, 2010 and 2009 was approximately $14,100 and $5,600, respectively. The amount of impaired loans at September 30, 2010 was approximately $10,500 and at September 30, 2009 was approximately $9,600. The amount of allowance allocated to impaired loans was approximately $2,079 at September 30, 2010 and $812 at September 30, 2009. The average investment in impaired loans was $14,201 and $5,234 for the years ended September 30, 2010 and 2009, respectively. The amount of foregone interest on impaired loans was approximately $249 and $115, respectively. The amount of loans over 90 days and still accruing was approximately $805 and $511 for the years ended September 30, 2010 and 2009.
Approximately $1,956 at September 30, 2010 and $5,800 at September 30, 2009 of impaired loans had no related reserves. Reserves were not considered necessary based on management’s assessment of the fair value less costs to sell of the underlying collateral securing these loans.
A majority of the increase in the amount of nonaccrual loans in 2010 is due to a $6.2 million commercial credit relationship involving a residential land development and five show homes in the Baton Rouge market area the borrower of which filed for bankruptcy protection under Chapter 11.
The Company has collateralized its advances from the Federal Home Loan Bank with a blanket-floating lien on its residential real estate first mortgage loans.
The Company has loans that it services for others which amounted to $48,875 and $60,835 at September 30, 2010 and 2009, respectively.
38
TECHE HOLDING COMPANY AND SUBSIDIARY
NOTES TO CONSOLIDATED FINANCIAL STATEMENTS
Years Ended September 30, 2010, 2009, and 2008
(in thousands except share and per share data)
5. REAL ESTATE OWNED
Real estate owned consisted of the following:
|
September 30,
|
||||||||
|
2010
|
2009
|
|||||||
|
Real estate acquired through foreclosure:
|
||||||||
|
One-to-four family units – Conforming
|
$
|
685
|
$
|
118
|
||||
|
One-to-four family units – Smart
|
221
|
320
|
||||||
|
Multi-family
|
--
|
1,190
|
||||||
|
Land loans
|
202
|
404
|
||||||
|
Commercial real estate loans
|
240
|
174
|
||||||
|
Less allowance for losses
|
(167
|
)
|
(253
|
)
|
||||
|
Real estate owned - net
|
$
|
1,181
|
$
|
1,953
|
||||
6. PREMISES AND EQUIPMENT
Premises and equipment are summarized as follows:
|
September 30,
|
||||||||
|
2010
|
2009
|
|||||||
|
Land
|
$ | 10,637 | $ | 10,686 | ||||
|
Buildings and improvements
|
19,135 | 19,075 | ||||||
|
Furniture, fixtures and equipment
|
11,682 | 10,750 | ||||||
| 41,454 | 40,511 | |||||||
|
Less accumulated depreciation
|
(14,700 | ) | (13,292 | ) | ||||
| $ | 26,754 | $ | 27,219 | |||||
Pursuant to the terms of non-cancelable lease agreements in effect at September 30, 2010 pertaining to banking premises and equipment, future minimum rent commitments under various operating leases are as follows:
|
2011
|
$ | 94 | ||
|
2012
|
51 | |||
|
2013
|
-- | |||
| $ | 145 |
All leases contain options to extend for periods from three to ten years. Total rent expense for the years ended September 30, 2010, 2009, and 2008 amounted to $161, $160 and $200 respectively.
39
TECHE HOLDING COMPANY AND SUBSIDIARY
NOTES TO CONSOLIDATED FINANCIAL STATEMENTS
Years Ended September 30, 2010, 2009, and 2008
(in thousands except share and per share data)
7. DEPOSITS
Deposits are summarized as follows:
|
September 30,
|
||||||||
|
2010
|
2009
|
|||||||
|
Non-interest bearing demand accounts
|
$ | 72,225 | $ | 64,380 | ||||
|
Interest bearing:
|
||||||||
|
NOW accounts
|
100,981 | 101,416 | ||||||
|
Passbook and regular savings
|
166,734 | 106,479 | ||||||
|
Money funds accounts
|
60,246 | 95,461 | ||||||
|
Certificates of deposit
|
179,169 | 217,733 | ||||||
| $ | 579,355 | $ | 585,469 | |||||
Certificates of deposit of $100 or more amounted to $71,046 and $85,263 at September 30, 2010 and 2009, respectively.
Certificates of deposits at September 30, 2010 mature as follows:
|
Less than one year
|
$ | 70,819 | ||
|
1-2 years
|
56,894 | |||
|
2-3 years
|
14,268 | |||
|
3-4 years
|
11,795 | |||
|
4-5 years
|
20,292 | |||
|
Over 5 years
|
5,101 | |||
|
TOTAL
|
$ | 179,169 |
40
TECHE HOLDING COMPANY AND SUBSIDIARY
NOTES TO CONSOLIDATED FINANCIAL STATEMENTS
Years Ended September 30, 2010, 2009, and 2008
(in thousands except share and per share data)
8. ADVANCES FROM FEDERAL HOME LOAN BANK
At September 30, 2010 and 2009 respectively, the Company was indebted to the FHLB for $100,017 and $100,628 of advances bearing interest at a weighted average rate of 4.53% and 4.56%, which are due as follows:
|
Year Ended
|
||||
|
September 30,
|
||||
|
2011
|
$ | 21,579 | ||
|
2012
|
5,534 | |||
|
2013
|
5,828 | |||
|
2014
|
11,038 | |||
|
2015
|
9,355 | |||
|
Thereafter
|
46,683 | |||
|
|
$ | 100,017 | ||
These advances are collateralized by a blanket-floating lien on the Company’s residential real estate first mortgage loans, certain investment securities and stock in the Federal Home Loan Bank of Dallas.
At September 30, 2010, the Company had an additional $167,067 available under its line of credit with the FHLB.
9. OTHER NON-INTEREST INCOME
Other non-interest income consisted of the following:
|
Year Ended September 30,
|
||||||||||||
|
2010
|
2009
|
2008
|
||||||||||
|
Life insurance contracts
|
$ | 586 | $ | 597 | $ | 635 | ||||||
|
Other
|
274 | 306 | 463 | |||||||||
| $ | 860 | $ | 903 | $ | 1,098 | |||||||
41
TECHE HOLDING COMPANY AND SUBSIDIARY
NOTES TO CONSOLIDATED FINANCIAL STATEMENTS
Years Ended September 30, 2010, 2009, and 2008
(in thousands except share and per share data)
10. INCOME TAXES
Deferred income taxes reflect the net tax effects of temporary differences between the carrying amounts of assets and liabilities for financial reporting purposes and the amounts used for income tax purposes. Significant components of the Company’s deferred tax assets and liabilities as of September 30, 2010 and 2009 are as follows:
|
Year Ended September 30,
|
||||||||
|
2010
|
2009
|
|||||||
|
Deferred tax assets:
|
||||||||
|
Allowance for loan losses
|
$ | 2,789 | $ | 1,733 | ||||
|
Accruals and stock based compensation
|
1,007 | 886 | ||||||
|
Impairments on securities
|
30 | 516 | ||||||
|
Total deferred tax assets
|
3,826 | 3,135 | ||||||
|
Deferred tax liabilities:
|
||||||||
|
Deferred loan fees and costs - net
|
201 | 197 | ||||||
|
Tax over book depreciation
|
1,086 | 1,143 | ||||||
|
Net unrealized gain on investment securities
|
14 | 96 | ||||||
|
Dividends on FHLB stock
|
392 | 386 | ||||||
|
Other
|
276 | 418 | ||||||
|
Total deferred tax liabilities
|
1,969 | 2,240 | ||||||
|
Net deferred tax asset
|
$ | 1,857 | $ | 895 | ||||
The components of income tax expense are as follows:
|
Year Ended September 30,
|
||||||||||||
|
2010
|
2009
|
2008
|
||||||||||
|
Current
|
$ | 4,548 | $ | 4,183 | $ | 1,989 | ||||||
|
Deferred
|
(1,182 | ) | (925 | ) | 58 | |||||||
| $ | 3,366 | $ | 3,258 | $ | 2,047 | |||||||
Income taxes differ from the amounts computed by applying the U.S. Federal income tax rate of 34% to earnings before income taxes. The reasons for these differences are as follows:
|
Year Ended September 30,
|
||||||||||||
|
2010
|
2009
|
2008
|
||||||||||
|
Taxes computed at statutory rates
|
$
|
3,559
|
$
|
3,534
|
$
|
2,637
|
||||||
|
Decrease in taxes due to net nontaxable income
|
(158
|
)
|
(134
|
)
|
(160
|
)
|
||||||
|
Tax credits
|
(35
|
)
|
(142
|
)
|
(430
|
)
|
||||||
|
$
|
3,366
|
$
|
3,258
|
$
|
2,047
|
|||||||
|
Effective tax rate
|
32.2
|
% |
31.3
|
%
|
26.4
|
%
|
||||||
During the third quarter of 2008, the Company determined that it qualified for certain tax credits related to tax incentives in conjunction with the relief efforts related to hurricanes that devastated southern
42
TECHE HOLDING COMPANY AND SUBSIDIARY
NOTES TO CONSOLIDATED FINANCIAL STATEMENTS
Years Ended September 30, 2010, 2009, and 2008
(in thousands except share and per share data)
Louisiana in late 2006. These tax credits applied to the Company’s 2006 and 2007 income tax returns and provided net benefits in the amounts of $168 and $171, respectively. The net benefit of the tax credits was recorded in the 2008 financial statements.
GAAP does not require that deferred income taxes be provided on certain portions of the allowance for loan losses that existed as of September 30, 1988. At September 30, 2010, retained earnings include approximately $4.4 million representing such allowances for which no deferred income taxes have been provided.
11. NON-INTEREST EXPENSE
Occupancy, equipment and data processing expenses consisted of the following:
|
Year Ended September 30,
|
||||||||||||
|
2010
|
2009
|
2008
|
||||||||||
|
Occupancy, including depreciation, insurance,
|
||||||||||||
|
rent, utilities, etc.
|
$
|
2,398
|
$
|
2,307
|
$
|
2,276
|
||||||
|
Equipment, including depreciation, telephone, etc.
|
2,528
|
2,458
|
2,444
|
|||||||||
|
Data processing
|
1,403
|
1,479
|
1,364
|
|||||||||
|
$
|
6,329
|
$
|
6,244
|
$
|
6,084
|
|||||||
Other operating expenses consisted of the following:
|
Year Ended September 30,
|
||||||||||||
|
2010
|
2009
|
2008
|
||||||||||
|
Stationery, printing and postage
|
$
|
1,103
|
$
|
950
|
$
|
1,060
|
||||||
|
Debit card expense, and other deposit related costs
|
1,648
|
1,731
|
1,749
|
|||||||||
|
Other
|
1,583
|
1,637
|
1,375
|
|||||||||
|
$
|
4,334
|
$
|
4,318
|
$
|
4,184
|
|||||||
43
TECHE HOLDING COMPANY AND SUBSIDIARY
NOTES TO CONSOLIDATED FINANCIAL STATEMENTS
Years Ended September 30, 2010, 2009, and 2008
(in thousands except share and per share data)
12. OTHER COMPREHENSIVE INCOME (LOSS)
The adjustment to determine other comprehensive income (loss) as included in the consolidated statements of changes in stockholders’ equity consists of the following for the years ended September 30, 2010, 2009 and 2008:
|
Gross
amount
|
Tax
Effect
|
Net of
Tax
amount
|
||||||||||
|
2010
|
||||||||||||
|
Gross change in unrealized loss on securities
|
||||||||||||
|
held to maturity with OTTI
|
$
|
(648
|
)
|
$
|
220
|
$
|
(428
|
)
|
||||
|
Gross change in unrealized gain (loss) on securities
|
||||||||||||
|
available-for-sale
|
284
|
(97
|
)
|
187
|
||||||||
|
Less reclassification for OTTI losses on
|
||||||||||||
|
held to maturity securities included in net income
|
177
|
(60
|
)
|
117
|
||||||||
|
Less reclassification for gain on sale
|
||||||||||||
|
of available for sale securities included in net income
|
(108
|
)
|
37
|
(71
|
)
|
|||||||
|
Less reclassification for OTTI losses on sale
|
||||||||||||
|
of available for sale securities included in net income
|
53
|
(18
|
)
|
35
|
||||||||
|
Other comprehensive income
|
$
|
(242
|
)
|
$
|
82
|
$
|
(160
|
)
|
||||
|
Gross
amount
|
Tax
Effect
|
Net of
Tax
amount
|
||||||||||
|
2009
|
||||||||||||
|
Gross change in unrealized loss on securities
|
||||||||||||
|
held to maturity with OTTI
|
$
|
(375
|
)
|
$
|
128
|
$
|
(247
|
)
|
||||
|
Gross change in unrealized gain (loss) on securities
|
||||||||||||
|
available-for-sale
|
21
|
(7
|
)
|
14
|
||||||||
|
Less reclassification for OTTI losses on
|
||||||||||||
|
held to maturity securities included in net income
|
936
|
(318
|
)
|
618
|
||||||||
|
Less reclassification for gain on sale
|
||||||||||||
|
of available for sale securities included in net income
|
(76
|
)
|
26
|
(50
|
)
|
|||||||
|
Less reclassification for OTTI losses on sale
|
||||||||||||
|
of available for sale securities included in net income
|
175
|
(60
|
)
|
115
|
||||||||
|
Other comprehensive income
|
$
|
681
|
$
|
(231
|
)
|
$
|
450
|
|||||
|
2008
|
||||||||||||
|
Gross change in unrealized loss on securities
|
||||||||||||
|
available-for-sale
|
$
|
(1,867
|
)
|
$
|
635
|
$
|
(1,232
|
)
|
||||
|
Less reclassification loss included in net income
|
2,988
|
(1,016
|
)
|
1,972
|
||||||||
|
Other comprehensive income
|
$
|
1,121
|
$
|
(381
|
)
|
$
|
740
|
44
TECHE HOLDING COMPANY AND SUBSIDIARY
NOTES TO CONSOLIDATED FINANCIAL STATEMENTS
Years Ended September 30, 2010, 2009, and 2008
(in thousands except share and per share data)
13. RETIREMENT PLANS
Through June 2008 the Company participated in a defined benefit multi-employer retirement plan, which covered substantially all employees. The plan was administered by the Financial Institutions Retirement Fund. The Company froze the benefits under this plan during the year ended September 30, 2004. The expense relating to this plan amounted to $0, $52 and $1,797 in the years ended September 30, 2010, 2009 and 2008, respectively, and are the amounts of the required payments relating to these years. The significant increase in expense for the year ended September 30, 2008 was because the Company settled and transferred the obligations of the plan to Hartford Insurance Co., on June 30, 2008 resulting in a pre-tax charge of $1,500. The expense of $52 in 2009 related to the completion of this transaction.
The Company has a 401 (k) Plan whereby substantially all employees participate in the Plan. Employees may contribute up to 50 percent of their compensation subject to certain limits based on federal tax laws. The Company makes matching contributions equal to 100 percent of the first 3 percent plus 50 percent after the next 2 percent of an employee’s compensation contributed to the Plan. Matching contributions vest to the employee equally over a five-year period. For the years ended September 30, 2010, 2009 and 2008, expense attributable to the Plan amounted to approximately $363, $308 and $277, respectively.
14. INCOME PER SHARE
Following is a summary of the information used in the computation of basic and diluted income per common share for the years ended September 30, 2010, 2009, and 2008:
|
Year Ended September 30,
|
|||||||||
|
2010
|
2009
|
2008
|
|||||||
|
Weighted average number of common shares
|
|||||||||
|
outstanding - used in computation of basic
|
|||||||||
|
income per common share
|
2,089,000
|
2,110,000
|
2,154,000
|
||||||
|
Effect of dilutive securities:
|
|||||||||
|
Stock options
|
6,500
|
11,000
|
17,000
|
||||||
|
Stock grants
|
11,500
|
4,000
|
-
|
||||||
|
Weighted average number of common shares
|
|||||||||
|
outstanding plus effect of dilutive securities -
|
|||||||||
|
used in computation of diluted income per
|
|||||||||
|
common share
|
|
2,107,000
|
2,125,000
|
2,171,000
|
|||||
At September 30, 2010 and 2009 and 2008, approximately 231,000, 184,000 and 219,000 of common stock equivalents were excluded from diluted earnings per share because the option price exceeded the average market price.
45
TECHE HOLDING COMPANY AND SUBSIDIARY
NOTES TO CONSOLIDATED FINANCIAL STATEMENTS
Years Ended September 30, 2010, 2009, and 2008
(in thousands except share and per share data)
15. EMPLOYEE STOCK PLANS
The Company maintains an Employee Stock Ownership Plan (ESOP) for the benefit of Teche Federal Bank’s employees who meet certain eligibility requirements. During the fiscal year ended September 30, 2009 the ESOP Trust purchased an additional 20,408 shares of common stock in the Company with a loan from the Company. Teche Federal Bank periodically makes cash contributions to the ESOP on a basis sufficient to enable the ESOP to make the required loan payments to the Company.
The note payable referred to above bears interest at the prime rate adjusted quarterly with principal and interest payable quarterly for nine consecutive quarters. The loan was collateralized by the unreleased shares of the stock purchased.
As the debt is repaid, shares are released from collateral and allocated to qualified employees based on the proportion of principal paid in the year. The shares pledged as collateral are reported as a reduction of stockholders’ equity in the consolidated balance sheets. As shares are committed to be released from collateral, the Company reports compensation expense equal to the current market price of the shares, and the shares become outstanding for income per share computations. Dividends on allocated ESOP shares are recorded as a reduction of retained earnings and dividends on unallocated ESOP shares are recorded as a reduction of debt or as compensation expense if not used for debt service.
Compensation expense related to the ESOP was $522, $644 and $713 for the years ended September 30, 2010, 2009 and 2008, respectively. The ESOP had 11,338 unreleased shares at September 30, 2010. The fair value of unreleased shares at September 30, 2010 was approximately $351.
The Company has five share-based compensation plans in effect at September 30, 2010. The compensation cost that has been charged against income for those plans was approximately $404, $326, and $351 for the years ended September 30, 2010, 2009 and 2008, respectively. The plans allow for the granting of both qualified and non-qualified stock options.
The Company recorded a deferred tax benefit in the amount of $33, $26 and $24 for the years ended September 30, 2010, 2009 and 2008, respectively, related to share-based compensation.
In 1998, the Company implemented the 1998 Stock Option Plan, which authorized the Board of Directors to grant up to 68,000 of stock options to employees, officers and directors of the Company. Options granted under the 1998 Stock Option Plan have a term of up to ten years from the date of grant. Vesting of options is determined at the time of grant and ranges from immediate to five years. Options under this plan must be granted at a price not less than the fair market value at the date of grant.
In 1999, the Company implemented the 1999 Stock Option and Restricted Stock Plan, which authorized the Board of Directors to grant 30,682 non-qualified stock options and 6,000 shares of restricted stock to a new senior officer in accordance with the terms of his employment. The options and restricted stock were granted at the fair market value of the stock at the date of grant and vested over a four-year period. A similar plan was implemented in 2002 authorizing the Board of Directors to grant 12,696 stock options to a new director. These options have a five-year vesting period.
In 2001, the Company implemented the 2001 Stock-Based Incentive Plan, which authorized the Board of Directors to grant up to 250,000 stock options or restricted stock (limited to 37,500 shares) to officers and employees of the Company. Options granted under the 2001 Stock Option Plan have a term of up to ten years from the date of grant. Vesting of options is determined at the time of grant and ranges from
46
TECHE HOLDING COMPANY AND SUBSIDIARY
NOTES TO CONSOLIDATED FINANCIAL STATEMENTS
Years Ended September 30, 2010, 2009, and 2008
(in thousands except share and per share data)
immediate to five years. Options under this plan must be granted at a price not less than the fair market value at the date of grant.
In 2005, the Company implemented the 2004 Stock-Based Incentive Plan, which authorized the Board of Directors to grant up to 200,000 stock options or restricted stock (limited to 50,000 shares) to employees, officers and directors of the Company. Options granted under the 2004 Stock Based Incentive Plan will have a term of up to ten years from the date of grant and vesting of grants will be determined at the time of grant. Options under this plan must be granted at a price not less than the fair market value at the date of grant.
The share-based awards granted under the aforementioned Plans have similar characteristics, except that some awards have been granted in options and certain awards have been granted in restricted stock. Therefore, the following disclosures have been disaggregated for the stock option and restricted stock awards of the Plans due to their dissimilar characteristics.
Stock Options
The fair market value of each option award is estimated on the date of grant using the Black-Scholes option pricing model. The Company granted 39,920 stock options for the year ended September 30, 2010 with an average fair value of $ 4.23 per option. The Company granted 2,500 stock options for the year ended September 30, 2009 with an average fair value of $7.08 per option. The Company granted 102,800 stock options for the year ended September 30, 2008 with a weighted average fair value of $5.22 per option.
The risk-free interest rate is based upon a U.S. Treasury instrument with a life that is similar to the expected life of the option grant. Expected volatility is based upon the historical volatility of the Company based upon the previous 6 years trading history. The expected term of the options is based upon the average life of previously issued stock options. The expected dividend yield is based upon current yield on date of grant. No post-vesting restrictions exist for these options. The following table illustrates the assumptions for the Black-Scholes model used in determining the fair value of options granted to employees in the year ended September 30, 2010 and 2009.
|
Year Ended
|
Year Ended
|
||||||||||
|
September 30, 2010
|
September 30, 2009
|
||||||||||
|
Dividend yield
|
4.63
|
%
|
4.40
|
%
|
|||||||
|
Risk-free interest rate
|
2.25
|
%
|
2.38
|
%
|
|||||||
|
Volatility
|
24.00
|
%
|
31.00
|
%
|
|||||||
|
Expected life
|
6 years
|
6 years
|
|||||||||
47
TECHE HOLDING COMPANY AND SUBSIDIARY
NOTES TO CONSOLIDATED FINANCIAL STATEMENTS
Years Ended September 30, 2010, 2009, and 2008
(in thousands except share and per share data)
A summary of option activity under the stock option plans as of September 30, 2009, and changes during the year ended September 30, 2010 is presented below:
|
Weighted
|
|||||||||
|
Weighted
|
Average
|
||||||||
|
Average
|
Remaining
|
Aggregate
|
|||||||
|
Exercise
|
Contractual
|
Intrinsic
|
|||||||
|
Shares
|
Price
|
Term
|
Value
|
||||||
|
Outstanding at September 30, 2009
|
244,695
|
$
|
33.59
|
6.0 years
|
|
$562
|
|||
|
Exercised
|
(1,145
|
)
|
21.10
|
||||||
|
Authorized
|
-
|
-
|
|||||||
|
Forfeited
|
(1,700
|
)
|
37.12
|
||||||
|
Granted
|
39,920
|
30.70
|
|||||||
|
Outstanding at September 30, 2010
|
281,770
|
$
|
33.20
|
5.8 years
|
|
$137
|
|||
|
Exercisable at September 30, 2010
|
181,690
|
$
|
32.68
|
5.2 years
|
|
$129
|
|||
For the years ended September 30, 2010, 2009 and 2008 respectively, the intrinsic value of options exercised was approximately $13, $10 and $464. The fair value of options vested during the years ended 2010, 2009 and 2008 was approximately $102, $94 and $105, respectively.
Net cash received from options exercised under all share-based payment arrangements for year ended September 30, 2010 was approximately $29. The actual tax benefit in stockholders’ equity realized for the tax deductions from option exercise of the share-based payment arrangements and the tax effect of restricted stock vesting totaled $(53) for the year ended September 30, 2010.
As of September 30, 2010, there was $395 of total unrecognized compensation cost related to non-vested share-based compensation arrangements granted under the Companys stock option plans. That cost is expected to be recognized over a weighted-average period of 3.3 years.
48
TECHE HOLDING COMPANY AND SUBSIDIARY
NOTES TO CONSOLIDATED FINANCIAL STATEMENTS
Years Ended September 30, 2010, 2009, and 2008
(in thousands except share and per share data)
Stock Awards
A summary of the status of the Company's non-vested stock awards as of September 30, 2010, and changes during the year then ended is presented below:
|
Weighted
|
||||||||
|
Average
Grant Date
|
||||||||
|
Shares
|
Fair Value
|
|||||||
|
Non-vested – September 30, 2009
|
13,605 | $ | 38.64 | |||||
|
Granted
|
20,895 | $ | 31.92 | |||||
|
Vested
|
(3,510 | ) | $ | 48.93 | ||||
|
Non-vested - September 30, 2010
|
30,990 | $ | 32.95 | |||||
The fair value of restricted stock vested and the fair value of shares granted as direct compensation for the years ended September 30, 2010, 2009 and 2008, respectively was $172, $269 and $246.
As of September 30, 2010, there was $701 of total unrecognized compensation cost related to non-vested share-based compensation arrangements granted under the Companys stock award plans. That cost is expected to be recognized over a weighted-average period of 2.3 years.
The Company funds the option shares and restricted stock from authorized, but unissued shares. The Company does not typically purchase shares to fulfill the obligations of the stock benefit plans. Company policy does allow option holders to exercise options with seasoned shares.
|
16.
|
FINANCIAL INSTRUMENTS WITH OFF-BALANCE SHEET RISK
|
In the normal course of business the Company is a party to financial instruments with off-balance sheet risk to meet the financing needs of its customers. The financial instruments include commitments to extend credit and commitments to sell loans. Those instruments involve, to varying degrees, elements of credit risk in excess of the amounts recognized in the consolidated balance sheets. The contract amounts of those instruments reflect the extent of the involvement the Company has in particular classes of financial instruments.
As of September 30, 2010 the Company had made various commitments to extend credit totaling approximately $48,788. Most of these commitments are at variable rates. As of September 30, 2009, such commitments totaled approximately $46,834.
Commitments to extend credit are agreements to lend to a customer as long as there is no violation of any condition established in the contract. Commitments generally have fixed expiration dates or other termination clauses and may require payment of a fee. Since some of the commitments are expected to expire without being fully drawn upon, the total commitment amount disclosed above does not necessarily represent future cash requirements.
49
TECHE HOLDING COMPANY AND SUBSIDIARY
NOTES TO CONSOLIDATED FINANCIAL STATEMENTS
Years Ended September 30, 2010, 2009, and 2008
(in thousands except share and per share data)
The Company evaluates each customer’s credit worthiness on a case-by-case basis. The amount of collateral obtained, if considered necessary by the Company upon extension of credit, is based on management’s credit evaluation of the customer.
|
17.
|
DISCLOSURES ABOUT FAIR VALUE OF FINANCIAL INSTRUMENTS
|
The Company utilizes fair value measurements to record fair value adjustments to certain financial assets and financial liabilities and to determine fair value disclosures. Available for sale securities are recorded at fair value on a recurring basis. Additionally, from time to time, the Company may be required to record at fair value other assets on a nonrecurring basis, such as securities held-to-maturity, and impaired loans. These nonrecurring fair value adjustments typically involve other than temporary impairment accounting or impairments of individual assets. The Company has not disclosed non-financial assets and liabilities recorded at fair value on a recurring or non-recurring basis.
The Company uses a three-tier fair value hierarchy which prioritizes the inputs used in measuring fair value as follows:
Level 1 - Observable inputs such as quoted prices in active markets;
Level 2 - Inputs, other than the quoted prices in active markets, that are observable either directly or indirectly; and
Level 3 - Unobservable inputs in which there is little or no market data, which require the reporting entity to develop its own assumptions.
Following is a description of valuation methodologies used for assets recorded at fair value.
Investment Securities
Securities available for sale are valued at quoted market prices where available. If quoted market prices are not available, fair values are based on quoted market prices of comparable securities. Level 1 securities include those traded on an active exchange, such as the New York Stock Exchange, and encompass marketable equity securities. Level 2 securities include mortgage-backed securities issued by government sponsored entities, municipal bonds. Securities classified as Level 3 include asset-backed securities in less liquid markets.
Impaired Loans
The Company does not record loans at fair value on a recurring basis. However, from time to time, a loan is considered impaired and an allowance for loan losses is established. Once a loan is identified as individually impaired, management measures impairment using one of several methods, including collateral value, market value of similar debt, or present values of cash flows. Those impaired loans not requiring an allowance represent loans for which the fair value of the expected repayments or collateral exceed the recorded investments in such loans. At September 30, 2010, substantially all of the total impaired loans were evaluated based on the fair value of the collateral less estimated costs to sell.
50
TECHE HOLDING COMPANY AND SUBSIDIARY
NOTES TO CONSOLIDATED FINANCIAL STATEMENTS
Years Ended September 30, 2010, 2009, and 2008
(in thousands except share and per share data)
Impaired loans where an allowance is established requires classification in the fair value hierarchy. When the fair value of the collateral is based on the observable market price or a current appraised value, less estimated costs to sell, the Company records the impaired loan as nonrecurring Level 2. When an appraised value is not available or management determines the fair value of the collateral is further impaired below the appraised value and there is no observable market price, the Company records the impaired loan as nonrecurring Level 3.
Other Real Estate Owned
OREO, consisting of properties obtained through foreclosure or in satisfaction of loans, is reported at the lower of cost or fair value, determined on the basis of current appraisals, comparable sales, and other estimates of value obtained principally from independent sources, adjusted for estimated selling costs (Level 2). At the time of foreclosure, any excess of the loan balance over the fair value of the real estate held as collateral is treated as a charge against the allowance for loan losses. Gains or losses on sale and generally any subsequent adjustments to the value are recorded as a component of OREO expense.
|
Fair Value At September
|
Fair Value Hierarchy
|
|||||||||||||||
| 30, 2010 |
Level 1
|
Level 2
|
Level 3
|
|||||||||||||
|
(In thousands)
|
||||||||||||||||
|
Assets valued on a recurring basis:
|
||||||||||||||||
|
Mortgage-backed securities:
|
||||||||||||||||
|
Government National Mortgage Assoc.
|
$ | 2,098 | $ | - | $ | 2,098 | $ | - | ||||||||
|
Federal Home Loan Mortgage Corp.
|
5,109 | - | 5,109 | - | ||||||||||||
|
Federal National Mortgage Assoc.
|
4,669 | - | 4,669 | - | ||||||||||||
| 11,876 | - | 11,876 | - | |||||||||||||
|
Collateralized mortgage obligations
|
||||||||||||||||
|
CMOs:
|
||||||||||||||||
|
Government National Mortgage Assoc.
|
2,652 | - | 2,652 | - | ||||||||||||
|
Marketable equity securities
|
468 | 468 | - | - | ||||||||||||
|
Total recurring
|
$ | 14,996 | $ | 468 | $ | 14,528 | $ | - | ||||||||
|
Assets valued on a non-recurring basis:
|
||||||||||||||||
|
CMOs: Private label
|
$ | 110 | $ | - | $ | 110 | $ | - | ||||||||
|
Impaired loans
|
6,484 | - | 6,484 | - | ||||||||||||
|
Other real estate owned
|
760 | 760 | ||||||||||||||
|
Total non-recurring
|
$ | 7,354 | $ | - | $ | 7,354 | $ | - | ||||||||
51
TECHE HOLDING COMPANY AND SUBSIDIARY
NOTES TO CONSOLIDATED FINANCIAL STATEMENTS
Years Ended September 30, 2010, 2009, and 2008
(in thousands except share and per share data)
|
Fair Value At September
|
Fair Value Hierarchy
|
|||||||||||||||
| 30, 2009 |
Level 1
|
Level 2
|
Level 3
|
|||||||||||||
|
(In thousands)
|
||||||||||||||||
|
Assets valued on a recurring basis:
|
||||||||||||||||
|
Mortgage-backed securities:
|
||||||||||||||||
|
Government National Mortgage Assoc.
|
$ | 2,549 | $ | - | $ | 2,549 | $ | - | ||||||||
|
Federal Home Loan Mortgage Corp.
|
8,322 | - | 8,322 | - | ||||||||||||
|
Federal National Mortgage Assoc.
|
6,020 | - | 6,020 | - | ||||||||||||
| 16,891 | - | 16,891 | - | |||||||||||||
|
Collateralized mortgage obligations
|
||||||||||||||||
|
CMOs:
|
||||||||||||||||
|
Government National Mortgage Assoc.
|
3,317 | - | 3,317 | - | ||||||||||||
|
Marketable equity securities
|
728 | 728 | - | - | ||||||||||||
|
Total recurring
|
$ | 20,936 | $ | 728 | $ | 20,208 | $ | - | ||||||||
|
Assets valued on a non-recurring basis:
|
||||||||||||||||
|
CMOs: Private label
|
$ | 164 | $ | - | $ | 164 | $ | - | ||||||||
|
Impaired loans
|
2,988 | - | 2,988 | - | ||||||||||||
|
Total non-recurring
|
$ | 3,152 | $ | - | $ | 3,152 | $ | - | ||||||||
The fair value of a financial instrument is the current amount that would be exchanged between willing parties, other than in a forced liquidation. Fair value is best determined based upon quoted market prices. However, in many instances, there are no quoted market prices for the Company’s various financial instruments. In cases where quoted market prices are not available, fair values are based on estimates using present value or other valuation techniques. Those techniques are significantly affected by the assumptions used, including the discount rate and estimates of future cash flows. Accordingly, the fair value estimates may not be realized in an immediate settlement of the instrument. The aggregate fair value amounts presented below may not necessarily represent the underlying fair value of the Company.
The following methods and assumptions were used by the Company in estimating fair value disclosures for financial instruments:
Cash - For those short-term instruments, the carrying amount is a reasonable estimate of fair value.
Investment Securities - For investment securities, fair value is determined as disclosed in the previous investment security disclosure.
Loans - The fair value of loans is estimated by discounting the future cash flows using the current rates at which similar loans would be made to borrowers for the same remaining maturities. No adjustment has been made for illiquidity in the market for loans as there is no active market for many of the Company’s loans on which to reasonably base this estimate.
52
TECHE HOLDING COMPANY AND SUBSIDIARY
NOTES TO CONSOLIDATED FINANCIAL STATEMENTS
Years Ended September 30, 2010, 2009, and 2008
(in thousands except share and per share data)
Federal Home Loan Bank Stock - The carrying value of Federal Home Loan Bank stock approximates fair value based on the redemption provisions of the Federal Home Loan Bank.
Bank owned life insurance- The carrying amounts of bank owned life insurance contracts approximate fair value.
Accrued Interest - The carrying amounts of accrued interest approximate fair value.
Deposits - The fair value of demand deposits, savings accounts, and certain money market deposits is the amount payable on demand at the reporting date. The fair value of fixed-maturities certificates of deposit is estimated using the rates currently offered for deposits of similar remaining maturities.
Advances from Federal Home Loan Bank - The fair value of advances is estimated using rates currently available for advances of similar remaining maturities.
Commitments - The fair value of commitments to extend credit was not significant.
The estimated fair values of the Company’s significant financial instruments are as follows at September 30, 2010 and 2009:
|
2010
|
2009
|
|||||||||||||||
|
Carrying
|
Estimated
|
Carrying
|
Estimated
|
|||||||||||||
|
amount
|
fair value
|
amount
|
fair value
|
|||||||||||||
|
Financial assets:
|
||||||||||||||||
|
Cash and cash equivalents
|
$ | 40,655 | $ | 40,655 | $ | 23,675 | $ | 23,675 | ||||||||
|
Investment securities
|
74,562 | 76,707 | 96,320 | 97,823 | ||||||||||||
|
FHLB stock
|
5,402 | 5,402 | 5,063 | 5,063 | ||||||||||||
|
Accrued interest receivable
|
2,480 | 2,480 | 2,622 | 2,622 | ||||||||||||
|
Life Insurance contracts
|
13,310 | 13,310 | 12,724 | 12,724 | ||||||||||||
|
Loans
|
595,891 | 630,812 | 595,333 | 624,129 | ||||||||||||
|
Less allowance for loan losses
|
9,256 | 9,256 | 6,806 | 6,806 | ||||||||||||
|
Loans-net of allowance
|
$ | 586,635 | $ | 621,556 | $ | 588,527 | $ | 617,323 | ||||||||
|
Financial liabilities:
|
||||||||||||||||
|
Deposits
|
$ | 579,355 | $ | 588,399 | $ | 585,469 | $ | 593,273 | ||||||||
|
Advances from Federal Home
|
||||||||||||||||
|
Loan Bank
|
$ | 100,017 | $ | 111,619 | $ | 100,628 | $ | 107,931 | ||||||||
|
Accrued interest payable
|
$ | 429 | $ | 429 | $ | 743 | $ | 743 | ||||||||
53
TECHE HOLDING COMPANY AND SUBSIDIARY
NOTES TO CONSOLIDATED FINANCIAL STATEMENTS
Years Ended September 30, 2010, 2009, and 2008
(in thousands except share and per share data)
18. REGULATORY CAPITAL
The Bank’s actual capital and its statutorily required capital levels were as follows:
|
2010
|
||||||||||||||||||||||||||
|
To be well
|
||||||||||||||||||||||||||
|
capitalized under
|
||||||||||||||||||||||||||
|
For capital
|
Prompt corrective
|
|||||||||||||||||||||||||
|
adequacy purposes
|
action provisions
|
|||||||||||||||||||||||||
|
Actual
|
Required
|
Required
|
||||||||||||||||||||||||
|
Amount
|
%
|
Amount
|
%
|
Amount
|
%
|
|||||||||||||||||||||
|
Core capital
|
$ | 64,220 | 8.5 | % | $ | 30,205 | 4.0 | % | $ | 37,757 | 5.0 | % | ||||||||||||||
|
Tangible capital
|
$ | 64,220 | 8.5 | % | $ | 11,327 | 1.5 | % | $ | N/A | N/A | |||||||||||||||
|
Total Risk based capital
|
$ | 70,772 | 13.5 | % | $ | 41,888 | 8.0 | % | $ | 52,360 | 10.0 | % | ||||||||||||||
|
Tier 1 Risk based capital
|
$ | 64,220 | 12.3 | % | $ | N/A | N/A | $ | 31,416 | 6.0 | % | |||||||||||||||
|
2009
|
||||||||||||||||||||||||||
|
To be well
|
||||||||||||||||||||||||||
|
capitalized under
|
||||||||||||||||||||||||||
|
For capital
|
Prompt corrective
|
|||||||||||||||||||||||||
|
adequacy purposes
|
action provisions
|
|||||||||||||||||||||||||
|
Actual
|
Required
|
Required
|
||||||||||||||||||||||||
|
Amount
|
%
|
Amount
|
%
|
Amount
|
%
|
|||||||||||||||||||||
|
Core capital
|
$ | 59,804 | 7.9 | % | $ | 30,332 | 4.0 | % | $ | 37,914 | 5.0 | % | ||||||||||||||
|
Tangible capital
|
$ | 59,804 | 7.9 | % | $ | 11,374 | 1.5 | % | $ | N/A | N/A | |||||||||||||||
|
Total Risk based capital
|
$ | 66,068 | 12.7 | % | $ | 41,560 | 8.0 | % | $ | 51,950 | 10.0 | % | ||||||||||||||
|
Tier 1 Risk based capital
|
$ | 59,804 | 11.5 | % | $ | N/A | N/A | $ | 31,170 | 6.0 | % | |||||||||||||||
The Bank is subject to various regulatory capital requirements administered by the federal banking agencies. Failure to meet minimum capital requirements can initiate certain mandatory and possibly additional discretionary actions by regulators that, if undertaken, could have a direct material effect on the Company’s and Bank’s financial statements. Under capital adequacy guidelines and the regulatory framework for prompt corrective action, the Bank must meet specific capital guidelines that involve quantitative measures of their assets, liabilities and certain off-balance-sheet items as calculated under regulatory accounting practices. The capital amounts and classification are also subject to qualitative judgments by the regulators about components, risk weightings, and other factors.
54
TECHE HOLDING COMPANY AND SUBSIDIARY
NOTES TO CONSOLIDATED FINANCIAL STATEMENTS
Years Ended September 30, 2010, 2009, and 2008
(in thousands except share and per share data)
Quantitative measures established by regulation to ensure capital adequacy require the Bank to maintain minimum amounts and ratios (set forth in the previous table) of risk-based capital (as defined in the regulations) to risk weighted assets (as defined), total Tier 1 capital (as defined in the regulations) to risk-weighted assets (as defined) and of Tier 1 capital (as defined) to average assets (as defined). Management believes, as of September 30, 2010 and 2009, that the Bank meets all capital adequacy requirements to which they are subject.
As of September 30, 2010, the most recent notification from its regulators categorized the Bank as well capitalized under the regulatory framework for prompt corrective action. To be categorized as well capitalized, an institution must maintain minimum total risk-based, Tier 1 core capital and Tier 1 leverage ratios as set forth in the previous tables. There are no conditions or events since the notification that management believes have changed the Bank’s category. The Bank’s actual capital amounts and ratios as of September 30, 2010 and 2009 are also presented in the previous tables.
The holding company does not have regulatory capital requirements, due to its status as a unitary thrift holding company.
|
19.
|
SUMMARIZED FINANCIAL INFORMATION OF TECHE HOLDING COMPANY (PARENT COMPANY ONLY)
|
Balance Sheets
|
2010
|
2009
|
|||||||
|
Assets:
|
||||||||
|
Investment in subsidiary
|
$ | 69,193 | $ | 65,116 | ||||
|
Cash and cash equivalents
|
4,989 | 4,732 | ||||||
|
Other
|
1,331 | 1,637 | ||||||
|
Total assets
|
$ | 75,513 | $ | 71,485 | ||||
|
Stockholders’ equity
|
$ | 75,513 | $ | 71,485 | ||||
55
TECHE HOLDING COMPANY AND SUBSIDIARY
NOTES TO CONSOLIDATED FINANCIAL STATEMENTS
Years Ended September 30, 2010, 2009, and 2008
(in thousands except share and per share data)
Statements of Earnings
|
Year ended September 30,
|
||||||||||||
|
2010
|
2009
|
2008
|
||||||||||
|
Dividends received from subsidiary
|
$
|
3,650
|
$
|
3,500
|
$
|
5,600
|
||||||
|
Equity in earnings of
|
||||||||||||
|
subsidiary (less than)
|
||||||||||||
|
greater than dividends received
|
3,704
|
3,956
|
520
|
|||||||||
|
Interest income from subsidiary
|
23
|
72
|
238
|
|||||||||
|
Management fees and other expenses
|
||||||||||||
|
allocated to the Parent
|
(77
|
)
|
(77
|
)
|
(77
|
)
|
||||||
|
Other expenses-net
|
(199
|
)
|
(315
|
)
|
(572
|
)
|
||||||
|
Net income
|
$
|
7,101
|
$
|
7,136
|
$
|
5,709
|
||||||
Statements of Cash Flows
|
Year ended September 30,
|
||||||||||||
|
2010
|
2009
|
2008
|
||||||||||
|
Cash flows from operating activities
|
$
|
3,190
|
$
|
3,170
|
$
|
5,554
|
||||||
|
Cash flows from investing activities:
|
||||||||||||
|
Purchase of securities available-for-sale
|
(178
|
)
|
(12
|
)
|
(499
|
)
|
||||||
|
Proceeds from sale of securities
|
577
|
201
|
-
|
|||||||||
|
Net cash provided (used) by
|
||||||||||||
|
investing activities
|
399
|
189
|
(499
|
)
|
||||||||
|
Cash flows from financing activities:
|
||||||||||||
|
Dividends paid
|
(2,945
|
)
|
(2,950
|
)
|
(2,963
|
)
|
||||||
|
Proceeds from exercise of stock options
|
(19
|
)
|
(14
|
)
|
257
|
|||||||
|
Loan to ESOP
|
260
|
(586
|
)
|
-
|
||||||||
|
Cash paid for purchase of
|
||||||||||||
|
common stock for treasury
|
(628
|
)
|
(921
|
)
|
(3,264
|
)
|
||||||
|
Net cash used in financing
|
||||||||||||
|
activities
|
(3,332
|
)
|
(4,471
|
)
|
(5,970
|
)
|
||||||
|
Net increase (decrease) in cash and cash equivalents
|
257
|
(1,112
|
)
|
(915
|
)
|
|||||||
|
Cash and cash equivalents - beginning of year
|
4,732
|
5,844
|
6,759
|
|||||||||
|
Cash and cash equivalents - end of year
|
$
|
4,989
|
$
|
4,732
|
$
|
5,844
|
||||||
Federal and state banking regulations place certain restrictions on dividends paid. The total amount of dividends, which may be paid at any date, is generally limited to the retained earnings of the Bank. The Company’s ability to pay dividends is dependent upon dividends received from the Bank. At September 30, 2010, the Bank’s retained earnings available for the payment of dividends was approximately $28.8 million. The Bank is required to file an application with the OTS prior to paying dividends to the Company. In addition, dividends paid by the Bank to the Company would be prohibited if the effect thereof would cause the Bank’s capital to be reduced below applicable minimum capital requirements.
56
TECHE HOLDING COMPANY AND SUBSIDIARY
NOTES TO CONSOLIDATED FINANCIAL STATEMENTS
Years Ended September 30, 2010, 2009, and 2008
(in thousands except share and per share data)
|
20.
|
SUBSEQUENT EVENTS
|
Certain of the bank’s advances with FHLB were refinanced on December 2, 2010. The financial benefit to the Company by performing the transaction was to lower the current FHLB advance interest rates while also extending the maturity of the advances to take advantage of the current low interest rate environment. The refinancing reduced the weighted average interest rate to 4.46% and the updated maturity schedule of advances is as follows:
|
Year Ended
|
||||
|
September 30,
|
||||
|
2011
|
$ | 20,671 | ||
|
2012
|
4,384 | |||
|
2013
|
4,605 | |||
|
2014
|
9,837 | |||
|
2015
|
8,081 | |||
|
Thereafter
|
52,439 | |||
|
|
$ | 100,017 | ||
******
57
|
DIRECTORS OF TECHE HOLDING COMPANY
|
||||
|
AND
|
||||
|
TECHE FEDERAL BANK
|
||||
|
Patrick O. Little, Chairman
|
Donelson T. Caffery, Jr.
|
Henry L. Friedman
|
W. Ross Little, Jr.
|
|
|
William A. Anderson, III
|
J. L. Chauvin
|
Robert J. Judice, Jr.
|
Robert L. Wolfe, Jr.
|
|
|
Mary Coon Biggs
|
Ernest Freyou
|
Dr. Thomas F. Kramer
|
Robert E. Mouton – Director Emeritus
|
|
|
Maunette B. Risher - Advisory
|
||||
|
OFFICERS OF TECHE FEDERAL BANK
|
|
Patrick O. Little
|
Chairman, President/CEO
|
Tina M. Vidrine
|
Vice President
|
||
|
Darryl Broussard
|
Sr. Vice President/CLO
|
Daniel E. Adler, Sr.
|
Assistant Vice President
|
||
|
J. L. Chauvin
|
Sr. Vice President/Treasurer/CFO
|
Terry T. Albarado
|
Assistant Vice President
|
||
|
Jason P. Freyou
|
Sr. Vice President/ COO
|
Montreen D. Badeaux
|
Assistant Vice President
|
||
|
Eddie R. LeBlanc
|
Sr. Vice President/Internal Auditor
|
Paulette A. Boudreaux
|
Assistant Vice President
|
||
|
W. Ross Little, Jr.
|
Sr. Vice President/Secretary/CRO
|
Toya Broussard
|
Assistant Vice President
|
||
|
Tom A. Aldrich
|
Vice President
|
Lisa Burleigh
|
Assistant Vice President
|
||
|
Angela Badeaux
|
Vice President
|
Jeanette D. Charles
|
Assistant Vice President
|
||
|
F. William Ball
|
Vice President
|
Angela M. Cliburn
|
Assistant Vice President
|
||
|
Patricia O. Begnaud
|
Vice President
|
Stephanie F. Dandry
|
Assistant Vice President
|
||
|
Genevieve V. Bihm
|
Vice President
|
Patrick Fontenot
|
Assistant Vice President
|
||
|
Georgia B. Boudreaux
|
Vice President
|
Debra A. Guidry
|
Assistant Vice President
|
||
|
Elmo P. Boudreaux, Jr.
|
Vice President
|
Henrietta S. Hollier
|
Assistant Vice President
|
||
|
Irma Nell Bourque
|
Vice President
|
Christina Irvin-Simpson
|
Assistant Vice President
|
||
|
Bart C. Boyer
|
Vice President
|
Christy B. Istre
|
Assistant Vice President
|
||
|
Mary Beth Brady
|
Vice President
|
Barbara A. Jesset
|
Assistant Vice President
|
||
|
Judy V. Breaux
|
Vice President
|
Anne P. Jones
|
Assistant Vice President
|
||
|
Glen W. Brown
|
Vice President
|
Jason D. Kennemer
|
Assistant Vice President
|
||
|
Kevin T. Caswell
|
Vice President
|
Debbie M. Lancon
|
Assistant Vice President
|
||
|
Belinda Cavazos
|
Vice President
|
Vicki L. Laubach
|
Assistant Vice President
|
||
|
S. Michael Comeaux
|
Vice President
|
Janna Leblanc
|
Assistant Vice President
|
||
|
Gwendoline Doucet
|
Vice President
|
Angel LeCompte
|
Assistant Vice President
|
||
|
Dalie S. Eldridge
|
Vice President
|
Monique McBride
|
Assistant Vice President
|
||
|
Elaine H. Gussman
|
Vice President
|
Vanessa McGehee
|
Assistant Vice President
|
||
|
Karen Hardy
|
Vice President
|
Cindy F. North
|
Assistant Vice President
|
||
|
Constance E. Harris
|
Vice President
|
Aaron Ortego
|
Assistant Vice President
|
||
|
Chad Hebert
|
Vice President
|
Wendell Richard
|
Assistant Vice President
|
||
|
Scott P. Landrum
|
Vice President
|
Lindsey Robinson-Jones
|
Assistant Vice President
|
||
|
D. Ross Landry
|
Vice President
|
Linda Roman
|
Assistant Vice President
|
||
|
Angelina M. Mire
|
Vice President
|
Lesley E. Schexnayder
|
Assistant Vice President
|
||
|
Bryan Rowell
|
Vice President
|
Tanya Thibodeaux
|
Assistant Vice President
|
||
|
Susan L. Simoneaux
|
Vice President
|
Ashley Townley
|
Assistant Vice President
|
||
|
Martin M. Vasquez
|
Vice President
|
Leslie White
|
Assistant Vice President
|
||
|
INDEPENDENT AUDITORS
|
SPECIAL COUNSEL
|
ST. LANDRY ADVISORY BOARD
|
|||
|
Dixon Hughes PLLC
|
Malizia Spidi & Fisch, PC
|
Wayne M. Gilmore, Chairman
|
|||
|
225 Peachtree Street NE, Suite 600
|
1227 25th Street, N.W.
|
H. Kent Aguillard
|
|||
|
Atlanta, GA 30303
|
Suite 200 West
|
Anna Lee Dunbar
|
|||
|
Washington, DC 20037
|
Lynette Young Feucht
|
||||
|
Patrick Fontenot
|
|||||
|
LEGAL COUNSEL
|
REGISTRAR AND STOCK
|
Simon Howard Fournier
|
|||
|
Biggs, Supple, Cremaldi and Curet, LLP
|
TRANFER AGENT
|
Morgan J. Goudeau, III
|
|||
|
Lawless Building
|
Registrar and Transfer Company
|
Martin A. Roy, Jr.
|
|||
|
Willow Street
|
10 Commerce Drive
|
Marvin Schwartzenburg
|
|||
|
Franklin, LA 70538
|
Cranford, NJ 07016-3572
|
||||
|
(800) 525-7686
|
|||||
|
Fax (908) 272-1006
|
|||||
58