Attached files
| file | filename |
|---|---|
| 8-K - FORM 8-K - Kraton Corp | d8k.htm |
 Bank
of America Merrill Lynch Global Industries Conference
December 14, 2010
Exhibit 99.1 |
 Forward-Looking Statement Disclaimer
This
presentation
may
include
“forward-looking
statements”
that
reflect
our
plans,
beliefs,
expectations
and
current
views
with
respect
to,
among
other
things,
future
events
and
financial
performance.
Forward-looking
statements
are
often
characterized
by
the
use
of
words
such
as
“believes,”
“estimates,”
“expects,”
“projects,”
“may,”
“intends,”
“plans”
or
“anticipates,”
or
by
discussions
of
strategy,
plans
or
intentions.
All
forward-looking
statements
in
this
presentation
are
made
based
on
management's
current
expectations
and
estimates,
which
involve
risks,
uncertainties
and
other
factors
that
could
cause
actual
results
to
differ
materially
from
those
expressed
in
forward-looking
statements.
Readers
are
cautioned
not
to
place
undue
reliance
on
forward-looking
statements.
These
risks
and
uncertainties
are
more
fully
described
in
“Part
I.
Item
1A.
Risk
Factors”
contained
in
our
Annual
Report
on
10-K,
as
filed
with
the
Securities
and
Exchange
Commission
and
as
subsequently
updated
in
our
Quarterly
Reports
on
Form
10-Q,
and
include
risks
related
to:
conditions
in
the
global
economy
and
capital
markets;
our
reliance
on
LyondellBasell
Industries
for
the
provision
of
significant
operating
and
other
services;
the
failure
of
our
raw
materials
suppliers
to
perform
their
obligations
under
long-term
supply
agreements,
or
our
inability
to
replace
or
renew
these
agreements
when
they
expire;
limitations
in
the
availability
of
raw
materials
we
need
to
produce
our
products
in
the
amounts
or
at
the
prices
necessary
for
us
to
effectively
and
profitably
operate
our
business;
competition
in
our
end-use
markets,
by
other
producers
of
SBCs
and
by
producers
of
products
that
can
be
substituted
for
our
products;
our
ability
to
produce
and
commercialize
technological
innovations;
our
ability
to
protect
our
intellectual
property,
on
which
our
business
is
substantially
dependent;
infringement
of
our
products
on
the
intellectual
property
rights
of
others;
seasonality
in
our
Paving
and
Roofing
business;
financial
and
operating
constraints
related
to
our
substantial
level
of
indebtedness;
product
liability
claims
and
other
lawsuits
arising
from
environmental
damage
or
personal
injuries
associated
with
chemical
manufacturing;
political
and
economic
risks
in
the
various
countries
in
which
we
operate;
the
inherently
hazardous
nature
of
chemical
manufacturing;
health,
safety
and
environmental
laws,
including
laws
that
govern
our
employees’
exposure
to
chemicals
deemed
harmful
to
humans;
regulation
of
our
customers,
which
could
affect
the
demand
for
our
products
or
result
in
increased
compliance
costs;
international
trade,
export
control,
antitrust,
zoning
and
occupancy
and
labor
and
employment
laws
that
could
require
us
to
modify
our
current
business
practices
and
incur
increased
costs;
our
relationship
with
our
employees;
loss
of
key
personnel
or
our
inability
to
attract
and
retain
new
qualified
personnel;
fluctuations
in
currency
exchange
rates
;
the
fact
that
we
do
not
enter
into
long-term
contracts
with
our
customers;
a
decrease
in
the
fair
value
of
our
pension
assets,
which
could
require
us
to
materially
increase
future
funding
of
the
pension
plan;
and
concentration
of
ownership
among
our
principal
stockholder,
which
may
prevent
new
investors
from
influencing
significant
corporate
decisions.
We
assume
no
obligation
to
update
such
information.
Further
information
concerning
issues
that
could
materially
affect
financial
performance
related
to
forward
looking
statements
can
be
found
in
our
periodic
filings
with
the
Securities
and
Exchange
Commission.
2 |
 GAAP
Disclaimer 3
This
presentation
includes
the
use
of
both
GAAP
(generally
accepted
accounting
principles)
and
non-GAAP
financial
measures.
The
non-GAAP
financial
measures
are
EBITDA
and
Adjusted
EBITDA.
The
most
directly
comparable
GAAP
financial
measure
is
net
income/loss.
A
reconciliation
of
the
non-GAAP
financial
measures
used
in
this
presentation
to
the
most
directly
comparable
GAAP
measure
is
included
herein.
We
consider
EBITDA
and
Adjusted
EBITDA
important
supplemental
measures
of
our
performance
and
believe
they
are
frequently
used
by
investors
and
other
interested
parties
in
the
evaluation
of
companies
in
our
industry.
EBITDA
and
Adjusted
EBITDA
have
limitations
as
analytical
tools
and
should
not
be
considered
in
isolation
or
as
a
substitute
for
analysis
of
our
results
under
GAAP
in
the
United
States. |
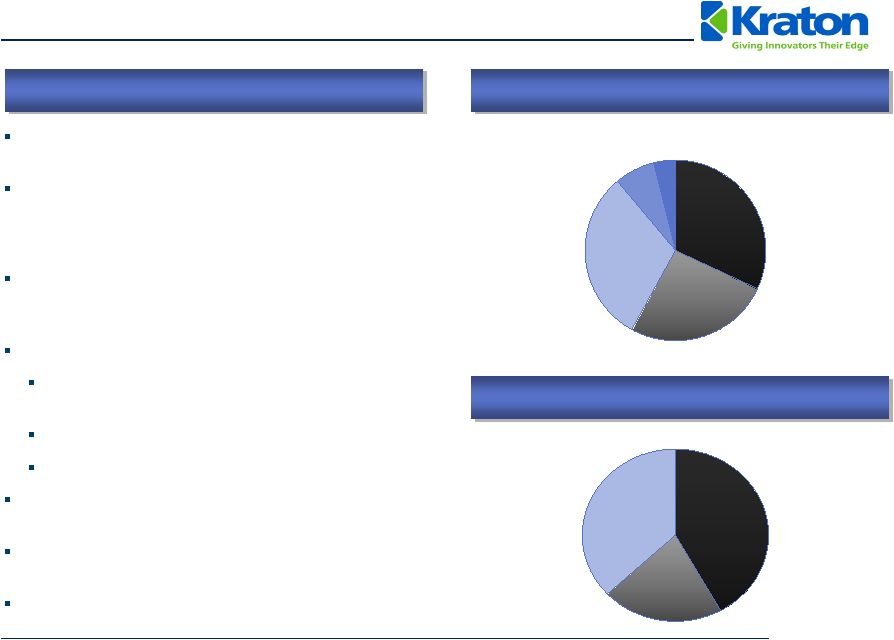 37%
21%
42%
4
4%
7%
31%
26%
32%
Kraton
Overview
We invented and commercialized Styrenic
Block
Copolymer (SBC) technology nearly 50 years ago.
We believe that we hold #1 market share positions in
each of our end-use markets providing industrial,
consumer and geographical diversification that is
second to none.
We design and manufacture customized SBC polymer
and compound solutions to meet our leading customers’
specific innovation needs.
We produce the following:
Unhydrogenated
Styrenic
Block Copolymers
(USBCs).
Hydrogenated Styrenic
Block Copolymers (HSBCs).
Isoprene Rubber and Isoprene Rubber Latex.
We currently offer approximately 800 products to more
than 700 customers, in over 60 countries.
We employ approximately 830 people in 9 locations in
all major regions of the world.
YTD September 2010 revenue of $940 million and
Adjusted EBITDA
(1)
of $161 million; 17% margin.
(1)
Adjusted EBITDA is GAAP EBITDA excluding management fees, restructuring and related
charges, non-cash expenses, and the gain on extinguishment of
debt. (2)
Management estimates.
2009
Revenue
by
End-Use
(2)
2009
Revenue
by
Geography
(2)
North and
South
America
Europe,
Middle
East &
Africa
Asia Pacific
Paving and
Roofing
Adhesives,
Sealants and
Coatings
Other
Emerging
Businesses
Advanced
Materials
Clear SBC Market Leader Globally |
 5
SBCs
are engineered to meet customer needs
Primary Raw
Materials
Products
Customer Value
End-Use Applications
Styrene
Unhydrogenated
SBCs
SBS
SIS
SIBS
Butadiene
Isoprene
Hydrogenated
SBCs
SEBS
SEPS
Isoprene Rubber
and Latex
Compounds
Paving
Roofing
Personal Care
Tapes
Formulators
Labels
&
Printing
Compounds
Packaging
Auto
Lubricants
Medical
Stretch
Soft-Touch
Adhesion
Impact
Resistance
Durability
Thickening
Compatibility
Clarity
Recyclability
Kraton
is the only provider of these value components across
all products touching a wide array of applications |
 6
Clear Leader in Attractive Markets
Market Position
2009 Revenue
(1)
#1
77%
Adhesives, Sealants,
and Coatings
Advanced Materials
#1
74%
Paving and Roofing
#1
63%
Emerging Businesses
(4)
#1
100%
32%
31%
26%
7%
1.9x
2.0x
1.6x
N/A
Source:
Management estimates.
(1)
Based on 2009 sales of $920 million (excludes by-product sales which are
reported as other revenues). (2)
Industry
volume
growth
from
2001-2009,
Emerging
Businesses
growth
rate
refers
to
Kraton’s
Isoprene
Rubber
(“IR”)
and
Isoprene
Rubber
Latex
(“IRL”)
growth
from
2005-2009.
(3)
Management’s estimates vs. next largest competitor based on 2009 sales.
(4)
The
Emerging
Businesses
end
use
market
includes
our
IR
and
IRL
business.
We
believe
that
we
are
the
only
major
third-party
supplier
of
IR
and
IRL,
and
therefore
end
use
market
share
metrics
are
not meaningful.
#1 Market Position and More than 1.6x the Size of Our Closest Competitors
Top 4 Market
Share
Kraton
Market
Share Relative
To #2
Competitor
(3)
Growth
(2)
5.9%
7.4%
6.5%
26.8% |
     7
Before Kraton
After Kraton
Kraton
Makes Products Better
Stretch in legs only
(Spandex).
Not a fitted garment.
High leakage rate.
Overall improvement in stretch
(where it’s needed).
Better fit.
Low leakage rate.
Kraton
market share: 50%.
2001 –
2009 CAGR: 11.5%.
Kraton
material as % of Diaper cost: <2%
Phthalate plasticizers
are used to make PVC
soft but they can leach
from finished products
and create health
concerns.
Limited recyclability.
PVCs
are unsafe when
burned or incinerated
improperly.
Environmentally friendly –
100% recyclable.
Kraton
imparts softness, toughness and clarity.
Plasticizer & chlorine free.
Kraton material as % of finished product cost: <5%
|
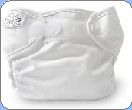
 8
SBCs
Are a Growth Industry
SBC Industry Volume (kT)
(1)
SBCs
Grow Faster Than GDP
Adoption and penetration of SBCs
into new
applications and end-markets lead to
industry growth of ~2x GDP.
Growing demand from emerging
economies.
Innovation and new SBC product
introductions.
End use application growth (e.g., PVC
alternatives for wire & cable and medical
applications such as IV bags, etc.).
Growing demand for environmentally friendly
and greener alternatives in electronics, medical
and baby care markets.
Low cost relative to value added /
performance with limited substitution risk.
(1)
Management
estimates.
Excludes
footwear
end-use
in
which
Kraton
does
not
actively
compete.
675
1,112
1,599
2001
2009
2014 |
 9
Sustainable Competitive Advantages
Almost 50 years of process know-how and expertise.
Performance-critical products and manufacturing
complexity.
Technical
Barriers
Globally
recognized
brand
–
Kraton
®.
Industry-leading R&D infrastructure.
Global low-cost manufacturing footprint.
Significant regulatory hurdles / barriers to new
manufacturing sites.
Stable raw material base with multiple sources of
supply and contracts / relationships.
Collaborative
customer
relationships
–
15+
years
with
majority; sole source with several customers.
Infrastructure
Barriers
Superior and
Innovative Products
+
High Customer
Switching Costs
+
Long-Term
Customers
Relationships
=
Leading
Market Position
Products designed collaboratively to meet specific
customer needs / applications.
Preferred partner based on manufacturing
consistency and process know-how.
Ongoing technical service offering.
100% of products offered with no lead times.
High
Value
Added |
 Compelling Organic Growth Platforms
10
Advanced
Materials
Adhesives,
Sealants &
Coatings
Paving and
Roofing
Emerging markets growth.
Expansion into new and differentiated markets, such as
protective films, oilfield service applications, spray and
extrusion coatings, hot melt adhesives, elastic adhesives,
labels and sealant applications.
Superior performing SBS modified emulsions for
asphalt
modification.
Low VOC roof coating formulations for superior water
resistance, improved adhesion and reduced installation
cost.
“Green”
PVC alternatives to the wire and cable industry.
Enabling technology for high performance fabric solutions.
“Soft Touch”
covers and solutions to the automotive
industry.
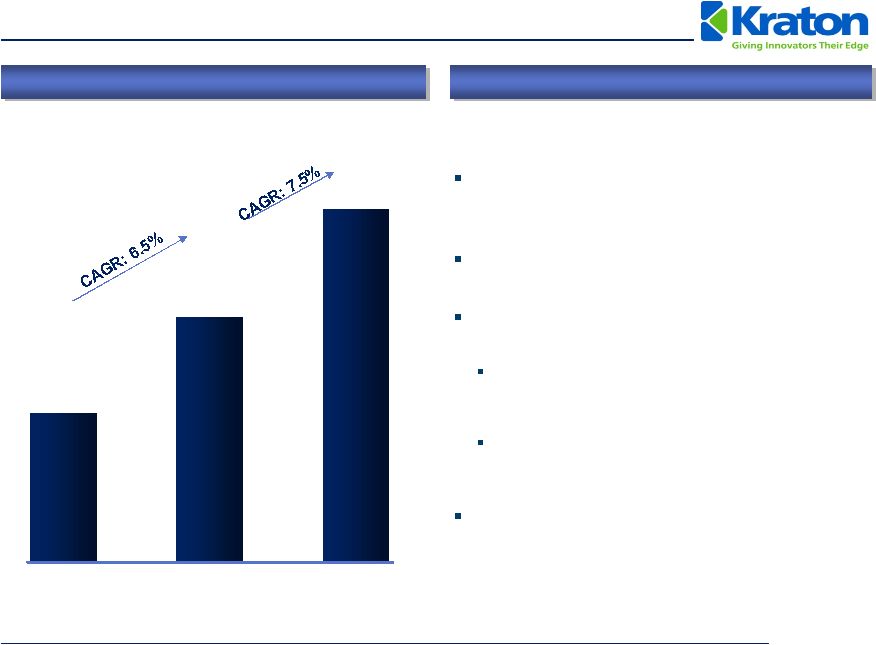
NEXAR
®
–
high-end membrane technology markets for
performance clothing, HVAC applications and fuel cells.
Co-extrusion technology for surface protection.
Applications
Isoprene
Rubber Latex
Medical
applications
–
surgical
gloves.
Material
substitution
–
condoms.
Medical components
HiMA
Protective Films
Soft Skins
IRL Gloves |
 Protective Films
Lower System Costs
One-step co-extrusion process eliminates multi-
step coating and drying of conventional films
Superior Protection
Resists dimples, rigid wrinkles, and moisture
permeation
Preserves integrity of finished surfaces and
protects against marring, scratching, and UV
tainting
High Flexibility and Customizable Peel Strength
Sustains tack on curved and textured surfaces
Tailored peel strength properties
Adheres to a wide variety of substrate
chemistries and topographies
Clean Film
Haze and residue-free formulation
Displays finished goods well
VOC-free
Simple removal |
 NEXAR
TM
Polymer
Technology
FIRST RESPONDERS
MILITARY
Applications
Fabrics for performance garments
HVAC
Humidification / Gas drying
Nano
filtration
Features
Superior moisture vapor transport
properties
Water transport properties increase as
temperatures increase
Excellent mechanical properties and wet
strength
High perm selectivity
Chemical resistance
Not soluble in water
Nexar™
may be used on current casting or
laminating equipment
NEXAR polymer technology combines exceptional water
transport for increase comfort with structure, function
and reliability. |
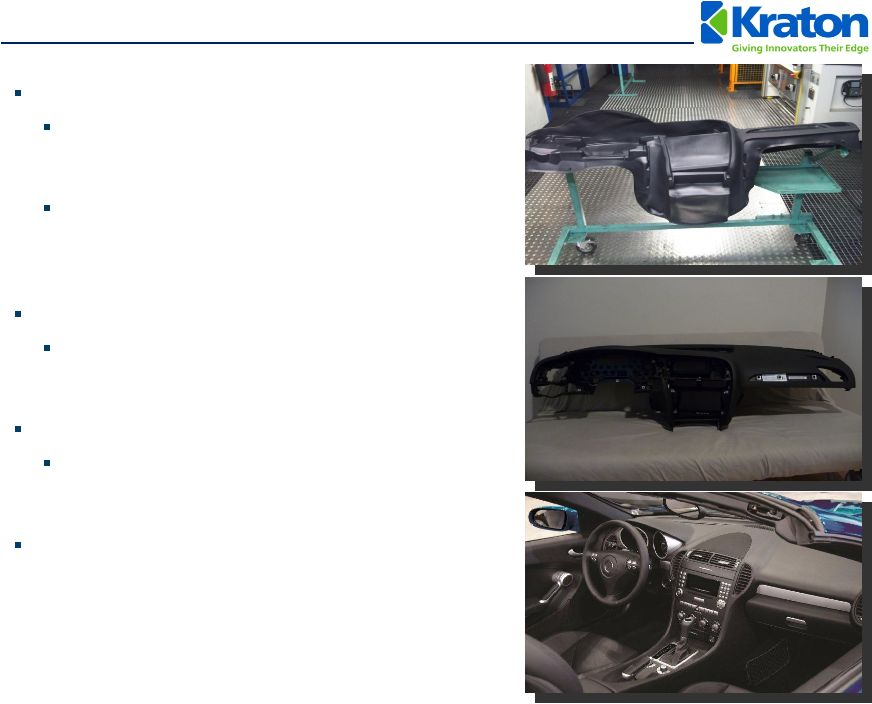 Slush
Molded Automotive Soft Skins Higher performance
Meets stringent requirements of the
automotive industry such as low melt
viscosity
Provides improvements on low
temperature ductility, dimensional
stability and emission values compared
to existing solutions.
Lighter weight
Lower specific gravity which provides a
30% weight reduction compared to PVC
and TPU at the same skin dimensions.
Lower cost
Can be processed
on existing slush
molding machines at lower process
temperatures and faster cycle times.
Environmentally-sustainable |
 Features & Benefits
No protein
Low residual metals
Low gel content
No odour
Excellent transparency
Cariflex
is used:
As feedstock for IR Latex
In medical applications
In polymer modifications that are sensitive
to impurities (speciality paints & coatings,
electrical insulators)
Natural Rubber
Cariflex™
IR
Competitive IR
Cariflex
TM
Isoprene
Rubber |
 Alternatives to PVC
Current focus on wire & cable and
medical applications
Features and benefits of Kraton
offering:
No plasticizers
Necessary for lower hardness
and improved processing
Address health concerns in
medical application
Better compatibility with PP than
conventional SEBS
Improved clarity, better impact
modification of PP
High melt flow
Low shear processing possible
Easy molding of thin parts
High flow elastic compounds for fiber
Recyclable |
 27
62
149
2001
2009
2014
Investing for Growth In Asia
16
Asia Pacific SBC market –
53% of
global SBC consumption by volume in
2009
(1)
YTD September 2010, Asia Pacific
accounted for 20% of our total
revenue, with 46% derived from
higher margin HSBC products
In 2010 relocated Shanghai, China
office to a new facility (double the size
of the previous location)
Expanded warehouse capacity in
Shanghai Waigaoqiao Free Trade
Zone
Proposed HSBC expansion in Asia
Forecast strong worldwide growth in HSBC
driven by innovation
Initiated project assessment for a new 30 kT
per year HSBC plant in Asia
Site selection by early 2011 with start-up
planned for second half of 2013
Asia is an important component of Kraton’s growth strategy
(1)
Management estimates. Includes SBC consumption for footwear, a market in which
Kraton does not actively compete. Asian HSBC Industry Demand Trends (kT)
|
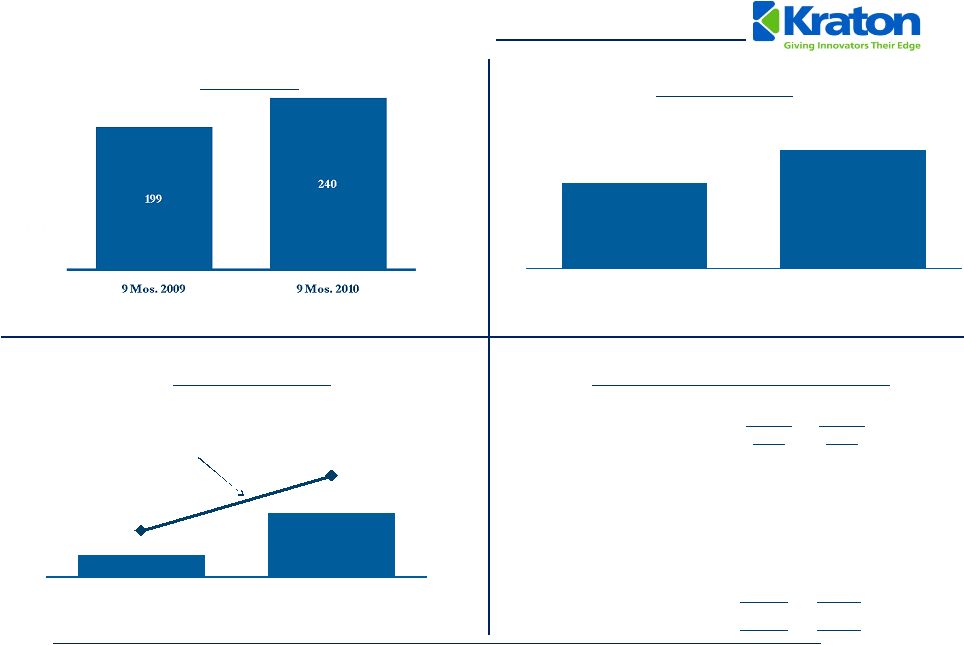 Volume (kT)
Selected Financial Trends
17
Sales
Revenue
(1)
(US $ in Millions)
Adjusted
EBITDA
(2)
(US $ in Millions)
9 Mos.
2009
9 Mos.
2010
EBITDA
$
67.1
$155.1
Management fees and expenses
1.5
---
Restructuring and related
charges
7.5
2.7
Gain on extinguishment of debt
(23.8)
---
Other non-cash expenses
4.0
2.8
Adjusted
EBITDA
(2)
$56.3
$160.6
EBITDA
to
Adjusted
EBITDA
(2)
Walk
(US $ in Millions)
$56
$161
7.9%
17.1%
0
10
20
30
40
50
60
70
80
90
100
110
120
130
140
150
160
170
180
190
200
210
220
230
240
250
260
270
280
290
300
9 Mos. 2009
9 Mos. 2010
$682
$940
$0
$50
$100
$150
$200
$250
$300
$350
$400
$450
$500
$550
$600
$650
$700
$750
$800
$850
$900
$950
$1,000
9 Mos. 2009
9 Mos. 2010
Adjusted
EBITDA
Margin
(1)
Excludes by-product revenue.
(2)
Adjusted EBITDA is GAAP EBITDA excluding management fees, restructuring and
related charges, non-cash expenses, and the gain on extinguishment of
debt. |
 Selected 2010 Estimates
YTD September
2010 Estimate
Working capital (excluding cash) as
a % of revenue
~25%
Capital spending
$32.3
$50 to $55 million
Interest expense
$18.5
$24 to $25 million
Restructuring charges
$4 to $5 million
Depreciation and amortization
$36.0
$48 to $50 million
Book tax rate
14% to 15%
18 |