Attached files
| file | filename |
|---|---|
| 8-K - 8-K - HEALTHPEAK PROPERTIES, INC. | a10-22611_68k.htm |
Exhibit 99.1
|
|
Acquisitions Overview December 2010 |
|
|
Forward-Looking Statements Some of the statements in this presentation may be “forward-looking statements” and HCP intends such forward-looking statements to be covered by the safe harbor provisions contained in the Private Securities Litigation Reform Act of 1995. You are cautioned that forward-looking statements are not guarantees of future performance and are subject to known and unknown risks and uncertainties as more fully described in news releases and SEC reports filed by HCP, including those risk factors described in HCP’s annual report on Form 10-K for the year ended December 31, 2009. Actual results may differ materially from the expectations contained in the forward-looking statements as a result of various factors. HCP assumes no, and hereby disclaims any, obligation to update or revise the forward-looking statements contained in this presentation, whether as a result of changes in underlying facts, new information, future events or otherwise. |
|
|
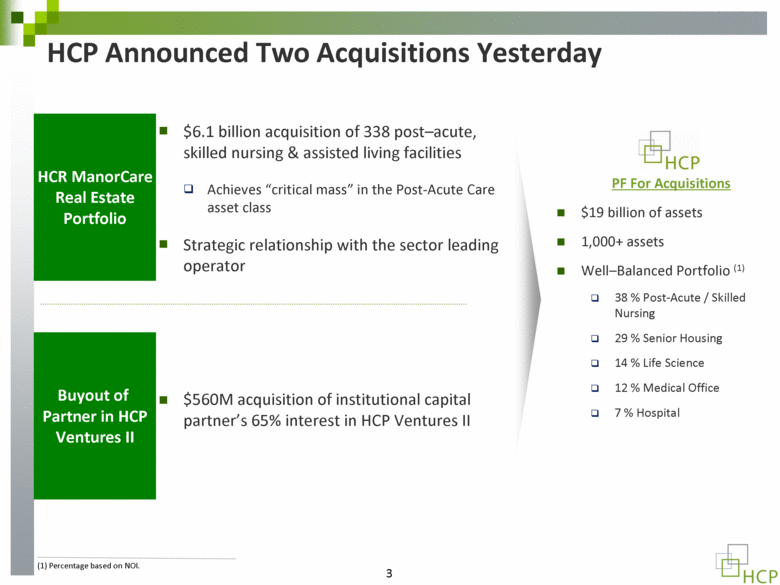
HCP Announced Two Acquisitions Yesterday PF For Acquisitions $19 billion of assets 1,000+ assets Well–Balanced Portfolio (1) 38 % Post-Acute / Skilled Nursing 29 % Senior Housing 14 % Life Science 12 % Medical Office 7 % Hospital HCR ManorCare Real Estate Portfolio Buyout of Partner in HCP Ventures II $6.1 billion acquisition of 338 post–acute, skilled nursing & assisted living facilities Achieves “critical mass” in the Post-Acute Care asset class Strategic relationship with the sector leading operator $560M acquisition of institutional capital partner’s 65% interest in HCP Ventures II (1) Percentage based on NOI. |
|
|
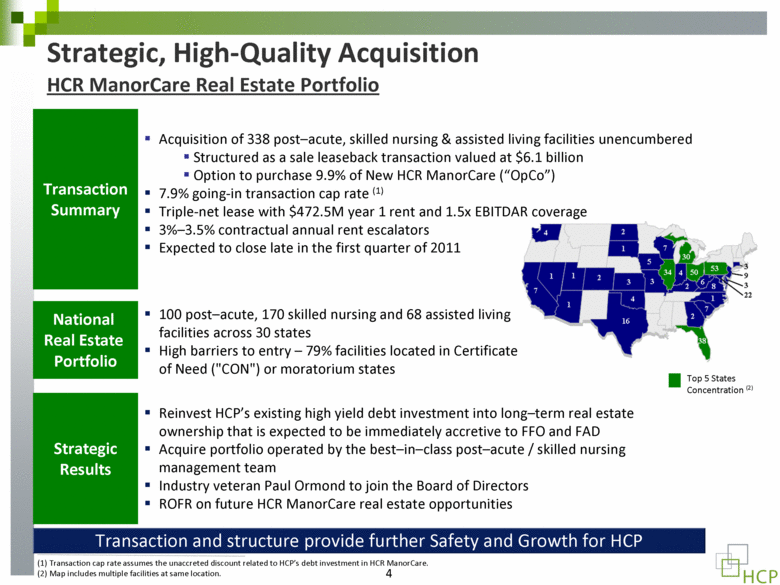
National Real Estate Portfolio Transaction and structure provide further Safety and Growth for HCP Strategic, High-Quality Acquisition HCR ManorCare Real Estate Portfolio Transaction Summary Strategic Results (1) Transaction cap rate assumes the unaccreted discount related to HCP’s debt investment in HCR ManorCare. (2) Map includes multiple facilities at same location. Top 5 States Concentration (2) Reinvest HCP’s existing high yield debt investment into long–term real estate ownership that is expected to be immediately accretive to FFO and FAD Acquire portfolio operated by the best–in–class post–acute / skilled nursing management team Industry veteran Paul Ormond to join the Board of Directors ROFR on future HCR ManorCare real estate opportunities Acquisition of 338 post–acute, skilled nursing & assisted living facilities unencumbered Structured as a sale leaseback transaction valued at $6.1 billion Option to purchase 9.9% of New HCR ManorCare (“OpCo”) 7.9% going-in transaction cap rate (1) Triple-net lease with $472.5M year 1 rent and 1.5x EBITDAR coverage 3%–3.5% contractual annual rent escalators Expected to close late in the first quarter of 2011 100 post–acute, 170 skilled nursing and 68 assisted living facilities across 30 states High barriers to entry – 79% facilities located in Certificate of Need ("CON") or moratorium states |
|
|
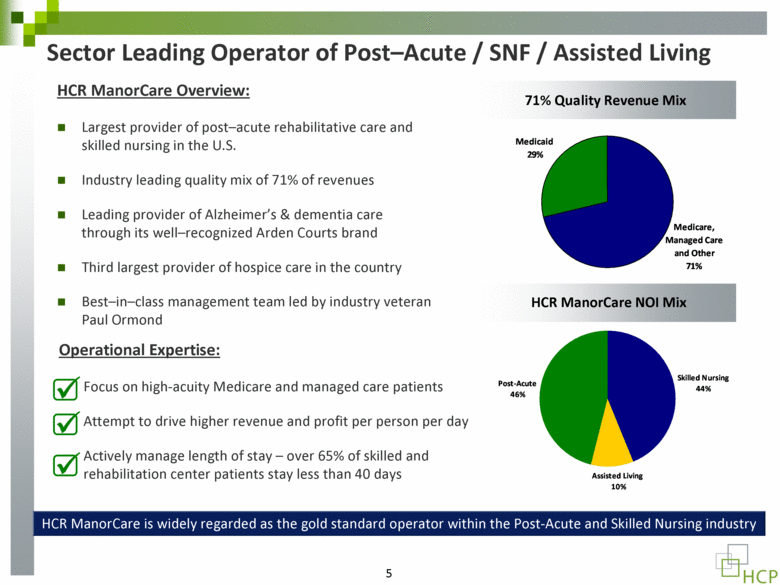
Sector Leading Operator of Post–Acute / SNF / Assisted Living HCR ManorCare Overview: Largest provider of post–acute rehabilitative care and skilled nursing in the U.S. Industry leading quality mix of 71% of revenues Leading provider of Alzheimer’s & dementia care through its well–recognized Arden Courts brand Third largest provider of hospice care in the country Best–in–class management team led by industry veteran Paul Ormond Operational Expertise: Focus on high-acuity Medicare and managed care patients Attempt to drive higher revenue and profit per person per day Actively manage length of stay – over 65% of skilled and rehabilitation center patients stay less than 40 days HCR ManorCare NOI Mix 71% Quality Revenue Mix HCR ManorCare is widely regarded as the gold standard operator within the Post-Acute and Skilled Nursing industry Medicaid 29% Medicare, Managed Care and Other 71% Skilled Nursing 44% Assisted Living 10% Post-Acute 46% |
|
|
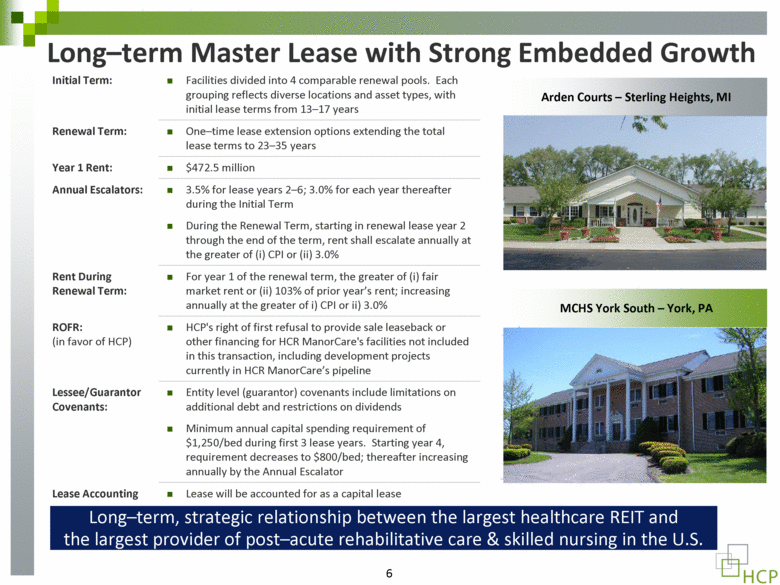
Long–term Master Lease with Strong Embedded Growth Long–term, strategic relationship between the largest healthcare REIT and the largest provider of post–acute rehabilitative care & skilled nursing in the U.S. Arden Courts – Sterling Heights, MI MCHS York South – York, PA Entity level (guarantor) covenants include limitations on additional debt and restrictions on dividends Minimum annual capital spending requirement of $1,250/bed during first 3 lease years. Starting year 4, requirement decreases to $800/bed; thereafter increasing annually by the Annual Escalator Lessee/Guarantor Covenants: For year 1 of the renewal term, the greater of (i) fair market rent or (ii) 103% of prior year’s rent; increasing annually at the greater of i) CPI or ii) 3.0% Rent During Renewal Term: One–time lease extension options extending the total lease terms to 23–35 years Renewal Term: Facilities divided into 4 comparable renewal pools. Each grouping reflects diverse locations and asset types, with initial lease terms from 13–17 years Initial Term: 3.5% for lease years 2–6; 3.0% for each year thereafter during the Initial Term During the Renewal Term, starting in renewal lease year 2 through the end of the term, rent shall escalate annually at the greater of (i) CPI or (ii) 3.0% Annual Escalators: $472.5 million Year 1 Rent: HCP's right of first refusal to provide sale leaseback or other financing for HCR ManorCare's facilities not included in this transaction, including development projects currently in HCR ManorCare’s pipeline ROFR: (in favor of HCP) Lease will be accounted for as a capital lease Lease Accounting |
|
|
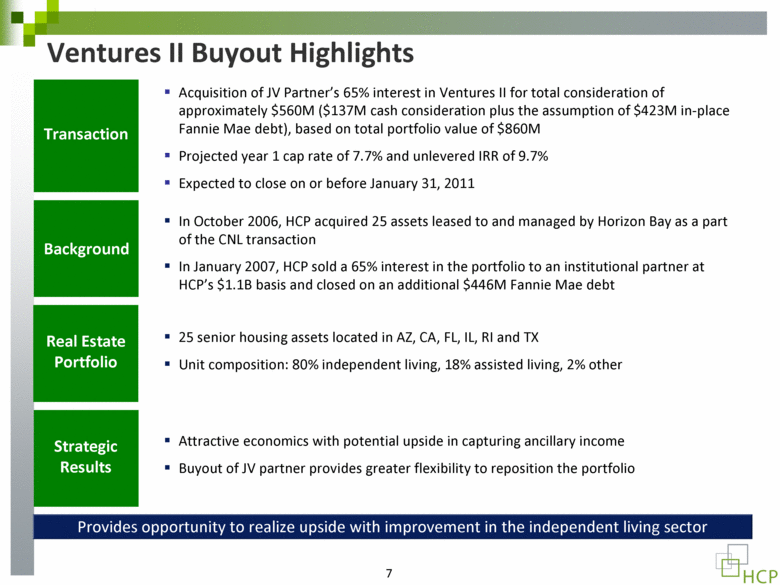
Ventures II Buyout Highlights Transaction Acquisition of JV Partner’s 65% interest in Ventures II for total consideration of approximately $560M ($137M cash consideration plus the assumption of $423M in-place Fannie Mae debt), based on total portfolio value of $860M Projected year 1 cap rate of 7.7% and unlevered IRR of 9.7% Expected to close on or before January 31, 2011 In October 2006, HCP acquired 25 assets leased to and managed by Horizon Bay as a part of the CNL transaction In January 2007, HCP sold a 65% interest in the portfolio to an institutional partner at HCP’s $1.1B basis and closed on an additional $446M Fannie Mae debt 25 senior housing assets located in AZ, CA, FL, IL, RI and TX Unit composition: 80% independent living, 18% assisted living, 2% other Attractive economics with potential upside in capturing ancillary income Buyout of JV partner provides greater flexibility to reposition the portfolio Background Real Estate Portfolio Strategic Results Provides opportunity to realize upside with improvement in the independent living sector |
|
|
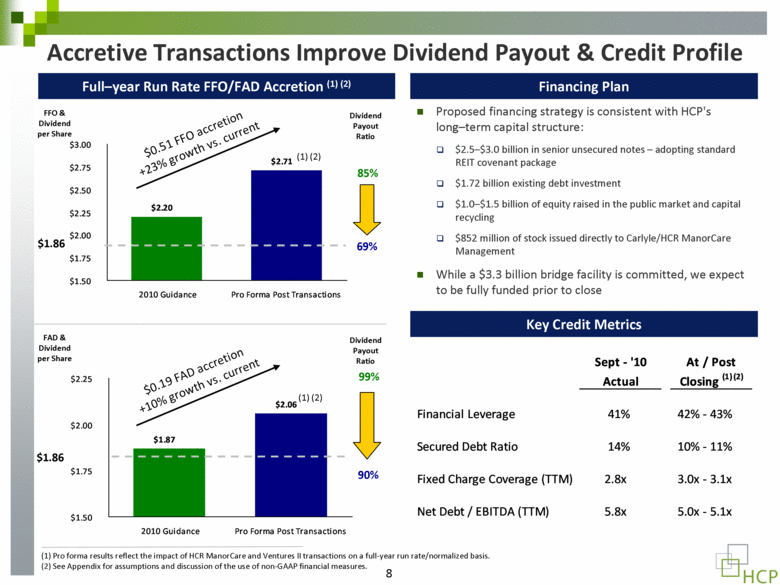
Accretive Transactions Improve Dividend Payout & Credit Profile Pro forma results reflect the impact of HCR ManorCare and Ventures II transactions on a full-year run rate/normalized basis. See Appendix for assumptions and discussion of the use of non-GAAP financial measures. Full–year Run Rate FFO/FAD Accretion (1) (2) FFO & Dividend per Share Dividend Payout Ratio 85% 69% 99% 90% $1.86 $1.86 $0.51 FFO accretion +23% growth vs. current $0.19 FAD accretion +10% growth vs. current FAD & Dividend per Share Dividend Payout Ratio Key Credit Metrics Financing Plan Proposed financing strategy is consistent with HCP's long–term capital structure: $2.5–$3.0 billion in senior unsecured notes – adopting standard REIT covenant package $1.72 billion existing debt investment $1.0–$1.5 billion of equity raised in the public market and capital recycling $852 million of stock issued directly to Carlyle/HCR ManorCare Management While a $3.3 billion bridge facility is committed, we expect to be fully funded prior to close (1) (2) (1) (2) $2.20 $2.71 $1.50 $1.75 $2.00 $2.25 $2.50 $2.75 $3.00 2010 Guidance Pro Forma Post Transactions Sept - '10 At / Post Actual Closing (1) (2) Financial Leverage 41% 42% - 43% Secured Debt Ratio 14% 10% - 11% Fixed Charge Coverage (TTM) 2.8x 3.0x - 3.1x Net Debt / EBITDA (TTM) 5.8x 5.0x - 5.1x $1.87 $2.06 $1.50 $1.75 $2.00 $2.25 2010 Guidance Pro Forma Post Transactions (1) Pro forma results reflect the impact of HCR ManorCare and Ventures II transactions on a full-year run rate/normalized basis. (2) See Appendix for assumptions and discussion of the use of non-GAAP financial measures. |
|
|
Appendix This presentation includes defined terms and various non-GAAP financial measures. The Company has provided reconciliations of historical measures to the most comparable historical GAAP measures as well as certain related disclosures in its supplemental information packages which are available on the Company’s website at www.hcpi.com in the “Presentations” section of the “Investor Relations” tab. While HCP believes that non-GAAP financial measures are helpful in evaluating its operating performance, these non-GAAP financial measures do not reflect a comprehensive view of operations, and its operations on a pro forma basis in accordance with GAAP, and should be read in conjunction with the corresponding GAAP financial measures. HCP is providing certain non-GAAP financial measures, because among other things, the corresponding GAAP financial measure is not accessible on a forward-looking basis without unreasonable effort. The Company’s reports incorporated by reference are as follows: (i) supplemental information packages (FFO, NOI, Credit Metrics and components related to FAD computation) dated September 30, 2010 and (ii) Current Report on Form 8–K filed with the United States Securities and Exchange Commission (full–year 2010 FFO guidance) dated November 3, 2010. In addition to the defined terms below, defined terms used in throughout this presentation, are available in the Company’s September 30, 2010 supplemental information package. Definitions and other information regarding Funds Available for Distribution and Net Debt follows: Funds Available for Distribution (“FAD”) is defined as FFO after excluding the impact of the following: (i) impairments and recoveries; (ii) straight-line rents (iii) amortization of acquired above/below market lease intangibles; (iv) amortization of debt premiums, discounts and issuance costs; (v) amortization of stock–based compensation expense; (vi) accretion related to direct financing leases; (vii) deferred revenues; and (viii) litigation provisions. Further, FAD is computed after deducting recurring capital expenditures, including leasing costs and second generation tenant and capital improvements and includes similar adjustments to compute the Company’s share of FAD from its unconsolidated joint ventures. Other REITs or real estate companies may use different methodologies for calculating FAD, and accordingly, HCP’s FAD may not be comparable to those reported by other REITs. Although HCP’s FAD computation may not be comparable to that of other REITs, management believes FAD provides a meaningful supplemental measure of the Company’s ability to fund its ongoing dividend payments. In addition, management believes that in order to further understand and analyze the Company’s liquidity, FAD should be compared with cash flows as determined in accordance with GAAP and presented in its consolidated financial statements. FAD does not represent cash generated from operating activities determined in accordance with GAAP, and FAD should not be considered as an alternative to net income (determined in accordance with GAAP) as an indication of the Company’s performance, as an alternative to net cash flows from operating activities (determined in accordance with GAAP), or as a measure of the Company’s liquidity. Net Debt is defined as Total Debt less cash and cash equivalents, including HCP’s share of cash and cash equivalents from its unconsolidated joint ventures. ASSUMPTIONS FOR POST-TRANSACTION PRO FORMA FFO, FAD AND CREDIT METRIC ESTIMATES: FFO per share is presented before impairments and recoveries. The FFO estimate is consistent with the mid–point of the Company’s full–year 2010 guidance provided in Form 8–K on November 3, 2010. The Company’s Pro Forma FFO, FAD and Credit Metric post-transactions estimates reflect the following: a. Purchase price of $6.1 billion for the acquisition of HCR ManorCare, assumed to be financed with: $1.3 billion reinvestment of net proceeds from HCP’s existing debt investment in HCR ManorCare ($1.72 billion face amount net of $0.42 billion prepayment of related secured financing), $0.85 billion stock consideration issued directly to seller at a per share price of $33.14, approximately $2.6 billion new senior unsecured notes based on HCP’s current unsecured borrowing rates, and approximately $1.4 billion in proceeds from a combination of portfolio capital recycle and common equity issuance(s) utilizing HCP’s current share price; and b. Purchase price of $560 million for 65% interest of the Company’s institutional capital partner in HCP Ventures II, consisting of the assumption of $423 million of in–place secured debt at a blended rate of 5.66% and $137 million of cash consideration, which will be funded with available cash on hand and/or revolver draw. |

