Attached files
| file | filename |
|---|---|
| EX-18.1 - COMPOSITE TECHNOLOGY CORP | v205447_ex18-1.htm |
| EX-32.2 - COMPOSITE TECHNOLOGY CORP | v205447_ex32-2.htm |
| EX-31.1 - COMPOSITE TECHNOLOGY CORP | v205447_ex31-1.htm |
| EX-23.1 - COMPOSITE TECHNOLOGY CORP | v205447_ex23-1.htm |
| EX-32.1 - COMPOSITE TECHNOLOGY CORP | v205447_ex32-1.htm |
| EX-31.2 - COMPOSITE TECHNOLOGY CORP | v205447_ex31-2.htm |
UNITED STATE S
SECURITIES
AND EXCHANGE COMMISSION
WASHINGTON,
DC 20549
FORM
10-K
(Mark
one)
x ANNUAL REPORT PURSUANT TO SECTION 13
OR 15(d) OF THE SECURITIES EXCHANGE ACT OF 1934
For the
fiscal year ended September 30, 2010
¨ TRANSITION REPORT PURSUANT TO
SECTION 13 OR 15(d) OF THE SECURITIES EXCHANGE ACT OF 1934
For the
transition period from ______________ to _____________
Commission
File Number: 0-10999
COMPOSITE
TECHNOLOGY CORPORATION
(Exact
name of registrant as specified in its charter)
|
Nevada
|
59-2025386
|
|
(State
or other jurisdiction
|
(I.R.S.
Employer
|
|
of
incorporation or organization)
|
Identification
No.)
|
2026
McGaw Avenue, Irvine, California 92614
(Address
of principal executive offices) (Zip Code)
(949)
428-8500
(Registrant's
telephone number, including area code)
Securities
registered under Section 12(b) of the Act: None
Securities
registered under Section 12(g) of the Act: Common Stock:
$0.001
par value
Indicate
by check mark if the registrant is a well-known seasoned issuer, as defined in
Rule 405 of the Securities Act. Yes ¨ No x
Indicate
by check mark if the registrant is not required to file reports pursuant to
Section 13 or Section 15(d) of the Act. Yes ¨ No x
Indicate
by check mark whether the registrant has (1) filed all reports required to be
filed by Section 13 or 15(d) of the Securities Exchange Act of 1934 during the
preceding 12 months (or for such shorter period that the registrant was required
to file such reports), and (2) has been subject to such filing requirements for
the past 90 days. Yes x No ¨
Indicate
by check mark whether the registrant has submitted electronically and posted on
its corporate Web site, if any, every Interactive Data File required to be
submitted and posted pursuant to Rule 405 of Regulation S-T (§ 232.405 of this
chapter) during the preceding 12 months (or for such shorter period that the
registrant was required to submit and post such files). Yes ¨ No ¨
Indicate
by check mark if disclosure of delinquent filers pursuant to Item 405 of
Regulation S-K (ss.229.405 of this chapter) is not contained herein, and will
not be contained, to the best of registrant's knowledge, in definitive proxy or
information statements incorporated by reference in Part III of this Form 10-K
or any amendment to this Form 10-K. x
Indicate
by check mark whether the registrant is a large accelerated filer, an
accelerated filer, a non-accelerated filer, or a smaller reporting company. See
definition of “accelerated filer and large accelerated filer” in Rule 12b-2 of
the Exchange Act:
|
Large
accelerated filer ¨
|
Accelerated
filer x
|
|
|
Non-accelerated filer
¨
(Do not check if a smaller reporting company)
|
Smaller
reporting company ¨
|
Indicate
by check mark whether the registrant is a shell company (as defined in Rule
12b-2 of the Act). Yes ¨ No x
The
aggregate market value of the registrant's common stock held by non-affiliates
of the registrant on March 31, 2010, the last business day of the registrant's
most recently completed second fiscal quarter was $50,385,184 (based on the
closing sales price of the registrant's common stock on that date). Shares of
the registrant's common stock held by each officer and director and each person
who owns more than 5% or more of the outstanding common stock of the registrant
have been excluded in that such persons may be deemed to be affiliates. This
determination of affiliate status is not necessarily a conclusive determination
for other purposes.
Indicate
by check mark whether the registrant has filed all documents and reports
required to be filed by Section 12, 13 or 15(d) of the Securities Exchange Act
of 1934 subsequent to the distribution of securities under a plan confirmed by a
court. Yes x No ¨
As of
November 30, 2010 there were 288,269,660 shares of Common Stock issued and
outstanding.
DOCUMENTS
INCORPORATED BY REFERENCE
List
hereunder the following documents if incorporated by reference and the Part of
the Form 10-K (e.g., Part I, Part II, etc.) into which the document is
incorporated: (1) Any annual report to security holders; (2) Any proxy or
information statement; and (3) Any prospectus filed pursuant to Rule 424(b) or
(c) under the Securities Act of 1933. The listed documents should be clearly
described for identification purposes (e.g., annual report to security holders
for fiscal year ended December 24, 1980). Portions of the Proxy
Statement for the 2011 Annual Meeting of the Shareholders of the Registrant are
incorporated by reference into Part III of this report.
COMPOSITE
TECHNOLOGY CORPORATION
TABLE OF
CONTENTS
|
Part
I
|
||
|
Item
1
|
Business
|
3
|
|
Item
1A
|
Risk
Factors
|
17
|
|
Item
1B
|
Unresolved
Staff Comments
|
24
|
|
Item
2
|
Properties
|
24
|
|
Item
3
|
Legal
Proceedings
|
25
|
|
Item
4
|
(Removed
and Reserved)
|
26
|
|
Part
II
|
||
|
Item
5
|
Market
for Registrant’s Common Equity, Related Shareholder Matters and Issuer
Purchases of Equity Securities
|
27
|
|
Item
6
|
Selected
Financial Data
|
28
|
|
Item
7
|
Management’s
Discussion and Analysis of Financial Condition and Results of
Operation
|
29
|
|
Item
7A
|
Quantitative
and Qualitative Disclosures About Market Risk
|
45
|
|
Item
8
|
Financial
Statements and Supplementary Data
|
46
|
|
Item
9
|
Changes
in and Disagreements With Accountants on Accounting and Financial
Disclosure
|
85
|
|
Item
9A
|
Controls
and Procedures
|
85
|
|
Item
9B
|
Other
Information
|
87
|
|
Part
III
|
||
|
Item
10
|
Directors
and Executive Officers of the Registrant
|
88
|
|
Item
11
|
Executive
Compensation
|
88
|
|
Item
12
|
Security
Ownership of Certain Beneficial Owners and Management and Related
Shareholder Matters
|
88
|
|
Item
13
|
Certain
Relationships and Related Transactions, and Director
Independence
|
88
|
|
Item
14
|
Principal
Accounting Fees and Services
|
88
|
|
Part
IV
|
||
|
Item
15
|
Index
to Exhibits, Financial Statement Schedules
|
88
|
|
Signatures
|
90
|
|
|
Index
to Exhibits
|
92
|
CAUTION
REGARDING FORWARD-LOOKING INFORMATION
In
addition to historical information, this Annual Report on Form 10-K contains
forward-looking statements that involve risks and uncertainties that could cause
our actual results to differ materially. Factors that might cause or contribute
to such differences include, but are not limited to, risks related to the
following: uncertain cash flows, the need to collect accounts receivable, our
need for additional capital, demand for our products, decrease in energy demand
and corresponding decrease in energy prices, costs related to restructuring our
corporate structure, competition, our need to protect and maintain intellectual
property, litigation, raw material costs and unavailability, changing government
regulations, the loss of significant customers or suppliers, the limited market
for our common stock, the volatility of our stock price, issues related to the
sale of DeWind and residual liabilities associated with DeWind and its
discontinued operations and other factors referenced in this and previous
filings. When used in this report, the words "expects," "anticipates,"
"intends," "plans," "believes," "seeks," "estimates" and similar expressions are
generally intended to identify forward-looking statements. You should not place
undue reliance on these forward-looking statements, which reflect our opinions
only as of the date of this Annual Report. We undertake no obligation to
publicly release any revisions to the forward-looking statements after the date
of this document. You should carefully review the risk factors described in this
report and other documents we will file from time to time with the Securities
and Exchange Commission.
As used
in this Form 10-K, unless the context requires otherwise, "we", "us," the
"Company" or "CTC" means Composite Technology Corporation and its
subsidiaries.
2
PART
I
ITEM
1 - BUSINESS
I.
Overview
Composite
Technology Corporation (“CTC” or the “Company”) develops, produces, and markets
innovative energy efficient and renewable energy products for the electrical
utility industry. CTC’s products incorporate advanced composite materials
and innovative design solutions that result in high capacity energy efficient
conductors for electrical transmission systems. The Company’s products benefit
from proprietary and patented technologies which create products that we believe
have substantial economic benefits over similar, more traditional
products. The Company was incorporated in Florida on February 26, 1980 as
El Dorado Gold & Exploration, Inc. and reincorporated in Nevada on June 27,
2001 and renamed Composite Technology Corporation. Our fiscal year begins
on October 1 and ends the following year on September 30. We maintain
our principal corporate offices at 2026 McGaw Avenue, Irvine, California
92614. Our telephone number at that address is (949) 428-8500. We
maintain a website at www.compositetechcorp.com
. On our website, we also publish information relating to CTC’s corporate
governance and responsibility. The content on any web site referred to in
this filing is not incorporated by reference into this filing unless expressly
noted otherwise.
During
fiscal 2010, the Company operated with one operating segment, the cable segment
operated as CTC Cable Corporation (“CTC Cable”). Prior to fiscal
2010, we operated a second segment, which provided wind powered
electricity-generating turbines sold under our Stribog (formerly DeWind) segment
(“Wind” or “Stribog”). In September 2009, the Company sold
substantially all of the operating assets and liabilities of Stribog to Daewoo
Shipbuilding and Marine Engineering Co. Ltd. (DSME) for a gross amount
of $49.5 million. The operations of Stribog as well as residual
assets and liabilities of Stribog are being accounted for as discontinued
operations.
The CTC
Cable segment sells ACCC®
conductor, a patented composite core, high capacity, energy efficient overhead
conductor for transmission and distribution lines, and manufactures and sells
ACCC® core,
the composite core component of the conductor, along with hardware connector
accessories specifically designed for ACCC®
applications (“ACCC® “or “ACCC® products”) We sell ACCC® products directly to
customers and through various distribution agreements both internationally and
in North America. ACCC® products
have been available for commercial sale since June, 2005. We have marketed
ACCC®
conductor as a high capacity, low sag, energy efficient, and overall cost
efficient alternative to traditional ACSR (Aluminum Conductor Steel Reinforced),
newer variant ACSS (Aluminum Conductor Support Steel), new technology ACCR
(Aluminum Conductor Composite Reinforced), AAAC (All Aluminum Alloy Conductor),
and AAC (All Aluminum Conductor). Our revenues from our CTC cable products
for the 2010, 2009, and 2008 fiscal years were $10.8 million, $19.6 million, and
$32.7 million, respectively.
The
Stribog segment produced wind turbines for electricity production and started to
develop wind farms incorporating these turbines. The Stribog segment
represents the successor operations of the EU Energy, Ltd., which was acquired
in July 2006 and operated until September, 2009 under the name
DeWind. In September, 2009 the Company sold substantially all of
Stribog’s assets and operating liabilities to DSME. Under the
terms of the transaction, described in greater detail below, the Company is
prohibited from developing, marketing, or selling competing wind turbine
technology for five years, except that the Company retained the rights to
develop and sell wind farm projects.
II. Our
Strategy
Our
strategy is to penetrate the electrical utility markets with our more
economically advantageous products that provide solutions to long-standing
problems endemic in most electrical transmission and distribution
systems. We incorporate our composite materials technology knowledge
to invent products and improve existing energy products that provide novel
solutions in the electrical energy industry. We focus on development
of profitable products that, once adopted, will have substantial capacity,
efficiency, and economic advantages over existing energy products.
Our
approach:
|
|
·
|
We carefully choose the
businesses we are in, focusing on the electrical utility industry and
identifying opportunities that we believe are underserved or which have a
large, underserved market opportunity where our products, properly
introduced, will have a strategic and durable advantage to produce
long-term profitable growth.
|
|
|
·
|
We strive to develop and modify
technologies, to protect our developed technologies, and to introduce
these new technologies into markets with a level of product maturity
that represent significant potential improvements and
opportunities.
|
|
|
·
|
We use operational disciplines
and process methodologies, tools, and resources to execute more
effectively to provide our customers with reliable high quality
products.
|
3
|
|
·
|
We seek relationships with
industry leaders to achieve our strategic goals and emphasize initial
sales to industry leaders so that we can best leverage our sales and
marketing efforts.
|
|
|
·
|
We seek to capitalize on the
expected transmission grid enhancements including the “Smart Grid” as well
as increased U.S. and the rest of the world’s capital spending on critical
electrical grid
improvements.
|
|
|
·
|
We market our products as
cost-effective solutions to existing technologies. Our products
enable increased power transfer, more effective use of rights-of-way,
promote energy efficiency and reduce greenhouse gas emissions through
reduced transmission power losses and related reduction in power
generation from fossil-fuel power
plants.
|
Our
strengths are derived from our ability to identify and address problems inherent
in existing electrical grid systems, which the industry considers normal
operating constraints. We then develop and market products that are
designed to be innovative and which we anticipate will provide economically
superior solutions to the underlying problems and to provide a superior return
on investments in transmission, distribution and generation
assets. We protect our competitive advantages through a worldwide
intellectual property strategy on our products.
III. Industry
Background
The
transmission grid consists of multiple transmission lines that connect and
interconnect power produced at power plants that are transmitted via high
voltage transmission lines to substations near population centers where they are
stepped down in voltage and delivered through distribution systems to
customers. Each transmission corridor contains at least one
transmission circuit consisting of three wires in standard three phase AC
transmission system. In less common DC transmission systems there are
two wires per circuit. Typically, a transmission corridor from a very
large production facility may have multiple circuits on the same towers and each
circuit may have “bundled” conductors of between 2-4 wires per bundle per
phase. The industry term for three single transmission
conductors for a mile is a “circuit mile.” The Company converts
circuit miles or circuit kilometers to conductor miles or kilometers as key
metrics for production and sales results.
Bare
overhead transmission conductors are the primary method used in the grid to
connect power generation plants to population centers, since generation plants
are often many miles away from the eventual consumers and bare overhead
conductors are the most cost effective method of electricity
transmission. The transmission of electricity from power production
to the consumer can be thought of as a grid of electrical “energy highways” in
the sky. In the developed world, under the demand conditions
contemplated decades earlier, the grids were engineered to handle a relatively
low level of power transmission and therefore ”highways” engineered were not
designed to handle today’s requirements. For example, in the U.S.
most of the transmission grid was designed and erected in the 1950s, with
expectations of a significantly lower population and per capita electricity
consumption.
Historically,
transmission conductors have consisted of a combination of metals, principally
aluminum or copper, for conductivity and typically included an additional
strength component made of steel. Bare overhead conductors are attached to
transmission support structures through conductor hardware and insulators. In a
typical transmission grid project, the cost of siting, constructing and
stringing the conductor on the tower structures can be as much as 80% of the
total cost of the project, depending on the size and strength of the towers and
remoteness of the tower sites, which often require helicopters to bring
materials to the tower site. The predominant combination of conductor
in the U.S. and most of the world is Aluminum Conductor Steel Reinforced or ACSR
which consists of a steel wire core stranded with aluminum wire around the
core. The steel serves as the strength component required for the
high tension between the support structures while the aluminum is the primary
electricity conducting material.
The use
of steel wire as a strength component has three primary
drawbacks: steel is heavy, it is subject to corrosion over time which
limits its life, and like all metals it exhibits thermal expansion which causes
line sag as it heats. Under electrical power load the steel
strength component in standard ACSR conductor heats and stretches which results
in the ACSR drooping closer to the ground, called “sag” in the electrical
transmission industry. Grid and safety regulations require minimum
ground clearances for conductors and recent new regulations provide for
substantial penalties for ground clearance violations that are not
remediated. The worldwide transmission grids were designed to
overcome the weight and sag drawbacks by placing the conductor under high
tension thereby requiring expensive structures spaced close enough together in
order to hang ACSR at such heights so as to allow for the expected operational
power loads. The structures are engineered for the combined weight of the ACSR
steel core and the aluminum wire it supports, as well as the wind load generated
by wind blowing on the conductor, much like a sail, while the close proximity of
the structures allows a pre-engineered amount of conductor sag to allow for high
electric load conditions.
Total Cost of
Ownership:
Historically
the industry approach to the total cost of ownership for a transmission line
consisted of:
|
|
i.
|
capital costs for the tower
structures and the ACSR
conductor;
|
|
|
ii.
|
capital
costs for the ACSR conductor;
|
|
|
iii.
|
routine
maintenance costs for the conductor and tower structures;
and
|
|
|
iv.
|
known
revenue opportunities through defined ampacity (current capacity)
operational limits.
|
4
Twenty
years ago, very little thought was given to the concept of power losses in the
lines, called “line losses” in the power industry or for the ability to provide
greater transmission line ampacity, or power throughput without costly
upgrades. There were no commercial alternatives to ACSR and most of
the transmission line infrastructure had been engineered decades before the
rapid increase in electricity consumption over the past twenty
years. Line losses were an acceptable and required cost of business
for the electrical energy in the U.S. With the advent of products such as
ACCC®
conductor this conventional wisdom is disrupted since ACCC®
conductor provides for increased ampacity, decreased line losses, and may
provide for lower tower structure capital costs. We believe
that total cost of ownership formula has changed and that U.S. and worldwide
purchasers of conductors are only beginning to evaluate conductors on a basis
other than simple commodity pricing.
Power Demand
Increase: It is generally accepted that there is a fundamental
need for additional transmission capacity in most transmission grids worldwide
due to aging infrastructure and development in emerging countries. According to
the U.S. Department of Energy, U.S. electricity sales increased by 43% from 1990
to 2008 without a corresponding increase in transmission grid investment. With
an increase in consumer demand for power, there is a corresponding increase in
ampacity demand on the transmission grid. Ampacity increases are monetized by
utilities through increased revenues for increased ampacity as well as reduced
congestion costs and limitations or reductions of rolling blackouts or
brownouts, all of which are described below.
Congestion
Costs: When consumer energy demand exceeds a transmission
line’s ability to serve that demand, the transmission system is deemed
“congested”. Under these conditions, the marginal price of electrical
power increases substantially over a base case, or unconstrained
prices. The additional costs incurred by load servicing entities
during times of congestion are known as Congestion Costs, meaning that the cost
of electricity is more expensive from locally produced and often fossil fuel
generation peak power plants than it would be for larger, more remote, and often
renewable energy sources. Congestion costs are significant, in
particular at peak demand times and costs incurred due to constrained
transmission lines in one US region alone was estimated as between $0.8-$2.1
billion between 2005 and 2009. Congestion may also result in generation
curtailment, requiring producers of conventional or renewable energy to reduce
their output due to grid constraints. This is an increasing concern
for renewable energy developers and congestion costs associated with curtailment
of wind power in Texas have been significant enough to have prompted the state
to consider a massive $5 billion transmission upgrade proposal.
Rolling blackouts and
brownouts: Prolonged periods of congestion cause transmission lines to
heat up and risk conductor failure or clearance violations. Under these
conditions, power providers must ration electric power – leading to brownouts or
rolling blackouts – in order to maintain grid integrity and ensure public
safety. One such rolling blackout period in California lasted 2 days
and cost the state an estimated $1.7 billion in lost productivity.
Line losses: Transmission line losses
are a macroeconomic financial loss. Resistance in transmission and distribution
conductors, transformers, and other electrical infrastructure cause line losses
through heat losses. According to the most recently available data,
the U.S. Department of Energy (U.S. DOE) Office of Electricity Delivery &
Energy Reliability, the line losses from distribution and transmission increased
from 5% of generated power in 1970 to 9.5% in 2001 ( http://sites.energetics.com/gridworks/grid.html
pg 2). On average, using 2001 data, a power plant generating 100 megawatts of
power will deliver just over 90 megawatts to a consumer, with the rest of the
power lost through heat from the transmission and distribution conductors and
the transformers.
Economically,
the losses are passed through to the consumer through higher energy costs since
it requires the utility or power generating company to produce more power to
deliver the required megawatts. The total retail value of grid losses
for 2008, based on the most recently available U.S. DOE Information
Administration data, are estimated at over $30 billion. According to
the November 2003 U.S. Climate Change Technology Program report, 60% of the
losses are from transmission and distribution lines resulting in an estimate of
$18 billion in economic losses due to U.S. transmission and distribution
conductor line losses. Incremental to this cost would be the value,
or cost, of the monetization of the greenhouse gas emissions mentioned
below.
Environmentally,
the line losses represent additional greenhouse gas emissions. In
2007, based on U.S. DOE Information Administration data, over 2.5 billion metric
tons of CO2 was emitted in the U.S. from conventional power
plants. Based on the information in the sources cited above,
approximately 5.7% or 142 million metric tons of pollution is caused by line
losses, the annual equivalent of approximately 26 million
automobiles.
Over the
past several years, an intense media focus on climate change has raised the
awareness of the need to reduce greenhouse gas emissions. Information is readily
available on the Internet for U.S. based studies by the U.S. Department of
Energy, the California Air Resources Board, and Stanford University’s Precourt
Institute for Energy Efficiency, and internationally by McKinsey & Company’s
landmark “Pathway to a Low Carbon Economy” study which focuses on cost-effective
methods towards global greenhouse gas reductions. Both the Precourt
and McKinsey studies use an “abatement cost curve” or “marginal abatement curve”
which provides the cost effectiveness of different greenhouse gas solutions and
graphs the greenhouse gas reduction against the total cost of ownership.
Although none of these studies segregate transmission and distribution grid
improvements under a separate heading, each study has “other utility efficiency”
categories and each is considered to be a significantly cost-effective method of
greenhouse gas reductions, listed as a “negative cost” for CO2
remediation.
5
Recently,
much public attention has been given to the “Smart Grid”, which consists of a
system of monitoring sensors, and grid management tools to optimize the existing
grid. CTC Cable sees this as beneficial since it highlights the need
for an improved transmission grid, however reconductoring constrained
transmission lines in most cases provides a much higher return on invested
capital than nearly all other investments including grid management and
monitoring tools.
IV. Our Product, Solutions
and Competitive Advantages
Our Product –
ACCC®
Conductor:
Cutaway
of ACCC®
conductor compared with a traditional ACSR Conductor:
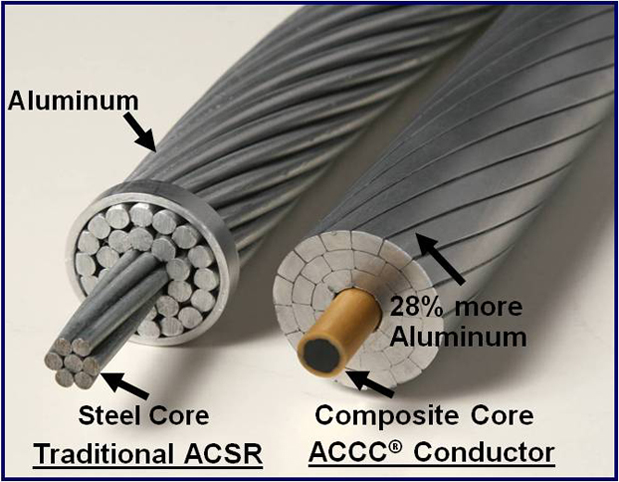
We have
replaced the steel core of traditional ACSR conductor with a lighter, stronger
composite core to create ACCC®
conductor. By taking out the weight of the steel and using annealed
aluminum, for the same size diameter and weight conductor as ACSR we are able to
increase the conductive cross section allowing approximately 28% more
aluminum. In effect, for the same weight and size, ACCC®
conductor functions as a larger “electricity highway” which will allow for easy
replacement on existing tower structures or for new construction provides larger
capacity on fewer or smaller cheaper tower structures.
The
source of the benefit is our patented ACCC®
composite core, which forms the strength component of ACCC®
conductor. The ACCC® core
consists of aerospace grade carbon fiber and industrial glass fibers, infused
with a proprietary resin mixture, and pulled through a heated die in a
proprietary pultrusion process. We manufacture ACCC® core in
our ISO 9001:2008 certified plant in Irvine, California on Company designed and
constructed machinery that is easily duplicated and scalable into additional
locations. The ACCC® core is
then shipped to an outsourced licensed contract manufacturer where it is
stranded with trapezoidal annealed aluminum wire around the core.
We sell
ACCC®
conductor either as a completed conductor ready for installation on the grid or
as ACCC® core to
licensed aluminum stranding manufacturers, which then strand the ACCC® core and
sell the finished ACCC®
conductor to their customers. As part of our product offering, we
also design and manufacture the hardware required to connect ACCC®
conductor to the tower structures and for splicing lines together. We
deliberately designed ACCC® hardware
to be installed in a manner consistent with current industry standard
products. While ACCC®
conductor does require attention to specific differences in handling than other
conductors, ACCC®
conductor installations do not require special tools and are installed in the
same amount of time as traditional conductors on the same transmission tower
structures.
6
Market
environment:
The state
of transmission grids around the world and the issues faced by grid managers can
be divided into the following general categories:
|
|
·
|
The existing grid is aged and
capacity constrained due to the greater demand for electricity by
consumers and a lack of continued investment in the
grid.
|
|
|
·
|
New markets in developing
countries and new sources of renewable energy, such as solar or wind
energy require investment in new transmission
lines.
|
The
recent economic downturn has resulted in what we believe to be a temporary
reduction in the power demand on the strained transmission grids in the U.S.,
China, and several other countries around the world. As a result, the
urgent need to upgrade existing grids and build new transmission lines has
delayed projects through most of calendar year 2010. However, as the
economy recovers, we are beginning to see a reoccurrence of the transmission
issues that were endemic in 2008 and which are expected to be drivers of
ACCC® product
adoption in the future.
We
believe that our ACCC®
conductor solution provides a superior total economic return over other existing
bare overhead transmission conductors in most conductor product
applications. The total cost of ownership over the life cycle of
either a new transmission line or for replacement of existing transmission lines
is often significantly reduced as compared to the total cost of ownership of
ACSR or other conductor products.
ACCC® Product
Applications:
We
believe that our ACCC® products
represent an economically superior solution to the existing ACSR industry
standard and other conductor alternative solutions in most transmission line
applications. Until recently, we considered the primary transmission
conductor applications for ACCC® to be
one of three general applications, namely: a) “greenfield” or new
line construction; b) as a “retrofit” installation either to replace aged or
damaged conductor or as replacement conductor to upgrade the capacity of
existing transmission line corridor; or c) as a method to upgrade transmission
lines on existing transmission corridors in lieu of new line
construction.
Specific
and targeted opportunities where we believe that ACCC® products
represent a superior solution are identified below including North American
Electric Reliability Corporation (NERC) Clearance Violation Remediation,
Congestion Cost Reduction, Greenfield Installations, and Renewable Energy
Integration.
NERC Clearance Violation Remediation
(U.S.): In 2010, the North American Electric Reliability Corporation
(NERC) changed the way transmission line clearance violations are assessed and
enforced. On October 7, 2010 NERC issued Order 810 creating a
requirement for all registered entities to conduct specific review and
remediation effort on their transmission lines. In its introduction
NERC stated “NERC and the
Regional Entities have become aware of discrepancies between the design and
actual field conditions of transmission facilities, including transmission
conductors. These discrepancies may be both significant and
widespread, with the potential to result in discrepancies in line ratings. The
terms “transmission facilities” and “transmission lines” as used herein include
generator tie lines, radial lines and interconnection
facilities.” The order lays out a number of requirements
including: “Transmission Owners, Transmission
Operators, Generation Owners, and Generation Operators with solely or jointly
owned transmission facilities (including generator tie lines, radial lines and
interconnection facilities) are to take the following
actions:
|
|
1.
|
The
registered entity must respond to this Recommendation by December 15, 2010
with a plan to conduct an assessment and any necessary remediation of the
issues discussed in this
Recommendation;
|
|
|
2.
|
Within
six months of the date of this Recommendation (April 7, 2011), the
registered entity must identify and report to the applicable Reliability
Coordinators and Regional Entities all transmission facilities (including
generator tie lines, radial lines, and interconnection facilities) meeting
the following conditions:
|
|
|
a.
|
The
existing or as-built conditions are different from the design conditions
for the facilities; and
|
|
|
b.
|
Those
differences between actual and design conditions result in incorrect
ratings for the facilities;
|
|
|
3.
|
The
registered entity must correct the issues identified in its assessment as
expeditiously as possible, but no later than 24 months following the date
of this Recommendation, or October 7, 2012. No remediation plan
may extend beyond 24 months without prior NERC approval, based on a clear
demonstration by the registered entity of the need for such an extension
based on scheduling constraints or other constraints beyond the control of
the registered entity.”
|
While the
penalty levels related specifically to NERC 810 have not been set, the standard
penalty level for reliability violations is up to $1.0 million per day per
occurrence.
7
We see
three possible remediation solutions to avoid costly penalties and to achieve
compliance: a) de-rate the transmission line to reduce sag on
existing lines and which results in lower revenue and electricity capacity; b)
tower retrofit, consisting of costly and time consuming tower modifications to
raise the height of the conductor above any clearance heights; or c) reconductor
with ACCC®
conductor and thereby achieve the clearance objectives and increased
capacity.
ACCC®
conductors address this issue by allowing for both increased capacity and
improved clearance without the need for additional rights-of-way or support
structure construction/modification. We believe that CTC Cable’s
reconductoring solution not only reduces the cost of reliability compliance, it
also minimizes the time necessary to address identified violations, potentially
limiting fines, and provides for additional revenue capacity.
We
believe that NERC 810 remediation through reconductoring with ACCC®
conductor provides utilities with a cost-effective solution that is superior to
de-rating and tower retrofits. Of the remediation alternatives, we
believe that ACCC®
reconductoring is the only solution that will increase the line capacity and
with recent developments on energized line reconductoring, we believe ACCC®
products will provide a significantly faster remediation solution than tower
retrofits which often require additional rights-of-way or support structure
construction/modification. Initial discussions with utilities in the U.S.
facing these issues have been very positive.
Congestion Cost
Reduction: When demand exceeds
transmission capacity, transmission lines are said to be congested and financial
costs are accrued as utilities attempt to manage power flow. In some
cases utilities may resort to “brownouts” and/or “rolling blackouts” to limit
current flows to acceptable levels. Most system operators resort to
running higher cost (higher emissions) generators, or curtail load at commercial
and industrial customer locations to reduce constraints on the
system. These manifestations of transmission congestion may cost on
the order of tens of millions to billions of dollars a
year. ACCC®
technology allows transmission operators to address issues of congestion at
minimal cost. Since ACCC®
conductors of the same weight and diameter carry up to twice as much current as
the replaced existing conductor, they can be used to upgrade constrained lines
with minimal modification to support structures. Furthermore, the
excellent sag reduction performance of ACCC®
conductors, as well as their resistance to corrosion and wear, helps
transmission owners adhere to the increasingly strict reliability standards set
by federal agencies. Together these advantages allow transmission
owners to address congestion issues quickly, thereby mitigating additional cost
associated with congested lines.
“Greenfield” Development: ACCC®
conductor is also well positioned for new transmission projects – known as
“greenfield” projects. ACCC®
conductor’s high-capacity low-sag advantages result in substantially reduced
support structure cost for new transmission development. This cost
savings can come in the form of fewer structures or shorter structures (in
either case structure costs are reduced as are foundation costs). Fewer
structures often results in reduced permitting cost and lead
time. When combined with ACCC®
conductor’s long-term line loss cost savings, ACCC®
technology presents a very attractive option for greenfield
development.
Integration of Renewable
Energy: ACCC®
conductor’s energy-efficient high-capacity advantages are particularly
beneficial for connecting renewable energy generation to the
grid. Renewable energy projects, such as wind and solar farms, have
highly variable power outputs and require higher capacity conductors to get the
most out of peak generation periods. Efficient transmission of
generated power is also important for maintaining high ROI’s in renewable
projects.
Comparison with ACSR and
other conductors:
An
economic and operational comparison of ACCC®
conductor with ACSR consists on a project basis of: conductor and
related tower capital costs, recurring benefits of ACCC®
conductors over its alternatives, offset by ACCC®
conductor’s higher cost on a per foot basis. When viewed as a
combination of positive and negative economic and operational benefits, we
believe that ACCC®
conductor provides a superior return on investment as compared to ACSR or
other conductor solutions through increased revenue capabilities, improved line
losses, and lower capital costs.
Capital
Costs:
|
|
·
|
ACCC® conductor has lower overall
capital costs from tower structures due to fewer or lighter weight tower
structures (approximately 80% of typical transmission project cost) as
compared to ACSR tower
structures
|
|
|
·
|
ACCC® conductor has higher per foot
(or meter) of actual conductor cost compared with ACSR (approximately 20%
of typical transmission project cost). When compared based on
the cross section of aluminum, ACCC® conductor is more
expensive.
|
For most
of the projects where ACCC®
conductor has been considered a possible solution, the savings in capital costs
from tower cost reductions has been greater than any increased costs where
ACCC®
conductor has been more expensive per linear foot than ACSR conductor
costs.
8
Recurring Benefits:
In
general, we believe ACCC®
conductor provides an opportunity to provide additional capacity at a reduced
cost when compared to ACSR or most other conductor alternatives.
|
|
·
|
Higher capacity transmission
lines provide increased transmission revenues for
utilities. The added aluminum in ACCC® conductor vs. ACSR and
ACCC® conductor’s higher operating
temperature capability provide greater electricity capacity at both
baseline and peak demand periods in addition to better grid management
capability for utility line
operators.
|
|
|
·
|
All other matters equal, a
transmission corridor with increased capacity should have reduced
“congestion costs”, defined in the industry as the requirement to purchase
more expensive power due to transmission line constraints which prevent
the delivery of less expensive, or possibly less pollutive power to the
consumer.
|
|
|
·
|
Increased capacity, either
baseline or at peak time, reduces system “brownouts” or “rolling
blackouts”, which in turn cause unquantifiable general economic losses to
utility customers.
|
|
|
·
|
More efficient transmission lines
require a decreased level power production to deliver the same power than
less efficient lines. ACCC® conductors contain a greater
aluminum content than ACSR lines of the same size and
weight. The added aluminum results in decreased line losses of
approximately 33% vs. ACSR due to the greater conductivity of
ACCC®
conductors.
|
|
|
·
|
Increased capacity and reduced
line losses should provide economic savings and significant environmental
benefits due to avoided greenhouse gas emissions allowed by reduced fossil
fuel power generation to supply the “line loss”
power.
|
|
|
·
|
ACCC®
conductor’s combination of sag performance and self-dampening properties
can significantly reduce lifetime maintenance costs associated with
certain transmission lines. Self-dampening reduces ACCC®
conductor’s dependence on separate dampers, which can require replacement
at significant cost. ACCC®
conductor’s superior reduced sag performance also enables lower tensions
on installed lines which can simplify line maintenance and further reduce
labor costs.
|
Other matters, including
ACCC® conductor limitations
compared to ACSR:
|
|
·
|
ACCC® conductor requires more careful
handling during installation than ACSR and requires training certification
of linemen for proper installation procedures. The Company
currently sends an observer to nearly all installations of
ACCC® conductor to ensure proper
handling.
|
|
|
·
|
Under certain heavy ice loading
conditions, ACCC® conductor may not perform as
well as traditional conductors unless pre-tensioning is performed during
installation or a special heavy ice ACCC®
conductor model is
used.
|
|
|
·
|
ACCC® conductor costs more per actual
conductor length than similar conductor lengths of ACSR of the same
diameter, however ACCC® conductor provides higher
capacity performance as well as features that may lower total project
capital costs.
|
|
|
·
|
ACCC® conductor has only been
installed in approximately 6,000 miles over five years and is as yet not
considered an industry standard in most markets. Although
extensive modeling and laboratory tests have been conducted that simulate
aging, ACCC® conductor does not have the same
level of installation experience as ACSR
conductor.
|
V. Competition
The
competition for ACCC®
conductor depends somewhat on the application of the conductor. In
general, we believe that ACSR is our primary competition therefore we have
focused the description of our products and product advantages by comparing
ACCC®
conductor to ACSR conductor, since it is the industry standard and represents
the greatest opportunity for market penetration. ACSR is made using
100-year-old technology and is usually sold by weight as a commodity product by
a multitude of conductor manufacturers including General Cable, Southwire, and
Alcan Cable in the U.S.
We
believe that ACCC®
conductors have substantial performance advantages over ACSR (as well as all
other conventional conductors), including:
|
|
·
|
Electricity
capacity increases – up to 2 times the capacity of
ACSR
|
|
|
·
|
Line
loss reductions – 30%-40% less line losses than
ACSR
|
|
|
·
|
Minimized
thermal sag – 86% less thermal sag than
ACSR
|
|
|
·
|
Corrosion
& wear resistance – self dampening, virtually no galvanic corrosion
potential between ACCC®
core and aluminum
|
We have
also compared ACCC®
conductor with other conductor product innovations. We compete with
the following products either on a high temperature, low sag (HTLS), higher
capacity basis or on an energy efficiency basis:
|
|
·
|
ACSS, or Aluminum Conductor
Support Steel, is an annealed aluminum conductor using a similar design as
ACSR but which uses a higher strength less corrosive steel alloy as its
core. ACSS can operate at a higher temperature than ACSR
however it still has a similar weight to ACSR. ACCC® conductor is superior to ACSS on
the basis of reduced high temperature sag, as a method to inexpensively
increase capacity, as well as the efficiency of
transmission. Although ACSS is less expensive than
ACCC® conductor on a price per linear
foot, it is still more expensive than ACSR. On most projects
our ACCC® conductor is less expensive
considering capital cost of the total project and in line loss savings due
to the increased
efficiency.
|
9
|
|
·
|
GAP conductor, is a modified
version of ACSR using higher strength, heat resistant steel, a proprietary
“grease material” barrier between the steel core and the heat resistant
aluminum alloy that serves as the primary conductor. This
allows the steel and the aluminum to slip in relation to each other,
thereby allowing the steel to take on more of the mechanical
loading. GAP is marketed as HTLS and provides little or no
efficiency gain. ACCC® conductor provides a superior
solution over GAP as an inexpensive method to increase
capacity.
|
|
|
·
|
ACCR, or Aluminum Conductor
Composite Reinforced, is a composite conductor composed of
aluminum-zirconium alloy stranded wire around a metal-ceramic matrix
composite wire core and is manufactured by 3M
Corporation. We do not consider ACCR in its current state
to be a competitive product with ACCC® conductor. It does
not have the amount of reduced sag that our ACCC® conductor has and it has less
performance per price point. ACCR has been on the market for a
number of years, marketed by 3M Corporation yet it appears to have a more
limited commercial installation base to date as compared to the
installation base of ACCC® conductor. ACCR has a
much higher energy loss profile than the comparable ACCC®
conductor.
|
|
|
·
|
AAAC, or All Aluminum Alloy
Conductors, and AAC, or All Aluminum Conductors, are designed to eliminate
the steel strength member and make the entire conductor from aluminum
using alloying elements for AAAC to render the aluminum stronger and
increase an all aluminum conductor’s limited operating
temperature. These conductors were developed in part as an
answer to ACSR’s corrosion problems encountered in coastal areas. Both
AAAC and AAC conductors are very soft and cannot be operated at the same
temperatures as conventional ACSR since they have high levels of thermal
sag which requires shorter spans between towers, resulting in a more
expensive total system capital cost. Both conductors have very
limited maximum operating temperature ranges, which limits peak capacity
significantly. AAAC and AAC conductors have gained commercial
adoption in Europe, however our ACCC® conductor of the same diameter
has approximately the same conductivity and allows a much higher capacity
as well as being easily retrofitted on previously all aluminum
systems.
|
|
|
·
|
Superconductors and copper
underground cables. We do not consider superconductors or
underground cables to be competitive products to ACCC® conductor. Buried
cables cost several times more to install than a comparable
ACCC® conductor installation and are
typically not used for transmission lines due to high voltage insulation,
maintenance and cooling issues. Superconductors are even more
expensive to install than copper underground cables as they cost several
million dollars per mile and consequently have only had very limited
government sponsored short trial installations of less than two miles in
extremely congested city areas where there is a limitation of conduit
space underground.
|
We
believe ACCC®
conductor has two disadvantages compared to the competition. First, our
ACCC®
conductor is still a relatively new product that incorporates technology that,
while well proven in aerospace and other applications, still has limited
installations in the utility markets even though it has been in commercial
application for almost five years. At present, approximately 9,500
kilometers of ACCC®
conductor have been installed worldwide over the past 5 years, which has
provided proof of its effectiveness in transmission and distribution systems.
Nevertheless, the ACSR product we typically replace has been in existence for
100 years, is familiar to utility management and utility engineers and has been
proven to work, and its limitations are well understood in all types of
installations. Our product deployment is increasing, even though it
does not yet have this legacy in the utility markets. Second, our
product is more expensive when compared by the meter or foot than the ACSR
conductor for the same diameter sized conductor, although it is more comparable
when prices are compared based on the amount of conductive aluminum
provided. While we believe and have demonstrated that installation of
our product results in capital cost savings of the overall project, since less
tower construction or other upgrading costs should more than offset any higher
cost per meter or foot of the conductor, we find that it is still challenging to
convince traditional utility buyers, who are not accustomed to analyzing costs
of a total system when thinking about the actual cost of a unit of
conductor. We also believe and have demonstrated that there are
additional yearly cost savings from the increased efficiency of electrical
transmission due to lower line losses and the opportunity for additional revenue
from increased baseline or peak capacity. However, it is also
challenging for the typical decision maker to incorporate that information into
the analysis, since it often falls in a different planning department and is
usually considered a normal line loss cost that is built into the rate
base.
VI. Conductor
Market
The
market for transmission infrastructure spending is massive. Projected worldwide
spending on transmission infrastructure between 2008 and 2015 is $666 billion,
increasing to $1,339 billion between 2016 and 2030 according to the
International Energy Association’s 2009 World Energy Outlook. Our
ACCC® products
serve both transmission and distribution markets. Our analysis, based
on market figures provided by the International Energy Association’s 2008 and
2009 World Energy Outlook reports indicates a worldwide market for transmission
and distribution conductors of $45 billion per year of which we believe $10
billion has applications where ACCC®
conductors are competitive. We see China as the largest market with
over 30% of the spending, followed by the United States at 11% and Europe at
10%. Based on this information, CTC Cable projects the total potential worldwide
market for ACCC®
conductor as approximately $10 billion per year.
10
We
segment our markets geographically and focus our efforts on those geographic
areas that are most likely to quickly adopt new technologies or influence other
markets to adopt. Our geographic segmentation includes the U.S. &
Canada, China, Latin America, South America, Europe, Middle East & Africa,
India, Other Asia, and the Pacific Rim. The two largest expected near term
markets are the U.S./Canada and China markets. We see the largest
growth market as China, which is expected to spend an average of $68 billion per
year on transmission and distribution projects for the next eight years
according to the International Energy Association as China continues to expand
its electrical grid. We see the second largest market in the U.S. and
Canada. The U.S. grid will require $165 billion over the next 20
years according to the U.S. Department of Energy. The U.S. is also
expected to make significant investments in its transmission grid to support new
renewable endeavors, support electricity demand, as well as to comply with new
regulatory requirements for grid infrastructure
reliability. According to the Department of Energy’s 2009
Annual Energy Outlook reference case, the U.S. electricity demand is expected to
grow 19% between 2009 and 2030 on a grid that is already overloaded. The 2002
DOE National Transmission Grid Study identified 157,800 miles of transmission
line and cites that “the U.S. Electricity Transmission system is under stress”
and identified key transmission bottlenecks. The North American
Electric Reliability Corporation (NERC) 2009 Long-Term Reliability Assessment
indicates that approximately 260,000 megawatts of new renewable capacity is
projected to come on line by 2018 and that there will need to be more than
double the average number of transmission miles constructed over the next five
years than what was constructed over any previous five year period since 1990,
primarily for integration of renewable energy resources, reliability, and
congestion. It further cites that the number one emerging issue is transmission
siting of new transmission lines.
With the
exception of the United States, a regulatory body such as a state grid entity or
a state utility typically controls most of the transmission projects in its
country. Technical approvals of the regulatory body are required
prior to obtaining the right to sell product within that
region. Examples of this would be the state grids of China, Poland,
or Mexico. In the United States, most independent utilities have
their own technical requirements, resulting in a much more fragmented market in
the United States. We believe that we have achieved technical
approval in 90% of the world’s markets, including each of our top five
geographies. Since our product has achieved technical approval
in nearly all of the industrialized countries of the world, any additional
technical approvals required are obtainable upon filing all of the required
forms and translations of our information. We consider technical
approval to be an ongoing process and we continue to apply for additional
technical approval, including approval for conductors at very high voltage and
our newer conductors developed for specific applications as solutions to certain
customer’s problems.
CTC Cable
stands to benefit substantially from any acceleration of the adoption curve
either internationally or domestically. CTC will further benefit as
the world recovers from the global recession which delayed hundreds of millions
of dollars worth of long overdue transmission upgrades and new transmission
projects.
CTC Cable
markets ACCC®
conductors and core worldwide to electrical utility companies, co-ops, and
governmental entities through licensed stranding relationships in Europe, North
America, South America, the Middle East, China, and Indonesia. During
fiscal 2010, additional stranding relationships were established with Alcan
Cable in the U.S., IMSA in Argentina and Centelsa in Colombia. In
November, 2010 we established a stranding relationship with Sterlite
Technologies Limited in India. We are working on establishing
additional stranding relationships in Columbia, Mexico, Central America, Africa,
Russia, and China over the next year in order to expand our stranding capacity
and marketing reach.
To date,
CTC Cable has over 9,500 kilometers of ACCC®
conductor installed. ACCC®
conductor revenues increased from $1.0 million for fiscal 2005 to $3.0 million
for fiscal 2006, $16.0 million for fiscal 2007 to $32.7 million for 2008 and
decreased to $19.6 million in 2009 and $10.8 million in
2010. Fiscal 2009 and 2010 revenues decreased due to the
economic downturn and the significant reduction in orders from China. In 2009
and 2010, CTC Cable successfully executed on its market expansion strategy and
wrote initial orders to new customers in the Middle East, Indonesia, South
America, and South Africa as well as increased North America orders from $0.9
million in 2008 to $5.4 million in 2009. Non-China revenue growth
continued from 2009 to 2010 from $9.1 million in 2009 to $10.7 million in
2010.
To date,
CTC Cable’s largest market has been China with sales of nearly $25 million in
fiscal 2008, which decreased to $10.5 million in fiscal 2009, and $0.2 million
in fiscal 2010. Our China business in 2009 and 2010 was significantly
impacted by the economic downturn that began in 2008. Much of our
conductor before 2009 was installed in a limited geographical area that had been
building out lower voltage transmission lines to support manufacturing
demand. With the economic downturn, the incidences of brownouts was
reduced and the Chinese State Grid invested most of the stimulus funds in higher
voltage projects for which, at that time ACCC®
conductors were not approved for installation. During 2010, CTC Cable
changed its go-to-market strategy in China by adding CTC Cable employees in
China, establishing sales offices, and taking a more active marketing and sales
approach than in the past. We believe this strategy will result in
additional business relationships, which will re-establish our Chinese business
and allow sales into additional Provinces, into high voltage lines, and multiple
sales channels.
In
November 2010 CTC Cable entered into an agreement with Sterlite Industries in
India to produce ACCC®
conductor in India for the Indian market. As a condition of
exclusivity, Sterlite agreed to meet minimum sales targets beginning in mid to
late 2011.
During
2010, CTC Cable had sales in the U.S., China, Canada, Bahrain, Belgium,
Indonesia, Chile, and Brazil. CTC Cable has over $1.1 billion
in active quotes in North America, China, the Middle East, Europe, Africa,
India, Russia, Latin America, and South America. ACCC®
conductor is currently certified for sale in North America, Mexico, Chile,
Brazil, France, Benelux, Germany, Spain, Poland, the UK, South Africa, China,
Indonesia, Paraguay, Costa Rica, Panama and the Middle East. We
expect full certification in all significant markets worldwide by the end of
fiscal 2011.
11
In the
U.S., CTC Cable sees a significant opportunity in rapid customer adoption and
product acceptance as a result of the October 2010 NERC requirements to assess
and remediate transmission vegetation clearance violation. The
requirements are part of the continuing and ongoing implementation of the 2007
FERC requirements for transmission grid reliability standards. The
recent changes add significant fines for non-compliance and provide for a two
year window until the fourth quarter of 2012 to remediate reliability violations
related to transmission lines that could sag too close to the ground or to
vegetation. CTC Cable’s reduced sag ACCC®
conductor offers a quick and inexpensive solution to the NERC requirements with
the additional benefit of providing much needed improvements to transmission
line capacity. Alternative traditional solutions are more expensive,
take longer to implement, and do not have capacity improvements.
Worldwide,
CTC is promoting ACCC®
conductors as the most efficient high-capacity/low-sag transmission conductors
with the lowest total cost of ownership. In regions where
transmission is constrained, we are marketing ACCC®
conductor as the lowest overall cost to both upgrade existing transmission
corridors or to add transmission capacity through new line
construction. We believe our competitive advantages are particularly
compelling for those regions of the world with high average ambient
temperatures, such as the Middle East, in regions with aging infrastructure such
as the U.S. and Europe, and in areas experiencing rapid buildouts of the
electrical grid, such as South America, Latin America, India, and China. Our
marketing approach is industry based using online collateral and direct contacts
with industry executives alongside co-marketing initiatives with stranding
licensees.
VII.
ACCC®
Conductor Marketing
Marketing
Message:
Our
ACCC®
conductor marketing message consists of three primary benefits: 1) increased
power transmission capacity; 2) energy efficiency through reduced line losses
and decreased greenhouse gas generation emissions; and 3) return on investment
through lower capital costs, increased transmission revenues, and reduced line
losses. This message fits the main issues facing a utility, which
include finding a solution for problems of a constrained existing transmission
grid, improving the energy efficiency to decrease line losses, and mitigating
the increasing risks of the increasingly pollution sensitive
public. Our message further provides a comparison with other
conductors to illustrate these advantages as well as state the benefits of the
total cost of ownership over the life cycle of the transmission or distribution
line.
Marketing Approach and
Strategy:
Our
approach is to demonstrate to utilities the financial benefits of ACCC®
conductor through a lowest total cost of ownership approach while providing
assurances that the mission critical application of electricity transmission
through a product that provides as much, if not more, reliability as the
existing ACSR conductors. We are also highlighting the
environmentally friendly benefits of ACCC®
conductor due to lower line losses.
Conductors
are currently considered and sold to the industry as commodity items with little
or no distinction between the products offered from one manufacturer to the
next. To communicate the value proposition of the ACCC®
conductor solution effectively, we must speak to and educate various
participants in the decision making process regarding ACCC®
conductor's ability to solve line problems. In this respect, CTC Cable focuses
its sales and marketing message on selling solutions instead of simply one
component of a solution. This approach is necessary to promote a
dramatically improved product into a mature conservative
environment. To help illustrate and quantify this solution-based
message, CTC Cable has created sales and engineering
tools. Principally, the tool known as the Conductor Comparison
Program (CCP), performs electrical throughput, structural calculations and
financial cost benefit analysis on ACCC®
conductors and compares them to other available conductors. This analysis of
ACCC®
conductors, when viewed in terms of “cost per delivered kilowatt”, presents a
compelling value proposition under most operating conditions.
Our total
cost of ownership message consists of four general concepts consisting of costs
and revenue benefits including:
|
|
a.
|
Capital costs including towers,
conductor, and installation
|
|
|
b.
|
Recurring maintenance
costs
|
|
|
c.
|
Transmission revenues and grid
management benefits
|
|
|
d.
|
Line loss reductions, including
greenhouse gas emission
reductions
|
Capital
Costs: Capital costs are often lower due to the fewer number of
towers required with ACCC®
conductors and the towers may require less tension than towers using
ACSR. The cost of new transmission corridors vary widely, depending
on terrain, land acquisition costs and permitting costs, but according to the
National Council on Electricity Policy publications (source data: American
Transmission Company, 10-Year Transmission Assessment, September, 2003) is
typically over $900,000 per mile for a single circuit 345kV “Greenfield” line
and can exceed $1 million per mile for higher voltages. New
construction often takes years to obtain the necessary permits and environmental
studies prior to breaking ground on a project. By comparison, it is
considerably less expensive and takes a much shorter amount of time to replace
or “reconductor” existing transmission corridors. The cost and time
to market to reconductor a transmission corridor is dependent on the number of
tower replacements and retrofits to existing towers, however the same source
cites a 2003 cost of $400,000 for a 69kV to 138kV upgrade cost using ACSR due to
materials costs, installation charges and tower upgrades. By
comparison, assuming little or no tower upgrades, ACCC®
conductor cost per corridor mile would typically be $150,000 - $200,000 per
circuit replaced, or about half the cost, assuming a minimum number of tower
modifications.
12
Recurring
Maintenance: We show that the lack of corrosive steel core, as
compared to ACSR, and the fewer number of towers with lower tension could result
in an overall lower maintenance cost of ACCC®
conductor.
Transmission
Revenues: ACCC®
conductor can operate at a higher operating temperature than ACSR, which allows
for greater capacity at peak demand times, therefore it can operate at times
where an ACSR line would be subject to “rolling blackouts” or
brownouts. For developing countries and even developed countries, the
reliability issues of the transmission grid often cause power reductions or
interruptions to industrial and commercial businesses, which can cause
significant economic effects. The higher peak demand ability has been
demonstrated by actual customers of ACCC® in the
U.S., who routinely use their ACCC® line as
an emergency power shunt to reroute power to ensure better grid
reliability. The temperature limitations of a similar ACSR line would
result in a reduction or elimination of this ability for the transmission
corridor.
Line
losses: ACCC®
demonstrates superior performance in reduced line losses as compared to the same
diameter ACSR conductor.
VIII.
Sales
ACCC® Conductor
Sales:
We sell
ACCC®
conductor in the U.S. and internationally through a direct sales force
headquartered in Irvine, California, and through a combination of channels
including stranding manufacturing licensees/distributors, through sales agents
paid on a commission basis, through engineering and professional consulting
companies, through sales consultants, and through remotely located CTC Cable
employees. A key step in the sales process for CTC Cable is in obtaining “design
wins” for ACCC® products
whereby ACCC®
technology becomes a design specification requirement for a project. Design wins
are obtained by selling our technology solution to utility project managers
either directly by CTC Cable personnel or through engineering and construction
customers.
To the
extent possible, we leverage the sales efforts of our business relations,
including stranding licensees, engineering consulting companies and construction
companies. We have dedicated employees and sales agents embedded in
the China and North American markets and five additional sales consultants or
employees that cover and serve the Latin and South American markets, and sales
personnel that cover India and non-China Asia. During 2010, we also
began to see an increased level of cooperation with engineering consulting
firms. We expect to continue to expand and add relationships with
these entities since they are instrumental in the decision process and design of
transmission lines.
For
international sales, CTC initially penetrates the market by obtaining technical
approvals from a state grid, or similar regulatory body. Business
development teams - with heavy involvement from CTC application engineers – help
coordinate state approvals. CTC then forms relationships with local
stranding partners to leverage local sales forces and provide a localized
product for sale. Local production can significantly reduce
costs such as tariffs, import fees, and shipping costs while providing low-tech
manufacturing jobs locally. We believe this strategy has several advantages to
the product acceptance of ACCC®
conductor within these geographies:
|
|
·
|
By allowing ACCC® core to be stranded within a
local market, the total value content of the ACCC® conductor usually allows the
product to be sold as a local product, rather than as a product imported
from the U.S.
|
|
|
·
|
Sales of primarily
ACCC® core should result in a higher
per unit product margin, but a lower per unit revenue
level.
|
|
|
·
|
By eliminating the necessity of
stranding of ACCC® core with aluminum, the sales
order to cash cycle decreases, and the working capital required to
purchase aluminum is eliminated, resulting in a more efficient and
accelerated cash flow.
|
|
|
·
|
ACCC® conductor sales are often made
using the existing relationships within those markets, resulting in a more
effective and lower cost
sale.
|
As of
September 30, 2010, we had agreements with eight stranding manufacturers: Alcan
Cable in the U.S. and Canada; Lamifil, NV in Belgium; Midal Cable in Bahrain;
Far East Composite Cable Co. in Jiangsu, China; PT KMI Wire and Cable Tbk in
Indonesia; PT Tranka Kabel in Indonesia; IMSA in Argentina and Centelsa in
Colombia; which increased to nine stranding manufacturers with the signing of
Sterlight Technologies Limited in India in November 2010. We are
currently negotiating for additional stranding contractors to serve the Chinese,
South American, Australian, Asian, Eastern European, and North
American markets. Several of our stranding manufacturers have conditional
exclusive marketing and sales clauses and one has made a non-binding commitment
for 2011. Alcan Cable in the U.S. has 30 exclusive customers in the U.S.,
conditional upon achieving minimum annual order quantities starting with $2
million in 2011. Lamifil has certain exclusive territories in the EU,
conditional on achieving sales targets for each. Sterlite
Technologies in India has an exclusive stranding and marketing clause within
India, conditional upon achieving minimum annual order quantities. Far East
Composite Cable Co., a subsidiary of Jiangsu New Far East Cable Company was
formerly under a three year agreement that expired in January,
2010. This agreement has been extended on a month to month basis and
is expected to continue in 2011.
13
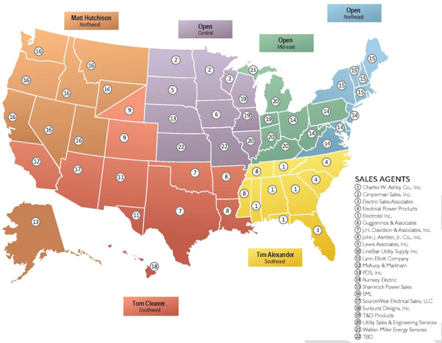 |
The
U.S. market is far more fragmented with over a hundred investor owned
utilities and 300 smaller utilities. For the U.S. market, CTC
employs a two-pronged approach with a top level and technical
sale. The top level sale involves working with regulators,
utility executives, and government bodies to make known the benefits of
ACCC®
technology. CTC’s technical team concurrently provides technical
assistance to utility engineers, utility design firms and
consultants.
|
|
The
CTC sales team has broken North America into 6 sales regions covered by a
network of 14 sales agencies resulting in a selling force of over 50 sales
representatives complementing CTC’s own in-house sales force. CTC also
recently signed stranding and distribution agreements with Alcan Cable,
securing sales relationships with 30 of Alcan’s largest customers and
which requires annual minimum ACCC®
core orders to preserve the exclusivity of those 30
customers.
|
The
current opportunity list for ACCC®
conductor is extensive. Such opportunities consist of separate,
unique transmission conductor projects that have been identified by our sales
and marketing team as opportunities specified to sell ACCC®
conductor, are for projects expected to qualify for use of ACCC®
conductor within the next 24 months and for which contact points with potential
customers have been established. Sales opportunities are listed
at the estimated value of potential revenues to CTC Cable and tracked over time
to closure. Opportunities that are being worked by CTC employees and
consultants, which are currently expected to have a possibility of closure
within fiscal 2011 using ACCC®
products, include over 100 separate transmission projects with a total
value of over $400 million. Additional projects are worked in markets
served by engineering consulting companies and stranding
licensees. All of these projects are opportunities identified by the
Company and there is no guarantee that the Company will be a participant in the
projects.
Addressing
Risk:
To
overcome the risk averse, conservative barriers to the adoption of a new
conductor by the market, we provide through a third-party insurance company a
three-year Original Equipment Manufacturer Warranty (parts and labor) on all
ACCC®
conductor products currently produced by CTC Cable, and all of its stranding
sources sold worldwide. The warranty covers the repair or replacement of the
ACCC®
conductor and connectors, plus a limited labor expense reimbursement. We also
provide through the same third-party insurance company the option to extend the
warranty period to five, seven or ten years. The program covers
ACCC®
conductor for the following: (1) sag and creep; (2) wind generated aeolian
vibration; (3) composite core failure; (4) breakage; (5) corrosion rust; and (6)
unwinding. We believe that the program makes our products more attractive
because it reduces much of the risk and uncertainty of adopting the new
product.
Customers:
Our
customers purchase stranded ACCC®
conductors and ACCC® hardware
and consist of electric utilities, engineering companies, our stranding
manufacturers and our distributors. During the 2010 fiscal year, our
consolidated revenue was derived from a broadening mix of domestic and
international customers. The breakout of revenue by geography for
2010 is as follows: North America 40%, Indonesia 36%, South America 16%, Middle
East 5%, China 2% and Europe 1%. For the year ended September 30, 2009: China
54%, North America 28%, Middle East 7%, Latin America 5%, Europe 5%, and other
markets totaling 1%.
Backlog:
We define
our backlog as firm customer orders supported by a purchase contract with
identified delivery or firm customer purchase orders. Currently, our
backlog of firm orders for fiscal 2011 is $5.9 million. Our
comparable backlog for 2010 was $9.2 million.
14
IX.
Manufacturing
We
produce the patented composite core component of the ACCC®
conductor through CTC Cable Corporation in Irvine, for sale to conductor
manufacturers that strand and distribute the finished conductor in their
particular markets. The manufacture of the core uses a proprietary continuous
process, which allows numerous glass and carbon filaments to be pre-tensioned,
impregnated with high performance resin systems, and then rapidly cured as the
product is pulled through a heated die. The proprietary resin formulations we
use are highly resistant to temperature, impact, tensile and bending stresses,
as well as to environmental conditions encountered in the
field. Primarily for quality control reasons, core manufacture is
carried out at our facilities in Irvine, California. The production facilities
in Irvine were certified under ISO 9001:2000 in November, 2006, re-certified
each year since, and in November 2009 the facilities were certified ISO
9001:2008. A re-certification audit is currently
underway.
We
currently have 18 pultrusion machines in our facility, capable of producing
approximately 17,000 km of ACCC® core per
year representing potential revenues of between $70 million and $430 million,
depending on the pricing and size of the ACCC®
conductor and whether the final product is ACCC® core or
the stranded higher value ACCC®
conductor. We currently have sufficient capacity with our existing
machinery to handle our anticipated production needs for the next year, but we
have prepared plans to open additional ACCC® core
manufacturing plants outside of California to allow for additional expansion and
to mitigate the risk of overreliance on one plant. We are also considering
vertical integration or entering into a strategic relationship to provide for an
uninterrupted supply of ACCC®
conductor. We also produce parts for and license the production of the
special connecting hardware accessories required to install ACCC®
conductor and to ensure that the connecting hardware supply will match conductor
sales requirement. We have no financial commitments for any of these plans at
this time.
The
principal raw materials in the production of the patented ACCC® core are
glass and aerospace grade carbon fibers, combined with specific polymer
resins. Our conductor stranding manufacturers use aluminum rod
materials typical in the production of bare overhead
conductor. Connecting hardware accessories require primarily
high-grade aluminum tube and special steel alloys. The prices for
these raw materials are subject to market variations. We can acquire glass and
resins from several sources and we have two qualified suppliers for carbon
fiber. Over the past year, due to the reduced demand by aerospace
customers of our carbon fiber, we observed a per unit price reduction by our
carbon vendors. We believe this price reduction to be temporary and
could eventually result in an increase in these prices should the aerospace
industry recover and begin to purchase additional quantities of this
material.
X. DeWind Discontinued
Operations
For a
complete discussion of this transaction, please see Item 7 of this
report.
XI. Intellectual
Property
We are
aggressively pursuing patent protection for all aspects of our CTC Cable
conductor composite materials, products, and processing.
Other
than as disclosed in our patents, patent applications, and marketing materials,
we consider our manufacturing process, the components used and material
mixtures, types of materials, and methodologies to be trade secrets and part of
our overall strategy to develop and protect our intellectual property rights to
maintain a competitive advantage against competing products.
The
intellectual property used in our ACCC®
conductor has been developed internally and is aggressively protected through
our intellectual property strategy through the use of intellectual property
laws. We have obtained numerous issued patents and have filings in
over 70 countries. We continue to aggressively defend our
intellectual property rights, which we believe is a key competitive
advantage.
In
connection with our ACCC®
conductor business, CTC Cable Corporation currently has nine issued U.S.
patents, three pending U.S. continuation-in-part
applications, two pending U.S. applications claiming priority to a PCT
international application, and four pending U.S. applications. Of the nine
issued U.S. patents, two, U.S. Patent Numbers 7,368,162 and 7,211,319, are the
subjects of pending litigation and underwent reexamination procedures with the
U.S. Patent and Trademark Office. In 2010, the reexamination procedures for both
U.S. Patents concluded with, collectively, 8 original claims being confirmed, 57
original claims being approved with only minor revisions, and the addition of 90
new claims. In addition, three PCT international applications have entered the
national phase and are currently pending in over 70 strategic countries
world-wide, and a number of divisional applications have been filed based on the
PCT applications in select strategic countries including China, Canada and
Japan. Of these pending applications, twenty-seven applications have been
granted. These patent applications cover subjects including composite materials
as applied to electrical transmission conductors and related structural
apparatus and accessories, manufacturing processing techniques, cross sectional
composite core designs for electrical transmission cables and methods and
designs for splicing composite core reinforced cables. CTC Cable Corporation
plans to continue filing and supplementing these patent applications with new
information as it is developed. The issued and pending patents, and the
provisional U.S. applications, if issued, have patent terms that will end within
the period of 2023 to 2029, depending on the filing dates of each of the
applications.
Our
business and competitive position are dependent upon our ability to protect our
proprietary technologies. Despite our efforts to protect our proprietary rights,
unauthorized parties may attempt to obtain and use information that we regard as
proprietary.
15
There can
be no assurance that others will not independently develop substantially
equivalent proprietary information and techniques or otherwise gain access to
our proprietary information, that such information will not be disclosed or that
we can effectively protect our rights to unpatented trade secrets or other
proprietary information.
There can
be no assurance that others will not obtain patents or other legal rights that
would prevent us from commercializing our technologies in the United States or
other jurisdictions.
From time
to time, we may encounter disputes over rights and obligations concerning
intellectual property. For instance, we are currently engaged in a patent
infringement case which we filed against Mercury Cable & Energy, LLC,
and Mercury has alleged that our patents are not valid. Also, the efforts
we have taken to protect our proprietary rights may not be sufficient or
effective. Any significant impairment of our intellectual property rights could
harm our business, our reputation, or our ability to compete. Also, protecting
our intellectual property rights could be costly and time
consuming.
XII. Research and
Development
We have
spent considerable funds on research and development of our proprietary,
patented, and patents pending ACCC®
conductor and related component technologies. We continue to invest
in the further development of this product with the objective of accelerating
and lowering the cost of production, using less expensive and more readily
available material sources, as well as enhancing the product's properties and
characteristics. We also anticipate the need to continue spending significant
funds to protect the ACCC®
conductor technologies worldwide.
We spent
$2,226,000, $2,703,000, and $4,519,000 on research and development activities in
fiscal years 2010, 2009 and 2008, respectively.
XIII. Governmental
Regulation
We are
not aware of any specific government regulations governing the design and
specifications of bare overhead conductors in the United States or in Europe
that restrict our ability to sell our products. We do not believe the
manufacture of ACCC®
conductor is subject to any specific government regulations other than those
regulations that traditionally apply to manufacturing activities such as the
Occupational Safety and Health Act of 1970 or similar occupational safety
regulations in our other manufacturing locations.
Our
intended operations are generally subject to various governmental laws and
regulations relating to the protection of the environment. These environmental
laws and regulations, which have become increasingly stringent, are implemented
principally by the Environmental Protection Agency in the United States and
comparable European and U.S. state agencies, and govern the management of
hazardous wastes, the discharge of pollutants into the air and into surface and
underground waters, and the manufacture and disposal of certain substances. We
believe that we comply completely with any such laws or
regulations.
A
majority of the international markets require government or type registration
approvals from leading companies or public or semi-private bodies or
associations for our ACCC®
conductor. Certain markets also require conductor manufacturers to be audited
and production methods and raw material supplies approved. We believe
that ACCC®
conductor has received the proper registration approvals from substantially all
markets worldwide including all markets in which we expect product sales to be
completed over the next year.
XIV.
Employees
As of
November 30, 2010, we had a total of 104 full time employees including 99
employees in the United States, 1 in Brazil, 1 in the UK, 1 in the United Arab
Emirates and 2 in China. We also used the services of 5 consultants on a regular
basis for a variety of tasks and responsibilities. Additional consultants are
employed as required for specific tasks. None of our U.S. based
employees are currently represented by a labor organization. We believe that
relations with our employees are good.
XV. Available
Information
We file
annual reports on Form 10-K, quarterly reports on Form 10-Q, current reports on
Form 8-K, proxy statements and other reports, and amendments to these reports,
required of public companies with the Securities and Exchange Commission (SEC).
The public may read and copy the materials we file with the SEC at the SEC’s
Public Reference Room at 100 F Street, NE, Washington, DC 20549. The public may
obtain information on the operation of the Public Reference Room by calling the
SEC at 202-551-8090. The SEC also maintains a web site at www.sec.gov that contains
reports, proxy and information statements and other information regarding
issuers that file electronically with the SEC. We also make available free of
charge on the Investor Relations section of our corporate web site all of the
reports we file with the SEC as soon as reasonably practicable after the reports
are filed. Copies of CTC’s fiscal 2010 Annual Report on Form 10-K may also be
obtained without charge by contacting Investor Relations, Composite Technology
Corporation, 2026 McGaw Ave., Irvine, CA 92614.
16
ITEM
1A. RISK FACTORS
Our
business is subject to a number of risks. You should carefully consider the
following risk factors, together with all of the other information included or
incorporated by reference in this report, before you decide whether to purchase
our common stock. The risks set out below are not the only risks we face. If any
of the following risks occur, our business, financial condition and results of
operations could be materially adversely affected. In such case, the trading
price of our common stock could decline, and you may lose all or part of your
investment.
WE EXPECT
FUTURE LOSSES AND OUR FUTURE PROFITABILITY IS UNCERTAIN.
Prior to
acquiring Transmission Technology Corporation, or TTC, in November 2001, we were
a shell corporation having no operating history, revenues from operations, or
assets since December 31, 1989. We have recorded approximately $83 million in
ACCC® product
sales since inception. Historically, we have incurred substantial losses and we
may experience significant quarterly and annual losses for the foreseeable
future. We may never become profitable. If we do achieve profitability, we may
not be able to sustain or increase profitability on a quarterly or annual basis.
We expect the need to significantly increase our general administrative and
product prototype and equipment prototype production expenses, as necessary. As
a result, we will need to generate significant revenues and earnings to
achieve and maintain profitability.
IF WE
CANNOT RAISE CAPITAL WHEN IT IS NEEDED, WE MAY BE REQUIRED TO REDUCE OR SUSPEND
OPERATIONS OR GO OUT OF BUSINESS ALTOGETHER FOR ONE OR MORE OF OUR OPERATING
SEGMENTS.
We
anticipate that for the foreseeable future, the sales of our ACCC® cable
may not be sufficient enough to sustain our current level of operations and that
we will continue to incur net losses. Further, on January 31, 2010 we
repaid $9.1 million in debt and interest on our remaining convertible debt
obligation. On April 12, 2010 we raised $10.0 million of debt that
has restrictive debt covenant requirements and which places limits on our losses
and limits our cash spending to minimum cash levels. For these reasons, we
believe that we will need to either raise additional capital, until such time,
if ever, as we become cash flow positive. It is highly likely that we will
continue to seek to raise money through public or private sales of our
securities, debt financing or short-term loans, corporate collaborations, asset
sales, or a combination of the foregoing. Our ability to raise additional funds
in the public or private markets may be adversely affected if the results of our
business operations are not favorable, if any products developed are not well
received or if our stock price or trading volume is low. Additional funding may
not be available on favorable terms to us, or at all. To the extent that money
is raised through the sale of our securities, the issuance of those securities
could result in dilution to our existing stockholders. If we raise money through
debt financing, we may be required to secure the financing with all of our
business assets, which could be sold or retained by the creditor should we
default in our payment obligations. If we cannot sustain our working capital
needs with financings or if available financing is prohibitively expensive, we
may not be able to complete the commercialization of our products. As a result,
we may be required to discontinue our operations without obtaining any value for
our products, which could eliminate stockholder equity, or we could be forced to
relinquish rights to some or all of our products in return for an amount
substantially less than we expended.
THE
SENIOR SECURED DEBT ISSUED BY THE COMPANY IN APRIL 2010 INCLUDES RESTRICTIVE
DEBT COVENANTS WHICH MAY LIMIT OUR ABILITY TO OPERATE, OBTAIN FINANCING, OR
WHICH MAY IMPAIR THE ASSETS OF THE COMPANY IN THE EVENT OF A LOAN
DEFAULT.
We
entered into a loan agreement in April 2010 which includes restrictive debt
covenants that include both a liquidity covenant, which requires a minimum
combined cash and accounts receivable balance in excess of $7.5 million, and a
profitability covenant which allows for a maximum level of accumulated non-GAAP
losses after March 31, 2010 of $5 million, adjusted for non-cash items and
timing of revenue recognition. The debt is secured by
substantially all assets of the Company. If we were to violate the
debt covenants, the lenders could pursue remedies included in the loan agreement
which may include any or all of the following: immediate collection of the loan,
assignment of cash receipts, control of the Company’s bank accounts, or
liquidation of the Company’s assets in part or in full. As of
September 30, 2010, the Company was not in compliance with its covenants.
Subsequent to year-end, the Company and lender agreed to amend the debt
covenants and at December 14, 2010 the Company was in compliance with the
amended covenants.
THE
WORLDWIDE ECONOMIC SLOWDOWN MAY HAVE SIGNIFICANT IMPACTS TO OUR GROWTH
STRATEGY.
The long
term nature of our sales cycle often requires long lead times between order
booking and product fulfillment. Our growth strategy assumes that
debt and equity financing will be available for our customers to provide for
such down payments and to pay for our products. The worldwide credit
crisis has delayed, cancelled or restricted the construction budgets and funds
available to our customers that we expect to be the ultimate purchasers of our
products and services. The recent significant declines in the U.S.
and international stock markets, coupled with the failure of several large
financial institutions has caused significant uncertainty and has resulted in an
increase in the return required by investors in relation to the risk of such
projects. This in turn has increased the cost of capital to the
point where new projects or projects in their early or planning stages may not
receive funding or may have the project delayed or cancelled. If we,
or our customers, cannot find alternative financing sources or should the
financial crisis worsen, we may lose sales and incur losses.
17
OUR
INDEPENDENT AUDITORS HAVE ISSUED AN UNQUALIFIED REPORT AND INCLUDED AN EMPHASIS
PARAGRAPH AS OF AND FOR THE YEAR ENDED SEPTEMBER 30, 2010 WITH RESPECT TO OUR
ABILITY TO CONTINUE AS A GOING CONCERN, AND WE MAY NEVER ACHIEVE
PROFITABILITY.
For the
year ended September 30, 2010, our accountants have issued a report relating to
our audited financial statements which contains a qualification with respect to
our ability to continue as a going concern because, among other things, our
ability to continue as a going concern is dependent upon our ability to generate
profitable operations in the future or to obtain the necessary financing to meet
our obligations and repay our liabilities from normal business operations when
they come due. There is no guarantee that the products will be accepted or
provide a marketable advantage, and therefore, no guarantee that the
commercialization will ever be profitable. For the fiscal year ended September
30, 2010, we had a net loss of $19,767,000 and negative cash flows from
operating activities – continuing operations of $17,358,000. For the year ended
September 30, 2009, we had a net loss of $73,751,000 and negative cash flows
from operating activities – continuing operations of $5,883,000. For the year
ended September 30, 2008, we had a net loss of $53,513,000 and negative cash
flows from operating activities – continuing operations of $6,239,000. As of
September 30, 2010, our accumulated deficit was $277,530,000.
BECAUSE
WE ARE IN AN EARLY STAGE OF COMMERCIALIZATION OUR LIMITED HISTORY OF CABLE
OPERATIONS MAKES EVALUATION OF OUR BUSINESS AND FUTURE GROWTH PROSPECTS
DIFFICULT.
Since our
reorganization in 2001, we have had a limited operating history and are at an
early stage of commercialization of a new technology product to a market unused
to using new technologies. We made ACCC®
conductor available and entered into our first commercial agreement in
2003.
Our conductor
technology is a relatively new advance for the electrical utility industry
technology and has not yet achieved widespread adoption. We do not have enough
experience in selling our products at a level consistent with broad market
acceptance and do not know whether we can do so and generate a profit. As a
result of these factors, it is difficult to evaluate our prospects, and our
future success is more uncertain than if we had a longer or more proven history
of operations.
IF OUR
POTENTIAL CUSTOMERS DO NOT ACCEPT OUR CONDUCTOR PRODUCTS, IT IS UNLIKELY THAT WE
WILL EVER BECOME PROFITABLE.
The
electrical utility industry has historically used a variety of technologies,
which have been proven over time to be reliable. Compared to these conventional
technologies, our technology is relatively new, and the number of companies
using our technology is limited. The commercial success of our conductor product
will depend upon the widespread adoption of our technology as a preferred method
by major utility companies to transmit electricity. In order to be successful,
our products must meet the technical and cost requirements for electric
generation and transmission within the electric utility industry. Market
acceptance will depend on many factors, including:
(i) the
willingness and ability of customers to adopt new technologies;
(ii) our
ability to convince prospective strategic relationships and customers that our
technology is an attractive alternative to conventional methods used by the
electric utility industry;
(iii) our
ability to change our customers' evaluation of the economics of power line
construction, changing their focus on limiting initial capital costs to
evaluating the cost and benefit of the full life of a line; and
(iv) our
ability to sell sufficient quantities of our products.
Because
of these and other factors, our product may not gain market acceptance or become
the industry standard for the electrical utility industry. The failure of
utility companies to purchase our products would have a material adverse effect
on our business, results of operations and financial condition.
WE ARE IN
THE PROCESS OF WINDING DOWN OUR REMAINING FORMER DEWIND
SUBSIDIARIES. THESE SUBSIDIARIES HAVE RESIDUAL LIABILITIES AND MAY
HAVE UNRECOVERABLE ASSETS AND ADDITIONAL LIABILITIES. TWO OF OUR
LEGACY DEWIND EUROPEAN SUBSIDIARIES HAS BEEN DECLARED INSOLVENT. THIS
INSOLVENCY MAY CAUSE UNFORESEEN PROBLEMS AND MAY REQUIRE CTC TO PROVIDE FUNDING
TO SATISFY CERTAIN LIABILITIES OR WE MAY BE REQUIRED TO INDEMNIFY THE PURCHASER
OF THE DEWIND ASSETS FOR LOSSES INCURRED AS A RESULT OF THIS WINDING DOWN
PROCESS.
18
Our
remaining interest in our Stribog, formerly DeWind, subsidiaries includes
certain residual liabilities and supply chain related prepayments which may be
recoverable in part, or not at all. We also still retain assets and
liabilities in former DeWind subsidiaries including disputed but recorded
liabilities to subsidiaries that have been declared insolvent. The
operations of the insolvent subsidiary prior to its insolvency was limited to
warranty related activities in existence prior to our acquisition of the DeWind
business. While we do not believe that the insolvency will cause
operational issues to our existing businesses, this subsidiary formerly owned
intellectual property developed prior to our acquisition of DeWind in 2006 which
was subsequently included in the intellectual property portfolio sold to
DSME. The insolvent subsidiary is now under the control of a receiver
in Germany who has assigned certain potential claims for intellectual
property rights to a party related to FKI, who is in litigation against
us. We believe that we have purchased all pertinent intellectual property
rights from these subsidiaries prior to the declaration of insolvency under
the terms and conditions of contractual agreements in effect prior to our
acquisition of the DeWind business. While we believe these
transactions to be valid and binding, under German law for a subsidiary in
insolvency, the receiver may look back and attempt to void
those intellectual property acquisition contracts and
agreements. If these rights to this technology are impaired or diminished,
which we intend to vigorously defend, if required, we may be required to
indemnify DSME, the purchaser of the DeWind assets under the terms of the Asset
Purchase Agreement or to provide additional consideration to the assignee of the
claims. While we believe the likelihood of such an event to be remote, such
indemnification could include all, part, or more than all of the cash escrowed
under the terms and conditions of the DSME Asset Purchase
Agreement.
WE ARE
REQUIRED TO INDEMNIFY DSME UNDER THE TERMS AND CONDITIONS OF THE ASSET PURCHASE
AGREEMENT WITH DSME DATED SEPTEMBER 4, 2009 IN AN AMOUNT UP TO $35 MILLION UNDER
CERTAIN CONDITIONS. INCLUDED IN OUR BALANCE SHEET FOR SEPTEMBER 30,
2010 IS $16.4 MILLION OF CASH THAT IS ESCROWED FOR POTENTIAL
INDEMNIFICATIONS. WE MAY BE REQUIRED TO REFUND CASH FROM THE PROCEEDS
RECEIVED EITHER OUT OF THE ESCROWED FUNDS OR FROM OTHER SOURCES. WE
MAY NOT RECOVER ALL OR PART OF THE ESCROWED CASH BALANCES OR THE RECOVERY OF THE
ESCROWED CASH MAY BE DELAYED LONGER THAN ANTICIPATED.
The
Company has $16.4 million in cash remaining in escrow to indemnify DSME if
claims are made against DSME by third parties and those claims are determined to
be valid and enforceable. The cash is to be released from escrow over
time with the final payment due as much as three years after September 4, 2009
or later under certain conditions, including if valid claims against the Company
or DSME are made. Our intention is to vigorously defend DSME and the
Company against any such claims should they occur. Defense of such
claims may result in additional costs and cash expenditure to maintain the
Company’s interest in the restricted cash or to limit potential
liability. In the event that claims are successful, the balance
payable to DSME may include all, part, or cash amounts in excess of the $16.4
million remaining in escrow including potentially an additional $18.5 million up
to a total of $34.9 million under certain conditions, which are not expected by
the Company. If such claims are successfully made, this would result
in additional losses on the DSME transaction and could require a substantial
refund of the proceeds received.
IF WE
FAIL TO PROPERLY MANAGE OUR GROWTH EFFECTIVELY, OUR BUSINESS COULD BE ADVERSELY
AFFECTED.
The
transition from a small company focused on research and development of our
products to a company with the additional focus on commercial production,
marketing, and sales has placed and will continue to place a significant strain
on our managerial, operational, and financial resources. The failure to manage
our sales and growth effectively could have a material adverse effect on our
business, results of operations and financial condition. Significant additional
growth will be necessary for us to achieve our plan of operation.
WE MUST
PROTECT OUR PROPRIETARY RIGHTS AND PREVENT THIRD PARTIES FROM USING OUR
TECHNOLOGY OR VERY SIMILAR TECHNOLOGY; PROPRIETARY RIGHTS LITIGATION COULD BE
TIME-CONSUMING AND EXPENSIVE.
We are
currently in active litigation with Mercury Cable and its affiliates, have
incurred substantial expense and expect to incur additional expense to defend
our patents and intellectual property rights. We may be required to
expand such litigation in the future in order to protect our intellectual
property rights. Failure to adequately protect our proprietary rights
could enable third parties to use our technology, or very similar technology,
and could reduce our ability to compete in the market, and any proprietary
rights litigation could be time consuming and expensive to prosecute and defend.
Due to the importance of proprietary technology in the electrical utility and
wind energy industries, establishment of patents and other proprietary rights is
important to our success and our competitive position. Performance in the
electrical utility industry can depend, among other factors, on patent
protection. Accordingly, we have filed patent applications in the U.S. and
internationally for all aspects of our composite materials, our conductor
products and processes, including aspects of our product other than the
conductor core, and intend to devote substantial resources to the establishment
and protection of patents and other proprietary rights. Despite our efforts to
establish and protect our patents or other proprietary rights, unauthorized
parties may attempt to copy aspects of our technology or to obtain and use
information that we regard as proprietary. In addition, the laws of some foreign
countries do not protect our proprietary rights to as great an extent as do the
laws of the United States. Our means of establishing and protecting our
proprietary rights may not be adequate and our competitors may independently
develop similar technology, duplicate our products or design around our patents
or our other proprietary rights. As a result, our business involves a risk of
overlap with third party patents and subsequent litigation with competitors or
patent-holders. Any claims, with or without merit, could be time-consuming,
result in additional costly litigation, or cause us to enter into licensing
agreements.
19
WE
OCCASIONALLY MAY BECOME SUBJECT TO LEGAL DISPUTES THAT COULD HARM OUR
BUSINESS.
We have
from time to time become engaged in legal disputes such as claims by consultants
or other third parties. These disputes could result in monetary damages or other
remedies that could adversely impact our financial position or operations. We
believe these claims are without merit and intend to vigorously defend against
them. However, even if we prevail in disputes such as this, the defense of these
disputes will be expensive and time-consuming and may distract our management
from operating our business. Refer to discussion in Item 3 below.
WE DEPEND
ON KEY PERSONNEL IN A COMPETITIVE MARKET FOR SKILLED EMPLOYEES AND FAILURE TO
ATTRACT AND RETAIN QUALIFIED EMPLOYEES COULD SUBSTANTIALLY HARM OUR
BUSINESS.
We rely
to a substantial extent on the management, marketing and product development
skills of our key employees, particularly Benton H Wilcoxon, our Chief Executive
Officer, Marv Sepe, our Chief Operating Officer, DJ Carney, our Chief Financial
Officer and Stewart Ramsay President of CTC Cable Corporation. If Messrs.
Wilcoxon, Sepe, Carney, or Ramsay were unable to provide services to us for
whatever reason, our business could be adversely affected. Neither Mr. Wilcoxon,
Mr. Sepe, Mr. Carney, nor Mr. Ramsay has entered into an employment agreement
with the Company or with CTC Cable Corporation. In addition, our ability to
develop and market our products and to achieve profitability will depend on our
ability to attract and retain highly talented personnel. We face intense
competition for personnel from other companies in the electrical utility
industry. The loss of the services of our key personnel or the inability to
attract and retain the additional, highly-talented employees required for the
development and commercialization of our products may significantly delay or
prevent the achievement of product development and could have a material adverse
effect on us.
A FAILURE
TO ESTABLISH AND MAINTAIN STRATEGIC RELATIONSHIPS MAY HARM OUR
BUSINESS.
Our
success is dependent upon establishing and maintaining strategic relationships,
such as our relationships with Alcan Cable, Lamifil, Midal, Far East Composite
Cable Co, PT KMI Wire and Cable, PT Tranka Kabel, IMSA, Centelsa and Sterlight
Technologies, as our conductor stranders. We face numerous risks in successfully
obtaining suitable partners on terms consistent with our business model,
including, among others:
(i) we
must typically undergo a lengthy and expensive process of building a
relationship with a potential partner before there is any assurance of an
agreement with such party;
(ii) we
must persuade conductor manufacturers with significant resources to rely on us
for critical technology on an ongoing and continuous basis rather than trying to
develop similar technology internally;
(iii) we
must persuade potential partners to bear retooling costs associated with
producing our products; and
(iv) we
must successfully transfer technical know-how to our partners.
Moreover,
the success of our business model also depends on the acceptance of our products
by the utility companies who have historically been conservative in their
adoption of new products and technologies into their infrastructure. Further,
our partners will be selling our products that may compete with their existing
or future conductor products. Our partners are not required to sell our products
and they are not prohibited from discounting the prices of their products below
our prices.
Our
business could be seriously harmed if: (i) we cannot obtain suitable partners;
(ii) our cable partners fail to achieve significant sales of ACCC®
conductor or products incorporating our technology or (iii) we otherwise fail to
implement our business strategy successfully.
WE CANNOT
CONTROL THE COST OF OUR RAW MATERIALS, WHICH MAY ADVERSELY AFFECT OUR
BUSINESS.
The
principal ACCC®
conductor raw materials are glass and carbon fibers, plus various polymer resins
and aluminum. The prices for these raw materials are subject to
market forces largely beyond our control, including energy costs, market demand,
and freight costs. The prices for these raw materials have varied significantly
and may vary significantly in the future. We may not be able to adjust our
product prices, especially in the short-term, to recover the costs of increases
in these raw materials. Our future profitability may be adversely affected to
the extent we are unable to pass on higher raw material and energy costs to our
customers.
INTERRUPTIONS
OF SUPPLIES FROM OUR KEY SUPPLIERS MAY AFFECT OUR RESULTS OF OPERATIONS AND
FINANCIAL PERFORMANCE.
We do not
have long-term or volume purchase agreements with most of our suppliers, and may
have limited options in the short-term for alternative supply if these suppliers
fail, for any reason, including their business failure or financial
difficulties, to continue the supply of materials or components. Moreover,
identifying and accessing alternative sources may increase our costs, extend the
advance purchase time prior to delivery, or both.
20
WE ARE
CONTROLLED BY A SMALL NUMBER OF SHAREHOLDERS, WHOSE INTERESTS MAY DIFFER FROM
OTHER SHAREHOLDERS.
As of
November 30, 2010, Benton H Wilcoxon, our Chairman of the Board, and Credit
Suisse control 29% of the Company’s outstanding common stock. As a result, these
persons have significant influence in determining the outcome of any corporate
matters submitted to our shareholders for approval, including mergers,
consolidations and the sale of all or substantially all of our assets, election
of directors and other significant corporate actions. They could potentially
have the power to prevent a change in control. The interests of these
shareholders may differ from the interests of the other shareholders, and may
limit the ability of other shareholders to affect our management and
affairs.
WE HAVE
AND WILL LIKELY CONTINUE TO EXPERIENCE CUSTOMER CONCENTRATION, WHICH MAY EXPOSE
US TO ALL OF THE RISKS FACED BY OUR POTENTIAL MATERIAL CUSTOMERS.
For the
year ended September 30, 2010, six customers represented 82% of revenue (two in
Indonesia at 31%, two in the U.S. at 30%, one in Chile at 15% and one in the
Middle East at 6%). For the year ended September 30, 2009, three
customers represented 78% of revenue (one in China at 54%, one in Canada at 17%
and one in the Middle East at 7%). For the year ended September 30,
2008, two customers represented 96% of revenue (one in China at 76% and one in
Europe at 20%).
Until and
unless we secure multiple customer relationships, it is likely that we will
experience periods during which we will be highly dependent on one or a limited
number of customers. Dependence on a single or a few customers will make it
difficult to satisfactorily negotiate attractive prices for our products and
will expose us to the risk of substantial losses if a single dominant customer
stops conducting business with us. Moreover, to the extent that we may be
dependent on any single customer, we could be subject to the risks faced by that
customer to the extent that such risks impede the customer's ability to stay in
business and make timely payments to us.
OUR
BUSINESS MAY BE SUBJECT TO INTERNATIONAL RISKS.
We are
pursuing international business opportunities, including in Europe, Russia,
India, China, Mexico, Brazil, the Middle East, Indonesia, certain far eastern
countries and Africa. As to international business in the Middle East, our
current target markets include Saudi Arabia, Qatar, United Arab Emirates, Oman,
Bahrain, Libya, and Jordan. In Africa we are actively pursuing Nigeria and South
Africa as well as engaging in discussions with engineering companies that bid on
trans-African projects. There are no special additional risks related to these
countries that are not disclosed in the list of risks affecting most
international business. To date, except for our manufacturing arrangement in
Bahrain, we have not engaged in any transactions with these countries. Our
Cable business model has been implemented in the United States, Canada, Europe,
Bahrain, Indonesia, and China. We produce ACCC® core in
the United States for delivery to our stranding licensees under manufacturing
and distribution agreements for ACCC®
conductor deliveries made to date in the United States and China. Expansion
internationally will depend on our adaptation of this model to other
international markets and may be costly and time consuming. Risks inherent in
international operations in general include:
(i)
unexpected changes in regulatory requirements, export restrictions, tariffs and
other trade barriers;
(ii)
challenges in staffing and managing foreign operations;
(iii)
differences in technology standards, employment laws and business
practices;
(iv)
longer payment cycles and problems in collecting accounts
receivable;
(v)
political instability;
(vi)
changes in currency exchange rates;
(vii)
currency exchange controls; and
(viii)
potentially adverse tax consequences.
In
particular, certain of our target markets in the Middle East include Iraq and
Afghanistan in which there is considerable violent instability that may affect
our ability to operate in those markets.
21
COMPLIANCE
WITH ENVIRONMENTAL REGULATIONS COULD INCREASE OUR OPERATING COSTS, WHICH WOULD
ADVERSELY AFFECT THE COMMERCIALIZATION OF OUR TECHNOLOGY.
Our
intended operations are subject to various federal, state, and local laws and
regulations relating to the protection of the environment. These environmental
laws and regulations, which have become increasingly stringent, are implemented
principally by the Environmental Protection Agency and comparable state
agencies, and govern the management of hazardous wastes, the discharge of
pollutants into the air and into surface and underground waters, and the
manufacture and disposal of certain substances. There are no material
environmental claims currently pending or, to our knowledge, threatened against
us. In addition, we believe our planned operations will be implemented in
compliance with the current laws and regulations. We estimate that any expenses
incurred in maintaining compliance with current laws and regulations will not
have a material effect on our earnings or capital expenditures. However, there
can be no assurance that current regulatory requirements will not change, that
currently unforeseen environmental incidents will not occur, or that past
non-compliance with environmental laws will not be discovered.
CHANGES
IN INDUSTRY STANDARDS AND REGULATORY REQUIREMENTS MAY ADVERSELY AFFECT OUR
BUSINESS.
As a
manufacturer and distributor of wire and conductor products we are subject to a
number of industry standard-setting authorities, such as the Institute of
Electrical and Electronic Engineers, the Europe based International Council on
Large Electric Systems, the American Society of Testing and Materials and the
Canadian Standards Association. In addition, many of our products may become
subject to the requirements of federal, state and local or foreign regulatory
authorities. Changes in the standards and requirements imposed by such
authorities could have an adverse effect on us. In the event we are unable to
meet any such standards when adopted our business could be adversely affected.
In addition, changes in the legislative environment could affect the growth and
other aspects of important markets served by us. While certain legislative bills
and regulatory rulings are pending in the energy sector which could improve our
markets, any delay or failure to pass such legislation and regulatory rulings
could adversely affect our opportunities and anticipated prospects may not
arise. It is not possible at this time to predict the impact that any such
legislation or regulation or failure to enact any such legislation or
regulation, or other changes in laws or industry standards that may be adopted
in the future, could have on our financial results, cash flows or financial
position.
WE
EXPERIENCE COMPETITION FROM OTHER COMPANIES, WHICH COULD RENDER OUR PRODUCTS
OBSOLETE OR SUBSTANTIALLY LIMIT THE VOLUME OF PRODUCTS THAT WE SELL. THIS WOULD
LIMIT OUR ABILITY TO COMPETE AND ACHIEVE PROFITABILITY.
The
market in which we compete is competitive. Our conductor competitors include
makers of traditional bare overhead wire and other companies with
developmental-stage products that may be marketing or developing products that
compete with our products or would compete with them if developed. We expect
that we will be required to continue to invest in product development,
productivity improvements and customer service and support in order to compete
in our markets. Such competitors could develop a more efficient product or
undertake more aggressive and costly marketing campaigns than us which may
adversely affect our marketing strategies and could have a material adverse
effect on our business, results of operations or financial condition. In
addition, as we introduce new products, we will compete directly with a greater
number of companies. There is no assurance that we will successfully compete
against current or future competitors nor can there be any assurance that
competitive pressures faced by us will not result in increased marketing costs,
loss of market share or otherwise will not materially adversely affect our
business, results of operations and financial condition.
THE
COMPANY HAS HAD A HISTORY OF MATERIAL WEAKNESSES IN THE ACCOUNTING, FINANCIAL
AND BUSINESS INTERNAL CONTROL STRUCTURE.
The
Company has determined that the internal control structure of the consolidated
entity has material weaknesses that will require the investment of additional
resources to mitigate and resolve. The Company may be required to
hire additional employees, consult with expert advisors, invest in information
technology, provide for additional Board oversight and add an internal
audit function. These remediation efforts may consume additional
financial resources resulting in additional expense to the Company.
Risks
Related to our Securities
THERE IS
CURRENTLY A LIMITED TRADING MARKET FOR OUR COMMON STOCK, SO YOU MAY BE UNABLE TO
LIQUIDATE YOUR SHARES IF YOU NEED MONEY.
Our
common stock is traded in the Over-the-Counter market through the OTC
Bulletin Board. There is currently an active trading market for the common
stock; however there can be no assurance that an active trading market will be
maintained. Trading of securities on the OTC Bulletin Board is generally limited
and is effected on a less regular basis than that effected on other exchanges or
quotation systems, such as the NASDAQ Stock Market, and accordingly investors
who own or purchase common stock will find that the liquidity or transferability
of the common stock is limited. Additionally, a shareholder may find it more
difficult to dispose of, or obtain accurate quotations as to the market value,
of common stock. There can be no assurance that the common stock will ever be
included for trading on any stock exchange or through any other quotation
system, including, without limitation, the NASDAQ Stock Market.
22
THE
APPLICATION OF THE PENNY STOCK RULES COULD ADVERSELY AFFECT THE MARKET PRICE OF
OUR COMMON STOCK.
As long
as the trading price of our common stock is below $5.00 per share, the open
market trading of our common stock will be subject to the penny stock rules. The
penny stock rules impose additional sales practice requirements on
broker-dealers who sell securities to persons other than established customers
and accredited investors, generally those with assets in excess of $1,000,000 or
annual income exceeding $200,000 or $300,000 together with their spouse. For
transactions covered by these rules, the broker-dealer must make a special
suitability determination for the purchase of securities and have received the
purchaser's written consent to the transaction before the purchase.
Additionally, for any transaction involving a penny stock, unless exempt, the
broker-dealer must deliver, before the transaction, a disclosure schedule
prescribed by the Securities and Exchange Commission relating to the penny stock
market. The broker-dealer also must disclose the commissions payable to both the
broker-dealer and the registered representative and current quotations for the
securities. Finally, monthly statements must be sent disclosing recent price
information on the limited market in penny stocks. These additional burdens
imposed on broker-dealers may restrict the ability of broker-dealers to sell the
common stock and may affect a shareholder's ability to resell the common stock.
Shareholders should be aware that, according to Securities and Exchange
Commission Release No. 34-29093, dated April 17, 1991, the market for penny
stocks has suffered in recent years from patterns of fraud and abuse. Such
patterns include: (i) control of the market for the security by one or a few
broker-dealers that are often related to the promoter or issuer; (ii)
manipulation of prices through prearranged matching of purchases and sales and
false and misleading press releases; (iii) boiler room practices involving
high-pressure sales tactics and unrealistic price projections by inexperienced
sales persons; (iv) excessive and undisclosed bid-ask differential and markups
by selling broker-dealers; and (v) the wholesale dumping of the same securities
by promoters and broker-dealers after prices have been manipulated to a desired
level, along with the resulting inevitable collapse of those prices and with
consequent investor losses.
THE PRICE
OF OUR COMMON STOCK IS VOLATILE. VOLATILITY MAY INCREASE IN THE FUTURE, WHICH
COULD AFFECT OUR ABILITY TO RAISE CAPITAL IN THE FUTURE OR MAKE IT DIFFICULT FOR
INVESTORS TO SELL THEIR SHARES.
The
market price of our common stock may be subject to significant fluctuations in
response to our operating results, announcements of new products or market
expansions by us or our competitors, changes in general conditions in the
economy, the financial markets, the electrical power transmission and
distribution industry, or other developments and activities affecting us, our
customers, or our competitors, some of which may be unrelated to our
performance. The sale or attempted sale of a large amount of common stock into
the market may also have a significant impact on the trading price of our common
stock. During the last 12 fiscal months ending September 30, 2010, the closing
bid prices for our common stock have fluctuated from a high of $0.54 to a low of
$0.17. Fluctuations in the trading price or liquidity of our common stock may
adversely affect our ability to raise capital through future equity
financings.
WE DO NOT
ANTICIPATE PAYING DIVIDENDS IN THE FORESEEABLE FUTURE. THE LACK OF DIVIDENDS MAY
REDUCE YOUR RETURN ON AN INVESTMENT IN OUR COMMON STOCK.
To the
extent we have earnings, we plan to use them to fund our operations. We have not
paid dividends on the common stock and do not anticipate paying such dividends
in the foreseeable future. We cannot guarantee that we will, at any time,
generate sufficient surplus cash that would be available for distribution as a
dividend to the holders of our common stock. Therefore, any return on your
investment would be derived from an increase in the price of our stock, which
may or may not occur. In the past, following periods of volatility in the market
price of a company's securities, securities class action litigation has often
been instituted. If a securities class action suit is filed against us, we would
incur substantial legal fees and our management's attention and resources would
be diverted from operating our business in order to respond to the
litigation.
AS OF
NOVEMBER 30, 2010, WHILE CURRENT MARKET PRICES ARE BELOW SUBSTANTIALLY ALL OF
OUR OUTSTANDING CONVERTIBLE EQUITY SECURITIES, INCLUDING OPTIONS AND WARRANTS, A
SUBSTANTIAL NUMBER OF OPTIONS ARE PRICED AT $0.35 PER SHARE OR
BELOW. A PRICE INCREASE ABOVE THAT STRIKE PRICE WOULD RESULT IN
APPROXIMATELY 39,700,000 OPTIONS AND WARRANTS AT OR BELOW $0.35 PER SHARE OF
WHICH FULL CONVERSION OF SUCH SHARES WOULD INCREASE THE OUTSTANDING COMMON
SHARES BY 13.8% TO APPROXIMATELY 328,000,000 SHARES. A PRICE INCREASE
TO $1.00 WOULD RESULT IN APPROXIMATELY 48,100,000 OPTIONS AND WARRANTS AT OR
BELOW THAT PRICE OF WHICH FULL CONVERSION OF SUCH SHARES WOULD INCREASE THE
OUTSTANDING COMMON SHARES BY 16.7% TO APPROXIMATELY 336,300,000
SHARES.
The
exercise price of outstanding options and warrants may be less than the current
market price for our common shares. In the event of the exercise of these
securities, a shareholder could suffer substantial dilution of his, her or its
investment in terms of the percentage ownership in us as well as the book value
of the common shares held. At the November 30, 2010 market price of $0.26 per
share, approximately 4,700,000 shares would be exercisable for less than the
current market price.
23
OUR
FUTURE REVENUE IS UNPREDICTABLE AND COULD CAUSE OUR OPERATING RESULTS TO
FLUCTUATE SIGNIFICANTLY FROM QUARTER TO QUARTER.
Our
quarterly revenue and operating results are difficult to predict and may
fluctuate significantly from quarter to quarter. Our business
consists of a small number of relatively large dollar transactions and the
timing of revenue recognition is heavily dependent on customer defined delivery
dates and shipping schedules which may impact the timing of revenue
recognition. Historically, our CTC Cable business has had a
significant portion of its revenue sourced from one customer in China and
revenue recognition is determined by shipment of products to this customer
subject to their delivery schedules. Since our revenues may
fluctuate and are difficult to predict, and our expenses are largely independent
of revenues in any particular period, it is difficult for us to accurately
forecast revenues and profitability.
OUR
BUSINESS IS SUBJECT TO A VARIETY OF ADDITIONAL RISKS, WHICH COULD MATERIALLY
ADVERSELY AFFECT QUARTERLY AND ANNUAL OPERATING RESULTS, INCLUDING:
(i)
market acceptance of our composite technologies by utility
companies;
(ii)
significant delays in sales that could adversely impact our cash flow relating
to purchase delays or additional potential lengthy lead times for the
implementation of new lines or the reconductoring of existing
lines;
(iii) the
loss of a strategic relationship or termination of a relationship with a
conductor partner;
(iv)
announcements or introductions of new technologies or products by us or our
competitors;
(v)
delays or problems in the introduction or performance of enhancements or of
future generations of our technology;
(vi)
failures or problems in our utility conductor product, particularly during the
early stages of the introduction of the product;
(vii)
delays in the adoption of new industry standards or changes in market perception
of the value of new or existing standards;
(viii)
competitive pressures resulting in lower revenues;
(ix)
personnel changes, particularly those involving engineering and technical
personnel;
(x) costs
associated with protecting our intellectual property;
(xi)
potential failures by customers to make payments under their
contracts;
(xii)
market-related issues, including lower ACCC®
conductor demand brought on by excess conductor inventory and lower average
selling prices for ACCC®
conductor as a result of market surpluses;
(xiii)
increased costs or shortages of key raw materials including aluminum, carbon
fiber and glass fiber;
(xiv)
regulatory developments; and
(xv)
general economic trends and other factors.
ITEM
1B. UNRESOLVED STAFF COMMENTS
None.
ITEM
2 - PROPERTIES
We do not
own any real estate. We lease operations facilities in Irvine, California
and offices in Beijing, China.
On
January 1, 2004 we commenced leasing a combination manufacturing and office
facility in Irvine, California with approximately 105,120 square feet, including
21,180 square feet in the office area with the remaining 83,940 manufacturing,
storage and other areas. The original lease was for seven years amounting to an
average rental cost of $83,000 per month. On April 1, 2010, we
renegotiated and renewed the lease for an additional three years amounting to an
average rental cost of $69,000 per month with rent starting at $72,533 per month
for the first year and increasing by $2,102 on April 1 of each subsequent year
of the lease term.
On
September 9, 2010 we commenced leasing an office facility in Beijing, China at
approximately $6,700 per month over a twenty-six month term. The
lease contains no accelerations.
24
ITEM
3 - LEGAL PROCEEDINGS
Below we
describe the legal proceedings we are currently involved in or which were
resolved during the fiscal year ended September 30, 2010 through the date we
prepared this report:
(i) The FKI
related matters:
FKI
PLC and FKI Engineering Ltd v. Stribog Ltd and De Wind GmbH
On or
about January 21, 2010, FKI Engineering Ltd. and FKI Engineering, formerly FKI
Plc., filed an action against Stribog Ltd., formerly DeWind Ltd., in the
Commercial Court, Queen’s Bench Division, United Kingdom (Case No. 2010 Folio
61). FKI’s claim is brought pursuant to an assignment agreement executed
by the insolvency administrator assigning FKI the right to pursue claims on
behalf of DeWind GmbH for amounts allegedly owed to DeWind GmbH from Stribog
Ltd. In particular, the claim alleges that Stribog Ltd. is in breach of an
August 1, 2005 business transfer agreement where DeWind GmbH agreed to sell and
DeWind Ltd. agreed to purchase the assets of DeWind GmbH. FKI Engineering
Ltd. and FKI Ltd. claim that DeWind GmbH is owed approximately 46,681,543 Euros
(US $60,677,000 at November 30, 2010 exchange rates), which sum is comprised by
a claim for principal in the sum of Euros 28,346,590 plus Value Added Tax of
Euros 4,542,181, together with either interest of Euros 13,792,772 as at 21
January 2010 (continuing at a daily rate of Euros 7,316.63) or, in the
alternative, statutory interest. Stribog Ltd. disputes that it owes any
funds to DeWind GmbH and is vigorously contesting the validity of this
allegation. Amongst other issues in dispute, the validity of the
Assignment is currently subject to proceedings in both the Luebeck court in
Germany (commenced by the company against FKI in September 2009) and the English
courts (commenced by FKI in January 2010). The Luebeck court is expected
to determine the dispute in the first half of 2011. Stribog also applied
to stay the English proceedings on the basis that the issue was first filed in
the German courts. This stay was not given in May 2010 but the Court of
Appeal granted leave to appeal that decision in October 2010, which is likely to
be heard in February 2011.
Stribog
Ltd. (formerly DeWind Ltd.) v. FKI Plc. and FKI Engineering Ltd.
On
September 18, 2009 the Company’s wholly owned subsidiary, Stribog Ltd. (formerly
DeWind Ltd.), filed an action for negative declaration in the Court of Lubeck,
Germany against FKI Engineering Ltd. and FKI Ltd., formerly FKI Plc (“FKI”)
(Case No. 17 O256/09) to obtain a court’s declaration that FKI is not entitled
to any rights to rescission and claims against Stribog Ltd. pursuant to an
assignment agreement executed by the German Insolvency administrator of DeWind
GmbH assigning such rights to FKI. In its defense, FKI states (i)
that the license agreement dated August 1, 2005 and the following transfer of
those licenses for a purchase price of 500,000 Euros (US $650,000 at November
30, 2010 exchange rates) from DeWind GmbH to Stribog Ltd. in August 2008 could
be challenged, in particular as the transferred licenses would have a
significant higher value and (ii) that claims for damages could arise from a
sale and transfer agreement dated August 1, 2005. Any particular
amount in this respect was not provided by FKI. The Company believes
that (i) fair market value was paid for this intellectual property and that the
transactions were conducted at arm’s length, therefore any rights to rescission
do not exist and (ii) that the assignment agreement was
invalid. Stribog Ltd. has not recorded a liability as it is uncertain
(i) whether the court decides that such rights to challenge the transfer exist
or not and whether the assignment of such rights to FKI is valid and (ii) if the
court decides that such rights can be claimed by FKI, whether FKI will challenge
the transfer accordingly.
Insolvency
of DeWind GmbH
On August
29, 2008 in Lubeck Local Court – Bankruptcy Court, Lubeck Germany, DeWind GmbH,
an indirect subsidiary of the Company, filed for voluntary insolvency in lieu of
a required recapitalization under German law of approximately 5,000,000 Euros
(US $6,499,000 at November 30, 20010 exchange rates) (Case No. 53a1E 8/08
). The DeWind GmbH subsidiary had limited operational function for
the DeWind segment, functioning solely to provide services on wind turbines that
remained under warranty and which warranties were entered into prior to June,
2005.
On
September 18, 2008 an insolvency receiver was appointed and set an initial
reporting date in December, 2008 and which was primarily procedural in
nature. No formal reporting has been received since December,
2008. Since the date of insolvency, the insolvency receiver has, or
is in the process of assigning all actual and potential claims of DeWind GmbH
including without limitation, potential claims of DeWind GmbH against the
Company’s remaining Stribog subsidiaries, primarily Stribog Ltd, the Company’s
remaining operating subsidiary in the UK. On September 8, 2009, the
insolvency receiver for DeWind GmbH and FKI entered into an Agreement in regard
to a Settlement of Claims in which the insolvency receiver assigned any
potential claim DeWind GmbH held against the Company, DeWind, Inc. and related
Company entities to FKI for undisclosed consideration. All liabilities
associated with these potential claims are recorded in liabilities from
discontinued operations. This assignment has been disputed as
discussed above.
25
(ii) The
Mercury related matters:
Composite
Technology Corporation and CTC Cable Corporation v. Mercury Cable & Energy,
LLC, Ronald Morris, Edward Skonezny, Wang Chen, and “Doe” Defendants 1-100
(“Mercury”)
On August
15, 2008 the Company filed suit in the Superior Court of the State of
California, County of Orange, Central Justice Center (Case No. 30-2008 00110633)
against the Mercury parties including multiple unknown “Doe” defendants,
expected to be named in discovery proceedings, claiming Breach of Contract,
Unfair Competition, Fraud, Intentional Interference with Contract, and
Injunctive Relief. Several of the Mercury parties had filed a claim
under the Company’s Chapter 11 bankruptcy proceedings which was settled during
the bankruptcy and which provided for certain payments for sales made to
China. The settlement agreement included non-compete agreements and
stipulated the need to maintain confidentiality for the Company’s technology,
processes, and business practices. The Company claims that the
Mercury parties have taken actions, which violate the Settlement Agreement and
the Bankruptcy Court Order, including the development of and attempting to
market similar conductor products and misusing confidential information and the
Company further claims that the Settlement Agreement was entered into with
fraudulent intent. The Company claims that the Mercury parties
engaged in unlawful, unfair, and deceptive conduct and that these actions were
performed with malice and with intent to cause injury to the
Company. Discovery is underway and trial is currently scheduled for
June, 2011.
CTC
Cable Corporation v. Mercury Cable & Energy, LLC, Energy Technology
International, General Cable Corporation, Diversified Composites, Ronald Morris,
Edward Skonezny, Wang Chen, and Todd Harris
On March
3, 2009, CTC Cable filed action against Mercury Cable for patent infringement in
the U.S. District Court, Central District of California, Southern Division (Case
No. SACV 09-261 DOC (MLGx)). CTC Cable believes upon information that
the Defendants have infringed, contributed to infringement of, and/or actively
induced infringement by itself and/or through its agents, unlawfully and
wrongfully making, using, offering to sell, and/or selling products and
materials embodying the patented invention within and outside the United States
without permission or license from CTC Cable. In response to this lawsuit,
Mercury requested the United States Patent and Trademark Office reexamine the
'162 and '319 patents and requested the Court to stay the patent and copyright
lawsuit pending the Patent Office's final reexamination of CTC's
patents. The Court granted Mercury's request to stay the lawsuit
pending the Patent Office’s final decisions. The reexamination has
now been completed and all original claims have been upheld with only minor
amendments. No claims have been finally rejected. The
discovery stay has now been lifted and CTC Cable is in process of
discovery.
On
October 18, 2010 the Court approved the expansion of the complaint to include
additional defendants including additional Mercury subsidiaries, Mercury’s
strander, General Cable Corporation, Mercury’s core producer Diversified
Composites, and Individuals Morris, Harris, Chen, and Skonezny. The Company is
asking for actual damages, treble damages, attorneys fees, interest, costs and
injunctive relief. No estimate of such damages can be made at this
time and no accrual for the Company’s future fees and costs is included in the
Company's financial statements at September 30, 2010.
In
Re Composite Technology Corporation Derivative Litigation (Brad Thomas v. Benton
Wilcoxon, Michael Porter, Domonic J. Carney, Michael McIntosh, Stephen Bircher,
Rayna Limited, Keeley Services Limited, Ellsford Management Limited, Laikadog
Holdings Limited, James Carkulis, and Does 1 through 1000 (including D. Dean
McCormick, III, CPA as Doe 1, John P. Mitola, as Doe 2, and Michael K. Lee, as
Doe 3) and Nominal Defendant Composite Technology Corporation)
On June
26, 2009 Mr. Brad Thomas, alleged to be a shareholder of the Company, filed a
shareholder derivative complaint in the Superior Court of the State of
California, County of Orange (Case No. 30-2009-00125211) for damages and
equitable relief. Certain of the defendants are current directors
and/or officers or past officers of the Company. Under the Company’s
articles of incorporation and bylaws, the Company is obligated to provide for
indemnification for director and officer liability.
On
October 13, 2009, the Company and the individual defendants filed demurrers
(motions to strike) to the Complaint on the grounds that Plaintiff Thomas did
not make a written demand on the Company’s board of directors prior to filing
the Complaint as required under Nevada law and that any decisions made by the
individual director/office defendants in relation to the subject matter of the
Complaint are protected under the business judgment rule. Prior to the scheduled
hearing on the demurrer, Plaintiff Thomas filed a First Amended Complaint on or
about November 11, 2009 naming three additional current board members. In
addition, on October 20, 2009, the Company filed a Motion to Stay Discovery in
this matter on the grounds that Plaintiff Thomas should not be permitted to
conduct discovery until such time as the dispute over the sufficiency of the
First Amended Complaint is decided by the Court. On January 22, 2010,
the Company filed another demurrer (motion to strike) to the First Amended
Complaint on the same grounds as the original demurrers. On January 27, 2010,
the Court conducted a hearing on the merits of the demurrer and took the matter
under submission. On March 8, 2010, the Court overruled the demurrer
and lifted the stay on discovery. On March 25, 2010, Plaintiff Thomas
filed a Second Amended Complaint containing substantially the same allegations
against the individual defendants as the previous complaints. On July
19, 2010, the Company filed a Motion for Judgment on the Pleadings seeking to
dismiss the action in its entirety. On September 7, 2010 the
Court heard oral arguments on the Defendants’ Motion for Preliminary Injunction
to Enjoin Plaintiff From Service as the Shareholder Representative of the
Company, heard concurrently with the Court’s own Motion to Review Plaintiff’s
Standing. On October 28, 2010 the Honorable David R. Chaffee
dismissed the complaint with prejudice and noted Mercury’s involvement in the
matter.
ITEM 4
– (Removed and Reserved)
26
PART
II
ITEM
5 - MARKET FOR REGISTRANT’S COMMON EQUITY, RELATED SHAREHOLDER MATTERS AND
ISSUER PURCHASES OF EQUITY SECURITIES
Market
Information
Our
common stock is traded on the over-the-counter market on the OTC Bulletin Board
under the symbol “CPTC”. The following table sets forth the high and low bid
information for our common stock for each quarter within the last two fiscal
years. Over-the-counter market quotations reflect inter-dealer
prices, without retail mark-up, mark-down or commission and may not necessarily
represent actual transactions.
QUARTER ENDED - FISCAL
2010
|
HIGH
|
LOW
|
|||||||
|
December
31, 2009
|
$ | 0.54 | $ | 0.26 | ||||
|
March
31, 2010
|
$ | 0.31 | $ | 0.25 | ||||
|
June
30, 2010
|
$ | 0.28 | $ | 0.17 | ||||
|
September
30, 2010
|
$ | 0.25 | $ | 0.18 | ||||
QUARTER ENDED - FISCAL
2009
|
HIGH
|
LOW
|
|||||||
|
December
31, 2008
|
$ | 0.62 | $ | 0.18 | ||||
|
March
31, 2009
|
$ | 0.35 | $ | 0.16 | ||||
|
June
30, 2009
|
$ | 0.44 | $ | 0.22 | ||||
|
September
30, 2009
|
$ | 0.73 | $ | 0.22 | ||||
These
quotations reflect inter-dealer prices, without retail mark-up, mark-down or
commission, and may not represent actual transactions.
Performance
Graph
The
following graph compares the cumulative 5 year total return to shareholders of
our common stock relative to the cumulative total returns of the Russell 2000
Index (Russell 2000) and one peer company, American Superconductor
Corporation (AMSC), calculated similarly for the same period. An
investment of $100 (with reinvestment of all dividends) is assumed to have been
made in our common stock, the Russell 2000 and AMSC on September 30, 2005 and
its relative performance is tracked through September 30,
2010.
This
stock performance information is “furnished” and shall not be deemed to be
“soliciting material” or subject to Rule 14A, shall not be deemed “filed”
for purposes of Section 18 of the Exchange Act or otherwise subject to the
liabilities of that section, and shall not be deemed incorporated by reference
in any filing under the Securities Act of 1933, as amended, or the Exchange Act,
whether made before or after the date of this report and irrespective of any
general incorporation by reference language in any such filing, except to the
extent that we specifically incorporate the information by
reference.
27
COMPARISON
OF 5 YEAR CUMULATIVE TOTAL RETURN*
AMONG THE
COMPANY, THE RUSSELL 2000 INDEX,
AND ONE
PEER ISSUER
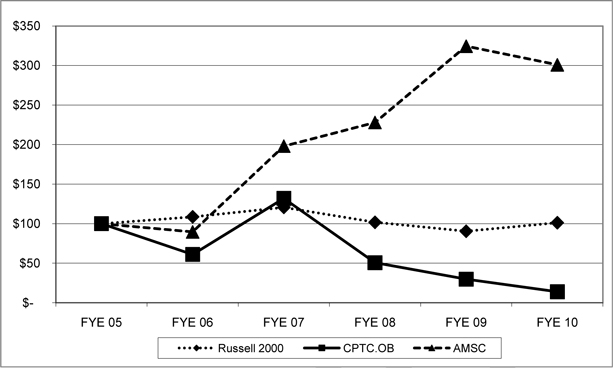
* $100
invested on 9/30/2005 in stock or index, including reinvestment of dividends, if
any. Fiscal year ended September 30.
THE
FOREGOING GRAPH REPRESENTS HISTORICAL STOCK PRICE PERFORMANCE AND IS NOT
NECESSARILY INDICATIVE OF ANY FUTURE STOCK PRICE PERFORMANCE.
Security
Holders
As of
November 30, 2010, there were approximately 473 shareholders of record of our
common stock and no shareholders of record of our preferred stock.
Dividend
Policy
We have
never paid any dividends on the common stock. We currently anticipate that any
future earnings will be retained for the development of our business and do not
anticipate paying any dividends on the common stock in the foreseeable
future.
Securities
Authorized for Issuance under Equity Compensation Plans
See
Part III, Item 12 - Security Ownership of Certain Beneficial
Owners and Management and Related Stockholder Matters with respect to
information to be incorporated by reference regarding our equity compensation
plans.
Recent
Sales of Unregistered Securities
During
the year ended September 30, 2010, we did not have any sales of unregistered
securities which have not been previously disclosed in a quarterly report on
Form 10-Q or in a current report on Form 8-K.
Repurchase
of Equity Securities
None.
ITEM
6 – SELECTED FINANCIAL DATA
The
following table sets forth our selected historical consolidated financial data
for each of the fiscal years in the five-year period ended September 30, 2010,
which were derived from our audited consolidated financial statements. The
following data should be read in conjunction with "Management's Discussion and
Analysis of Financial Condition and Results of Operations" and our audited
consolidated financial statements and related notes included elsewhere in this
Annual Report.
28
|
(All figures are presented in thousands except per
share items)
|
Years Ended September 30
|
|||||||||||||||||||
|
2006*
|
2007*
|
2008*
|
2009*
|
2010
|
||||||||||||||||
|
Statement
of Operations Data:
|
||||||||||||||||||||
|
Revenue
|
$ | 3,554 | $ | 16,008 | $ | 32,715 | $ | 19,602 | $ | 10,842 | ||||||||||
|
Loss
from Continuing Operations
|
(23,691 | ) | (18,010 | ) | (10,083 | ) | (19,438 | ) | (20,823 | ) | ||||||||||
|
Income
(Loss) from Discontinued Operations (Note 2 )
|
(4,832 | ) | (26,474 | ) | (43,430 | ) | (54,313 | ) | 1,056 | |||||||||||
|
Net
loss
|
(28,523 | ) | (44,484 | ) | (53,513 | ) | (73,751 | ) | (19,767 | ) | ||||||||||
|
Net
Assets (Liabilities) of Discontinued Operations (Note 2 )
|
46,805 | 36,069 | 34,835 | (42,067 | ) | (36,287 | ) | |||||||||||||
|
Total
Assets
|
53,549 | 66,323 | 173,087 | 54,839 | 32,295 | |||||||||||||||
|
Total
Long-Term Obligations
|
111 | 9,835 | 9,061 | 1,987 | 2,027 | |||||||||||||||
|
Cash
Dividends per Common Share
|
— | — | — | — | — | |||||||||||||||
|
Basic
and fully diluted loss from continuing operations per common
share
|
$ | (0.17 | ) | $ | (0.09 | ) | $ | (0.04 | ) | $ | (0.07 | ) | $ | (0.07 | ) | |||||
|
Basic
and fully diluted net loss per common share
|
$ | (0.20 | ) | $ | (0.23 | ) | $ | (0.22 | ) | $ | (0.26 | ) | $ | (0.07 | ) | |||||
*On July
3, 2006 the Company acquired its DeWind segment. On September 4,
2009, the Company sold substantially all assets and liabilities of our DeWind
segment. All operations of DeWind have been reclassified to discontinued
operations (See Note 2 to the consolidated financial statements).
ITEM
7 - MANAGEMENT’S DISCUSSION AND ANALYSIS OF FINANCIAL CONDITION AND
RESULTS OF OPERATIONS
The
following discussion of our financial condition and results of operations should
be read in conjunction with the financial statements and related notes thereto.
The following discussion contains certain forward-looking statements that
involve risks and uncertainties. Our actual results could differ materially from
those discussed herein. We undertake no obligation to publicly release the
results of any revisions to these forward-looking statements that may be made to
reflect any future events or circumstances.
OVERVIEW
Composite
Technology Corporation (CTC) has conducted its operations in the following two
business segments: the CTC Cable division and the DeWind division. In
September, 2009 we sold substantially all of the assets and liabilities of the
DeWind segment. Accordingly, all operations of our former DeWind
segment have been reported as discontinued operations in the accompanying
consolidated financial statements and notes thereto.
The year
ended September 30, 2010 represented a period of uncertainty in the world
economies and worldwide financial markets with continued bank failures and other
fallout from the 2008 “Great Recession.” While officially the
recession was declared over and economic growth occurred in some economies,
there was no general recovery observed and worldwide demand for industrial
products remained weak. Last year’s lowered economic forecasts and
expectations in the short term, with expectations of economic recovery after
government incentive measures were implemented, were continued into
2010.
The CTC
Cable business growth showed areas of improvement in several markets, but the
slow economic recovery drove further delays for several anticipated sales, that
had specified ACCC®
conductor, in new international markets and the United States. During 2010, our
business in China continued to suffer from significantly reduced demand for our
products and declined to nearly zero in fiscal 2010. In previous
years, ACCC® products
were installed to provide additional transmission capacity, which was used to
provide power for manufacturing factories in certain Chinese
provinces. The economic downturn reduced the demand for this
manufacturing and resulted in four consecutive quarters of declining
electricity consumption in those provinces. This temporary lower
consumption has eased the urgent need for capacity expansion in certain
areas.
The
financial results for the year ended September 30, 2010 reflected revenue
declines over prior year periods caused by significant order reductions from our
customers in China, which was partially offset by order increases from North
American, South American, and other Asian market customers. Outside of China, we
continued to see slow adoption of our ACCC®
technology. Non-China business improved despite the continuing
worldwide economic downturn which resulted in delays of several anticipated line
projects that had specified ACCC®
conductor in both new international markets and the United States. We
had a decrease of ACCC® products
shipped from 2,800 kilometers for the year ended September 30, 2009 to 957
kilometers for the year ended September 30, 2010. The decrease in
shipments resulted in significant decreases in production levels during the year
ended September 30, 2010 for our manufacturing plant in Irvine,
California. While our fiscal 2010 individual sales at historical
fiscal 2007 through 2009 standard costs were in line with historical margins,
the historically low utilization of our plant resulted in a much less efficient
allocation of our fixed overhead and trained production labor
force. If order levels and production levels increase in the near
term, the Company expects to see gross margins in line with historical
levels.
29
In
January 2010, Composite Technology Corporation repaid $9.0 million to fully
redeem $9.0 million of Senior Convertible Debentures upon their
maturity. Repayment was made out of cash on hand.
In April
2010, Composite Technology Corporation issued a $10.0 million Senior Secured
Loan due in April 2012 and received $9.7 million in cash, net of fees and costs
of $0.3 million. The loan bears interest at 7.5% payable monthly on
balances secured by qualified accounts receivable of the Company and interest at
12.5% payable monthly on balances not secured by qualified accounts
receivable. Qualified accounts receivable consist of 80% of current
trade accounts receivable. The loan has two financial covenants,
measured monthly consisting of i) a liquidity covenant and ii) a profitability
covenant. The liquidity covenant requires the maintenance of a
minimum of $7.5 million of combined cash and accounts receivable balances,
measured at month end. The profitability covenant consists of a
maximum accumulated adjusted operating loss of $5.0 million, measured beginning
April 1, 2010. The adjusted operating loss consists of operating
loss, less depreciation, amortization, and certain other non-cash charges
including stock related compensation and increased or decreased by the
corresponding increase or decrease in deferred revenues as compared to the March
31, 2010 deferred revenue balance. As of September 30, 2010, the
Company was not in compliance with its covenants. Subsequent to year-end, the
Company and lender agreed to amendments for its debt covenants resulting in a
temporary waiver of its covenants to January 2011, refer to detailed discussion
of the amendments at Note 9 to the consolidated financial
statements.
CTC Cable
Division
Located
in Irvine, California with sales operations in Irvine, California, China,
Europe, the Middle East, and Brazil, CTC Cable produces and sells ACCC®
conductor products and related ACCC® hardware
products. ACCC®
conductor production is a two step process. The Irvine operations produce the
high capacity, energy efficient, light weight, patented composite ACCC® core,
which is then shipped to one of eight conductor stranding relationships in the
U.S., Belgium, China, Indonesia, Bahrain, Argentina or Colombia where the core
is stranded with conductive aluminum to become ACCC®
conductor. ACCC®
conductor is sold in North America directly by CTC Cable to utilities and
through a license and distribution agreement with Alcan
Cable. ACCC®
conductor is sold elsewhere in the world directly to utilities as well as
through license and distribution agreements or other agreements with Lamifil in
Belgium, Midal Cable in Bahrain, Far East Composite Cable Co. in China, through
two Indonesian companies, PT KMI Wire and Cable and PT Tranka Kabel, IMSA in
Argentina and Centelsa in Colombia. ACCC®
conductor has been sold commercially since 2005 and is currently marketed
worldwide to electrical utilities, transmission companies and transmission
design/engineering firms.
RECENT
DEVELOPMENTS
The Cable
division’s focus during the year ended September 30, 2010 was sales, marketing,
and operations with a goal to position CTC Cable for rapid revenue growth and
expansion. Our goals included the expansion of our customer base outside of the
Chinese market by penetrating other markets including the United
States. Historically, as recent as fiscal 2008 CTC Cable relied
heavily on one customer in China. During 2008, this one customer
comprised 76% of our $32.7 million in revenues. This same customer
comprised $10.5 million or 54% of fiscal 2009 revenues, and only $0.2 million or
1.7% of fiscal 2010 revenues.
During
the year, CTC Cable experienced turnover in its senior management. In
December 2009, the Company announced the hiring of John P. Brewster as Chief
Commercial Officer of Composite Technology Corporation and President of CTC
Cable Corporation. Mr. Brewster resigned in May 2010 to pursue other
interests, but remains on the CTC strategic advisory board.
In August
2010, we hired Stewart Ramsay as President of CTC Cable. Mr. Ramsay
brings over 25 years of industry experience including direct work experience and
key contacts into senior levels of U.S. and international utilities, several of
which are existing CTC Cable customers. Mr. Ramsay is also an
Electrical Engineer as well as a member of multiple industry advisory boards,
including being a Western Electricity Coordinating Council representative to the
NERC.
We
enhanced the CTC Cable team by adding experienced transmission industry
employees. Between June 2010 and September 2010, we hired additional
industry personnel to assist in our international marketing and sales efforts,
including two experienced management employees in China, one sales
consultant based in the UK to address the European market, and one sales
employee based in the Irvine, California office with responsibility for sales in
the Middle East and Africa. During the year we also engaged
consultants in Latin and South America to address those markets. Behind the
scenes, we also added industry experienced technical sales staff, including
application engineers, and post-sales technical services personnel.
Sales and
Revenue
We define
our sales pipeline in terms of sales opportunities, sales commitments, sales
orders (backlog), and revenues. Our sales efforts over the past year
have increased with our increased sales and marketing efforts and as of November
30, 2010 we have over $1 billion in worked sales opportunities. Such
opportunities consist of separate, unique transmission conductor projects that
have been identified by our sales and marketing team as opportunities specified
to sell ACCC®
conductor, are for projects expected to have the potential to be designed or
installed using ACCC®
conductor within the next 24 months and for which contact points with potential
customers have been established. Sales opportunities are listed
at the estimated value of potential revenues to CTC Cable and tracked over time
to closure. Opportunities that are being worked by CTC employees and
consultants, which are currently expected to have a likelihood of closure within
fiscal 2011, include over 100 separate transmission projects with a total value
of over $400 million. Additional projects are worked in markets
served by engineering consulting companies and stranding
licensees. We expect to close a fraction of the projects listed as
sales opportunities but to date, our market volatility, the volatility of the
economic environment, and our limited history does not allow for a meaningful
analysis of a reasonable estimate of our closure rate for our sales
opportunities.
30
Purchase
commitments consist of contracts with customers or stranding licensees that
represent agreements to purchase ACCC®
conductor or ACCC® core
over periods of time. The commitments which may be binding
(take-or-pay) which would require delivery, or non-binding commitments which do
not require delivery but which may carry other penalties such as those described
below. We currently have no binding purchase commitments from any of
our customers. The current commitments represent non-binding written
agreements to purchase minimum quantities of ACCC® products
in exchange for any or all of the following: i) predetermined prices
which may be pegged and adjustable to a certain raw material cost such as
aluminum, ii) for exclusive rights to sales to certain customers, or iii) for
exclusive rights to sales in certain geographic territories. The
extent of the commitment is that these licensees stand to lose any or all of the
commitment benefits described in i)-iii) above if they fail to meet their
minimum quantity orders. With the exception of the commitments signed
by Jiangsu Far East in 2007 which were fulfilled in 2007 and most of 2008, our
stranding licensees have not achieved their full minimum purchase
commitments. Orders that qualify for “firm backlog” status are
decremented from the binding or non-binding commitment requirement, as
appropriate and are not included in the sales opportunity figure.
We define
“firm backlog” as orders from customers or stranding licensees that are
evidenced by a signed purchase order or equivalent purchase document, or a
signed sales order for stranding licensees under purchase commitment with agreed
prices and delivery schedules. Currently, for fiscal 2011 we have
$5.9 million in firm backlog for delivery through the end of the March 2011
quarter. Our comparable backlog for 2010 was $9.2
million.
Revenues
consist of contracted sales orders where all accounting requirements for revenue
recognition criteria have been met, including shipment and passage of title and
where collectability is reasonably assured. See also Note 1 to the
consolidated financial statements for specific revenue recognition
criteria.
Historically
and for the foreseeable future, our sales contracts and the resultant revenues
recognized on these contracts are dominated by a small number of transactions
which result in recognized revenues that may vary considerably from year to
year, or from quarter to quarter. We continued our push to expand our
customer base in 2010. Excluding our contract with Jiangsu Far East
which had revenues of $24.9 million in 2008 and $10.5 million in 2009, but only
$0.2 million in 2010; during 2010, we had 18 orders shipped and recognized as
revenue with an average value of $0.6 million per contract, during 2009, we had
16 orders shipped with an average value of $0.6 million per contract and during
2008 we had 6 orders shipped with an average value of $1.3 million per contract
if a $6.5 million order to Poland is included, or 5 orders shipped with an
average value of $0.2 million per contract if the Poland order is
excluded. Our sales cycle is typically between 6 and 24 months in
length and past and future contracts are anticipated to include single shipment
sales as well as multi-year contracts with multiple shipments. In
addition, under certain situations, the accounting requirements that need to be
satisfied for revenue recognition may require the deferral of a substantial
portion of product shipped as deferred revenues and timing of our revenue
recognition may be impacted by factors outside of our control, such as customer
delivery schedules, distribution sell-through, shipping delays, stranding
licensee requirements or assuredness of collectability. Because of
the small number of contracts and the factors described above, a contract that
has conservative revenue recognition criteria may result in revenue deferrals
which may have a significant impact on our earnings for any given quarter or
fiscal year.
In
addition to the timing of contracts, the geographic market often determines our
pricing and revenues as well as the type of products sold in each market and the
size of the conductor sold. The products sold are either ACCC®
conductor (conductor) or ACCC® core
(core) as well as ACCC® hardware
(hardware) that is required by both products. Core is sold to
stranding licensees only and carries a lower selling price per kilometer shipped
than conductor. Conductor is sold to end-user utilities or through
construction or engineering and professional services firms and has a higher
selling price than core due to the value of stranded aluminum included in that
product. All other things equal, smaller sized core or conductors have a smaller
selling price than larger sized core or conductor. However, while
core prices are consistent for our stranding licensees, conductor prices for the
same sized conductor may vary considerably from market to market, depending on
the stranding costs within each market and the cost of aluminum available to the
stranding licensee.
Our
pricing is affected by the cost of our key raw materials, including carbon
fiber, our resin materials costs, and aluminum. During 2010, our raw
materials prices decreased while costs of ACSR increased which resulted in an
improvement to our price competitiveness compared to the ACSR products. Our
competitiveness as compared to ACSR prices is further impacted by the worldwide
cost of steel, used in ACSR as the strength component. During 2010,
the cost of steel increased which further improved our competitive position
against ACSR. Should our raw materials prices increase in the future
or the cost of steel decrease in the future, our competitive position could be
reduced, which may erode our prices and either result in reduced revenues or
increased costs, both of which could impact our earnings.
31
Finally,
our customers purchase ACCC® products
and other transmission infrastructure investment products based on their
requirements to add transmission capacity or replace transmission infrastructure
that requires upgrades or replacement due to corrosion. To a large
extent, this demand is caused by the underlying economic conditions that may be
both a general economic condition around the world, such as the 2008 economic
recession, which may be specific to a geographic region, or may be specific to
one or a group of countries who may have government incentives to invest in
transmission grid infrastructure that may offset or improve upon economic
conditions. As yet, we do not have the sufficient level of business
to adequately predict revenues and we do not have adequate staff in our sales
and marketing departments to fully cover all worldwide markets and fully analyze
all worldwide potential.
We
attempt to sell into those markets where we see the largest opportunities and
where we believe that our limited sales and marketing resources can be the most
effective. Our technology is disruptive and the industry in which it
is sold is often highly conservative and resistant to new
technologies. For this reason, we initially focused on early adopters
in the North American, Chinese, and European markets through stranding and
distribution relationships. As relationships matured within those
markets, in 2009 we began to expand into other markets including Indonesia,
South America, and the Middle East.
Despite
slower than expected sales during the year CTC Cable continued to make progress
with technical sales. Our first high voltage test line in Europe was
energized at 400kV in Germany, which will provide critical high voltage
operating data for the German market, much of which is at
400kV. Market penetration continues with sales to new customers
worldwide including a new customer in Qatar, and a repeat order to a customer
sold through our Engineering and Professional Consulting (EPC) channel in
Africa. We are seeing increased success selling our products as a
critical component of an engineered solution and we intend to expand our efforts
to partner with EPC service providers.
|
For the Years Ended September 30,
|
||||||||||||
|
(In Thousands, except kilometer related amounts)
|
2010
|
2009
|
2008
|
|||||||||
|
Europe
|
$
|
145
|
$
|
873
|
$
|
6,896
|
||||||
|
China
|
181
|
10,499
|
24,900
|
|||||||||
|
Middle
East
|
606
|
1,445
|
—
|
|||||||||
|
Other
Asia
|
3,860
|
422
|
—
|
|||||||||
|
North
America
|
4,309
|
5,409
|
851
|
|||||||||
|
South
America
|
1,741
|
26
|
68
|
|||||||||
|
Latin
America
|
—
|
928
|
—
|
|||||||||
|
Total
Revenue
|
$
|
10,842
|
$
|
19,602
|
$
|
32,715
|
||||||
|
Kilometers
shipped
|
957
|
2,800
|
3,700
|
|||||||||
|
ACCC®
Core/Conductor Revenue per kilometer
|
$
|
9,456
|
$
|
5,570
|
$
|
8,110
|
||||||
As can be
seen from the table above, we sell our products worldwide in multiple markets
that vary considerably from year to year and we continue to expand our reach
into markets through stranding license and manufacturing
agreements. Our ACCC®
Core/Conductor revenue per kilometer metric provides an indication of the
revenue potential of our existing production facility, described below, assuming
the revenue mix of products and product sizes. For 2010, the revenue
per kilometer increased from 2009 due to a change in the mix from ACCC® core
sold to the sale of more ACCC®
conductor.
Prior to
2010, our international markets were served by limited personnel in South
America, China, and Europe. In 2010, we added international sales
staff in our Other Asia and Middle East markets. The sales gains in
new markets include revenues to Indonesia, the Middle East and South America
resulting from an increased sales presence and improving customer adoption in
those territories along with promising expansion into North America through
increased customer adoption. Of key importance to our expansion
strategy is to establish stranding licensee manufacturing that is located within
each marketplace. As of November 30, 2010 we had nine stranding
licensees and several more licensees in negotiation. Our focus in
fiscal 2011 will be to continue to develop new stranding relationships to
penetrate new markets including South America, India, Russia, Latin America the
Middle East, Africa, and Europe, re-establishing the China market, leveraging
the new regulations expected to impact the North American markets, and expanding
sales through each of our existing stranding licensees. Each of our
markets has conductor projects that can range from as small as $50,000 to tens
of millions of dollars of conductor with multiple-year delivery
schedules. To date, our single largest contract award was $6.5
million sold to a customer in Poland in fiscal 2008. The award of one
or more large contracts will have a significant impact to our revenues and
earnings through increased revenues, improved production efficiencies, and
increased operating expenses. Each market listed above is described
briefly below along with any specific factors that may result in increases or
decreases in revenues or earnings. As of November, 2010 except for
the contracts and customer orders included in our backlog listed above, we have
no contracts that have binding commitments for deliveries of ACCC®. We are
working with our stranding licensees and customers to obtain purchase
commitments, the execution of which may result in improved revenue visibility
later in fiscal 2011.
Europe: Lamifil
serves the Europe market for core sales and direct conductor sales are made to
utilities. Fiscal 2008 revenues included one large conductor sale
into Poland while 2009 and 2010 were a mixture of smaller core and conductor
sales. In late 2010, we hired a dedicated sales consultant, located
in the UK, to assist us in further sales. In November 2010 we
received an order for $0.4 million into Europe. We believe our improved market
presence and the receipt of initial orders will result in revenue improvements
in Europe over fiscal 2010 but revenues may not reach 2008 levels unless
additional large orders are received.
32
China: The
China market decline from 2008 to 2009 and 2010 was due to a significant
decrease in orders from a single customer, our stranding licensee Jiangsu New
Far East. We believe this decline was due to the worldwide economic
downturn. We are actively working to re-engage the China
market. In 2010 we established a new subsidiary, CTC Cable Asia and
opened an office in Beijing to serve this market. We hired two sales
and marketing personnel into this market to assist us with our existing customer
and to develop relationships with other stranding manufacturers in
China.
Middle
East and Africa: The Middle East market is served by one stranding
relationship with Midal in Bahrain. In late 2010 we also hired
additional sales personnel that are dedicated to developing business
relationships in the Middle East and Africa geographies. We expect to
see improved market activity in the Middle East and Africa due to an improved
market presence.
Other
Asia: Other Asia includes Russia and the former SSRs, Indonesia,
India, Japan, Korea, Thailand, Laos, and Vietnam. As each of these
markets develop, in the future we expect to analyze each
separately. In 2009 and 2010 our revenues were derived from our two
stranding licensees in Indonesia, PT KMI Wire and Cable and PT Tranka
Kabel. In 2010 we assigned personnel to focus on Indonesia and to
open up the India, Korean, Japanese and other Asian markets. In
November 2010, we signed a stranding agreement with Sterlite Technologies that
calls for a non-binding commitment to purchase ACCC®
products, some of which is expected, but not guaranteed, in fiscal
2011.
North
America: North America consists of the U.S. and Canada and is served
by our stranding licensee Alcan Cable. In February 2010, CTC Cable signed
distribution and manufacturing agreements with Alcan Cable. The
distribution agreement calls for Alcan to distribute ACCC®
conductor to certain of their customers. In order to maintain
exclusive distribution rights with certain Alcan customers in the U.S. and
Canada, Alcan has agreed to purchase minimum quantities of ACCC®
conductor during calendar year 2010 and potentially through 2012. The term
of the contract is one year, which may be extended for an additional two years
if Alcan sells a minimum quantity of ACCC®
conductor within the first year and achieves stranding qualifications. CTC Cable
expects that the Alcan Cable distribution agreement will provide revenue orders
beginning later in calendar 2010. The agreements call for Alcan to
receive a license to strand ACCC®
conductor for delivery in North America after certification requirements are
met, which was achieved during 2010. CTC Cable’s marketing team has been working
with Alcan’s marketing team to develop an effective marketing
strategy. To date, CTC Cable has not received any ACCC® orders
from Alcan, but expects Alcan to purchase their contract minimums. Alcan has
non-binding order commitments of approximately $2 million that are expected, but
not required, in fiscal 2011.
South
America: Includes all countries in South America. We
currently have two stranding relationships in South America, IMSA in Argentina
and Centelsa in Columbia, neither of which have contractual
minimums. To date, we have sold conductor into Brazil, Argentina and
Chile and we are actively working opportunities in all of the South American
countries. South America is serviced by sales agents and consultants
located locally as well as personnel from our Irvine, California
offices.
Latin
America: Latin America consists of Mexico and Central America and is
not currently served by a localized stranding licensee. We are
currently in negotiation with several parties to provide stranding services in
Latin America. To date, our revenues in Latin America have consisted
of sales into Mexico in fiscal 2009. We currently have sales efforts
underway in Mexico, Costa Rica, Nicaragua, and Panama. Sales coverage
is served by sales agents and consultants located in South America and our
Irvine, CA offices.
Moving
forward to 2011, we believe that new U.S. regulations will drive further
adoption of ACCC®
products. The new regulations are discussed in further detail in Item 1
above.
Production
During
2010, at our single plant in Irvine, California we had eighteen pultrusion
machines available for operation with each of the production machines able to
produce as much as to 1,000 km per machine per year for a projected annual
capacity in excess of 17,000 km per year. At 2010 average selling prices, our
existing plant could have produced approximately $160 million worth of ACCC® products
at full capacity. The projected range of product value is
approximately $70 million to $430 million for small sized ACCC® core to
large sized ACCC®
conductor. We have developed contingency plans to add facilities with
additional production machines should either the demand for production increase
or if we believe that it is in the best interests of the Company to install a
core plant in another geographical location. We expect that at
production levels in excess of 3,000 km per quarter, or approximately $15
million per quarter of ACCC® core
revenue, that we will need to add additional production
facilities. Our production facility is considered “light industrial”
and it would be straight-forward to replicate our plant in other
locations. Our production machines are made from readily available
parts and from multiple suppliers. We believe that additional
facilities could be operational within 6 months from the date we determine that
additional production is required.
We
believe that we will be able to procure sufficient raw materials supplies for
our ACCC® core to
produce our expected ACCC® product
sales worldwide for the next twelve months. We have good relations
with our key suppliers and believe that these suppliers will be able to respond
to increased demand for our key raw materials if that occurs. However, in
the event of significant demand for our products in excess of current levels, we
may have a lag between our requirements for these materials and the availability
of these materials from suppliers. Any such delays could delay
shipments and reduce our revenue potential. We continue to work on
production and product development initiatives to reduce this
risk.
33
Our
product requires stranding our ACCC® core
with aluminum to create ACCC®
conductor. We currently have nine stranders worldwide, having added
stranding relationships in the United States, South America, and
India during 2010. We will continue to work to expand our
ACCC®
conductor production capacity through stranding and manufacturing agreements
with targeted manufacturers worldwide. As we open new markets and we begin to
sell ACCC®
conductor locally, we will look to sign additional agreements with local
stranding sources. Discussions with new stranding partners are
underway at multiple locations worldwide.
We
believe that our ACCC® product
margins have upside potential in 2011 as compared to 2010 through improvements
in plant efficiency. During 2010, we saw a decrease in the cost of
our raw materials, including the aerospace grade carbon we use in our ACCC®
conductor core. We do not see further raw materials price decreases
in 2011. Operational inefficiencies continued in 2010 and included
higher than expected per unit labor and overhead charges. Our labor
and overhead costs carry a large fixed component so lower utilization requires a
higher cost per unit of production. We expect to see per unit cost
savings as our plant utilization improves with additional expected
sales.
During
the year CTC Cable supplemented its technical skill set through several key
technical hires. In June 2010, CTC Cable hired a new VP of Product
Development, a PhD who has significant experience in advanced composite
materials design and development. We expect this individual to be a
key manager of, and contributor to, our technical team and he is undergoing a
thorough review of our products and testing protocols as well as directing new
product development. In October 2010, CTC Cable hired an additional PhD who has
significant experience in composite materials. The Company has
several improvements to ACCC®
conductors in the product pipeline which it expects to introduce in fiscal 2011.
Also in 2010, CTC Cable hired several key leaders and contributors in our
utility transmission design and pre-sales groups and our post-sales installation
group.
DeWind Asset
Sale
The
divestiture of DeWind was a decision driven by the worldwide banking and credit
crisis. The Company determined in fiscal 2009 that it could no longer
support the operations of the DeWind segment and began the process of selling
the division in December 2008.
In
August, 2009 the Company completed negotiations with Daewoo Shipbuilding and
Marine Engineering (DSME), and signed an Asset Purchase Agreement valued at
$49.5 million in cash. The transaction closed on September 4, 2009
and the Company received approximately $32.3 million in cash paid immediately
with $17.2 million in cash escrowed for the benefit of DSME to provide for
potential reimbursements of net asset value adjustments, breaches of
representations and warranties, and intellectual property
claims. Escrow claims presented by DSME are subject to an evaluation
process, which requires that DSME submit a written claim against the escrowed
funds thereby triggering processes for review and dispute by the
Company. Escrowed funds are only released by the escrow agent to the
Company or DSME under either i) mutual written instruction by DSME and the
Company or ii) scheduled escrowed cash releases to the Company at certain points
in time, outlined below, and so long as DSME has not submitted an escrow claim
in excess of the scheduled release amount. All successful
escrow claims by DSME would require DSME to either prove damages or show asset
values less than those represented at the transaction close. Of this cash, $5.5
million was earmarked to satisfy the supply chain and asset valuation claims of
which $836,000 has been released to date; $7.0 million is scheduled to be
released two years after the close of the transaction in September, 2011 and the
remainder to be released three years after the close of the transaction, in
September 2012. Other than disputed net asset value adjustments and vendor
penalties claimed by DSME and under discussion, no other claims have been filed
to date.
In
December, 2009 DSME filed its initial claims filing which listed a shortfall of
$11.65 million from the represented net asset value. The Company
counterclaimed with an analysis that showed the net asset value as $6.8 million
higher than represented and requested an additional cash payment from DSME for
that amount. The discrepancy between the two lists consisted of
supply chain vendor claims, vendor penalties, and differences in accounting
estimates on the valuation of assets. During fiscal 2010, the Company
and DSME representatives met multiple times, beginning in January 2010 and
continuing through April 2010 to resolve the net asset and supply chain claims
differences. At the last meeting, the two parties identified the
remaining key supplier matters that required resolution before settlement of the
initial claims settlement could be achieved. In July 2010, $836,000
was released from escrow and paid to a vendor to satisfy one of these supplier
claims. To date, none of the other differences remaining between DSME
and the Company have been formally agreed upon by either
party. Either the Company or DSME has the option to require an
external audit to be conducted if an agreement on the disputed matters cannot be
achieved. To date, neither party has elected to exercise this option and both
prefer to work out the discrepancies through cooperation and
negotiation. The Company and DSME continued to have negotiation
meetings into December, 2010 to resolve any remaining valuation and supply chain
related discrepancies. In July 2010, the Company received $836,000 of
the escrowed cash leaving $16.4 million remaining in
escrow. Accordingly, we have reported the remaining $16.4 million
held in escrow as restricted cash. Consistent with expected escrow
agreement release dates, at September 30, 2010, we have classified $11.7 million
as current and $4.7 million as long-term (see Note 1 to the consolidated
financial statements “Restricted Cash”).
The
divestiture of DeWind provided a significant amount of cash to the Company’s
balance sheet, and reduced cash spending for DeWind operating expenses and
working capital requirements. As part of the transaction, the Company is
prohibited from developing, marketing, or selling competing wind turbine
technology for five years except that the Company retained the rights to develop
and sell wind farm projects.
The
remaining assets and liabilities of the discontinued operations consist of the
following:
34
|
(In Thousands)
|
September 30, 2010
|
|||
|
ASSETS
|
||||
|
Accounts
Receivable, net
|
2,199 | |||
|
Prepaid
Expenses and Other Current Assets
|
21 | |||
|
TOTAL
ASSETS
|
$ | 2,220 | ||
|
LIABILITIES
|
||||
|
Accounts
Payable and Other Accrued Liabilities
|
$ | 35,358 | ||
|
Deferred
Revenues and Customer Advances
|
2,248 | |||
|
Warranty
Provision
|
901 | |||
|
Total
Liabilities
|
38,507 | |||
|
Net
Liabilities of Discontinued Operations
|
$ | (36,287 | ) | |
Significantly
all of the assets and liabilities of the discontinued operations pertain to
activities outside of the United States. The remaining operations of DeWind,
subsequently renamed Stribog, consist of receipt of license fees from Chinese
licensees of older DeWind technology and satisfaction of the remaining contracts
that were not assumed by DSME, primarily the servicing of warranties related to
wind turbines installed in Europe from 2006 through 2009, most of which are now
expired, and one contract for 10 turbines sold to South America that as yet have
not been installed. At September 30, 2010, included above in Accounts
Payable and Other Accrued Liabilities are net payables related to formerly
consolidated, now insolvent European subsidiaries of approximately $20 million,
substantially all of which has been assigned by the insolvency receiver to FKI,
a former owner of DeWind, currently engaged in legal activities with the Company
(see Note 14 to the consolidated financial statements). At September 30, 2010,
the net payables from insolvent subsidiaries is comprised of assets in the
amount of $7 million and liabilities in the amount of $27 million. We did not
receive any update from the insolvency receiver related to the assets and
liabilities for the insolvent subsidiaries during the year ended September 30,
2010. At September 30, 2010, also included in Accounts Payable and Other
Accrued Liabilities is a $3.4 million provision to cover contingent liabilities
estimated in connection with the DSME transaction, some of which are related to
escrow claims made by DSME and subject to dispute and
negotiation. Accordingly, where probable and reasonably estimable,
these accruals were included in the Loss on Sale of DeWind. We continue to
maintain this accrual due to the ongoing uncertainties discussed
above.
RESULTS
OF OPERATIONS
The
following table presents a comparative analysis of Revenue, Cost of Revenues,
and Gross Margins for continuing operations, our CTC Cable
division:
|
For the Years Ended September 30,
|
||||||||||||
|
(In Thousands)
|
2010
|
2009
|
2008
|
|||||||||
|
Product
Revenue
|
$
|
10,842
|
$
|
19,602
|
$
|
32,715
|
||||||
|
Cost
of Revenue
|
$
|
8,842
|
$
|
14,285
|
$
|
21,129
|
||||||
|
Gross
Margin
|
$
|
2,000
|
$
|
5,317
|
$
|
11,586
|
||||||
|
Gross
Margin %
|
18.4
|
%
|
27.1
|
%
|
35.4
|
%
|
||||||
PRODUCT
REVENUE: Product revenues decreased $8.8 million, or 45%, from $19.6
million in 2009 to $10.8 million in 2010, and decreased $13.1 million, or 40%,
from $32.7 million in 2008 to $19.6 million in 2009.
The
fiscal 2010 decrease was primarily related to a significant decline in shipments
of 2,003 km of ACCC® products
to China, offset by increases in shipments of 264 km of ACCC® products
primarily within North America, South America and Indonesia. The
fiscal 2009 decrease was primarily related to a significant decline in shipments
of 664 km of ACCC® products
to China and Poland. For additional information, see discussion regarding our
revenues and the table in RECENT DEVELOPMENTS – “Sales and Revenue”
above.
COST OF
REVENUE: Cost of revenue represent materials, labor, freight, product cost
depreciation and allocated overhead costs to produce ACCC®
conductor, ACCC® core,
and related hardware. Cost of revenue decreased $5.5 million, or 38%,
from $14.3 million in 2009 to $8.8 million in 2010, and decreased $6.8 million,
or 32%, from $21.1 million in 2008 to $14.3 million in 2009.
35
Cost of
revenue and resultant gross margin: The fiscal 2010 gross margin decreased
due to lower revenue levels and a reduction in the gross margin percentage on
products sold. The fiscal 2010 gross margin percentage decreased from 2009
primarily due to production inefficiencies as a result of significant idle
production capacity, and higher inventory reserves and obsolescence charges
recorded in fiscal 2010 as compared to fiscal 2009. The fiscal 2009 gross
margin percentage decreased from 2008 primarily due to strategic discounts given
to Jiangsu New Far East Cable Company in China.
The
following table presents a comparative analysis of operating expenses for
continuing operations:
|
For the Year Ended September 30, 2010
|
||||||||||||
|
(In Thousands)
|
Corporate
|
Cable
|
Total
|
|||||||||
|
Officer
Compensation
|
$
|
2,200
|
$
|
249
|
$
|
2,449
|
||||||
|
General
and Administrative
|
6,554
|
5,626
|
12,180
|
|||||||||
|
Research
and Development
|
—
|
2,226
|
2,226
|
|||||||||
|
Sales
and Marketing
|
—
|
5,022
|
5,022
|
|||||||||
|
Depreciation
and Amortization
|
4
|
379
|
383
|
|||||||||
|
Total
Operating Expenses
|
$
|
8,758
|
$
|
13,502
|
$
|
22,260
|
||||||
|
For the Year Ended September 30, 2009
|
||||||||||||
|
(In Thousands)
|
Corporate
|
Cable
|
Total
|
|||||||||
|
Officer
Compensation
|
$
|
3,225
|
$
|
—
|
$
|
3,225
|
||||||
|
General
and Administrative
|
5,815
|
4,098
|
9,913
|
|||||||||
|
Research
and Development
|
—
|
2,703
|
2,703
|
|||||||||
|
Sales
and Marketing
|
—
|
5,598
|
5,598
|
|||||||||
|
Depreciation
and Amortization
|
—
|
368
|
368
|
|||||||||
|
Total
Operating Expenses
|
$
|
9,040
|
$
|
12,767
|
$
|
21,807
|
||||||
|
For the Year Ended September 30, 2008
|
||||||||||||
|
(In Thousands)
|
Corporate
|
Cable
|
Total
|
|||||||||
|
Officer
Compensation
|
$
|
2,129
|
$
|
—
|
$
|
2,129
|
||||||
|
General
and Administrative
|
5,289
|
1,852
|
7,141
|
|||||||||
|
Research
and Development
|
—
|
4,519
|
4,519
|
|||||||||
|
Sales
and Marketing
|
—
|
3,485
|
3,485
|
|||||||||
|
Depreciation
and Amortization
|
—
|
339
|
339
|
|||||||||
|
Total
Operating Expenses
|
$
|
7,418
|
$
|
10,195
|
$
|
17,613
|
||||||
OFFICER
COMPENSATION: Officer Compensation represents CTC corporate and Cable expenses
and consists primarily of salaries, consulting fees paid in cash, and the fair
value of stock grants issued to officers of the Company. Officer Compensation
decreased $0.8 million, or 24%, to $2.4 million in fiscal 2010 from $3.2 million
in fiscal 2009, and increased $1.1 million, or 51%, to $3.2 million in fiscal
2009 from $2.1 million in fiscal 2008. The decrease from 2009 to 2010 was
due to lower share-based compensation expense, derived from lower fair values
related to stock options granted during fiscal 2010 and the natural reduction in
vesting base of stock options outstanding, offset by an increase in officer
salaries. The increase from 2008 to 2009 was due to higher fair value
share-based compensation expense for vested stock options.
GENERAL
AND ADMINISTRATIVE: General and Administrative expense consists primarily of
salaries and employee benefits for administrative personnel, professional fees,
facilities costs, insurance, travel, share-based compensation charges and any
expenses related to reserves for uncollectible receivables. General and
Administrative expense increased $2.3 million, or 23%, from $9.9 million in 2009
to $12.2 million in 2010, and increased $2.8 million, or 39%, from $7.1 million
in 2008 to $9.9 million in 2009.
The
increase of $2.3 million in 2010 was due to a $0.7 million increase from
corporate and $1.5 million increase from Cable. The corporate
related General and Administrative expense increase is derived primarily from
increases in professional service fees, start-up costs related to the
organization of a new entity, and payroll taxes accrued in connection with an
IRS payroll tax audit as discussed in Note 1 (“Income Taxes”) to the
consolidated financial statements. The Cable related General and
Administrative expense increase is derived primarily from headcount and
headcount related costs and facilities costs due to significant idle capacity
and costs incurred for patent related litigation. General and
Administrative share-based compensation remained relatively consistent with the
prior year.
The
increase of $2.8 million in 2009 was due to a $0.5 million increase from
corporate and $2.3 million increase from Cable. The corporate
related General and Administrative increase is derived from increased headcount
costs, insurance, board of director fees, recruiting costs and higher
share-based compensation charges, offset by a reduction in professional service
fees. The $2.3 million increase in Cable related General and
Administrative expense is primarily related to $1.5 million in legal fees, $0.4
million in headcount costs and $0.4 million in facilities costs, partially
offset by a reduction in insurance expense.
36
RESEARCH
AND DEVELOPMENT: Research and Development expenses consist primarily
of salaries, consulting fees, materials, tools, and related expenses for work
performed in designing and development of manufacturing processes for the
Company's products. Research and Development expenses decreased $0.5 million, or
18%, from $2.7 million in 2009 to $2.2 million in 2010, and decreased $1.8
million, or 40%, from $4.5 million in 2008 to $2.7 million in 2009.
The
decrease of $0.5 million in 2010 was due to significantly lower fair value
share-based compensation expense for vested stock options, partially offset by
higher headcount costs, professional service fees and research and development
product testing and validation costs.
The
decrease of $1.8 million in 2009 was primarily related to a shift of employees
who formerly functioned in a research capacity but who now are classified as
sales support personnel, partially offset by increased share-based compensation
charges.
SALES AND
MARKETING: Sales and Marketing expenses consist primarily of salaries,
consulting fees, materials, travel, and other expenses performed in marketing,
sales, and business development efforts for the Company. Sales and Marketing
expenses decreased $0.6 million, or 10%, from $5.6 million in 2009 to $5.0
million in 2010, and increased $2.1 million, or 60%, from $3.5 million in 2008
to $5.6 million in 2009.
The
decrease of $0.6 million in 2010 was primarily due to significantly lower fair
value share-based compensation expense for vested stock options and a reduction
in sales commissions due to lower revenue levels, partially offset by increased
headcount and headcount related costs and professional service
fees.
The
increase of $2.1 million in 2009 was primarily related to a $1.1 million
increase comprised of additional headcount and customer support costs, a $0.7
million increase in advertising related expenses and a $0.3 million increase in
share-based compensation charges, partially offset by decreases in commission
and professional fee expenses.
DEPRECIATION
AND AMORTIZATION: Depreciation and Amortization expense consists of depreciation
related to the depreciation and amortization of the Company's capitalized assets
used in operations, excluding product cost depreciation (refer to cost of
revenue discussion above). Depreciation expense increased $15,000, or 4%,
from $368,000 in 2009 to $383,000 in 2010, and increased $29,000, or 9%, from
$339,000 in 2008 to $368,000 in 2009. The annual increases were due to minor
increases in the fixed asset base.
INTEREST
EXPENSE: Interest expense consists of the cash interest payable on the Company’s
debt obligations and the amortization of the any related debt
discount.
The
decrease of $0.8 million in 2010, or 27%, was primarily due to a lower average
debt balance in fiscal 2010 compared to 2009. Prior year debt was
paid-off in January 2010. In April 2010, the Company entered into a
senior secured loan arrangement (refer to Note 9 to the consolidated financial
statements).
The
decrease of $0.9 million in 2009, or 23%, from 2008 was primarily due to reduced
accelerated amortization of the discount which occurred in 2008 from debt
conversions. There were no conversions in
2009.
INTEREST
INCOME: The interest income changes from period to period are due to
changes in the underlying cash and cash equivalent balances. Interest
income increased by $3,000 in 2010 compared to 2009. The additional
interest income was primarily due to the DeWind sale proceeds from September
2009.
OTHER
INCOME / (EXPENSE): Fiscal year 2010 Other Expense primarily consists
of foreign exchange losses and penalties associated with the findings from the
examination by the Internal Revenue Service (IRS) for prior fiscals years ended
September 30, 2001 through 2005 (refer to “Income Taxes” in Note 1 to the
consolidated financial statements). Other Expense increased $195,000
in 2010 compared to 2009 due to foreign exchange losses and the IRS penalties
mentioned above. Other Expense was $1,000 in 2009 compared to Other
Income of $74,000 in 2008.
EXPENSE
RELATED TO MODIFICATION OF WARRANTS DUE TO ANTI-DILUTIVE EVENTS: No
material expenses were recognized from the modification of warrants due to
anti-dilutive events in 2010 (refer to “Warrants” in Note 10 to the consolidated
financial statements). Expenses related to the modification of
warrants due to anti-dilutive events decreased to $7,000 in 2009 from $553,000
in 2008.
The 2009
expense resulted from the events related to the anti-dilution caused by the
issuance of additional warrants in connection with a short-term senior secured
bridge note issued in June 2009 (this obligation was repaid in full in September
2009). The 2008 expense resulted from the events related to the anti-dilution
caused by the issuance of shares related to an equity offering in June 2008. The
expense represented the combination of the fair value of the issuance of any new
warrants and the difference in the fair value of the respective warrants
immediately before and immediately after price resets in warrant exercise
prices.
37
CHANGE IN
FAIR VALUE OF DERIVATIVE LIABILITIES: Refer to discussion at Note 1 (“Derivative
Liabilities”) to the consolidated financial statements.
INCOME
TAXES: We made provisions for income taxes of $14,000, $5,000, and
$3,000 for the years ending September 30, 2010, 2009 and 2008,
respectively. We have determined that due to our continuing operating losses as
well as the uncertainty of the timing of profitability in future periods, we
should fully reserve our deferred tax assets. As of September 30, 2010, our
deferred tax assets continued to be fully reserved. We will continue to
evaluate, on a quarterly basis, the positive and negative evidence affecting our
ability to realize our deferred tax assets. Refer to additional
income tax disclosures at Note 12 to the consolidated financial
statements.
EFFECTS
OF INFLATION: We are subject to inflation and other price risks arising from
price fluctuations in the market prices of the various raw materials that we use
to produce our products. Price risks are managed through cost-containment
measures. Except as noted below, we do not believe that inflation risk or other
price risks with respect to raw materials used to produce our products are
material to our business, financial position, results of operations or cash
flows. Due to a decrease in demand for composite quality carbon materials
worldwide in particular in the aerospace and defense industries and despite a
restricted supply of high quality carbon due to a limited number of suppliers,
the Company experienced a price decline in unit costs of such
carbon. However, the Company may be exposed to raw material price
increases or carbon material shortfalls should demand increase with the
worldwide economic recovery and if additional suppliers or supplies do not
become available. We cannot quantify any such price or material impacts at this
time.
EFFECTS
OF EXCHANGE RATE CHANGES: We are subject to price risks arising from exchange
rate fluctuations in the functional currency of our European subsidiaries,
primarily the Euro and the UK Sterling, and the Chinese Yuan. We currently
do not hedge the exchange rate risk related to our assets and liabilities and do
not hedge the exchange rate risk related to expected future operating
expenses.
RECONCILIATION
OF NON-GAAP MEASURES
The
following tables present a reconciliation of consolidated non-GAAP EBITDAS
or Earnings before Interest, Taxes, Depreciation & Amortization and
Share-Based Compensation charges for continuing operations for the years ended
September 30, 2010, 2009 and 2008:
The
Company has provided non-GAAP measures such as EBITDAS in the following
management discussion and analysis. The Company uses the non-GAAP information
internally as one of several measures used to evaluate its operating performance
and believes these non-GAAP measures are useful to, and have been requested by,
investors as they provide additional insight into the underlying operating
results viewed in conjunction with US GAAP operating results. For the
non-GAAP EBITDAS measure, a significant portion of non-cash expenses are
excluded, primarily for interest, depreciation and for share-based compensation
charges that are valued based on the share price and volatility at the date of
grant and then expensed as earned, typically upon vesting of service over
time. The material limitation of non-GAAP EBITDAS compared with Net
Income/Loss is that significant non-cash expenses are
excluded. Management compensates for such limitation by utilizing
EBITDAS only for particular purposes and evaluates EBITDAS in the context of
other metrics such as Net Income/Loss when evaluating the Company’s performance
and financial condition and for establishing compensation metrics for employees
and management. Non-GAAP measures are not stated in accordance with, should not
be considered in isolation from, and are not a substitute for, US GAAP measures.
A reconciliation of US GAAP to non-GAAP results has been provided in the
financial tables below. We will also include the change in fair value
of derivative liabilities, asset impairments and warrant modification
expense in EBITDAS and our reconciliation as applicable.
|
For the Year Ended September 30, 2010
|
||||||||||||
|
(In Thousands)
|
Corporate
|
Cable
|
Total
|
|||||||||
|
EBITDAS:
|
||||||||||||
|
Net
loss from continuing operations
|
$
|
(9,313
|
)
|
$
|
(11,510
|
)
|
$
|
(20,823
|
)
|
|||
|
Depreciation
& Amortization
|
4
|
694
|
698
|
|||||||||
|
Share-based
compensation
|
2,030
|
649
|
2,679
|
|||||||||
|
Change
in fair value of derivative liabilities
|
(1,767
|
)
|
—
|
(1,767
|
)
|
|||||||
|
Interest
(income) expense, net
|
2,123
|
(3
|
)
|
2,120
|
||||||||
|
Income
tax expense
|
14
|
—
|
14
|
|||||||||
|
EBITDAS
Loss
|
$
|
(6,909
|
)
|
$
|
(10,170
|
)
|
$
|
(17,079
|
)
|
|||
38
|
For the Year Ended September 30, 2009
|
||||||||||||
|
(In Thousands)
|
Corporate
|
Cable
|
Total
|
|||||||||
|
EBITDAS:
|
||||||||||||
|
Net
loss from continuing operations
|
$
|
(11,983
|
)
|
$
|
(7,455
|
)
|
$
|
(19,438
|
)
|
|||
|
Depreciation
& Amortization
|
—
|
1,011
|
1,011
|
|||||||||
|
Share-based
compensation
|
3,108
|
1,599
|
4,707
|
|||||||||
|
Warrant
modification expense
|
7
|
—
|
7
|
|||||||||
|
Interest
expense, net
|
2,929
|
6
|
2,935
|
|||||||||
|
Income
tax expense
|
5
|
—
|
5
|
|||||||||
|
EBITDAS
Loss
|
$
|
(5,934
|
)
|
$
|
(4,839
|
)
|
$
|
(10,773
|
)
|
|||
|
For the Year Ended September 30, 2008
|
||||||||||||
|
(In Thousands)
|
Corporate
|
Cable
|
Total
|
|||||||||
|
EBITDAS:
|
||||||||||||
|
Net
income (loss) from continuing operations
|
$
|
(11,547
|
)
|
$
|
1,464
|
$
|
(10,083
|
)
|
||||
|
Depreciation
& Amortization
|
—
|
776
|
776
|
|||||||||
|
Share-based
compensation
|
1,683
|
972
|
2,655
|
|||||||||
|
Warrant
modification expense
|
553
|
—
|
553
|
|||||||||
|
Interest
expense, net
|
3,573
|
1
|
3,574
|
|||||||||
|
Income
tax expense
|
3
|
—
|
3
|
|||||||||
|
EBITDAS
Income (Loss)
|
$
|
(5,735
|
)
|
$
|
3,213
|
$
|
(2,522
|
)
|
||||
Consolidated
EBITDAS Loss for fiscal 2010 for continuing operations increased by
$6.3 million as compared to 2009 due to a $1.0 million increase from corporate
and $5.3 million increase from our CTC Cable operations. The total
increases were primarily due to reduced gross margins and increased operating
expenses including additional payroll tax expense in connection with an IRS
audit (refer to “Income Taxes” in Note 1 to the consolidated financial
statements), increases in professional service fees and headcount, and increased
facilities costs due to significant idle capacity.
Consolidated
EBITDAS Loss for fiscal 2009 for continuing operations increased by $8.3 million
as compared to fiscal 2008 from our CTC Cable operations primarily due to the
lower revenues from China, along with corresponding margin reductions, and
increases in General and Administrative and Sales and Marketing
expenses.
NET
LOSS
The
following table presents the components of our total net loss:
|
For the Years Ended September 30,
|
||||||||||||
|
(In Thousands)
|
2010
|
2009
|
2008
|
|||||||||
|
Net
Loss from Continuing Operations
|
$
|
(20,823
|
)
|
$
|
(19,438
|
)
|
$
|
(10,083
|
)
|
|||
|
Income
(Loss) from Discontinued Operations (Note 2)
|
1,056
|
(54,313
|
)
|
(43,430
|
)
|
|||||||
|
|
|
|
||||||||||
|
Net
Loss
|
$
|
(19,767
|
)
|
$
|
(73,751
|
)
|
$
|
(53,513
|
)
|
|||
Net loss
decreased by $54.0 million to $19.8 million in fiscal 2010 from $73.8 million in
fiscal 2009. The decrease in net loss was substantially due to the
activity level of our discontinued operations in fiscal 2010 compared to fiscal
2009. The $54.0 million net loss decrease in fiscal 2010 was due
to:
|
|
·
|
A decrease in Gross Margin from
continuing operations of $3.3 million from 2009 to
2010.
|
|
|
·
|
An increase in Total Operating
Expense from continuing operations of $0.5 million from 2009 to
2010.
|
|
|
·
|
A decrease in Total Other Income
/ (Expense) (including income taxes) from continuing operations of $2.4
million from 2009 to 2010.
|
|
|
·
|
A decrease in Loss from
Discontinued Operations of $55.4 million from 2009 to income in
2010.
|
Gross
Margin: As discussed above, the gross margin decrease of $3.3 million was
primarily due to production inefficiencies as a result of significant idle
production capacity, and inventory reserves recorded in 2010 compared to
2009.
39
Total
Operating Expense: As detailed above, the total increase in operating expense of
$0.5 million was primarily driven by a significant increase in General and
Administrative expense, offset by decreases in Research and Development expense,
Sales and Marketing expense and Officer Compensation in 2010 compared to
2009.
Total
Other Income / (Expense): As discussed above, the total net other expense
decrease is primarily due to the $1.8 million in the Change in Fair Value of
Derivatives Liabilities in 2010 compared to zero in 2009.
Income
(Loss) from Discontinued Operations: As discussed above and detailed in Note 2
to the consolidated financial statements, the decrease in the Loss from
Discontinued Operations of $55.4 million is derived from the September 2009
DeWind asset sale and related discontinuation of the DeWind business
segment.
LIQUIDITY
AND CAPITAL RESOURCES
Comparison
of years ended September 30, 2010, 2009 and 2008.
Our
principal sources of working capital have been private debt issuances and equity
financings.
Year
Ended September 30, 2010
For the
year ended September 30, 2010, we had a net loss from continuing operations of
$20.8 million. At September 30, 2010 we had $3.0 million of cash and
cash equivalents, which represented a net decrease of $21.0 million from
September 30, 2009. The decrease was due to cash used in operations of $22.0
million, cash provided by investing activities of $0.4 million and cash provided
by financing activities of $0.6 million.
Cash used
in operations during the year ended September 30, 2010 of $22.0 million was
primarily the result of a net loss of $19.8 million and income from discontinued
operations of $1.1 million, offset by net non-cash reconciling items of $4.5
million (primarily comprised of depreciation and amortization of $1.9 million,
common stock related charges of $3.0 million and inventory charges of $1.4
million, offset by a gain from the change in fair value of derivative
liabilities of $1.8 million and foreign currency exchange of $0.1 million).
Additionally, cash used in operations was impacted by a negative change in net
assets/liabilities from discontinued operations of $4.6 million and net cash
used for working capital of $1.0 million (primarily comprised
of negative changes in accounts payable of $1.1 million, accounts
receivable of $0.8 million and inventory of $0.6 million, offset by positive
changes in other assets of $0.3 million and deferred revenue of $1.3
million).
Cash
provided by investing activities during the year ended September 30, 2010 of
$0.4 million was related to the partial release of restricted cash of $0.8
million, offset by cash used from the purchase of computer hardware/software and
equipment put in service in anticipation of increased cable manufacturing
activities.
Cash
provided by financing activities during the year ended September 30, 2010 of
$0.6 million was related to the net proceeds received from the April 2010 senior
secured loan arrangement of $9.7 million and the exercise of stock options in
the amount of $7,000, offset by the January 2010 repayment notes payable of $9.0
million.
Our cash
position as of September 30, 2010 was $3.0 million. On January 31,
2010, we repaid all outstanding convertible notes payable in the principal
amount of $9.0 million. In April 2010, we raised $10.0 million in
senior secured debt, net of $0.3 million in fees (refer to Note 9 to the
consolidated financial statements). Our senior secured debt agreement
includes certain restrictive financial covenants that the Company was not in
compliance with during the month of September 2010; thereafter the Company has
received certain waivers and has since been in compliance with its amended
covenants (see discussion in Note 9 to the consolidated financial
statements). In July 2010, in connection with the DeWind asset sale
(refer to Note 2 to the consolidated financial statements), the Company received
$836,000 of the escrowed cash, which was used to pay a vendor claim, leaving
$16.4 million remaining in escrow. We believe our current cash
position, future capital raises, expected cash flows from revenue orders,
potential recovery of additional escrowed cash, and value of “in-the-money”
options and warrants will be sufficient to fund our operations for the twelve
months ending September 30, 2011 on a consolidated basis. Due to the
sale of substantially all of the DeWind business, recorded as discontinued
operations, the cash requirements of the Company have decreased as a result of
significantly lower cash operating expenses and the elimination of inventory
purchases for costly wind turbine parts. As CTC Cable has sufficient
production capacity in its existing plant to achieve profitability, it is not
expected that significant capital expenditures will be required to expand
production, as seen in prior years. CTC Cable has also significantly
reduced its reliance on one customer as compared to prior fiscal years, which
has lowered its customer concentration risk. Additionally, as needed,
we intend to continue the practice of issuing stock, debt, or other financial
instruments for cash or for payment of services or debt extinguishment until our
cash flows from the sales of our primary products is sufficient to fully provide
for cash used in operations or if we believe such a financing event would
be a sound business strategy. The above discussion notwithstanding, the Company
has received a report from its independent auditors for the year ended September
30, 2010 that includes an explanatory paragraph describing the uncertainty as to
the Company's ability to continue as a going concern. Our consolidated financial
statements contemplate the ability to continue as such and do not include any
adjustments that might result from this uncertainty. The Company has
conservatively estimated, assuming no additional net cash receipts are generated
from the escrowed cash and, if needed, we do not close a financing transaction
that provides adequate cashflow, that our ability to continue operations after
March 2011 is uncertain (refer to “Going Concern” in Note 1 to the consolidated
financial statements).
40
Year
Ended September 30, 2009
Cash used
by operations during the year ended September 30, 2009 of $30.3 million was
primarily the result of operating losses of $73.8 million, offset by noncash
charges of $62.5 million including losses from discontinued operations of $54.3
million, depreciation and amortization of $1.0 million, stock related charges of
$5.1 million, inventory charges of $0.2 million, non-cash interest expense of
$1.8 million, a change of net assets/liabilities from discontinued operations of
$20.4 million, cash used in operating activities of discontinued operations of
$4 million and net cash provided by working capital of $5.3 million,
primarily from a decrease in inventory related purchases of $1.4 million, a $2.7
million decrease in receivable balances related to increased collection efforts,
an increase in accounts payable of $2.4 million, offset by a decrease in
deferred revenues of $1.2 million. Cash provided by investing activities of
$31.4 million was related to cash used for investing activities of discontinued
operations of $0.8 million, $49.5 million in proceeds from the sale of
DeWind, offset by restricted cash of $17.2 held in escrow to cover contingent
liabilities in connection with the sale of DeWind, and $0.8 million from the
purchase of computer hardware and software, and equipment put in service in
anticipation of increased cable manufacturing activities. Cash used in financing
activities of $0.3 million was primarily due to cash repayments of $5.0 million
for notes payable related to the Northlight financing for which net cash
proceeds of $4.7 million was received in the June 2009 quarter.
Year
Ended September 30, 2008
Cash used
by operations during the year ended September 30, 2008 of $50.4 million was
primarily the result of operating losses of $53.5 million, offset by noncash
charges of $52.2 million including losses from discontinued operations of $43.4
million, depreciation and amortization of $0.8 million, stock related charges of
$4.1 million, inventory charges of $0.6 million, non-cash interest expense of
$2.8 million, a change of net liabilities from discontinued operations of $46.1
million, cash provided by operating activities of discontinued operations of
$1.9 million and net use of cash for working capital of $4.9 million,
primarily inventory related purchases of $1.0 million and $3.3 million increase
in receivable balances related to increased business levels offset by an
increase in accounts payable of $0.5 million. Cash used by investing activities
of $3.6 million was primarily related to cash used for investing activities of
discontinued operations of $1.1 million, the increase in the CTC Cable plant to
increase capacity, the purchase of computer hardware and software, and equipment
put in service in anticipation of increased cable manufacturing activities. Cash
provided by financing activities of $54.5 million was primarily due to the cash
proceeds from our Credit Suisse equity placements in May and June of 2008 along
with $4.5 million of warrant exercise proceeds.
CAPITAL
EXPENDITURES
The
Company does not have any material commitments for capital
expenditures.
OFF-BALANCE
SHEET ARRANGEMENTS
As of
September 30, 2010, we have no off-balance sheet arrangements.
CONTRACTUAL
OBLIGATIONS
The
following table summarizes our contractual obligations (including interest
expense) and commitments as of September 30, 2010:
|
Due
in
|
In excess of
|
|||||||||||||||
|
Total
|
Year 1
|
In Years 2-3
|
3 Years
|
|||||||||||||
|
(In
Thousands)
|
|
|||||||||||||||
|
Warranty
Provisions (A)
|
$
|
524
|
$
|
306
|
$
|
218
|
$
|
—
|
||||||||
|
Debt
Obligations (B)
|
$
|
11,845
|
$
|
11,197
|
$
|
648
|
$
|
—
|
||||||||
|
Operating
Lease Obligations (C)
|
$
|
2,428
|
$
|
963
|
$
|
1,465
|
$
|
—
|
||||||||
(A)
Warranty
provisions are discussed in Note 8 to the consolidated financial
statements.
(B)
Senior secured loan due April 2012 and the related estimated monthly
interest-only payments (see Note 9 to the consolidated financial
statements).
(C)
Includes two operating facilities leases and various office equipment leases
(see “Leases” in Note 13 to the consolidated financial
statements).
41
CRITICAL
ACCOUNTING POLICIES AND ESTIMATES
Our
discussion and analysis of our financial condition and results of operations is
based on our Consolidated Financial Statements, which have been prepared in
accordance with accounting principles generally accepted in the United States,
or US GAAP. Critical accounting policies and estimates,
included in Note 1 to the consolidated financial statements, are as
follows:
Revenue
Recognition
Revenues
are recognized based on guidance provided by the Securities and Exchange
Commission (SEC). Accordingly, our general revenue recognition policy is to
recognize revenue when there is persuasive evidence of an arrangement, the sales
price is fixed or determinable, collection of the related receivable is
reasonably assured, and delivery has occurred or services have been
rendered. Revenues recorded are shown net of any sales discounts or
similar sales incentives provided to our customers.
The
Company derives, or seeks to derive, revenues from product revenue sales of
composite core, stranded composite core, core and stranded core hardware, and
other electric utility related products.
In
addition to the above general revenue recognition principles prescribed by the
SEC, our specific revenue recognition policies for each revenue source are as
follows:
PRODUCT
REVENUES. Product revenues are recognized when product shipment has been made
and title has passed to the end user customer. Product revenues consist
primarily of revenue from the sale of: (i) stranded composite core and related
hardware to utilities either sold directly by the Company or through a
distribution agreement, and (ii) composite core and related hardware sold to a
cable stranding entity. Revenues are deferred for product contracts where the
Company is required to perform installation services until after the
installation is complete. Our distribution agreements are structured so that our
revenue cycle is complete upon shipment and title transfer of products to the
distributor with no right of return.
CTC Cable
sales in each of the three years ended September 30, 2010, 2009, and 2008
consisted of stranded ACCC®
conductor and ACCC® hardware
sold to end-user utilities and sales of ACCC® core and
ACCC® hardware
to our stranding manufacturers. All ACCC® product
related sales were recognized upon delivery of product and transfer of
title. For ACCC®
conductor product sales made directly by us and not through a manufacturer or
distributor, through a third-party insurance company, we provide the option to
purchase an extended warranty for periods up to five, seven or ten years. We
allocate a portion of sales proceeds to the estimated fair value of the cost to
provide such a warranty. To date, most of our ACCC® related
product sales have been without extended warranty
coverage. Additionally, all ACCC®
conductor is sold to our end-user customers with a standard three-year product
warranty. The Company purchases a three-year term product warranty liability
insurance policy for all ACCC®
conductor sold directly by the Company to mitigate any product warranty
liability risk. Revenues from ACCC®
conductor sold directly to end-user customers are recorded net of the cost of
the three-year term insurance policy.
CONSULTING
REVENUE. Consulting revenues are generally recognized as the consulting services
are provided. We have entered into service contract agreements with electric
utility and utility services companies that generally require us to provide
engineering or design services, often in conjunction with current or future
product sales. In return, we receive engineering service fees payable in
cash. In each of the three years ended September 30, 2010, 2009 and
2008 we recognized no consulting revenues.
Currently,
multiple element contracts where there is no vendor specific objective evidence
(VSOE) or third-party evidence (TPE) that would allow the allocation of an
arrangement fee amongst various pieces of a multi-element contract, fees
received in advance of services provided are recorded as deferred revenues until
additional operational experience or other VSOE or TPE becomes available, or
until the contract is completed.
Warranty
Provisions
Warranty
provisions consist of the insured costs and liabilities associated with any
post-sales associated with our ACCC®
conductor and related hardware parts. Warranties related to our
ACCC® products
relate to conductor and hardware sold directly by us to the end-user
customer. We mitigate our loss exposure through the use of
third-party warranty insurance. Warranty related liabilities for time
periods in excess of one year are classified as non-current
liabilities.
Our
ACCC®
conductor is sold to our end-user customers with a standard three-year product
warranty. The Company purchases a three-year term product warranty liability
insurance policy for all ACCC®
conductor sold directly by the Company to mitigate any product warranty
liability risk. All customers have the option to extend this warranty
for to up to ten years upon customer payment of additional insurance
premiums. The insurance policy covers materials costs and labor costs
to replace the ACCC®
conductor in the event of a product warranty claim caused by a product
defect. As such, the purchase of the initial three-year insurance
policy covers significantly all product warranty liability for which the Company
may be exposed under its standard three-year product warranty. To
date, the Company has had no product warranty claims.
42
Use of
Estimates
The
preparation of our financial statements conform with US GAAP, which requires
management to make estimates and judgments in applying our accounting policies
that have an important impact on our reported amounts of assets, liabilities,
revenue, expenses and related disclosures at the date of our financial
statements. On an on-going basis, management evaluates its estimates including
those related to accounts receivable, inventories, share-based compensation,
warranty provisions and goodwill and intangibles, as applicable. Management
bases its estimates and judgments on historical experience and on various other
factors that are believed to be reasonable under the circumstances, the results
of which form the basis for making judgments about the carrying values of assets
and liabilities that are not readily apparent from other sources. Actual results
may differ from management’s estimates. We believe that the application of our
accounting policies requires significant judgments and estimates on the part of
management. We believe that the estimates, judgments and assumption upon which
we rely are reasonable, and based upon information available to us at the time
that these estimates, judgments and assumptions are made. These estimates,
judgments and assumptions can affect the reported amounts of assets and
liabilities as of the date of the financial statements as well as the reported
amounts of revenues and expenses during the period presented. To the extent
there are material differences between these estimates, judgments or assumptions
and actual results, our financial statements will be affected. In many cases,
the accounting treatment of a particular transaction is specifically dictated by
US GAAP and does not require management's judgment in its application. There are
also many areas in which management's judgment in selecting among available
alternatives would produce a materially different result.
The key
estimates we use that rely upon management judgment include:
|
|
-
|
the estimates pertaining to the
likelihood of our accounts receivable collectability. These estimates
primarily rely upon past payment history for each customer and
management’s judgment on the likelihood of future payments based on the
current business condition of each customer and the general business
environment.
|
|
|
-
|
the estimates pertaining to the
valuation of our inventories. These estimates primarily rely upon the
current order book for each product in inventory along with management’s
expectations and visibility into future sales of each product in
inventory.
|
|
|
-
|
the assumptions used to calculate
fair value of our share-based compensation and derivative liabilities,
primarily the volatility component of the Black-Scholes-Merton
(Black-Scholes) option-pricing model used to value our warrants and our
employee and non-employee options. This estimate relies upon the past
volatility of our share price over time as well as the estimate of the
option life.
|
|
|
-
|
the estimates and assumptions
used to determine the settlement of certain accounts related to
the sale of the DeWind assets for which a final accounting has not
been completed and which may result in the increase or decrease of asset
reserves or increase or decrease of accrued liabilities, principally
penalty payments, interest, and other costs associated with the turbine
parts suppliers for DeWind turbine parts. See related discussion at Note 2
to the consolidated financial
statements.
|
Derivative Financial
Instruments
The
Company issues financial instruments in the form of stock options and stock
warrants, and debt conversion features as part of its convertible debt
issuances. The Company has not issued any derivative instruments for hedging
purposes since its inception. The Company uses the specific guidance and
disclosure requirements provided in US GAAP. Generally, freestanding derivative
contracts where settlement is required by physical share settlement or where the
Company has a choice of share or net cash settlement are accounted for as
equity. Contracts where settlement is in cash or in net share settlement; or
where the counterparty may choose cash settlement are accounted for as a
liability. Under current US GAAP, certain of our warrants are subject to
liability accounting treatment (see discussion below under “Derivative
Liabilities”), while our stock options are considered indexed to the Company’s
stock and are accounted for as equity.
The
values of the financial instruments are estimated using the Black-Scholes
option-pricing model. Key assumptions used to value options and warrants
granted, issued or repriced are as follows:
|
Years Ended
September 30,
|
||||||||||||
|
2010
|
2009
|
2008
|
||||||||||
|
Risk
Free Rate of Return
|
0.82%-2.60
|
%
|
0.50%-2.69
|
%
|
1.61%-4.29
|
%
|
||||||
|
Volatility
|
95%-108
|
%
|
75%-116
|
%
|
66%-88
|
%
|
||||||
|
Dividend
Yield
|
0
|
%
|
0
|
%
|
0
|
%
|
||||||
|
Expected
Life
|
2-5
yrs
|
.5-5
yrs
|
.3-5
yrs
|
|||||||||
43
Derivative
Liabilities and Change in Accounting Principle
Currently,
our derivative liabilities include fair value based warrant liabilities pursuant
to US GAAP applied to the terms of the underlying agreements. The Company has
issued warrants to purchase common shares of the Company as additional incentive
for investors who purchase unregistered, restricted common stock, certain debt
obligations or convertible debentures. The fair value of certain warrants issued
and debt conversion features in conjunction with financing events are recorded
as a discount for debt issuances. Certain warrant agreements and debt conversion
arrangements include provisions that require us to record them as a liability,
at fair value, pursuant to Financial Accounting Standards Board (FASB)
accounting rules, including certain provisions designed to protect a holder’s
position from being diluted. The derivative liabilities are marked-to-market
each reporting period and changes in fair value are recorded as a non-operating
gain or loss in our consolidated statements of operations, until they are
completely settled or expire. The fair value of the warrants and debt conversion
features are determined each reporting period using the Black-Scholes valuation
model, using inputs and assumptions consistent with those used in our estimate
of fair value of employee stock options, except that the remaining contractual
life is used. Such fair value is affected by changes in inputs to
that model including our stock price, expected stock price volatility, interest
rates and expected term.
Refer to
“Fair Value Measurements” in Note 1 to the consolidated financial statements for
additional derivative liabilities disclosures.
For the
year ended September 30, 2010 we recognized a gain of $1,767,000 related to the
revaluation of our derivative liabilities. The 2010 revaluation gain
resulted mainly from the decrease in our stock price from the prior year and
from expired arrangements during the year.
In
connection with the warrants issued to investors as discussed above, the Company
has issued warrants to compensate for financing fees and other service fees
incurred. Such compensatory warrants are recorded at fair value in
the same manner as non-compensatory warrants, however, the recognized expense is
offset to additional paid-in-capital. Such warrants are considered
equity transactions in accordance with US GAAP. Additionally,
warrants issued without anti-dilution provisions are generally considered equity
transactions in accordance with US GAAP. All of our outstanding warrants
including those subject to liability accounting treatment are further discussed
in Note 10 to the consolidated financial statements.
Change
in Accounting Principle
Prior to
fiscal 2010, the Company accounted for all warrants issued in conjunction with
financing events as equity in accordance with existing US GAAP.
On
October 1, 2009, the Company adopted new FASB rules related to determining
whether an instrument (or embedded feature) is indexed to an entity’s own
stock. Current accounting for derivatives and hedging activities
specifies that a contract that would otherwise meet the definition of a
derivative, but is both (a) indexed to the Company’s own stock and (b)
classified in shareholders’ equity, would not be considered a derivative
financial instrument. The new rules provide a two-step model to be
applied in determining whether a financial instrument or an embedded feature is
indexed to an issuer’s own stock and thus able to qualify for the existing scope
exception. In accordance with the new rules, management evaluated
outstanding instruments as of October 1, 2009 and determined all warrants and
debt conversion arrangements with anti-dilution provisions issued in conjunction
with financing events, that are not considered compensatory, are not indexed to
our stock and therefore are to be recorded as liabilities at fair value and
marked-to-market through earnings. Accordingly, as of October 1,
2009, we have adjusted the opening balance of accumulated deficit to effect this
change in accounting principle as follows:
|
(Unaudited,
In Thousands)
|
October 1, 2009
|
|||
|
Accumulated
Deficit
|
$
|
(266,874
|
)
|
|
|
Cumulative
Effect of the Change (A)
|
9,111
|
|||
|
Accumulated
Deficit, as adjusted
|
$
|
(257,763
|
)
|
|
|
(A)
|
The cumulative effect of the
change to our Accumulated Deficit was derived from recognizing
mark-to-market fair value revaluation adjustments to the applicable
warrants and debt conversion features from the original issuance dates
through October 1, 2009, in the net gain amount of
$19,284,000. Additionally, the cumulative effect includes
recognition of interest expense from amortization of the debt discount
recorded from the initial valuation of the debt conversion features
through October 1, 2009, in the amount of
$10,173,000.
|
Additionally,
on October 1, 2009, the opening balance of Additional Paid-in Capital includes a
reclassification adjustment to Derivative Liabilities in the amount of
$10,514,000, which represents the aggregate original warrant fair value
previously recorded to equity.
Refer to
“Fair Value Measurements” in Note 1 to the consolidated financial statements for
additional derivative liabilities disclosures.
44
Share-Based
Compensation
US GAAP
requires that compensation cost relating to share-based payment arrangements be
recognized in the financial statements. US GAAP requires measurement of
compensation cost for all share-based awards at fair value on date of grant and
recognition of compensation over the service period for awards expected to vest.
The fair value of stock options is determined using the Black-Scholes valuation
model. Such fair value is recognized as expense over the service period, net of
estimated forfeitures.
US GAAP
requires that equity instruments issued to non-employees in exchange for
services be valued at the more accurate of the fair value of the services
provided, or the fair value of the equity instruments issued. For equity
instruments issued that are subject to a required service period, the expense
associated with the equity instruments is recorded as the instruments vest or
the services are provided. The Company has granted options and warrants to
non-employees and recorded the fair value of these equity instruments on the
date of issuance using the Black-Scholes valuation model, for options and
warrants not subject to vesting terms. For non-employee option and warrant
grants subject to vesting terms, vested shares are recorded at fair value using
the Black-Scholes valuation model and the associated expense is recorded
simultaneously or as the services are provided. The Company has granted stock to
non-employees for services and values the stock at the more reliable of the
market value on the date of issuance or the value of the services provided. For
issued grants subject to vesting or service requirements, expenses are deferred
and recognized over the more appropriate of the vesting period, or as services
are provided.
SEC
guidance requires share-based compensation to be classified in the same
expense line items as cash compensation. Additionally, the
SEC issued guidance regarding the use of a "simplified" method in
developing an estimate of expected term of "plain vanilla" share options in
accordance with US GAAP rules. The Staff indicated that it will accept a
company's election to use the simplified method, regardless of whether the
company has sufficient information to make more refined estimates of expected
term. The Staff believed that more detailed external information about employee
exercise behavior (e.g., employee exercise patterns by industry and/or other
categories of companies) would, over time, become readily available to
companies; however, the Staff continues to accept, under certain circumstances,
the use of the simplified method. The Company currently uses the simplified
method for the expected term in “plain vanilla” share options and
warrants.
Additional
information about share-based compensation is disclosed in Note 11 to the
consolidated financial statements.
Convertible
Debt
Convertible
debt is accounted for under specific guidelines established in US GAAP. The Company records a
beneficial conversion feature (BCF) related to the issuance of convertible
debt that have conversion features at fixed or adjustable rates that are
in-the-money when issued and records the fair value of warrants issued with
those instruments. The BCF for the convertible instruments is recognized and
measured by allocating a portion of the proceeds to warrants and as a reduction
to the carrying amount of the convertible instrument equal to the intrinsic
value of the conversion features, both of which are credited to paid-in-capital
or liabilities as appropriate. The Company calculates the fair value of warrants
issued with the convertible instruments using the Black-Scholes valuation
method, using the same assumptions used for valuing employee options, except
that the contractual life of the warrant is used. Upon each issuance, the
Company evaluates the variable conversion features and determines the
appropriate accounting treatment as either equity or liability, in accordance
with US GAAP. The Company first allocates the value of the proceeds
received to the convertible instrument and any other detachable instruments
(such as detachable warrants) on a relative fair value basis and then determines
the amount of any BCF based on effective conversion price to measure the
intrinsic value, if any, of the embedded conversion option. Using the effective
yield method, the allocated fair value is recorded as a debt discount or premium
and is amortized over the expected term of the convertible debt to interest
expense. For a conversion price change of a convertible debt issue, the
additional intrinsic value of the debt conversion feature, calculated as the
number of additional shares issuable due to a conversion price change multiplied
by the previous conversion price, is recorded as additional debt discount and
amortized over the remaining life of the debt. As of September 30,
2010 we had no convertible debt outstanding.
US GAAP
rules specify that a contingent obligation to make future payments or otherwise
transfer consideration under a registration payment arrangement, whether issued
as a separate agreement or included as a provision of a financial instrument or
other agreement, should be separately recognized and measured in accordance with
US GAAP contingency rules. The contingent obligation to make future payments or
otherwise transfer consideration under a registration payment arrangement should
be separately recognized and measured in accordance with said rules, pursuant to
which a contingent obligation must be accrued only if it is more likely than not
to occur. Historically, the Company has not been required to accrue any
contingent liabilities in this regard.
RECENT ACCOUNTING PROUNOUNCEMENTS
Refer to
Note 1 to the consolidated financial statements.
ITEM
7A - QUANTITATIVE AND QUALITATIVE DISCLOSURES ABOUT MARKET
RISK
Our
exposure to market risk relates primarily to our cash balances and the effect
that changes in interest rates have on the interest earned on that
portfolio. Our current debt obligations bear a fixed rate of
interest.
45
As of
September 30, 2010 we did not hold any derivative financial instruments for
speculative or trading purposes. The primary objective of our investment
activities is the preservation of principal while maximizing investment income
and minimizing risk. As of September 30, 2010, we had $3.0 million in cash and
cash equivalents including short-term investments purchased with original
maturities of three months or less. Due to the short duration of these financial
instruments, we do not expect that a change in interest rates would result in
any material loss to our investment portfolio.
ITEM
8 – FINANCIAL STATEMENTS AND SUPPLEMENTARY DATA
|
Page
|
||
|
INDEPENDENT
REGISTERED PUBLIC ACCOUNTING FIRM REPORTS
|
47
|
|
|
Composite
Technology Corporation and Subsidiaries Consolidated Financial
Statements:
|
||
|
Consolidated
Balance Sheets As of September 30, 2010 and September 30,
2009
|
49
|
|
|
Consolidated
Statements of Operations and Comprehensive Loss For the Years Ended
September 30, 2010, 2009 and 2008
|
50
|
|
|
Consolidated
Statements of Shareholders' Equity (Deficit) for the Years Ended
September 30, 2010, 2009 and 2008
|
51
|
|
|
Consolidated
Statements of Cash Flows for the Years Ended September 30, 2010, 2009 and
2008
|
52
|
|
|
Notes
to the Consolidated Financial Statements
|
54
|
46
REPORT
OF INDEPENDENT REGISTERED PUBLIC ACCOUNTING FIRM
To the
Board of Directors and Shareholders
Composite
Technology Corporation and Subsidiaries
Irvine,
California
We have
audited the accompanying consolidated balance sheets of Composite Technology
Corporation and Subsidiaries (collectively, the “Company”) as of September 30,
2010 and 2009, and the related consolidated statements of operations and
comprehensive loss, shareholders' deficit, and cash flows for each of
the three years in the period ended September 30, 2010. Our audits also included
the financial statement schedules of the Company listed in Item 15. These
financial statements and financial statement schedules are the responsibility of
the Company's management. Our responsibility is to express an opinion on these
financial statements based on our audits.
We
conducted our audits in accordance with the standards of the Public Company
Accounting Oversight Board (United States). Those standards require that we plan
and perform the audit to obtain reasonable assurance about whether the financial
statements are free of material misstatement. An audit includes examining, on a
test basis, evidence supporting the amounts and disclosures in the financial
statements. An audit also includes assessing the accounting principle used and
significant estimates made by management, as well as evaluating the overall
financial statement presentation. We believe that our audits provide a
reasonable basis for our opinion.
In our
opinion, the consolidated financial statements referred to above present fairly,
in all material respects, the financial position of the Company as of September
30, 2010, and 2009, and the results of its operations and its cash flows for
each of the three years in the period ended September 30, 2010, in conformity
with U.S. generally accepted accounting principles. Also, in our opinion, the
related financial statement schedules, when considered in relation to the basic
consolidated financial statements taken as a whole, presents fairly in all
material respects the information set forth therein.
We have
also audited, in accordance with the standards of the Public Company Accounting
Oversight Board (United States), the Company's internal control over financial
reporting as of September 30, 2010, based on criteria established in Internal Control —Integrated
Framework issued by the Committee of Sponsoring Organizations of the
Treadway Commission. Our report dated December 14, 2010 expressed an opinion
that the Company had not maintained effective internal control over financial
reporting as of September 30, 2010, based on criteria established in Internal Control — Integrated
Framework issued by the Committee of Sponsoring Organizations of the
Treadway Commission.
The
accompanying financial statements have been prepared assuming that the Company
will continue as a going concern. As discussed in Note 1 to the
financial statements, the Company has suffered recurring losses from operations.
This raises substantial doubt about the Company's ability to continue as a going
concern. Management's plans in regard to these matters are also
described in Note 1. The financial statements do not include any
adjustments that might result from the outcome of this uncertainty.
As discussed in Note 1 to the financial
statements, the Company changed its method of depreciation related to certain
production machinery and equipment in the year ended September 30,
2010.
As discussed in Note 1 to the financial
statements, the Company has changed its method of accounting for financial
instruments (or embedded features) indexed to an entity’s own stock in the year ended September 30, 2010
due to the adoption of ASC 815-40.
/s/SINGERLEWAK
LLP
SingerLewak
LLP
Irvine,
California
December
14, 2010
47
REPORT
OF INDEPENDENT REGISTERED PUBLIC ACCOUNTING FIRM
To the
Board of Directors and Shareholders
Composite
Technology Corporation and Subsidiaries
Irvine,
California
We have
audited Composite Technology Corporation's internal control over financial
reporting as of September 30, 2010, based on criteria established in Internal Control — Integrated
Framework issued by the Committee of Sponsoring Organizations of the
Treadway Commission. Composite Technology Corporation’s management is
responsible for maintaining effective internal control over financial reporting
and for its assessment of the effectiveness of internal control over financial
reporting included in the accompanying Management’s Annual Report on Internal
Control over Financial Reporting. Our responsibility is to express an
opinion on the company's internal control over financial reporting based on our
audit.
We
conducted our audit in accordance with the standards of the Public Company
Accounting Oversight Board (United States). Those standards require that we plan
and perform the audit to obtain reasonable assurance about whether effective
internal control over financial reporting was maintained in all material
respects. Our audit included obtaining an understanding of internal control over
financial reporting, assessing the risk that a material weakness exists, and
testing and evaluating the design and operating effectiveness of internal
control based on the assessed risk. Our audit also included
performing such other procedures as we considered necessary in the
circumstances. We believe that our audit provides a reasonable basis
for our opinion.
A
company's internal control over financial reporting is a process designed to
provide reasonable assurance regarding the reliability of financial reporting
and the preparation of financial statements for external purposes in accordance
with generally accepted accounting principles. A company's internal
control over financial reporting includes those policies and procedures that
(a) pertain to the
maintenance of records that, in reasonable detail, accurately and fairly reflect
the transactions and dispositions of the assets of the company; (b) provide reasonable
assurance that transactions are recorded as necessary to permit preparation of
financial statements in accordance with generally accepted accounting
principles, and that receipts and expenditures of the company are being made
only in accordance with authorizations of management and directors of the
company; and (c)
provide reasonable assurance regarding prevention or timely detection of
unauthorized acquisition, use, or disposition of the company's assets that could
have a material effect on the consolidated financial statements.
Because
of its inherent limitations, internal control over financial reporting may not
prevent or detect misstatements. Also, projections of any evaluation
of effectiveness to future periods are subject to the risk that controls may
become inadequate because of changes in conditions, or that the degree of
compliance with the policies or procedures may deteriorate.
A
material weakness is a deficiency, or a combination of deficiencies, in internal
control over financial reporting, such that there is a reasonable possibility
that a material misstatement of the company's annual or interim consolidated
financial statements will not be prevented or detected on a timely basis. The
following material weakness has been identified and included in management's
assessment:
As of
September 30, 2010, the Company lacked an effective internal control
environment. Material misstatements may result from the lack of
controls and material weaknesses found in the following transaction
cycles:
|
|
·
|
Inventory
costing and management process over on-hand inventory and inventory on
consignment
|
|
|
·
|
Information
technology controls and related
systems
|
|
|
·
|
Financial
control and reporting
|
These
material weaknesses were considered in determining the nature, timing and extent
of audit tests applied in our audit of the 2010 financial statements, and this
report does not affect our report dated December 14, 2010 on those consolidated
financial statements and financial statement schedules.
In our
opinion, because of the effect of the material weaknesses described above on the
achievement of the objectives of the control criteria, the Company has not
maintained effective internal control over financial reporting as of September
30, 2010, based on criteria established in Internal Control — Integrated
Framework issued by the Committee of Sponsoring Organizations of the
Treadway Commission.
We have
also audited, in accordance with the standards of the Public Company Accounting
Oversight Board (United States), the consolidated balance sheets of the Company
as of September 30, 2010 and 2009, and the consolidated statements of operations
and comprehensive loss, shareholders’ deficit and cash flows for each of the
three years in the period ended September 30, 2010, and our report dated
December 14, 2010 expressed an unqualified opinion and included an
emphasis paragraph regarding the Company’s ability to continue as a going
concern, as described in Note 1 to the consolidated financial statements and
includes explanatory paragraphs relating to changes in the method of accounting
for depreciation on certain production equipment and for the adoption of ASC
815-40.
/s/SINGERLEWAK
LLP
SingerLewak
LLP
Irvine,
California
December
14, 2010
48
COMPOSITE
TECHNOLOGY CORPORATION AND SUBSIDIARIES
CONSOLIDATED
BALANCE SHEETS
(IN
THOUSANDS, EXCEPT PAR VALUE AND SHARE AMOUNTS)
|
September 30,
|
||||||||
|
2010
|
2009
|
|||||||
|
ASSETS
|
||||||||
|
CURRENT
ASSETS
|
||||||||
|
Cash
and Cash Equivalents
|
$
|
2,998
|
$
|
23,968
|
||||
|
Restricted
Cash, Current Portion (Note 2)
|
11,689
|
5,500
|
||||||
|
Accounts
Receivable, net of reserve of $217 and $81
|
2,339
|
1,732
|
||||||
|
Inventory,
net of reserve of $1,255 and $923
|
3,557
|
4,378
|
||||||
|
Prepaid
Expenses and Other Current Assets
|
1,111
|
959
|
||||||
|
Current
Assets of Discontinued Operations (Note 2)
|
2,220
|
2,522
|
||||||
|
Total
Current Assets
|
23,914
|
39,059
|
||||||
|
Property
and Equipment, net of accumulated depreciation of $2,721 and
$3,766
|
2,936
|
3,214
|
||||||
|
Restricted
Cash, Non-Current (Note 2)
|
4,667
|
11,675
|
||||||
|
Other
Assets
|
778
|
891
|
||||||
|
TOTAL
ASSETS
|
$
|
32,295
|
$
|
54,839
|
||||
|
LIABILITIES
AND SHAREHOLDERS' EQUITY (DEFICIT)
|
||||||||
|
CURRENT
LIABILITIES
|
||||||||
|
Accounts
Payable and Other Accrued Liabilities
|
$
|
6,012
|
$
|
7,217
|
||||
|
Deferred
Revenue and Customer Advances
|
1,386
|
16
|
||||||
|
Warranty
Provision
|
306
|
258
|
||||||
|
Derivative
Liabilities – Current (Note 1)
|
2
|
—
|
||||||
|
Loan
and Notes Payable – Current, net of discount of $919 and
$315
|
9,081
|
8,723
|
||||||
|
Current
Liabilities of Discontinued Operations (Note 2)
|
38,507
|
43,469
|
||||||
|
Total
Current Liabilities
|
55,294
|
59,683
|
||||||
|
LONG-TERM
LIABILITIES
|
||||||||
|
Long-Term
Portion of Deferred Revenue
|
514
|
561
|
||||||
|
Long-Term
Portion of Warranty Provision
|
218
|
306
|
||||||
|
Derivative
Liabilities – Long-Term (Note 1)
|
1,295
|
—
|
||||||
|
Non-Current
Liabilities of Discontinued Operations (Note 2)
|
—
|
1,120
|
||||||
|
Total
Long-Term Liabilities
|
2,027
|
1,987
|
||||||
|
Total
Liabilities
|
57,321
|
61,670
|
||||||
|
COMMITMENTS
AND CONTINGENCIES
|
||||||||
|
SHAREHOLDERS'
EQUITY (DEFICIT)
|
||||||||
|
Common
Stock, $.001 par value; 600,000,000 shares authorized; 288,269,660 and
288,088,370 issued and outstanding, respectively
|
288
|
288
|
||||||
|
Additional
Paid in Capital
|
252,215
|
259,755
|
||||||
|
Accumulated
Deficit
|
(277,530
|
)
|
(266,874
|
)
|
||||
|
Accumulated
Other Comprehensive Income
|
1
|
—
|
||||||
|
Total
Shareholders’ (Deficit)
|
(25,026
|
)
|
(6,831
|
)
|
||||
|
TOTAL
LIABILITIES AND SHAREHOLDERS’ EQUITY (DEFICIT)
|
$
|
32,295
|
$
|
54,839
|
||||
The
accompanying notes are an integral part of these financial
statements.
49
COMPOSITE
TECHNOLOGY CORPORATION AND SUBSIDIARIES
CONSOLIDATED
STATEMENTS OF OPERATIONS AND COMPREHENSIVE LOSS
(IN
THOUSANDS, EXCEPT PER SHARE AND SHARE AMOUNTS)
|
For the Years Ended September 30,
|
||||||||||||
|
2010
|
2009
|
2008
|
||||||||||
|
Revenue
|
$
|
10,842
|
$
|
19,602
|
$
|
32,715
|
||||||
|
Cost
of Revenue
|
8,842
|
14,285
|
21,129
|
|||||||||
|
Gross Profit
|
2,000
|
5,317
|
11,586
|
|||||||||
|
OPERATING
EXPENSES
|
||||||||||||
|
Officer
Compensation
|
2,449
|
3,225
|
2,129
|
|||||||||
|
General
and Administrative
|
12,180
|
9,913
|
7,141
|
|||||||||
|
Research
and Development
|
2,226
|
2,703
|
4,519
|
|||||||||
|
Sales
and Marketing
|
5,022
|
5,598
|
3,485
|
|||||||||
|
Depreciation
and Amortization
|
383
|
368
|
339
|
|||||||||
|
Total
Operating Expenses
|
22,260
|
21,807
|
17,613
|
|||||||||
|
LOSS
FROM OPERATIONS
|
(20,260
|
)
|
(16,490
|
)
|
(6,027
|
)
|
||||||
|
OTHER
INCOME / (EXPENSE)
|
||||||||||||
|
Interest
Expense
|
(2,149
|
)
|
(2,961
|
)
|
(3,844
|
)
|
||||||
|
Interest
Income
|
29
|
26
|
270
|
|||||||||
|
Other
Income / (Expense)
|
(196
|
)
|
(1
|
)
|
74
|
|||||||
|
Change
in Fair Value of Derivative Liabilities (Note 1)
|
1,767
|
—
|
—
|
|||||||||
|
Expense
Related to Modification of Warrants due to Anti-Dilution
Events
|
—
|
(7
|
)
|
(553
|
)
|
|||||||
|
Total
Other Expense
|
(549
|
)
|
(2,943
|
)
|
(4,053
|
)
|
||||||
|
Loss
from Continuing Operations before Income Taxes
|
(20,809
|
)
|
(19,433
|
)
|
(10,080
|
)
|
||||||
|
Income
Tax Expense
|
14
|
5
|
3
|
|||||||||
|
NET
LOSS FROM CONTINUING OPERATIONS
|
(20,823
|
)
|
(19,438
|
)
|
(10,083
|
)
|
||||||
|
Income
(Loss) from Discontinued Operations, net of tax of $1, $0 and $21,
respectively (including impairment charges of $23,369 and Loss on
Sale of $ 1,357 in 2009) (Note 2)
|
1,056
|
(54,313
|
)
|
(43,430
|
)
|
|||||||
|
NET
LOSS
|
(19,767
|
)
|
(73,751
|
)
|
(53,513
|
)
|
||||||
|
OTHER
COMPREHENSIVE INCOME (LOSS)
|
||||||||||||
|
Foreign
Currency Translation Adjustment:
|
||||||||||||
|
Unrealized
Holding Gain (Loss) Arising During Period
|
1
|
(431
|
)
|
574
|
||||||||
|
Less:
Reclassification Adjustment for Losses Included in Net
Loss
|
—
|
361
|
—
|
|||||||||
|
Other
Comprehensive Income (Loss), net of tax of $0, $0 and $0,
respectively
|
1
|
(70
|
)
|
574
|
||||||||
|
COMPREHENSIVE
LOSS
|
$
|
(19,766
|
)
|
$
|
(73,821
|
)
|
$
|
(52,939
|
)
|
|||
|
BASIC
AND DILUTED LOSS PER SHARE
|
||||||||||||
|
Loss
per share from continuing operations
|
$
|
(0.07
|
)
|
$
|
(0.07
|
)
|
$
|
(0.04
|
)
|
|||
|
Income
(loss) per share from discontinued operations
|
$
|
—
|
$
|
(0.19
|
)
|
$
|
(0.18
|
)
|
||||
|
TOTAL
BASIC AND DILUTED LOSS PER SHARE
|
$
|
(0.07
|
)
|
$
|
(0.26
|
)
|
$
|
(0.22
|
)
|
|||
|
WEIGHTED-AVERAGE
COMMON SHARES OUTSTANDING
|
288,218,524
|
287,990,562
|
243,369,110
|
|||||||||
The
accompanying notes are an integral part of these financial
statements.
50
COMPOSITE
TECHNOLOGY CORPORATION AND SUBSIDIARIES
CONSOLIDATED
STATEMENTS OF SHAREHOLDERS’ EQUITY (DEFICIT) FOR
THE
YEARS ENDED SEPTEMBER 30, 2010, 2009 and 2008
|
(In Thousands Except
|
Common Stock
|
Additional
|
Accumulated
Other
Comprehensive
|
Accumulated
|
||||||||||||||||||||
|
For Share Amounts)
|
Shares
|
Amount
|
paid-in capital
|
Income (Loss)
|
deficit
|
Total
|
||||||||||||||||||
|
Balance
at September 30, 2007
|
221,308,350 | $ | 221 | $ | 189,605 | $ | (504 | ) | $ | (139,610 | ) | $ | 49,712 | |||||||||||
|
Issuance
of Common Stock for:
|
||||||||||||||||||||||||
|
Cash
pursuant to PIPE placement
|
58,787,877 | 59 | 49,941 | — | — | 50,000 | ||||||||||||||||||
|
Cash
pursuant to warrant exercises
|
4,129,139 | 4 | 4,453 | — | — | 4,457 | ||||||||||||||||||
|
Cash
pursuant to option exercises
|
490,000 | 1 | 196 | — | — | 197 | ||||||||||||||||||
|
Conversion
of Convertible Debt
|
3,073,004 | 3 | 3,132 | — | — | 3,135 | ||||||||||||||||||
|
Fair
value of Services provided
|
200,000 | — | 208 | — | — | 208 | ||||||||||||||||||
|
Offering
Costs paid in Cash
|
— | — | (91 | ) | — | — | (91 | ) | ||||||||||||||||
|
Issuance
of Warrants for:
|
||||||||||||||||||||||||
|
Services
|
— | — | 127 | — | — | 127 | ||||||||||||||||||
|
Anti-dilutive
effect of stock issuance
|
— | — | 138 | — | — | 138 | ||||||||||||||||||
|
$5
million Debt Financing
|
— | — | 1,045 | — | — | 1,045 | ||||||||||||||||||
|
Warrant
modifications due to anti-dilutive events
|
— | — | 415 | — | — | 415 | ||||||||||||||||||
|
Additional
conversion feature – anti-dilutive event
|
— | — | 302 | — | — | 302 | ||||||||||||||||||
|
Share-Based
Compensation
|
— | — | 2,974 | — | — | 2,974 | ||||||||||||||||||
|
Other
Comprehensive Income
|
— | — | — | 574 | — | 574 | ||||||||||||||||||
|
Net
Loss
|
— | — | — | — | (53,513 | ) | (53,513 | ) | ||||||||||||||||
|
Balance
at September 30, 2008
|
287,988,370 | $ | 288 | $ | 252,445 | $ | 70 | $ | (193,123 | ) | $ | 59,680 | ||||||||||||
|
Issuance
of Common Stock for:
|
||||||||||||||||||||||||
|
Cash
pursuant to option exercises
|
100,000 | — | 35 | — | — | 35 | ||||||||||||||||||
|
Issuance
of Warrants for:
|
||||||||||||||||||||||||
|
$5
million Debt Financing
|
— | — | 726 | — | — | 726 | ||||||||||||||||||
|
Warrant
modifications due to anti-dilutive events
|
— | — | 9 | — | — | 9 | ||||||||||||||||||
|
Warrant
modification due to repricing
|
— | — | 22 | — | — | 22 | ||||||||||||||||||
|
Additional
conversion feature – anti-dilutive event
|
— | — | 27 | — | — | 27 | ||||||||||||||||||
|
Share-Based
Compensation
|
— | — | 6,491 | — | — | 6,491 | ||||||||||||||||||
|
Other
Comprehensive Loss
|
— | — | — | (70 | ) | — | (70 | ) | ||||||||||||||||
|
Net
Loss
|
— | — | — | — | (73,751 | ) | (73,751 | ) | ||||||||||||||||
|
Balance
at September 30, 2009
|
288,088,370 | $ | 288 | $ | 259,755 | $ | — | $ | (266,874 | ) | $ | (6,831 | ) | |||||||||||
|
Cumulative
Effect of a Change in Accounting Principal (Note 1)
|
— | — | (10,514 | ) | — | 9,111 | (1,403 | ) | ||||||||||||||||
|
Balance
at October 1, 2009
|
288,088,370 | $ | 288 | $ | 249,241 | $ | — | $ | (257,763 | ) | $ | (8,234 | ) | |||||||||||
|
Issuance
of Common Stock for:
|
||||||||||||||||||||||||
|
Cash
pursuant to option exercises
|
20,000 | — | 7 | — | — | 7 | ||||||||||||||||||
|
Services
– stock award
|
161,290 | — | 45 | — | — | 45 | ||||||||||||||||||
|
Issuance
of Warrants for:
|
||||||||||||||||||||||||
|
Services
|
— | — | 97 | — | — | 97 | ||||||||||||||||||
|
Settlement
of legal claim
|
— | — | 57 | — | — | 57 | ||||||||||||||||||
|
Share-Based
Compensation
|
— | — | 2,768 | — | — | 2,768 | ||||||||||||||||||
|
Other
Comprehensive Income
|
— | — | — | 1 | — | 1 | ||||||||||||||||||
|
Net
Loss
|
— | — | — | — | (19,767 | ) | (19,767 | ) | ||||||||||||||||
|
Balance
at September 30, 2010
|
288,269,660 | $ | 288 | $ | 252,215 | $ | 1 | $ | (277,530 | ) | $ | (25,026 | ) | |||||||||||
The
accompanying notes are an integral part of these financial
statements.
51
COMPOSITE
TECHNOLOGY CORPORATION AND SUBSIDIARIES
CONSOLIDATED
STATEMENTS OF CASH FLOWS
(IN
THOUSANDS)
|
For the Years Ended September 30,
|
||||||||||||
|
2010
|
2009
|
2008
|
||||||||||
|
CASH
FLOWS FROM OPERATING ACTIVITIES
|
||||||||||||
|
Net
loss
|
$
|
(19,767
|
)
|
$
|
(73,751
|
)
|
$
|
(53,513
|
)
|
|||
|
Adjustments
to reconcile net loss to net cash used in operating
activities:
|
||||||||||||
|
(Income)
loss from discontinued operations (Note 2)
|
(1,056
|
)
|
54,313
|
43,430
|
||||||||
|
Interest
and deferred finance charge amortization related to detachable warrants
and fixed conversion features
|
1,244
|
1,827
|
2,824
|
|||||||||
|
Depreciation
and amortization
|
698
|
1,011
|
776
|
|||||||||
|
Share-based
compensation
|
2,679
|
4,707
|
2,655
|
|||||||||
|
Amortization
of prepaid expenses paid in stock/warrants
|
219
|
328
|
524
|
|||||||||
|
Issuance
of warrants for services
|
—
|
22
|
127
|
|||||||||
|
Issuance
of warrants for settlement
|
57
|
—
|
—
|
|||||||||
|
Issuance
of common stock for services
|
45
|
—
|
208
|
|||||||||
|
Expense
related to modification of stock warrants
|
—
|
7
|
553
|
|||||||||
|
Change
in fair value of derivative liabilities
|
(1,767
|
)
|
—
|
—
|
||||||||
|
Bad
debt expense
|
32
|
81
|
—
|
|||||||||
|
Inventory
reserve expense
|
935
|
223
|
602
|
|||||||||
|
Inventory
obsolescence charges
|
448
|
—
|
554
|
|||||||||
|
Gain
on sale of fixed assets
|
—
|
—
|
(75
|
)
|
||||||||
|
Foreign
currency exchange
|
(136
|
)
|
—
|
—
|
||||||||
|
Changes
in Assets / Liabilities:
|
||||||||||||
|
Accounts
receivable
|
(769
|
)
|
2,671
|
(3,285
|
)
|
|||||||
|
Inventory
|
(562
|
)
|
1,448
|
(1,044
|
)
|
|||||||
|
Prepaids
and other current assets
|
(158
|
)
|
(68
|
)
|
(441
|
)
|
||||||
|
Other
assets
|
292
|
(231
|
)
|
(297
|
)
|
|||||||
|
Accounts
payable and other accruals
|
(1,075
|
)
|
2,425
|
460
|
||||||||
|
Deferred
revenue
|
1,323
|
(1,240
|
)
|
(517
|
)
|
|||||||
|
Accrued
warranty provision
|
(40
|
)
|
344
|
220
|
||||||||
|
Net
assets/liabilities of discontinued operations
|
(4,634
|
)
|
(20,423
|
)
|
(46,125
|
)
|
||||||
|
Cash
used in operating activities
– continuing operations
|
$
|
(21,992
|
)
|
$
|
(26,306
|
)
|
$
|
(52,364
|
)
|
|||
|
Cash
provided by (used in) operating activities – discontinued
operations
|
—
|
(3,968
|
)
|
1,944
|
||||||||
|
Net
cash used in operating activities
|
$
|
(21,992
|
)
|
$
|
(30,274
|
)
|
$
|
(50,420
|
)
|
|||
|
CASH
FLOWS FROM INVESTING ACTIVITIES
|
||||||||||||
|
Proceeds
from sale of fixed assets
|
$
|
—
|
$
|
—
|
$
|
110
|
||||||
|
Purchase
of property and equipment
|
(420
|
)
|
(795
|
)
|
(1,959
|
)
|
||||||
|
Restricted
Cash
|
819
|
(16,482
|
)
|
(693
|
)
|
|||||||
|
Proceeds
from sale of DeWind (including $17,175 held in escrow) (Note
2)
|
—
|
49,500
|
—
|
|||||||||
|
Cash
provided by (used in) investing activities – continuing
operations
|
$
|
399
|
$
|
32,223
|
$
|
(2,542
|
)
|
|||||
|
Cash
used for investing activities – discontinued operations
|
—
|
(806
|
)
|
(1,064
|
)
|
|||||||
|
Net
cash provided by (used in) investing activities
|
$
|
399
|
$
|
31,417
|
$
|
(3,606
|
)
|
|||||
The
accompanying notes are an integral part of these financial
statements.
52
COMPOSITE
TECHNOLOGY CORPORATION AND SUBSIDIARIES
CONSOLIDATED
STATEMENTS OF CASH FLOWS
(IN
THOUSANDS)
(CONTINUED)
|
For the Years Ended September 30,
|
||||||||||||
|
2010
|
2009
|
2008
|
||||||||||
|
CASH
FLOWS FROM FINANCING ACTIVITIES
|
||||||||||||
|
Proceeds
from issuance of common stock (net of issuing costs of $0, $0 and
$91)
|
$
|
—
|
$
|
—
|
$
|
49,910
|
||||||
|
Proceeds
from senior secured debt agreements (net of fees of $347, $295 and
$0)
|
9,653
|
4,705
|
2,500
|
|||||||||
|
Payments
on capital leased assets
|
—
|
—
|
(109
|
)
|
||||||||
|
Proceeds
from exercise of warrants
|
—
|
—
|
4,457
|
|||||||||
|
Proceeds
from exercise of options
|
7
|
35
|
196
|
|||||||||
|
Repayments
of notes payable, debt and factoring arrangements
|
(9,037
|
)
|
(5,000
|
)
|
(2,500
|
)
|
||||||
|
Cash
provided by (used in) financing activities
|
$
|
623
|
$
|
(260
|
)
|
$
|
54,454
|
|||||
|
Total
net increase (decrease) in cash and cash equivalents
|
$
|
(20,970
|
)
|
$
|
883
|
$
|
428
|
|||||
|
Total
cash and cash equivalents at beginning of period
|
$
|
23,968
|
$
|
23,085
|
$
|
22,657
|
||||||
|
Total
cash and cash equivalents at end of period
|
$
|
2,998
|
$
|
23,968
|
$
|
23,085
|
||||||
|
SUPPLEMENTAL
DISCLOSURE OF CASH FLOW INFORMATION:
|
||||||||||||
|
INTEREST
PAID
|
$
|
1,032
|
$
|
847
|
$
|
1,160
|
||||||
|
INCOME
TAXES PAID
|
$
|
14
|
$
|
5
|
$
|
11
|
||||||
The
accompanying notes are an integral part of these financial
statements
53
SUPPLEMENTAL
DISCLOSURE OF NON-CASH FINANCING ACTIVITES:
During
the fiscal year ended September 30, 2010, the Company:
Issued
300,000 warrants at an exercise price of $0.45 per share valued at $57,000 in
settlement of a legal dispute.
Issued
161,290 shares of common stock to John Brewster, former CTC Cable President,
valued at $45,000 in partial payment of an employment acceptance
bonus.
Issued
600,000 warrants at an exercise price of $0.35 per share valued at $95,000 in
connection with an ongoing service agreement.
Issued
10,000,000 warrants (5 million at an exercise price of $0.29 per share and 5
million at an exercise price of $1.00 per share) for an aggregate value of
$1,494,000 in connection with the April 2010 debt financing
transaction. The Company recorded $1,488,000 (net of $6,000 in cash
consideration) as a debt discount. See Note 9.
Reported
a non-cash transfer between accounts receivable and accounts payable in the
amount of $130,000.
During
the fiscal year ended September 30, 2009, the Company:
Issued
150,000 warrants at an exercise price of $0.96 per share in settlement of a
disputed financing fee related to the May 2008 debt financing.
Re-priced
200,000 $1.75 warrants, 200,000 $1.50 warrants, and 200,000 $1.25 warrants to a
strike price of $0.75 per warrant for all three series of warrants. The Company
recorded $22,000 to general and administrative expense for the re-pricing of
these warrants.
Issued
4,000,000 warrants at an exercise price of $0.25 per share in conjunction with a
$5,000,000 Bridge Note financing. The Company recorded $726,000 as debt discount
for the warrants issued. The issuance triggered anti-dilution exercise price
protection between $0.01 and $0.02 per warrant for warrants issued in
conjunction with the 2007 Convertible Debt and Private Equity Placement
financings. The Company recorded $7,000 to general and administrative expense
and $27,000 as additional debt discount to the convertible notes as a result of
the re-pricings.
During
the fiscal year ended September 30, 2008, the Company issued:
2,073,004
shares of Common Stock for the conversion of $2,135,000 of Convertible Debt at a
conversion price of $1.03 per share.
1,000,000
shares of Common Stock for the conversion of $1,000,000 of Convertible Debt at a
conversion price of $1.00 per share.
200,000
shares of Common Stock as a prepayment for investor relations services valued at
$208,000, the market price on the date of issuance.
2,500,000
warrants valued at the fair value on the issuance dates of $1,045,000 issued
pursuant to the May 5, 1008 Debt agreement.
542,272
warrants valued at the fair value on the issuance date of $138,000 were issued
pursuant to anti-dilution protection provisions of our 2005 DIP and 2006 Bridge
Note warrant holders as a result of our May 2008 equity
financing.
54
COMPOSITE
TECHNOLOGY CORPORATION AND SUBSIDIARIES
NOTES
TO CONSOLIDATED FINANCIAL STATEMENTS
FOR
THE YEARS ENDED SEPTEMBER 30, 2010, 2009, AND 2008
NOTE
1 – ORGANIZATION AND SIGNIFICANT ACCOUNTING POLICIES
Composite
Technology Corporation (the “Company”), originally incorporated in Florida and
reincorporated in Nevada, is an Irvine, CA based company that has operated in
two segments, CTC Cable “Cable” and DeWind. As discussed below, in
September 2009, the Company sold substantially all of its Wind segment, which
sold wind turbines under the brand name DeWind. The Cable segment sells high
efficiency patented composite core electricity conductors known as "ACCC®
conductor" for use in electric transmission and distribution
lines. ACCC®
conductor is sold in North America directly by CTC Cable to
utilities. ACCC®
conductor is sold elsewhere in the world directly to utilities as well as
through license and distribution agreements or other agreements with Lamifil in
Belgium, Midal Cable in Bahrain, Far East Composite Cable Co. in China, and
through two Indonesian companies, PT KMI Wire and Cable and PT Tranka Kabel, and
now through Alcan Cable in the U.S. and Canada, IMSA in Argentina and Centelsa
in Colombia. ACCC®
conductor has been sold commercially since 2005 and is currently marketed
worldwide to electrical utilities, transmission companies and transmission
design/engineering firms.
BASIS
OF PRESENTATION AND PRINCIPALS OF CONSOLIDATION
The
accompanying Consolidated Financial Statements have been prepared on a going
concern basis as discussed below.
These
financial statements and the accompanying notes are prepared in accordance with
accounting principles generally accepted in the United States of America (US
GAAP) and conform to Regulation S-X under the Securities Exchange Act of 1934,
as amended.
The
financial statements include the accounts of Composite Technology Corporation
and its wholly-owned subsidiaries, the most significant of which is CTC Cable
Corporation.
The
Company consolidates the financial statements of all entities in which the
Company has a controlling financial interest, as defined in US GAAP. All
significant inter-company accounts and transactions are eliminated during
consolidation.
GOING
CONCERN
The
Company has received a report from its independent auditors for the year ended
September 30, 2010 that includes an explanatory paragraph describing the
uncertainty as to the Company's ability to continue as a going concern. These
consolidated financial statements contemplate the ability to continue as such
and do not include any adjustments that might result from this
uncertainty.
During
the year ended September 30, 2010, the Company incurred a net loss of
$19,767,000 and had negative cash flows from operating activities –
continuing operations of $17,358,000. In addition, the Company had an
accumulated deficit of $277,530,000 at September 30, 2010. The Company's ability
to continue as a going concern is dependent upon its ability to generate
profitable operations in the future and/or to obtain the necessary financing to
meet its obligations and repay its liabilities arising from normal business
operations when they come due. The outcome of these matters cannot be predicted
with any certainty at this time.
Our
principal sources of working capital have been private debt issuances and
historically, the Company has issued registered stock and unregistered,
restricted stock, stock options, and warrants in settlement of both operational
and non-operational related liabilities and as a source of funds.
Since
inception through September 30, 2010, our Cable products business has generated
revenue of approximately $83 million in ACCC®
conductor products. We will require a significant increase in customer orders at
sufficient profit margin levels to cover our expenses and generate sufficient
cash flows from operations. Currently, for fiscal 2011 we have
$5.9 million in firm backlog for delivery through the end of the March 2011
quarter.
There is
no guarantee that our products will be accepted or provide a marketable
advantage and therefore no guarantee that our products will ever be profitable.
In addition, management plans to ensure that sufficient capital will be
available to provide for its capital needs with minimal borrowings and may issue
equity securities to ensure that this is the case. However, there is no
guarantee that the Company will be successful in obtaining sufficient capital
through borrowings or selling equity securities. These financial statements do
not include any adjustments to the amounts and classification of assets and
liabilities that may be necessary should the Company be unable to continue
as a going concern.
We
believe our cash position as of September 30, 2010 of $3.0 million, current
restricted cash held in escrow of $11.7 million, cash flows generated from our
net accounts receivable balance of $2.3 million and expected cash flows from
revenue orders may not be sufficient to fund operations for the next four
calendar quarters. We anticipate that additional cash will be needed
to fund operations beyond March 2011, absent a large cash deposit for a future
order, and to the extent required, the Company intends to continue the practice
of issuing stock, debt or other financial instruments for cash or for payment of
services until our cash flows from the sales of our primary products are
sufficient to provide cash from operations or if we believe such a financing
event would be a sound business strategy.
55
DISCONTINUED
OPERATIONS AND SALE OF DEWIND
On
September 4, 2009, our DeWind subsidiary sold substantially all of its existing
operating assets including all inventories, receivables, fixed assets, wind farm
project assets and intangible assets including all intellectual property and
transferred substantially all operating liabilities including supply chain and
operating expense accounts payables and accrued liabilities, warranty related
liabilities for U.S. turbine installations, and deferred
revenues. All of the remaining assets and liabilities of DeWind have
been classified as net assets/liabilities of discontinued
operations. All operations of our former DeWind segment have been
reported as discontinued operations. See discussion at Note 2,
including the accounting policies applicable to our discontinued
operations.
REVENUE
RECOGNITION
Revenues
are recognized based on guidance provided by the Securities and Exchange
Commission (SEC). Accordingly, our general revenue recognition policy is to
recognize revenue when there is persuasive evidence of an arrangement, the sales
price is fixed or determinable, collection of the related receivable is
reasonably assured, and delivery has occurred or services have been
rendered. Revenues recorded are shown net of any sales discounts or
similar sales incentives provided to our customers.
The
Company derives, or seeks to derive revenues from product revenue sales of
composite core, stranded composite core, core and stranded core hardware, and
other electric utility related products.
In
addition to the above general revenue recognition principles prescribed by the
SEC, our specific revenue recognition policies for each revenue source are as
follows:
PRODUCT
REVENUES. Product revenues are recognized when product shipment has been made
and title has passed to the end user customer. Product revenues consist
primarily of revenue from the sale of: (i) stranded composite core and related
hardware to utilities either sold directly by the Company or through a
distribution agreement, and (ii) composite core and related hardware sold to a
cable stranding entity. Revenues are deferred for product contracts where the
Company is required to perform installation services until after the
installation is complete. Our distribution agreements are structured so that our
revenue cycle is complete upon shipment and title transfer of products to the
distributor with no right of return.
CTC Cable
sales in each of the three years ended September 30, 2010 consisted of stranded
ACCC®
conductor and ACCC® hardware
sold to end-user utilities and sales of ACCC® core and
ACCC® hardware
to our stranding manufacturers. All ACCC® product
related sales were recognized upon delivery of product and transfer of
title. For ACCC®
conductor product sales made directly by us and not through a manufacturer or
distributor, through a third-party insurance company, we provide the option to
purchase an extended warranty for periods up to five, seven or ten years. We
allocate a portion of sales proceeds to the estimated fair value of the cost to
provide such a warranty. To date, most of our ACCC® related
product sales have been without extended warranty
coverage. Additionally, all ACCC®
conductor is sold to our end-user customers with a standard three-year product
warranty. The Company purchases a three-year term product warranty liability
insurance policy for all ACCC®
conductor sold directly by the Company to mitigate any product warranty
liability risk. Revenues from ACCC®
conductor sold directly to end-user customers are recorded net of the cost of
the three-year term insurance policy.
CONSULTING
REVENUE. Consulting revenues are generally recognized as the consulting services
are provided. We have entered into service contract agreements with electric
utility and utility services companies that generally require us to provide
engineering or design services, often in conjunction with current or future
product sales. In return, we receive engineering service fees payable in
cash. In each of the three years ended September 30, 2010, we
recognized no consulting revenues.
Currently,
multiple element contracts where there is no vendor specific objective evidence
(VSOE) or third-party evidence (TPE) that would allow the allocation of an
arrangement fee amongst various pieces of a multi-element contract, fees
received in advance of services provided are recorded as deferred revenues until
additional operational experience or other VSOE or TPE becomes available, or
until the contract is completed.
WARRANTY
PROVISIONS
Warranty
provisions consist of the insured costs and liabilities associated with any
post-sales associated with our ACCC®
conductor and related hardware parts. Warranties related to our
ACCC® products
relate to conductor and hardware sold directly by us to the end-user
customer. We mitigate our loss exposure through the use of
third-party warranty insurance. Warranty related liabilities for time
periods in excess of one year are classified as non-current
liabilities.
56
Our
ACCC®
conductor is sold to our end-user customers with a standard three-year product
warranty. The Company purchases a three-year term product warranty liability
insurance policy for all ACCC®
conductor sold directly by the Company to mitigate any product warranty
liability risk. All customers have the option to extend this warranty
for to up to ten years upon customer payment of additional insurance
premiums. The insurance policy covers materials costs and labor costs
to replace the ACCC®
conductor in the event of a product warranty claim caused by a product
defect. As such, the purchase of the initial three-year insurance
policy covers significantly all product warranty liability for which the Company
may be exposed under its standard three-year product warranty. To
date, the Company has had no product warranty claims.
USE
OF ESTIMATES
The
preparation of our financial statements conform with US GAAP, which requires
management to make estimates and judgments in applying our accounting policies
that have an important impact on our reported amounts of assets, liabilities,
revenue, expenses and related disclosures at the date of our financial
statements. On an on-going basis, management evaluates its estimates including
those related to accounts receivable, inventories, share-based compensation,
warranty provisions and goodwill and intangibles, as applicable. Management
bases its estimates and judgments on historical experience and on various other
factors that are believed to be reasonable under the circumstances, the results
of which form the basis for making judgments about the carrying values of assets
and liabilities that are not readily apparent from other sources. Actual results
may differ from management’s estimates. We believe that the application of our
accounting policies requires significant judgments and estimates on the part of
management. We believe that the estimates, judgments and assumption upon which
we rely are reasonable, and based upon information available to us at the time
that these estimates, judgments and assumptions are made. These estimates,
judgments and assumptions can affect the reported amounts of assets and
liabilities as of the date of the financial statements as well as the reported
amounts of revenues and expenses during the period presented. To the extent
there are material differences between these estimates, judgments or assumptions
and actual results, our financial statements will be affected. In many cases,
the accounting treatment of a particular transaction is specifically dictated by
US GAAP and does not require management's judgment in its application. There are
also many areas in which management's judgment in selecting among available
alternatives would produce a materially different result.
Our key
estimates we use that rely upon management judgment include:
|
|
-
|
the estimates pertaining to the
likelihood of our accounts receivable collectability. These estimates
primarily rely upon past payment history for each customer and
management’s judgment on the likelihood of future payments based on the
current business condition of each customer and the general business
environment.
|
|
|
-
|
the estimates pertaining to the
valuation of our inventories. These estimates primarily rely upon the
current order book for each product in inventory along with management’s
expectations and visibility into future sales of each product in
inventory.
|
|
|
-
|
the assumptions used to calculate
fair value of our share-based compensation and derivative liabilities,
primarily the volatility component of the Black-Scholes-Merton
(Black-Scholes) option-pricing model used to value our warrants and our
employee and non-employee options. This estimate relies upon the past
volatility of our share price over time as well as the estimate of the
option life.
|
|
|
-
|
the estimates and assumptions
used to determine the settlement of certain accounts related to
the sale of the DeWind assets for which a final accounting has not
been completed and which may result in the increase or decrease of asset
reserves or increase or decrease of accrued liabilities, principally
penalty payments, interest, and other costs associated with the turbine
parts suppliers for DeWind turbine parts. See related discussion at Note
2.
|
DERIVATIVE
FINANCIAL INSTRUMENTS
The
Company issues financial instruments in the form of stock options and stock
warrants, and debt conversion features as part of its convertible debt
issuances. The Company has not issued any derivative instruments for hedging
purposes since its inception. The Company uses the specific guidance and
disclosure requirements provided in US GAAP. Generally, freestanding derivative
contracts where settlement is required by physical share settlement or where the
Company has a choice of share or net cash settlement are accounted for as
equity. Contracts where settlement is in cash or in net share settlement; or
where the counterparty may choose cash settlement are accounted for as a
liability. Under current US GAAP, certain of our warrants are subject to
liability accounting treatment (see discussion below under “Derivative
Liabilities”), while our stock options are considered indexed to the Company’s
stock and are accounted for as equity.
The
values of the financial instruments are estimated using the Black-Scholes
option-pricing model. Key assumptions used to value options and warrants
granted, issued or repriced are as follows:
|
Years Ended
September 30,
|
||||||||||||
|
2010
|
2009
|
2008
|
||||||||||
|
Risk
Free Rate of Return
|
0.82%-2.60 | % | 0.50%-2.69 | % | 1.61%-4.29 | % | ||||||
|
Volatility
|
95%-108 | % | 75%-116 | % | 66%-88 | % | ||||||
|
Dividend
Yield
|
0 | % | 0 | % | 0 | % | ||||||
|
Expected
Life
|
2-5
yrs
|
.5-5
yrs
|
.3-5
yrs
|
|||||||||
57
Derivative
Liabilities and Change in Accounting Principle
Currently,
our derivative liabilities include fair value based warrant liabilities pursuant
to US GAAP applied to the terms of the underlying agreements. The Company has
issued warrants to purchase common shares of the Company as additional incentive
for investors who purchase unregistered, restricted common stock, certain debt
obligations or convertible debentures. The fair value of certain warrants issued
and debt conversion features in conjunction with financing events are recorded
as a discount for debt issuances. Certain warrant agreements and debt conversion
arrangements include provisions that require us to record them as a liability,
at fair value, pursuant to Financial Accounting Standards Board (FASB)
accounting rules, including certain provisions designed to protect a holder’s
position from being diluted. The derivative liabilities are marked-to-market
each reporting period and changes in fair value are recorded as a non-operating
gain or loss in our consolidated statements of operations, until they are
completely settled or expire. The fair value of the warrants and debt conversion
features are determined each reporting period using the Black-Scholes valuation
model, using inputs and assumptions consistent with those used in our estimate
of fair value of employee stock options, except that the remaining contractual
life is used. Such fair value is affected by changes in inputs to
that model including our stock price, expected stock price volatility, interest
rates and expected term.
Refer to
“Fair Value Measurements” in Note 1 for additional derivative liabilities
disclosures.
For the
year ended September 30, 2010 we recognized a gain of $1,767,000 related to the
revaluation of our derivative liabilities. The 2010 revaluation gain
resulted mainly from the decrease in our stock price from the prior year and
from expired arrangements during the year.
In
connection with the warrants issued to investors as discussed above, the Company
has issued warrants to compensate for financing fees and other service fees
incurred. Such compensatory warrants are recorded at fair value in
the same manner as non-compensatory warrants, however, the recognized expense is
offset to additional paid-in-capital. Such warrants are considered
equity transactions in accordance with US GAAP. Additionally,
warrants issued without anti-dilution provisions are generally considered equity
transactions in accordance with US GAAP. All of our outstanding warrants
including those subject to liability accounting treatment are further discussed
in Note 10.
Change
in Accounting Principle
Prior to
fiscal 2010, the Company accounted for all warrants issued in conjunction with
financing events as equity in accordance with existing US GAAP.
On
October 1, 2009, the Company adopted new FASB rules related to determining
whether an instrument (or embedded feature) is indexed to an entity’s own
stock. Current accounting for derivatives and hedging activities
specifies that a contract that would otherwise meet the definition of a
derivative, but is both (a) indexed to the Company’s own stock and (b)
classified in shareholders’ equity, would not be considered a derivative
financial instrument. The new rules provide a two-step model to be
applied in determining whether a financial instrument or an embedded feature is
indexed to an issuer’s own stock and thus able to qualify for the existing scope
exception. In accordance with the new rules, management evaluated
outstanding instruments as of October 1, 2009 and determined all warrants and
debt conversion arrangements with anti-dilution provisions issued in conjunction
with financing events, that are not considered compensatory, are not indexed to
our stock and therefore are to be recorded as liabilities at fair value and
marked-to-market through earnings. Accordingly, as of October 1,
2009, we have adjusted the opening balance of accumulated deficit to effect this
change in accounting principle as follows:
|
(In Thousands)
|
October 1, 2009
|
|||
|
Accumulated
Deficit
|
$ | (266,874 | ) | |
|
Cumulative
Effect of the Change (A)
|
9,111 | |||
|
Accumulated
Deficit, as adjusted
|
$ | (257,763 | ) | |
|
|
(A)
|
The cumulative effect of the
change to our Accumulated Deficit was derived from recognizing
mark-to-market fair value revaluation adjustments to the applicable
warrants and debt conversion features from the original issuance dates
through October 1, 2009, in the net gain amount of
$19,284,000. Additionally, the cumulative effect includes
recognition of interest expense from amortization of the debt discount
recorded from the initial valuation of the debt conversion features
through October 1, 2009, in the amount of
$10,173,000.
|
Additionally,
on October 1, 2009, the opening balance of Additional Paid-in Capital includes a
reclassification adjustment to Derivative Liabilities in the amount of
$10,514,000, which represents the aggregate original warrant fair value
previously recorded to equity.
Refer to
“Fair Value Measurements” in Note 1 for additional derivative liabilities
disclosures.
58
Share-Based
Compensation
US GAAP
requires that compensation cost relating to share-based payment arrangements be
recognized in the financial statements. US GAAP requires measurement of
compensation cost for all share-based awards at fair value on date of grant and
recognition of compensation over the service period for awards expected to vest.
The fair value of stock options is determined using the Black-Scholes valuation
model. Such fair value is recognized as expense over the service period, net of
estimated forfeitures.
US GAAP
requires that equity instruments issued to non-employees in exchange for
services be valued at the more accurate of the fair value of the services
provided, or the fair value of the equity instruments issued. For equity
instruments issued that are subject to a required service period, the expense
associated with the equity instruments is recorded as the instruments vest or
the services are provided. The Company has granted options and warrants to
non-employees and recorded the fair value of these equity instruments on the
date of issuance using the Black-Scholes valuation model, for options and
warrants not subject to vesting terms. For non-employee option and warrant
grants subject to vesting terms, vested shares are recorded at fair value using
the Black-Scholes valuation model and the associated expense is recorded
simultaneously or as the services are provided. The Company has granted stock to
non-employees for services and values the stock at the more reliable of the
market value on the date of issuance or the value of the services provided. For
issued grants subject to vesting or service requirements, expenses are deferred
and recognized over the more appropriate of the vesting period, or as services
are provided.
SEC
guidance requires share-based compensation to be classified in the same expense
line items as cash compensation. Additionally, the SEC issued guidance regarding
the use of a "simplified" method in developing an estimate of expected term of
"plain vanilla" share options in accordance with US GAAP rules. The Staff
indicated that it will accept a company's election to use the simplified method,
regardless of whether the company has sufficient information to make more
refined estimates of expected term. The Staff believed that more detailed
external information about employee exercise behavior (e.g., employee exercise
patterns by industry and/or other categories of companies) would, over time,
become readily available to companies; however, the Staff continues to accept,
under certain circumstances, the use of the simplified method. The Company
currently uses the simplified method for the expected term in “plain vanilla”
share options and warrants.
Additional
information about share-based compensation is disclosed in Note 11.
Convertible
Debt
Convertible
debt is accounted for under specific guidelines established in US GAAP. The Company records a
beneficial conversion feature (BCF) related to the issuance of convertible
debt that have conversion features at fixed or adjustable rates that are
in-the-money when issued and records the fair value of warrants issued with
those instruments. The BCF for the convertible instruments is recognized and
measured by allocating a portion of the proceeds to warrants and as a reduction
to the carrying amount of the convertible instrument equal to the intrinsic
value of the conversion features, both of which are credited to paid-in-capital
or liabilities as appropriate. The Company calculates the fair value of warrants
issued with the convertible instruments using the Black-Scholes valuation
method, using the same assumptions used for valuing employee options, except
that the contractual life of the warrant is used. Upon each issuance, the
Company evaluates the variable conversion features and determines the
appropriate accounting treatment as either equity or liability, in accordance
with US GAAP. The Company first allocates the value of the proceeds
received to the convertible instrument and any other detachable instruments
(such as detachable warrants) on a relative fair value basis and then determines
the amount of any BCF based on effective conversion price to measure the
intrinsic value, if any, of the embedded conversion option. Using the effective
yield method, the allocated fair value is recorded as a debt discount or premium
and is amortized over the expected term of the convertible debt to interest
expense. For a conversion price change of a convertible debt issue, the
additional intrinsic value of the debt conversion feature, calculated as the
number of additional shares issuable due to a conversion price change multiplied
by the previous conversion price, is recorded as additional debt discount and
amortized over the remaining life of the debt. As of September 30,
2010 we had no convertible debt outstanding.
US GAAP
rules specify that a contingent obligation to make future payments or otherwise
transfer consideration under a registration payment arrangement, whether issued
as a separate agreement or included as a provision of a financial instrument or
other agreement, should be separately recognized and measured in accordance with
US GAAP contingency rules. The contingent obligation to make future payments or
otherwise transfer consideration under a registration payment arrangement should
be separately recognized and measured in accordance with said rules, pursuant to
which a contingent obligation must be accrued only if it is more likely than not
to occur. Historically, the Company has not been required to accrue any
contingent liabilities in this regard.
CASH
AND CASH EQUIVALENTS
For the
purpose of the statements of cash flows, the Company considers all highly liquid
investments purchased with original maturities of three months or less to be
cash equivalents.
59
RESTRICTED
CASH
The
Company considers cash to be restricted cash if it is cash on deposit under
control of the Company that secures standby letters of credit and other payment
guarantees for certain vendors, as well as cash held in jointly controlled
escrow accounts. As of September 30, 2010 and September 30, 2009, restricted
cash consisted of cash held in escrow in connection with the sale of DeWind as
discussed in Note 2, amounting to $16,356,000 and $17,175,000,
respectively. In July 2010, the Company received $836,000 of the escrowed
cash (see Note 2). During the year ended September 30, 2010, we
reported an additional $17,000 from interest income, in accordance with the
escrow agreement.
ACCOUNTS
RECEIVABLE
The
Company has trade accounts receivable from cable customers. Cable customer
receivables are typically on net 30 day terms. Balances due greater than one
year from the balance sheet date are reclassified to long term assets, as
applicable. Collateral is generally not required for credit extended to
customers. Credit losses are provided for in the financial statements based on
management's evaluation of historical and current industry trends as well as
history with individual customers. Additions to the provision for bad debts are
included in General and Administrative expense on our Consolidated Statements of
Operations; charge-offs of uncollectible accounts are made against existing
provisions or direct to expense as appropriate. Although the Company
expects to collect amounts due, actual collections may differ from estimated
amounts.
CONCENTRATIONS
OF CREDIT RISK
Financial
instruments which potentially subject the Company to concentrations of credit
risk consist of cash and cash equivalents. The Company places its cash and cash
equivalents with high credit, quality financial institutions. At times, such
cash and cash equivalents may be in excess of the Federal Deposit Insurance
Corporation (FDIC) insurance limit (currently at $250,000 per depositor, per
insured bank, for each account ownership category). All cash and cash
equivalents are FDIC insured, with the exception of the foreign bank accounts.
The Company has not experienced any losses in such accounts and believes it is
not exposed to any significant credit risk on cash and cash
equivalents.
The
Company had four customers representing 83% of the gross receivable balance and
two customers representing 85% of the gross receivable balance as of September
30, 2010 and 2009, respectively. The Company and its wholly owned subsidiaries
maintain allowances for doubtful accounts for estimated losses resulting from
the inability of its customers to make required payments. If the financial
condition of the Company’s customers were to deteriorate, resulting in an
impairment of their ability to make payments, additional allowances may be
required. Management reviews delinquent accounts at least quarterly, to identify
potential doubtful accounts, and together with customer follow-up estimates the
amounts of potential losses.
For the
year ended September 30, 2010, six customers represented 82% of
revenue. For the year ended September 30, 2009, three customers
represented 78% of revenue. For the year ended September 30, 2008,
two customers represented 96% of revenue.
INVENTORIES
Inventories
consist of our wrapped and unwrapped manufactured composite core and related
hardware products and raw materials used in the production of those products.
Inventories are valued at the lower of cost or market under the FIFO method.
Cable products manufactured internally are valued at standard cost which
approximates replacement cost. Payments made to third party vendors
in advance of material deliveries are reported as a separate balance sheet line
item, as applicable. Costs for product sold are recorded to cost of
goods sold as the expenses are incurred.
PROPERTY
AND EQUIPMENT
Property
is stated at the lower of cost or realizable value, net of accumulated
depreciation. Additions and improvements to property and equipment are
capitalized at cost. Designated project costs are capitalized to
construction-in-progress as incurred. Depreciation of production equipment is
computed using the units-of-production method based on estimated useful lives of
specific production machinery and equipment and the related units estimated to
be produced over a period of ten years. Depreciation for all other assets is
computed using the straight-line method based on estimated useful lives of the
assets which range from three to ten years. Leasehold improvements and leased
assets are amortized or depreciated over the lesser of estimated useful lives or
lease terms, as appropriate. Property is periodically reviewed for impairment
whenever events or changes in circumstances indicate that the carrying amount of
an asset may not be recoverable. Expenditures for maintenance and repairs are
charged to operations as incurred while renewals and betterments are
capitalized. Gains or losses on the sale of property and equipment are reflected
in the statements of operations.
60
Change
in Accounting Estimate
Effective
on October 1, 2009, the Company changed its method of depreciation for
production machinery and equipment from the straight-line method to the
units-of-production method as described above. This change in depreciation
method resulted from the use of new internally developed cost-effective machines
that provided improved production rates, provided longer service lives and
substantially increased production capacity. The new production
machines actual pattern of consumption of the expected benefits is significantly
less than straight-lining over time, therefore the units-of-production method
was preferable and appropriate. In accordance with US GAAP, the
Company accounted for this change in accounting estimate prospectively beginning
October 1, 2009. For the year ended September 30, 2010, the change in our method
of depreciating production machinery and equipment resulted in lowering
depreciation expense (included in Cost of Revenue), Net Loss from Continuing
Operations and Net Loss by $184,000. For the year ended September 30, 2010,
basic and diluted earnings per share from continuing operations and net loss
were not affected. See Note 5 for additional information.
IMPAIRMENT
OF LONG-LIVED ASSETS
Management
evaluates long-lived assets for impairment whenever events or changes in
circumstances indicate that the carrying value of an asset may not be
recoverable. If the estimated future cash flow (undiscounted and without
interest charges) from the use of an asset are less than the carrying value, an
impairment would be recorded to reduce the related asset to its estimated fair
value.
We did
not recognize any impairment charges in the years ended September 30, 2010, 2009
or 2008, except during fiscal 2009 for certain charges reported as discontinued
operations in connection with the sale of DeWind (see Note 2).
FAIR
VALUE MEASUREMENTS
Fair
value is defined as the price that would be received to sell an asset, or paid
to transfer a liability, in an orderly transaction between market participants
at the measurement date. Assets and liabilities recorded at fair value in the
consolidated balance sheets are categorized based upon the level of judgment
associated with the inputs used to measure their fair value. The fair value
hierarchy distinguishes between (1) market participant assumptions
developed based on market data obtained from independent sources (observable
inputs) and (2) an entity’s own assumptions about market participant
assumptions developed based on the best information available in the
circumstances (unobservable inputs). The fair value hierarchy consists of three
broad levels, which gives the highest priority to unadjusted quoted prices in
active markets for identical assets or liabilities (Level 1) and the lowest
priority to unobservable inputs (Level 3). The three levels of the fair value
hierarchy are described as follows:
Level 1
- Quoted prices in active markets for identical assets or liabilities, and
identical liabilities when traded as an asset in an active market when no
adjustments to the quoted price of the asset are required.
Level 2
- Inputs other than Level 1 that are observable, either directly or
indirectly, such as quoted prices for similar assets or liabilities; quoted
prices in markets that are not active; or other inputs that are observable or
can be corroborated by observable market data for substantially the full term of
the assets or liabilities.
Level 3
- Unobservable inputs that are supported by little or no market activity and
that are significant to the fair value of the assets or
liabilities. Inputs are based on management’s best estimate of what
market participants would use in pricing the asset or liability at the
measurement date.
As of
September 30, 2010, the Company held certain assets and liabilities that are
required to be measured at fair value on a recurring basis. The fair value
of these assets and liabilities was determined using the following
inputs:
|
(In Thousands)
|
||||||||||||||||
|
Description
|
Total
|
Level 1
|
Level 2
|
Level 3
|
||||||||||||
|
Cash
deposits (1)
|
$ | 66 | $ | 66 | $ | — | $ | — | ||||||||
|
Restricted
cash (Note 2)
|
16,356 | 16,356 | — | — | ||||||||||||
|
Total
assets
|
$ | 16,422 | $ | 16,422 | $ | — | $ | — | ||||||||
|
Derivative
liabilities
|
$ | 1,297 | $ | — | $ | — | $ | 1,297 | ||||||||
|
|
(1)
|
Short-term certificates of
deposit and money market accounts included in cash and cash equivalents in
our consolidated balance
sheet.
|
During
the year ended September 30, 2010, there were no transfers into or out of Levels
1 and 2. Financial instruments classified as Level 3 in the fair
value hierarchy as of September 30, 2010 include derivative liabilities
resulting from recent financing transactions. In accordance with
current accounting rules, the derivative liabilities are being marked-to-market
each quarter-end until they are completely settled or expire. The derivative
liabilities are valued using the Black-Scholes valuation model, using both
observable and unobservable inputs and assumptions consistent with those used in
our estimate of fair value of employee stock options. See “Derivative
Liabilities” in Note 1.
61
The
following table summarizes our fair value measurements using significant Level 3
inputs, and changes therein, for the year ended September 30, 2010:
|
(In Thousands)
|
Level 3
Derivative Liabilities
|
|||
|
Balance
as of October 1, 2009
|
$ | 1,570 | ||
|
Transfers
into/out of Level 3
|
— | |||
|
Initial
valuation of derivative liabilities (1)
|
1,494 | |||
|
Change
in fair value of derivative liabilities - expired
|
(221 | ) | ||
|
Change
in fair value of derivative liabilities - held
|
(1,546 | ) | ||
|
Balance
as of September 30, 2010
|
$ | 1,297 | ||
|
(1)
|
During
the year ended September 30, 2010, we issued warrants in connection with a
debt financing transaction, which are subject to derivative liability
accounting (see Note 10 “Warrants” for additional
information).
|
At
September 30, 2009, the Company held no Level 2 or 3 assets or
liabilities. At September 30, 2010 and 2009, the Company held no
assets or liabilities that are measured at fair value on a non-recurring
basis.
FAIR
VALUE INFORMATION ABOUT FINANCIAL INSTRUMENTS
US GAAP
regarding fair value disclosures of financial instruments requires disclosure of
fair value information about certain financial instruments for which it is
practical to estimate that value. The carrying amounts reported in our balance
sheet for cash, cash equivalents, restricted cash, accounts receivable and
accounts payable approximate fair value due to the short maturity of these
financial instruments. The carrying amounts reported for debt obligations
approximate fair value due to the effective interest rate of these obligations
reflecting the Company’s current borrowing rate. Derivative liabilities are
reported at fair value as discussed above. Considerable judgment is required to
develop such estimates of fair value. Accordingly, such estimates would not
necessarily be indicative of the amounts that could be realized in a current
market exchange. The use of different market assumptions and/or estimation
methodologies may have a material effect on the estimated fair
value.
FOREIGN
CURRENCY TRANSLATION
The
Company’s primary functional currency is the U.S. dollar. Assets and liabilities
of the Company denominated in foreign currencies are translated at the rate of
exchange on the balance sheet date. Revenues and expenses are translated using
the average exchange rate for the period.
COMPREHENSIVE
LOSS
Comprehensive
loss includes all changes in shareholders’ equity (deficit) except those
resulting from investments by, and distributions to, shareholders. Accordingly,
the Company’s Consolidated Statements of Comprehensive Loss include net loss and
foreign currency translation adjustments that arise from the translation of
foreign currency financial statements into U.S. dollars. For the
years ended September 30, 2010, 2009 and 2008, we reported Other Comprehensive
Income (Loss) from continuing operations of $1,000, $(70,000) and $574,000,
respectively.
In
connection with the sale of DeWind and resulting discontinued operations (see
Note 2), our Consolidated Statement of Operations and Comprehensive Loss for the
year ended September 30, 2009 included a reclassification adjustment of the
accumulated foreign currency translation adjustment losses for DeWind through
September 4, 2009 (date of sale), in the amount of $361,000, to recognize the
accumulated adjustments as a component of the loss from discontinued operations
within net loss. Since inception, other comprehensive income (loss) had been
derived from DeWind foreign currency translation adjustments. For the
year ended September 30, 2010, other comprehensive income in the amount of
$2,354,000, derived from DeWind foreign currency translation adjustments, has
been recognized and included as a component of the Income (Loss) from
Discontinued Operations within Net Loss.
RESEARCH
AND DEVELOPMENT EXPENSES
Research
and development expenses are charged to operations as incurred.
62
START-UP
COSTS
US GAAP
defines start-up activities as one-time activities an entity undertakes when it
opens a new facility, introduces a new product or service, conducts business in
a new territory, or with a new class of customer or beneficiary, initiates a new
process in an existing facility or commences some new
operation. Start-up activities include activities related to
organizing a new entity (i.e. organization costs), which include initial
incorporation and professional fees in connection with establishing the new
entity. In accordance with US GAAP, we expense all start-up
activities as incurred.
During
the years ended September 30, 2010 and 2009, we recorded start-up expenses in
the approximate amount of $169,000 and $160,000, respectively, which are
included in general and administrative expenses. Our start-up
activities related to professional fees for organization costs incurred. No
start-up expenses were incurred during fiscal 2008.
DEFINED
CONTRIBUTION PLAN
The
Company maintains a 401(k) plan covering substantially all of its employees who
are at least 21 years old with 1,000 hours of service. Such
employees are eligible to contribute a percentage of their annual eligible
compensation and receive discretionary Company matching
contributions. Discretionary Company matching contributions are
determined by the Board of Directors and may be in the form of cash or Company
stock. To date, the Company has not made any matching contributions
in either cash or Company stock. There were no changes to the 401(k) plan during
the year ended September 30, 2010.
INCOME
TAXES
The
Company accounts for income taxes under the liability method, which requires the
recognition of deferred tax assets and liabilities for the expected future tax
consequences of events that have been included in the financial statements or
tax returns. Under this method, deferred income taxes are recognized for the tax
consequences in future years of differences between the tax bases of assets and
liabilities and their financial reporting amounts at each period end based on
enacted tax laws and statutory tax rates applicable to the periods in which the
differences are expected to affect taxable income. Valuation allowances are
established, when necessary, to reduce deferred tax assets to the amount
expected to be realized.
As of
September 30, 2010, 2009, and 2008, the deferred tax assets related primarily to
the Company's net operating loss carry-forwards are fully reserved. Due to the
provisions of Internal Revenue Code Section 382, the Company may not have any
net operating loss carry-forwards available to offset financial statement or tax
return taxable income in future periods as a result of a change in control
involving 50 percentage points or more of the issued and outstanding securities
of the Company.
The
Company will recognize the impact of uncertain tax positions in the consolidated
financial statements if that position is more likely than not of being sustained
on audit, based on the technical merits of the position. To date, we
have not recorded any uncertain tax positions.
The
Company recognizes potential accrued interest and penalties related to uncertain
tax positions in income tax expense, as appropriate. During the years ended
September 30, 2010, 2009 and 2008, the Company did not recognize any amount of
income tax expense from potential interest and penalties associated with
uncertain tax positions.
The
Company files consolidated tax returns in the United States Federal
jurisdiction, in California and Texas, as well as foreign jurisdictions
including Germany, the United Kingdom and for fiscal 2010 in China. The Company
is no longer subject to U.S. Federal income tax examinations for fiscal years
before 2007, is no longer subject to state and local income tax examinations by
tax authorities for fiscal years before 2006, and is no longer subject to
foreign examinations before 2001.
During
fiscal 2008, the Company’s federal returns were selected for examination by the
Internal Revenue Service (IRS) for prior fiscals years ended September 30, 2001
through 2005, all years in which net losses were reported and filed. The
examination has been completed. During the quarter ended December 31,
2009, the IRS proposed certain preliminary adjustments related to payroll tax
returns filed during the period under audit. No adjustments were proposed in
connection with our previously filed federal income tax
returns. Based on the preliminary IRS findings, the Company recorded
a payroll tax liability in the amount of $1,008,000, which was allocated to
General and Administrative Expense ($560,000), Interest Expense ($277,000) and
Other Expense from penalties ($171,000), during the three months ended December
31, 2009. During the quarter ended June 30, 2010, the Company received a
final determination of adjustment from the IRS. Accordingly, the Company has
begun making payments relating to the assessment arising from the 2001 through
2005 payroll tax audits, which have totaled $329,000 to date. During
the fourth quarter ended September 30, 2010, the IRS provided final adjustments
to interest and penalties and a final payment schedule, which resulted in a
reduction of our payroll tax liability of $252,000. At September 30, 2010, the
remaining payroll tax liability was $427,000, included as a component of
Accounts Payable and Accrued Liabilities (see Note 6).
LOSS
PER SHARE
Basic
loss per share is computed by dividing loss available to common shareholders by
the weighted-average number of common shares outstanding. Diluted loss per share
is computed similar to basic loss per share except that the denominator is
increased to include the number of additional common shares that would have been
outstanding if the potential common shares had been issued and if the additional
common shares were dilutive. Common equivalent shares are excluded from the
computation if their effect is anti-dilutive.
63
The
following common stock equivalents were excluded from the calculation of diluted
loss per share for the years ended September 30, 2010, 2009, and 2008 since
their effect would have been anti-dilutive (assumes all outstanding options and
warrants are in-the-money):
|
September 30,
|
||||||||||||
|
2010
|
2009
|
2008
|
||||||||||
|
Options
for common stock
|
29,916,600 | 25,900,964 | 25,130,521 | |||||||||
|
Warrants
for common stock
|
18,200,000 | 22,934,649 | 26,150,817 | |||||||||
|
Convertible
Debentures, if converted
|
— | 9,128,566 | 9,037,280 | |||||||||
| 48,116,600 | 57,964,179 | 60,318,618 | ||||||||||
RECLASSIFICATIONS
Certain
prior year balances have been reclassified to conform to the current year
presentation. Additionally, as discussed in Note 2, we have classified all
operations of our former DeWind segment as discontinued operations.
RECENT
ACCOUNTING PROUNOUNCEMENTS
In June
2009, the FASB issued new rules related to accounting for transfers of financial
assets. These new rules were incorporated into the Accounting Standards
Codification in December 2009 as discussed in FASB Accounting Standards Update
(ASU) No. 2009-16, Transfers
and Servicing (Topic 860): Accounting for Transfers of Financial Assets.
The new rules amend various provisions related to accounting for transfers and
servicing of financial assets and extinguishments of liabilities, by removing
the concept of a qualifying special-purpose entity and removes the exception
from applying FASB rules related to variable interest entities that are
qualifying special-purpose entities; limits the circumstances in which a
transferor derecognizes a portion or component of a financial asset; defines a
participating interest; requires a transferor to recognize and initially measure
at fair value all assets obtained and liabilities incurred as a result of a
transfer accounted for as a sale; and requires enhanced disclosure; among
others. The new rules become effective for the Company on October 1, 2010,
earlier application is prohibited. The adoption of this standard is not expected
to have a material impact on our consolidated financial statements.
In June
2009, the FASB issued new rules to amend certain accounting for variable
interest entities (VIE). These new rules were incorporated into the
Accounting Standards Codification in December 2009 as discussed in FASB ASU No.
2009-17, Consolidation (Topic
810): Improvements to Financial Reporting by Enterprises Involved with Variable
Interest Entities. The new rules require an enterprise to perform an
analysis to determine whether the enterprise’s variable interest or interests
give it a controlling financial interest in a VIE; to require ongoing
reassessments of whether an enterprise is the primary beneficiary of a VIE; to
eliminate the quantitative approach previously required for determining the
primary beneficiary of a VIE; to add an additional reconsideration event for
determining whether an entity is a VIE when any changes in facts and
circumstances occur such that holders of the equity investment at risk, as a
group, lose the power from voting rights or similar rights of those investments
to direct the activities of the entity that most significantly impact the
entity’s economic performance; and to require enhanced disclosures that will
provide users of financial statements with more transparent information about an
enterprise’s involvement in a VIE. The new rules become effective for the
Company on October 1, 2010, earlier application is
prohibited. The adoption of this standard is not expected to have a
material impact on our consolidated financial statements.
In
October 2009, the FASB issued ASU No. 2009-13, Revenue Recognition (Topic 605):
Multiple-Deliverable Revenue Arrangements—a consensus of the FASB Emerging
Issues Task Force (ASU 2009-13). ASU 2009-13 amends accounting
for revenue arrangements with multiple deliverables, to eliminate the
requirement that all undelivered elements have Vendor-Specific Objective
Evidence (VSOE) or Third-Party Evidence (TPE) before an entity can recognize the
portion of an overall arrangement fee that is attributable to items that already
have been delivered. In the absence of VSOE or TPE of the standalone selling
price for one or more delivered or undelivered elements in a multiple-element
arrangement, entities will be required to estimate the selling prices of those
elements. The overall arrangement fee will be allocated to each element (both
delivered and undelivered items) based on their relative selling prices,
regardless of whether those selling prices are evidenced by VSOE or TPE or are
based on the entity's estimated selling price. Application of the "residual
method" of allocating an overall arrangement fee between delivered and
undelivered elements will no longer be permitted upon adoption of ASU 2009-13.
Additionally, the new guidance will require entities to disclose more
information about their multiple-element revenue arrangements. ASU 2009-13 is
effective prospectively for revenue arrangements entered into or materially
modified in fiscal years beginning on or after June 15,
2010. Early adoption is permitted. If a vendor elects
early adoption and the period of adoption is not the beginning of the entity’s
fiscal year, the entity will be required to apply the amendments in this Update
retrospectively from the beginning of the entity’s fiscal
year. Additionally, vendors electing early adoption will be required
to disclose the following information at a minimum for all previously reported
interim periods in the fiscal year of adoption: revenue, income
before income taxes, net income, earnings per share and the effect of the change
for the appropriate captions presented. We expect to adopt this
standard on October 1, 2010 and are currently evaluating the impact this
standard will have on our consolidated financial statements.
64
In
January 2010, FASB issued ASU No. 2010-06, Fair Value Measurements and
Disclosures (Topic 820): Improving Disclosures About Fair
Value Measurements. The ASU requires new disclosures about transfers into
and out of Levels 1 and 2 and separate disclosures about purchases, sales,
issuances, and settlements relating to Level 3 measurements. It also clarifies
existing fair value disclosures about the level of disaggregation of disclosed
assets and liabilities, and about inputs and valuation techniques used to
measure fair value for both recurring and nonrecurring fair value measurements
that fall in either Level 2 or Level 3. The new disclosures and
clarifications of existing disclosures were effective, and adopted, during the
Company’s second quarter ended March 31, 2010, however the disclosures about
purchases, sales, issuances, and settlements in the roll forward of activity in
Level 3 measurements, will be effective for the Company’s first quarter ending
December 31, 2011. Other than requiring additional disclosures, the full
adoption of this new guidance will not have an impact on our consolidated
financial statements.
Significant
recent accounting policies adopted or implemented during the year ended
September 30, 2010
On
October 1, 2009, we adopted a new FASB rule that revises existing business
combination rules. The new rule requires most identifiable assets,
liabilities, non-controlling interests, and goodwill acquired in a business
combination to be recorded at “full fair value.” The new rule applies to all
business combinations, including combinations among mutual entities and
combinations by contract alone. Additionally, all business combinations will be
accounted for by applying the acquisition method. The new rule was effective for
business combinations for which the acquisition date is on or after the
beginning of the first annual reporting period beginning on or after
December 15, 2008. The adoption of this standard did not have an impact on
our consolidated financial statements.
On
October 1, 2009, we adopted new FASB rules related to accounting for assets
acquired and liabilities assumed in a business combination that arise from
contingencies. The new rules apply to all assets acquired and liabilities
assumed in a business combination that arise from certain contingencies as
defined by the FASB and requires (i) an acquirer to recognize at fair
value, at the acquisition date, an asset acquired or liability assumed in a
business combination that arises from a contingency if the acquisition-date fair
value of that asset or liability can be determined during the measurement
period, otherwise the asset or liability should be recognized at the acquisition
date if certain defined criteria are met; (ii) contingent consideration
arrangements of an acquiree assumed by the acquirer in a business combination be
recognized initially at fair value; (iii) subsequent measurements of assets
and liabilities arising from contingencies be based on a systematic and rational
method depending on their nature and contingent consideration arrangements be
measured subsequently; and (iv) disclosures of the amounts and measurement
basis of such assets and liabilities and the nature of the contingencies. The
new rules were effective for business combinations for which the acquisition
date is on or after the beginning of the first annual reporting period beginning
on or after December 15, 2008. The adoption of this standard did not have
an impact on our consolidated financial statements.
On
October 1, 2009, we adopted new FASB rules related to determining the useful
life of intangible assets. The new rules amend the factors that
should be considered in developing renewal or extension assumptions used to
determine the useful life of a recognized intangible asset under existing FASB
rules for goodwill and other intangible assets. This change is intended to
improve the consistency between the useful life of a recognized intangible asset
outside a business combination and the period of expected cash flows used to
measure the fair value of an intangible asset in a business
combination. The new rules were effective for the financial
statements issued for fiscal years beginning after December 15, 2008, and
interim periods within those fiscal years. The requirement for
determining useful lives must be applied prospectively to intangible assets
acquired after the effective date and the disclosure requirements must be
applied prospectively to all intangible recognized as of, and subsequent to, the
effective date. The adoption of this standard did not have an impact
on our consolidated financial statements.
On
October 1, 2009, we adopted a new FASB rule related to non-controlling interests
in consolidated financial statements. The new rule requires the ownership
interests in subsidiaries held by parties other than the parent to be treated as
a separate component of equity and be clearly identified, labeled, and presented
in the consolidated financial statements. The new rule was effective for fiscal
years beginning on or after December 15, 2008 and interim periods within
those fiscal years. Earlier adoption was prohibited. The adoption of this
standard did not have an impact on our consolidated financial
statements. On October 1, 2009, we also adopted related guidance,
FASB ASU No. 2010-2, Consolidation (Topic 810):
Accounting and Reporting for Decreases in Ownership of a Subsidiary – a Scope
Clarification , which amended certain provisions of the preceding new
guidance for non-controlling interests and changes in ownership interests of a
subsidiary, specifically related to an entity that experiences a decrease in
ownership in a subsidiary. The new guidance clarifies the scope of
the decrease in ownership provisions. The adoption of this standard
did not have an impact on our consolidated financial statements.
On
October 1, 2009, we adopted new FASB rules related to determining whether an
instrument (or embedded feature) is indexed to an entity’s own
stock. Existing accounting for derivatives and hedging activities,
specifies that a contract that would otherwise meet the definition of a
derivative but is both (a) indexed to the Company’s own stock and (b) classified
in shareholders’ equity in the statement of financial position would not be
considered a derivative financial instrument. The new rules provide a
new two-step model to be applied in determining whether a financial instrument
or an embedded feature is indexed to an issuer’s own stock and thus able to
qualify for the existing scope exception. The new rules were
effective for the first annual reporting period beginning after December 15,
2008, and early adoption is prohibited. The adoption of this new
standard caused a change in our accounting principles, as discussed above in
Note 1 “Derivative Liabilities and Change in Accounting
Principle”.
65
On
October 1, 2009, we adopted the FASB ASU No. 2009-5, Fair Value Measurements and
Disclosures (Topic 820)—Measuring Liabilities at Fair Value, which
changed the fair value accounting for liabilities. These changes clarify
existing guidance that in circumstances in which a quoted price in an active
market for the identical liability is not available, an entity is required to
measure fair value using either a valuation technique that uses a quoted price
of either a similar liability or a quoted price of an identical or similar
liability when traded as an asset, or another valuation technique that is
consistent with the principles of fair value measurements, such as an income
approach (e.g., present value technique) or a market approach. This guidance
also states that both a quoted price in an active market for the identical
liability and a quoted price for the identical liability when traded as an asset
in an active market when no adjustments to the quoted price of the asset are
required, are Level 1 fair value measurements. The adoption of this ASU did not
have an impact on our consolidated financial statements.
On
January 1, 2010, we adopted the FASB ASU No. 2010-06, Fair Value Measurements and
Disclosures (Topic 820): Improving Disclosures About Fair
Value Measurements, which currently requires new disclosures about
transfers into and out of Levels 1 and 2. It also clarifies existing fair value
disclosures about the level of disaggregation of disclosed assets and
liabilities, and about inputs and valuation techniques used to measure fair
value for both recurring and nonrecurring fair value measurements that fall in
either Level 2 or Level 3. Other than requiring additional disclosures,
the adoption of this new guidance did not have an impact on our consolidated
financial statements.
NOTE
2 – DISCONTINUED OPERATIONS AND SALE OF DEWIND
On
September 4, 2009, our DeWind subsidiary sold substantially all of its existing
operating assets including all inventories, receivables, fixed assets, wind farm
project assets and intangible assets including all intellectual property and
transferred substantially all operating liabilities including supply chain and
operating expense accounts payables and accrued liabilities, warranty related
liabilities for U.S. turbine installations and deferred revenues. All
of the remaining assets and liabilities of DeWind have been classified as net
assets or liabilities of discontinued operations. All operations of
our former DeWind segment have been reported as discontinued
operations.
In
August, 2009 the Company completed negotiations with Daewoo Shipbuilding and
Marine Engineering (DSME), and signed an Asset Purchase Agreement valued at
$49.5 million in cash. The transaction closed on September 4, 2009
and the Company received approximately $32.3 million in cash paid immediately
with $17.2 million in cash escrowed for the benefit of DSME to provide for
potential reimbursements of net asset value adjustments, breaches of
representations and warranties, and intellectual property claims. The Company
paid legal and transaction fees of $3.3 million out of cash
proceeds. Escrow claims presented by DSME are subject to an
evaluation process, which requires that DSME submit a written claim against the
escrowed funds and which thereby triggering processes for review and dispute by
the Company. Escrowed funds are only released by the escrow agent to
the Company or DSME under either i) mutual written instruction by DSME and the
Company or ii) scheduled escrowed cash releases to the Company at certain points
in time, outlined below, and so long as DSME has not submitted an escrow claim
in excess of the scheduled release amount. All successful escrow
claims by DSME would require DSME to either prove damages or show asset values
less than those represented at the transaction close. Of this cash, $5.5 million
was earmarked to satisfy the supply chain and asset valuation claims of which
$836,000 has been released to date; $7.0 million is scheduled to be released two
years after the close of the transaction in September, 2011 and the remainder to
be released three years after the close of the transaction, in September, 2012.
Other than disputed net asset value adjustments and vendor penalties claimed by
DSME and under discussion, no other claims have been filed to date. Our
intention is to vigorously defend against any such claims should they
occur. Defense of such claims may result in additional costs to
maintain the Company’s interest in the restricted cash or to limit potential
liability. In the event that claims are successful, the balance
payable to DSME may include all, part, or cash amounts in excess of the
remaining $16.4 million escrowed, including potentially an additional $18.5
million up to a total of $34.9 million under certain conditions, as described
below. If such claims are successfully made, this would result in
additional losses on the DeWind sale transaction and could require a substantial
refund of the proceeds received. Under the terms of the asset sale,
the additional $17.7 million would be due back to DSME if significant claims
were made by a third party and those claims were adjudicated against the
Company. No such claims have occurred and none are expected to
occur. We have filed a negative declaratory action in German court
that limits the value of our exposure. As such, none of the $18.5
million is recorded as a liability. The Company continues to believe the
remaining $16.4 million in escrowed funds will be released per the terms of the
agreement.
In
December, 2009 DSME filed its initial claims which listed a shortfall of $11.65
million from the represented net asset value. The Company
counterclaimed with an analysis that showed the net asset value as $6.8 million
higher than represented and requested an additional cash payment from DSME for
that amount. The discrepancy between the two lists consisted of
supply chain vendor claims, vendor penalties, and differences in accounting
estimates on the valuation of assets. During fiscal 2010, the Company
and DSME representatives met multiple times, beginning in January 2010 and
continuing through April 2010 to resolve the net asset and supply chain claims
differences. At the last meeting, the two parties identified the
remaining key supplier matters that required resolution before settlement of the
initial claims could be achieved. In July 2010, $836,000 was released
from escrow and paid to a vendor to satisfy one of these supplier
claims. To date, none of the other differences remaining between DSME
and the Company have been formally agreed upon by either
party. Either the Company or DSME has the option to require an
external audit to be conducted if an agreement on the disputed matters cannot be
achieved. To date, neither party has elected to exercise this option and both
prefer to work out the discrepancies through cooperation and
negotiation. The Company and DSME continued to have negotiation
meetings into December, 2010 to resolve any remaining valuation and supply chain
related discrepancies. In July 2010, the Company received $836,000 of
the escrowed cash leaving $16.4 million remaining in
escrow. Accordingly, we have reported the remaining $16.4 million
held in escrow as restricted cash. Consistent with escrow agreement
release dates, at September 30, 2010, we have classified $11.7 million as
current and $4.7 million as long-term (see Note 1 “Restricted
Cash”).
66
The
following is a summary of the net assets sold at September 4, 2009 and the
resulting loss on sale:
|
(In Thousands)
|
September 4, 2009
|
|||
|
ASSETS
|
||||
|
Accounts
Receivable, net
|
$ | 311 | ||
|
Inventory,
net
|
22,689 | |||
|
Advanced
Payments for Turbine Inventory
|
376 | |||
|
Prepaid
Expenses and Other Current Assets
|
2,021 | |||
|
Property
and Equipment, net
|
8,622 | |||
|
Intangible
Assets, net
|
18,538 | |||
|
Other
Assets
|
95 | |||
|
TOTAL
ASSETS
|
$ | 52,652 | ||
|
LIABILITIES
|
||||
|
Accounts
Payable and Other Accrued Liabilities
|
$ | 10,591 | ||
|
Deferred
Revenues and Customer Advances
|
3,121 | |||
|
Warranty
Provision
|
1,072 | |||
|
Total
Liabilities
|
14,784 | |||
|
Net
Assets Sold
|
$ | 37,868 | ||
|
Goodwill
|
5,914 | |||
|
Currency
Translation Adjustment – Loss
|
361 | |||
|
Direct
Costs Associated with the Sale
|
3,327 | |||
|
Accrued Contingent
Liabilities
|
3,387 | |||
| 50,857 | ||||
|
Consideration
|
49,500 | |||
|
Loss on
Sale of DeWind
|
$ | (1,357 | ) | |
The loss
on sale includes professional service fees directly related to the sale of
DeWind in the amount of $3.3 million (including $2.6 million in broker related
services and $0.7 million for legal services). The Company incurred no other
direct costs associated with the exit and disposal of DeWind.
The
consolidated assets and liabilities of our former DeWind segment have been
classified on the balance sheet as Net Liabilities of Discontinued
Operations. The asset and liabilities comprising the balances, as
classified in our balance sheets, consist of:
|
(In Thousands)
|
September 30, 2010
|
September 30, 2009
|
||||||
|
ASSETS
|
||||||||
|
Accounts
Receivable, net
|
2,199 | 2,461 | ||||||
|
Prepaid
Expenses and Other Current Assets
|
21 | 61 | ||||||
|
TOTAL
ASSETS
|
$ | 2,220 | $ | 2,522 | ||||
|
LIABILITIES
|
||||||||
|
Accounts
Payable and Other Accrued Liabilities
|
$ | 35,358 | $ | 39,356 | ||||
|
Deferred
Revenues and Customer Advances
|
2,248 | 2,869 | ||||||
|
Warranty
Provision
|
901 | 1,244 | ||||||
|
Total
Current Liabilities
|
38,507 | 43,469 | ||||||
|
Long-Term
Portion of Warranty Provision
|
— | 1,120 | ||||||
|
Total
Liabilities
|
38,507 | 44,589 | ||||||
|
Net
Liabilities of Discontinued Operations
|
$ | (36,287 | ) | $ | (42,067 | ) | ||
67
Significantly
all of the assets and liabilities of the discontinued operations pertain to
activities outside of the United States. The remaining operations of DeWind,
subsequently renamed Stribog, consist of receipt of license fees from Chinese
licensees of older DeWind technology and satisfaction of the remaining contracts
that were not assumed by DSME, primarily the servicing of warranties related to
wind turbines installed in Europe from 2006 through 2009, most of which are now
expired, and one contract for 10 turbines sold to South America that as yet have
not been installed. At September 30, 2010 and 2009, included above in
Accounts Payable and Other Accrued Liabilities are net payables related to
formerly consolidated, now insolvent European subsidiaries of approximately $20
million and $22 million, substantially all of which has been assigned by the
insolvency receiver to FKI, a former owner of DeWind, currently engaged in legal
activities with Stribog Ltd. (see Note 14). At September 30, 2010, the net
payables from insolvent subsidiaries is comprised of assets in the amount of $7
million and liabilities in the amount of $27 million. We did not receive any
update from the insolvency receiver related to the assets and liabilities for
the insolvent subsidiaries during the year ended September 30, 2010.
At September 30, 2010 and 2009, also included in Accounts Payable and Other
Accrued Liabilities is a $3.4 million provision to cover contingent liabilities
estimated in connection with the DSME transaction, some of which are related to
escrow claims made by DSME and subject to dispute and
negotiation. Accordingly, where probable and reasonably estimable,
these accruals were included in the Loss on Sale of DeWind discussed above. We
continue to maintain this accrual due to the ongoing uncertainties discussed
above.
The
consolidated results of our former DeWind segment have been classified on the
Statements of Operations and Comprehensive Loss, as Income (Loss) from
Discontinued Operations. Summarized results of discontinued
operations are as follows:
|
For the Years Ended September 30,
|
||||||||||||
|
(In Thousands)
|
2010
|
2009
|
2008
|
|||||||||
|
Revenues
|
$ | 3,068 | $ | 47,680 | $ | 43,113 | ||||||
|
Cost
of Revenues
|
2,024 | 57,047 | 60,593 | |||||||||
|
Operating
Expenses
|
2,359 | 20,005 | 24,089 | |||||||||
|
Impairment
of Assets
|
— | 23,369 | — | |||||||||
|
Other
(Income) Expense
|
(2,372 | ) | 215 | 1,840 | ||||||||
|
Income
Tax Expense (Benefit)
|
1 | — | 21 | |||||||||
|
Loss on
Sale of DeWind
|
— | 1,357 | — | |||||||||
|
Income
(Loss) from Discontinued Operations
|
$ | 1,056 | $ | (54,313 | ) | $ | (43,430 | ) | ||||
In
connection with the disposal and discontinuation of our DeWind segment, we
determined certain retained assets were impaired as of September 4,
2009. Included in the loss from discontinued operations for the year
ended September 30, 2009, are impairment charges from certain uncollectible
accounts receivable ($2.4 million) and advance payments for inventory ($1.6
million), excess goodwill ($18.3 million recorded during the quarter ended June
30, 2009) and the remaining DeWind intangible assets (of $1.1 million) in the
aggregate amount of $23.4 million. For the year ended September 30,
2010, Other Income is substantially comprised of foreign currency translation
adjustments (refer to additional discussion at Note 1 “Comprehensive
Loss”).
Since
September 4, 2009, the Company has had no significant continuing involvement
with our former DeWind segment; any subsequent cash flows are directly related
to the liquidation of the remaining assets and liabilities. No
corporate overhead has been allocated to discontinued operations.
ACCOUNTING
POLICIES – DISCONTINUED OPERATIONS
In
addition to the general accounting policies discussed in Note 1, the following
policies are applicable to our discontinued operations:
Revenue
Recognition
PRODUCT
REVENUES. Product revenues are recognized when product shipment has been made
and title has passed to the end user customer. Product revenues consist
primarily of revenue from the sale of turbines, turbine parts, or license
rights sold to wind farm operators, utilities, and technology licensees.
Revenues are deferred for product contracts where the Company is required to
perform installation services until after the installation is complete. Our
distribution agreements are structured so that our revenue cycle is complete
upon shipment and title transfer of products to the distributor with no right of
return.
DeWind
Turbine related sales for the years ended September 30, 2010, 2009 and 2008
consisted of completed and installed wind turbine units, turbine parts, and
license fees. For DeWind turbine revenues, for turbine sales, we recognized
revenues for completed and installed wind turbine units upon the commissioning,
or operational viability of each wind turbine unit. We recognized revenues on
turbine parts sales upon delivery to the customer and title transfer. We
recognized revenues on the license fees upon collection of the license fees and
reporting by the licensee of units sold under each license
agreement.
68
For
turbine sales, our contracted sales typically include the turbine and warranty
services for up to two years after turbine installation and we offer extended
warranties for an additional fee. One turbine was sold during the fiscal year
ending September 30, 2009 that did not have a warranty. All other turbines sold
carried a two year warranty. Our turbine sales are documented by turbine supply
agreements that specify the contracted value of the turbine, the warranty
service period, and the timing of cash payments by our customers. Our
operational history and the value of extended warranties sold allow us to
provide sufficient vendor specific objective evidence (VSOE) to value the
warranty included with a wind turbine, generally $25,000 per rated megawatt of
power per year representing expected warranty and availability related
liabilities during the warranty period. We recognize as revenue the contracted
turbine value reduced by the value of the warranty portion when the revenue
cycle is completed as described above. Progress payments and customer deposits
are recorded as deferred revenues until the revenue cycle is completed. Costs
incurred and turbine materials purchased during the production of turbines in
completion of the revenue cycle are capitalized into inventory. Operating
expenses, including indirect costs and administrative expenses, are charged as
incurred to periodic income and not allocated to contract costs. The value
of the warranty portion determined by the VSOE is deferred and recognized
ratably over the life of the warranty service period. For multiple element
contracts where there is no VSOE or third-party evidence that would allow the
allocation of an arrangement fee amongst various pieces of a multi-element
contract, fees received in advance of services provided would be recorded as
deferred revenues until additional operational experience or other vendor
specific objective evidence becomes available, or until the contract is
completed.
SERVICE
REVENUES. Service revenues consist of service and maintenance on our wind
turbines under flat rate contracts, typically billed in advance on an annual or
semi-annual basis on a flat rate, as a full service contract, typically
calculated as a rate per kilowatt of generation and billed monthly or quarterly
in arrears, or as a point of sale service call basis billed on a time and
materials basis. Service revenues are deferred and recognized ratably over the
life of a flat rate service contract, recognized as billed for full service
contracts, or for point of delivery services, when the service has been
provided. Direct costs of uncompleted work related to maintenance or repairs
activity is capitalized and expensed upon completion. Billings for
turbines on a time and materials basis are recorded into revenue as the services
are delivered.
LICENSE
REVENUE. License revenues consist of cash payments for the licensing of our
older D6 and D8 turbines on a per unit delivered basis. We have license
agreements with three companies in China and India that call for progress
payments to DeWind upon the completion of certain technology transfer
milestones. We defer all payments received and recognize revenue when the
licensee has shipped the finished turbine to the wind farm
operator.
Warranty,
Retrofit, and Availability Provisions
Warranty
provisions consist of the estimates of the costs and liabilities associated with
the post-sale servicing of our DeWind wind turbines. Warranty periods for our
wind turbines range from zero to seven years and may include parts-only
warranties or parts and repair services warranties and may or may not include
revenue guarantees. Warranty conditions are specific to and are governed by the
turbine supply agreement contract. Warranty related liabilities for time periods
in excess of one year are classified as non-current liabilities.
Provision
for Loss on Turbine Contracts and Turbine Contract Inventory
Provision
for loss on turbine contracts represents incurred and estimated costs in excess
of contracted and expected billings on turbine supply
contracts. Management reviews all turbine supply contracts and
evaluates each contract on an individual basis to determine if estimated costs
to complete exceed projected billings. For contracts projected to be
at a loss, a provision for contract loss is accrued and expensed to turbine cost
of sales. After the related inventory is purchased, the provision is
reclassified to inventory reserves to reduce the value of the inventory to the
net realizable value based on the sales price under the contract.
NOTE
3 – ACCOUNTS RECEIVABLE
Accounts
receivable, net consists of the following:
|
September 30,
|
||||||||
|
(In Thousands)
|
2010
|
2009
|
||||||
|
Cable
Receivables
|
$ | 2,556 | $ | 1,813 | ||||
|
Reserves
|
(217 | ) | (81 | ) | ||||
|
Net
Accounts Receivable
|
2,339 | 1,732 | ||||||
69
NOTE
4 – INVENTORY
Inventories
consist of the following:
|
September 30,
|
||||||||
|
(In Thousands)
|
2010
|
2009
|
||||||
|
Raw
Materials
|
$ | 1,989 | $ | 2,040 | ||||
|
Work-in-Progress
|
398 | — | ||||||
|
Finished
Goods
|
2,425 | 3,261 | ||||||
|
Gross
Inventory
|
4,812 | 5,301 | ||||||
|
Reserves
|
(1,255 | ) | (923 | ) | ||||
|
Net
Inventory
|
$ | 3,557 | $ | 4,378 | ||||
During
the year ended September 30, 2010, inventory expenses were comprised of $935,000
in reserve provisions and $448,000 in obsolescence related direct
charges. During the year ended September 30, 2009, inventory expenses
were comprised of $223,000 in reserve provisions. During the year
ended September 30, 2008, inventory expenses were comprised of $602,000 in
reserve provisions and $554,000 in obsolescence related direct
charges.
NOTE
5 – PROPERTY AND EQUIPMENT
Property
and equipment consisted of the following:
|
September 30,
|
||||||||||||
|
(In Thousands)
|
Estimated Useful Lives
|
2010
|
2009
|
|||||||||
|
Office
Furniture and Equipment
|
3-10
yrs
|
$ | 832 | $ | 936 | |||||||
|
Production
Equipment
|
10
yrs
|
4,047 | 4,994 | |||||||||
|
Construction-in-Progress
|
— | — | 302 | |||||||||
|
Leasehold
Improvements
|
Lesser
of lease term or 7 yrs
|
778 | 748 | |||||||||
|
Total
Property
|
5,657 | 6,980 | ||||||||||
|
Accumulated
Depreciation
|
(2,721 | ) | (3,766 | ) | ||||||||
|
Property
and Equipment, net
|
$ | 2,936 | $ | 3,214 | ||||||||
Total
depreciation expense was $698,000, $1,011,000 and $776,000, for the years ended
September 30, 2010, 2009 and 2008, respectively. As of October 1, 2009, the
Company changed its method of depreciating production equipment to the
units-of-production method, which included applying an estimated useful life of
10 years as compared to a range of 3-10 years applied in prior periods. Refer to
the discussion in Note 1 “Property and Equipment – Change in Accounting
Estimate”.
NOTE
6 – ACCOUNTS PAYABLE AND ACCRUED LIABILITIES
Accounts
payable and accrued liabilities consisted of the following:
|
September 30,
|
||||||||
|
(In Thousands)
|
2010
|
2009
|
||||||
|
Trade
Payables
|
$ | 3,949 | $ | 4,179 | ||||
|
Accrued
Commissions
|
155 | 667 | ||||||
|
Accrued
Insurance
|
3 | 441 | ||||||
|
Accrued
Payroll and Payroll Related
|
829 | 541 | ||||||
|
Accrued
Payroll Tax Liability (A)
|
427 | — | ||||||
|
Accrued
Interest
|
2 | 183 | ||||||
|
Deferred
Rents
|
296 | 133 | ||||||
|
Accrued
Sales Tax
|
186 | 128 | ||||||
|
Accrued
Other
|
165 | 945 | ||||||
|
Total
Accounts Payable and Accrued Liabilities
|
$ | 6,012 | $ | 7,217 | ||||
70
|
|
(A)
|
During the year ended September
30 2010, the Company accrued a payroll tax liability as a result of an IRS
audit (see Note 1 “Income Taxes” for additional
information).
|
NOTE
7 – DEFERRED REVENUE AND CUSTOMER ADVANCES
Deferred
Revenue includes (i) extended warranties, as opted by the customer (see Note 1
“Revenue Recognition – Product Revenues” for additional information), and (ii)
temporary timing-based revenue deferrals from shipments in transit prior to
title passing to the customer. Customer Advances include all advance cash
payments received from customers. The recorded amounts will remain on
our balance sheet until such time as the revenue cycle is completed and the
amounts are recognized as revenue. Deferred revenue and customer
advances consist of the following:
|
September 30,
|
||||||||
|
(In Thousands)
|
2010
|
2009
|
||||||
|
Deferred
Revenue
|
$ | 1,370 | $ | 563 | ||||
|
Customer
Advances
|
530 | 14 | ||||||
|
Total
Deferred Revenue and Customer Advances
|
1,900 | 577 | ||||||
|
Less
amount classified in current liabilities
|
1,386 | 16 | ||||||
|
Long-term
Deferred Revenue
|
$ | 514 | $ | 561 | ||||
Long-term
deferred revenue is comprised of long-term extended warranties.
NOTE
8 – WARRANTY PROVISION
Warranties
relate to our ACCC® products
for conductor and hardware sold directly by us to the end-user customer.
We mitigate our loss exposure through the use of third-party warranty
insurance (see Note 1 “Warranty Provisions”). We have classified all
warranty provisions considered to be payable within one year as current
liabilities and all warranty provisions considered to be payable greater than
one year as long-term liabilities.
Warranty
provision consisted of:
|
September 30,
|
||||||||
|
(In Thousands)
|
2010
|
2009
|
||||||
|
Warranty
Provision
|
$ | 524 | $ | 564 | ||||
|
Less
amount classified in current liabilities
|
306 | 258 | ||||||
|
Long-Term
Warranty Provision
|
$ | 218 | $ | 306 | ||||
The
following table sets forth an analysis of warranty provision
activity:
|
September 30,
|
||||||||
|
(In Thousands)
|
2010
|
2009
|
||||||
|
Beginning
balance
|
$ | 564 | $ | 219 | ||||
|
Additional
reserves recorded to expense
|
265 | 513 | ||||||
|
Provision
utilized
|
(305 | ) | (168 | ) | ||||
|
Ending
balance
|
$ | 524 | $ | 564 | ||||
71
NOTE
9 – DEBT
The
following table summarizes the Company’s debt as of September 30, 2010 and
2009:
|
September 30,
|
||||||||
|
(In Thousands)
|
2010
|
2009
|
||||||
|
Senior
Secured Loan due April 2012, net of discount of $919
|
$ | 9,081 | $ | — | ||||
|
Senior
Convertible 8% Notes due January 2010, net of discount of
$315
|
— | 8,723 | ||||||
|
Total
Debt
|
9,081 | 8,723 | ||||||
|
Less
amount classified in current liabilities
|
9,081 | 8,723 | ||||||
|
Long-Term
Debt
|
$ | — | $ | — | ||||
Debt
outstanding or issued during the year ended September 30, 2010 and 2009 consists
of:
A. Senior
Secured Loan Payable:
In April
2010, the Company issued a $10.0 million Senior Secured Loan due in April 2012
and received $9.7 million in cash net of fees and costs of $0.3
million. The loan bears interest at 7.5% payable monthly on balances
secured by qualified accounts receivable of the Company and interest at 12.5%
payable monthly on balances not secured by qualified accounts receivable.
Qualified accounts receivable consist of 80% of current trade accounts
receivable, which amounted to $1.8 million at September 30, 2010. The
loan is collateralized by substantially all of the Company’s assets. The loan
package included an issuance of a total of 10 million warrants to purchase a
like number of the Company’s common stock in two tranches. The first
tranche is for 5 million warrants with a three year life and an exercise price
of $0.29 per warrant. The second tranche is for 5 million warrants
with a five year life and an exercise price of $1.00 per
warrant. Both warrant tranches may be exercised at any time prior to
expiration on a cashless basis and are automatically exercised at expiration on
a cashless basis for shares of the Company. We valued the 10 million
warrants at $1,494,000 using the Black-Scholes option-pricing model (see Note 10
“Warrants”). The value assigned to the warrants issued (net of $6,000 in cash
consideration) was recorded as a debt discount and will be amortized to interest
expense over the two-year life of the loan.
The
issuance of the warrants triggered anti-dilution protection in one series of
previously issued warrants. Previously outstanding warrants with
exercise prices of $0.95 and $0.98 and which expire in May, 2011 were reset by
$0.01 per warrant. We determined this modification, calculated as the
difference in fair value of the warrants immediately before and after the change
in exercise prices, had no significant impact on our results.
The loan
has two financial covenants, measured monthly consisting of (i) a liquidity
covenant and (ii) a profitability covenant. The liquidity covenant
requires the maintenance of a minimum of $7.5 million of combined cash and
accounts receivable balances, measured at month-end. The
profitability covenant consists of a maximum accumulated adjusted operating loss
of $5.0 million, measured beginning April 1, 2010. The adjusted
operating loss consists of operating loss, less depreciation, amortization, and
certain other non-cash charges including stock related compensation and is
increased or decreased by the corresponding increase or decrease in deferred
revenues as compared to the March 31, 2010 deferred revenue
balance. As of September 30, 2010, the Company was not in compliance
with its covenant.
In the
event of a covenant breach, the lender could declare the loan in default and
thereby pursue remedies included in the loan agreement which may include any or
all of the following: immediate collection of the loan, assignment of cash
receipts, control of the Company’s bank accounts, liquidation of the Company’s
assets in part or in full, or apply the default rate of interest of 18% to the
obligation.
Subsequent
to year-end, the Company and lender agreed to amend its debt
covenants. The amendments allow for a temporary waiver of its
covenants until January 15, 2011. The amendments
included: i) a cash waiver fee of $160,000 payable by January 15,
2011; ii) a reduction in the exercise price from $0.29 to $0.24 for 5
million warrants issued to lender expiring in April 2013; and iii) a reduction
in the exercise price from $1.00 to $0.69 for 5 million warrants issued to
lender expiring in April 2015.
Loan
maturity remains April 2012 and monthly interest-only payments at the stated
rates were also unchanged. The Company has made all required interest
payments to date. Additionally, the Company and lender agreed that
any net proceeds released from escrow which are not designated to satisfy escrow
claims and thereby are received as unrestricted cash (see Note 2) to the Company
may be required, at the option of the lender, be applied to any outstanding loan
interest, waiver fees, or loan principal up to the total remaining outstanding
loan principal. The lender has agreed to waive any loan
prepayment penalties resulting from any loan prepayments resulting from the
amendments, currently 3% of principal for repayments through April 2011 and 1.5%
of principal for repayments after April, 2012.
Due to
these amendments and the Company’s liquidity position, at September 30, 2010,
the loan has been reported as a current obligation.
The loan
may be prepaid at any time prior to April 12, 2012 with a prepayment penalty of
3% of principal if prepaid in the first year and 1.5% of principal if prepaid in
the second year of the loan.
B. Convertible
Notes Payable:
72
In
February, 2007 we sold $22,825,000 face value of Senior Convertible Notes and
detachable stock warrants to a group of private investors for gross proceeds of
$22,825,000. The notes were convertible into common stock of the
Company at a price of $0.99 per share. The Notes carried interest at
the rate of 8% per year and may have been redeemed by the Company at the
Company’s option upon 30 days notice, for 103% of the outstanding principal at
any time after the two year anniversary of the February 2007 closing, but prior
to maturity in January 2010, if the weighted average price of the Company’s
common stock was 125% of the conversion price for twenty consecutive trading
days.
In fiscal
2008, the combined effect of the issuance of common stock and common stock
options and warrant securities decreased the conversion price from $1.03 to
$1.00 and the Company recorded an additional $302,000 of convertible debt
discount. In fiscal 2009, the issuance of common stock warrants
associated with the secured bridge notes resulted in the decrease in the
conversion price to $0.99 and resulted in $30,000 of additional convertible debt
discount. The additional debt discount was amortized to interest
expense over the remaining life of the convertible debt.
The
following tables summarize the debt discount and deferred cash financing fees
for the year ended September 30, 2009:
|
(In
Thousands)
|
||||
|
Debt Discount:
|
||||
|
Discount
balance, September 30, 2008
|
$ | 1,199 | ||
|
Additional
discount – anti-dilution impacts – 2009
|
30 | |||
|
Discount
amortized to interest expense – 2009
|
(914 | ) | ||
|
Discount
balance, September 30, 2009
|
$ | 315 | ||
|
Deferred Cash Financing
Fees:
|
||||
|
Deferred
cash financing fees balance, September 30, 2008
|
$ | 249 | ||
|
Deferred
cash financing fees amortized to interest expense – 2009
|
(187 | ) | ||
|
Deferred
cash financing fees balance, September 30, 2009
|
$ | 62 | ||
The
remaining note discount recorded was amortized ratably to interest expense over
the remaining life of the notes through January 2010.
The
following table summarizes the conversion of the principal Senior Convertible
Notes since issuance:
|
(In Thousands)
|
Principal
|
Common Shares
Issued or Issuable
|
||||||
|
Principal
balance at issuance, February, 2007
|
$ | 22,825 | ||||||
|
Conversions
at $1.04 per share
|
(300 | ) | 288 | |||||
|
Conversions
at $1.03 per share
|
(10,353 | ) | 10,051 | |||||
|
Principal
balance at September 30, 2007
|
$ | 12,172 | ||||||
|
Conversions
at $1.03 per share
|
(2,135 | ) | 2,073 | |||||
|
Conversions
at $1.00 per share
|
(1,000 | ) | 1,000 | |||||
|
Principal
balance at September 30, 2008 and 2009
|
$ | 9,037 | ||||||
|
Total
Shares issued for conversions to date
|
13,412 | |||||||
|
Total
Shares issuable at the current conversion price of $0.99
|
9,129 | |||||||
In
January 2010, the Company fully repaid all outstanding Senior Convertible 8%
Notes payable. A total of $9,037,000 plus interest for the month of
January 2010 was repaid.
C. Senior
Secured Note Payable:
On June
30, 2009, the Company entered into a bridge note financing structured as a
Senior Secured Promissory Note transaction with an aggregate principal value of
$5,000,000, plus interest on the unpaid principal balance at a rate of 10% per
annum to be repaid no later than December 30, 2009. Pursuant to the note
agreement, the Company paid $200,000 in closing fees, along with $95,000 in
other legal and financing costs, which were recorded as deferred financing costs
and amortized over the six month life of the bridge note.
In
connection with the Senior Secured Promissory Note transaction, the Company
granted and issued 4,000,000 warrants with an exercise price of $0.25 and valued
the warrants at $0.1814 per warrant or $726,000 using the Black-Scholes
option-pricing model using the following assumptions: the market price was
$0.30, the volatility was estimated at 88%, the life of the warrants was 3
years, the risk free rate was 1.64% and the dividend yield of 0%. The value
assigned for the warrants issued in conjunction with the bridge note was
recorded as debt discount and was amortized over the six month life of the
bridge note.
73
The
issuance of the warrants triggered anti-dilution protection in several series of
previously issued warrants and in the conversion price of the remaining
$9,037,000 of Convertible Notes due January, 2010. The conversion price of the
Convertible Notes was reduced from $1.00 to $0.99, which resulted in an
additional 91,289 shares issuable upon full conversion of the remaining Notes.
The intrinsic value of the additional shares issuable upon full conversion was
$27,000, which was amortized to interest expense over the expected remaining
life of the Convertible Notes. Previously outstanding warrants with exercise
prices between $0.96 and $1.28 and which expire between February, 2010 and May,
2011 were reset by between $0.01 and $0.02 per warrant and resulted in $7,000 of
additional expense, calculated as the difference in fair value of the warrants
immediately before and after the change in exercise prices.
In
September 2009, the Company fully repaid the $5,000,000 in principal plus
accrued interest, and amortized the remaining portions of the $726,000 debt
discount to interest expense and $295,000 deferred financing cost to operating
expenses.
NOTE
10 – SHAREHOLDERS' EQUITY (DEFICIT)
Preferred
Stock
We have
5,000,000 shares of preferred stock authorized. As of the
year ended September 30, 2010 there was no preferred stock
outstanding.
Common
Stock
The
Company has 600,000,000 shares of Common Stock authorized. We have
never paid cash dividends on our common stock.
The
following issuances of common stock were made during fiscal 2010:
Cash
During
the year ended September 30, 2010 the Company received $7,000 in cash from the
exercise of 20,000 consultant options.
Services
During
the year ended September 30, 2010 the Company issued 161,290 shares of common
stock to John Brewster, former CTC Cable President, valued at $45,000 at the
date of issuance in partial payment of an employment acceptance
bonus.
Warrants
The
Company issues warrants to purchase common shares of the Company either as
compensation for consulting services or as additional incentive for investors
who purchase unregistered, restricted common stock, certain debt obligations or
convertible debentures. The value of warrants issued for compensation is
accounted for as a non-cash expense to the Company at the fair value of the
warrants issued. The value of warrants issued in conjunction with financing
events is either a reduction in paid-in-capital for common stock issuances or as
a discount for debt issuances. The Company values the warrants at fair value as
calculated by using the Black-Scholes option-pricing model. See Note
1 “Derivative Liabilities” for additional warrant liability accounting and
disclosure.
The
following table summarizes the warrant activity during the three years ended
September 30, 2010:
|
Number of
Shares
|
Weighted Average
Exercise Price
|
|||||||
|
Outstanding,
September 30, 2007
|
32,449,107 | $ | 1.30 | |||||
|
Granted
|
2,250,000 | $ | 0.99 | |||||
|
Issued
pursuant to antidilution protection
|
542,272 | n/a | ||||||
|
Exercised
|
(4,129,139 | ) | $ | 1.08 | ||||
|
Cancelled
|
(4,961,425 | ) | $ | 1.33 | ||||
|
Outstanding,
September 30, 2008
|
26,150,815 | $ | 1.20 | |||||
|
Granted
|
4,150,000 | $ | 0.28 | |||||
|
Exercised
|
— | $ | — | |||||
|
Cancelled
|
(7,366,166 | ) | $ | 1.37 | ||||
|
Outstanding,
September 30, 2009
|
22,934,649 | $ | 0.95 | |||||
|
Granted
|
11,200,000 | $ | 0.62 | |||||
|
Exercised
|
— | $ | — | |||||
|
Cancelled
|
(15,934,649 | ) | $ | 1.14 | ||||
|
OUTSTANDING,
September 30, 2010
|
18,200,000 | $ | 0.58 | |||||
|
EXERCISABLE,
September 30, 2010
|
17,600,000 | $ | 0.59 | |||||
74
The
following table summarizes the warrants issued, outstanding, and exercisable as
of September 30, 2010:
|
Warrant Series
|
Grant Date
|
Strike
Price
|
Expiration Date
|
Warrants
remaining
|
Proceeds if
Exercised (in
$000s)
|
Call
feature
|
||||||||||||
|
2006
Series C
|
May,
2006
|
$ | 0.75 | (A) |
December,
2010
|
200,000 | $ | 150 |
None
|
|||||||||
|
2006
Series D
|
May,
2006
|
$ | 0.75 | (B) |
December,
2010
|
200,000 | 150 |
None
|
||||||||||
|
2006
Series E
|
May,
2006
|
$ | 0.75 | (C) |
December,
2010
|
200,000 | 150 |
None
|
||||||||||
|
2008
Debt Series 1
|
May,
2008
|
$ | 0.94 | (D) |
May,
2011
|
1,125,000 | 1,058 |
None
|
||||||||||
|
2008
Debt Amendment
|
May,
2008
|
$ | 0.97 | (D) |
May,
2011
|
1,125,000 | 1,091 |
None
|
||||||||||
|
2008
Debt Service
|
October,
2008
|
$ | 0.94 | (D) |
May,
2011
|
150,000 | 141 |
None
|
||||||||||
|
2009
Bridge Note
|
June,
2009
|
$ | 0.25 | (E) |
June,
2012
|
4,000,000 | 1,000 |
None
|
||||||||||
|
2009
Legal Settlement
|
November,
2009
|
$ | 0.45 | (F) |
November,
2011
|
300,000 | 135 |
None
|
||||||||||
|
2010
Service Agreement
|
February,
2010
|
$ | 0.35 | (F) |
February,
2013
|
600,000 | 210 |
None
|
||||||||||
|
2010
Loan Series 1
|
April,
2010
|
$ | 0.29 | (F) |
April,
2013
|
5,000,000 | 1,450 |
None
|
||||||||||
|
2010
Loan Series 2
|
April,
2010
|
$ | 1.00 | (F) |
April,
2015
|
5,000,000 | 5,000 |
None
|
||||||||||
|
2010
Service Agreement
|
September,
2010
|
$ | 0.35 | (F) |
September,
2013
|
300,000 | 105 |
None
|
||||||||||
|
Total
|
18,200,000 | $ | 10,640 | |||||||||||||||
(A) Warrants
were re-priced on December 23, 2008 from $1.25 to $0.75 per
warrant.
(B) Warrants
were re-priced on December 23, 2008 from $1.50 to $0.75 per
warrant.
(C) Warrants
were re-priced on December 23, 2008 from $1.75 to $0.75 per
warrant.
(D)
Subject to anti-dilution provisions. Certain future equity or equity equivalent
issuances below the current exercise price per warrant may result in a weighted
average price reset of the exercise price. Warrant strike price was
reset by $0.01 per warrant as a result of the issuance of the 4,000,000 warrants
related to the 2009 Bridge Note.
(E)
Subject to anti-dilution provisions. Certain future equity or equity equivalent
issuances below the current exercise price per warrant may result in a weighted
average price reset of the exercise price.
(F)
Warrants are not subject to anti-dilution provisions.
Warrant
issuances and modifications during the year ended September 30,
2009:
On
October 15, 2008 we issued 150,000 warrants with a strike price of $0.96 per
warrant in settlement of a disputed fee related to placement services for the
May, 2008 Archer debt issuance. The expense for these warrants was
accrued for as of September 30, 2008. On December 23, 2008 we agreed
to modify the exercise price of three series of warrants originally issued in
May, 2006. A total of 600,000 warrants were re-priced to
$0.75.
On June
30, 2009 we issued 4,000,000 three-year warrants with a strike price of $0.25
per warrant as part of the Bridge Note financing. The issuance of the
warrants triggered anti-dilution protection which reset the strike price
warrants associated with past financings by between $0.01 and $0.02 per
warrant. We valued the price changes and additional warrants issued
using the Black-Scholes option-pricing model. We recorded additional
debt discount for modification of warrants associated with our remaining
convertible debt and additional expense for modification of non-debt warrants
both of which were calculated as the difference between the fair value of the
warrants prior to the exercise price reset and after the exercise price
reset. The total expense related to warrant modifications and
issuances during the year ended September 30, 2009 was $29,000 recorded to
general and administrative expense and an additional $30,000 was recorded to
debt discount and amortized to interest over the remaining life of the
convertible debt. The value assigned for the warrants issued in
conjunction with the Bridge Note was $726,000, which was amortized over the six
month life of the Bridge Note.
75
The
following assumptions were used to value the warrant issuances and modifications
discussed above:
Dividend
rate = 0%
Risk free
return between 0.56% and 1.89%
Volatility
of between 75% and 116%
Market
price for October 15, 2008 issuance: $0.40
Market
price for December 23, 2008 modification: $0.30
Market
price for June 30, 2009 issuance and modification: $0.30
Maturity
between 2 and 3 years.
Warrant
issuances and modifications during the year ended September 30,
2010:
On
November 13, 2009 we issued 300,000 warrants with a strike price of $0.45 per
warrant and a two-year life in settlement of a legal dispute. We
valued the warrants at $57,000 using the Black-Scholes option pricing model and
the following assumptions:
Dividend
rate = 0%
Risk free
return of 0.82%
Volatility
of 108%
Market
price of $0.37 per share
Maturity
of 2 years
On
February 12, 2010 we issued 600,000 warrants with a strike price of $0.35 per
warrant and a three-year life in connection with an ongoing service
agreement. The warrants vest in six equal 100,000 share amounts on a
quarterly basis, beginning on February 12, 2010. We valued the
warrants at $95,000 using the Black-Scholes option pricing model and the
following assumptions:
Dividend
rate = 0%
Risk free
return of 1.40%
Volatility
of 98%
Market
price of $0.28 per share
Maturity
of 3 years
On April
12, 2010 we issued 10,000,000 warrants in two tranches in connection with a debt
financing transaction. The first tranche is for 5 million warrants
with a three-year life and an exercise price of $0.29 per
warrant. The second tranche is for 5 million warrants with a
five-year life and an exercise price of $1.00 per warrant. Both
warrant tranches may be exercised at any time prior to expiration on a cashless
basis and are automatically exercised at expiration on a cashless basis for
shares of the Company. We have determined these warrants are subject
to derivative liability accounting treatment as discussed in Note 1 “Derivative
Liabilities”. The issuance of the warrants triggered anti-dilution
protection in one series of previously issued warrants. Previously
outstanding warrants with exercise prices of $0.95 and $0.98 and which expire in
May, 2011 were reset by $0.01 per warrant. We determined this
modification, calculated as the difference in fair value of the warrants
immediately before and after the change in exercise prices, had no significant
impact on our results. We valued the 10 million warrants at
$1,494,000 using the Black-Scholes option-pricing model and the following
assumptions:
Dividend
rate = 0%
Risk free
return of 1.65% and 2.60%
Volatility
of 95%
Market
price of $0.27 per share
Maturity
of 3 and 5 years
On
September 8, 2010 we issued 300,000 warrants with a strike price of $0.35 per
warrant and a three-year life in connection with an ongoing service
agreement. The warrants vest 50,000 shares beginning on March 8,
2011, thereafter in ten equal 25,000 share amounts on a quarterly
basis. We valued the warrants at $39,000 which is being amortized
over the requisite service period of three years. For the year ended
September 30, 2010 we recognized $2,000 as compensation expense. We
valued the warrants using the Black-Scholes option pricing model and the
following assumptions:
Dividend
rate = 0%
Risk free
return of 1.55%
Volatility
of 95.6%
Market
price of $0.20 per share
Term of 5
years
Management
has reviewed and assessed the warrants issued during the year ended September
30, 2010 and, except for the April 12, 2010 warrants, determined that they do
not qualify for treatment as derivatives under applicable US GAAP
rules.
76
Stock
Options
On May
15, 2001, TTC, a predecessor to the Company, established the 2001 Incentive
Compensation Stock Option Plan (the "TTC Plan"). The TTC Plan was administered
by the Company's Board of Directors. Under the TTC Plan, the Board had reserved
4,764,000 shares of common stock to support the underlying options which may be
granted. As part of TTC's acquisition by the Company on November 3, 2001, the
TTC Plan was terminated, and the options were converted into options to purchase
shares of the Company’s common stock pursuant to the 2002 Non-Qualified Stock
Compensation Plan (the "2002 Stock Plan"). The number of shares reserved
initially under the 2002 Stock Plan was 9,000,000. This number was increased to
14,000,000 on October 24, 2002 and increased to 24,000,000 on April 27, 2006.
The 2002 Stock Plan automatically terminates on May 15, 2021 and no options
under the 2002 Stock Plan may be granted after May 15, 2011.
On
January 11, 2008 the Company’s Board of Directors established the 2008
Non-Qualified Stock Compensation Plan (the “2008 Stock Plan”) which was ratified
by the Shareholders of the Company on March 4, 2008. The number of shares
reserved under the 2008 Stock Plan was established at
25,000,000. The 2008 Stock Plan allows for Incentive Stock
Options to be issued to the Company’s employees or officers and Non-Statutory or
Non-Qualifying Stock Options to be issued to the Company’s employees, officers,
consultants, and directors for a period of 10 years from January 11,
2008. To date, only Non-Qualifying Stock Options have been
issued.
The
exercise price of the underlying shares for both the 2002 Stock Plan and 2008
Stock Plan will be determined by the Board of Directors; however, the exercise
price may not be lower than 100% of the mean of the last reported bid and asked
price of the Company's common stock on the grant date as quoted on the NASDAQ
Bulletin Board or any other exchange or organization. The term of each option
will be established by the Board of Directors at the date of issue and may not
exceed 10 years. Option grants to employees, directors, and officers
typically have a vesting schedule of between 3 and 5 years and are based upon
length of service.
Certain
options granted under the 2008 Stock Plan may be exercised at any time for
restricted stock of the Company if not otherwise prohibited by the Company’s
Board of Directors. Shares issued under the 2008 Stock Plan may
be subject to a right of first refusal, one or more repurchase options, or other
conditions and restrictions as determined by the Company’s Board of Directors in
its discretion at the time the option is granted. As of September 30, 2010
all of the 2008 Stock Plan option grants were exercisable. To date, no
restricted stock has been issued under the 2008 Stock Plan. Of the
2008 Stock Plan options exercisable, 6,251,376 options were vested and
exercisable into unrestricted stock as of September 30, 2010.
The
following table summarizes the 2002 Stock Plan and 2008 Stock Plan stock option
activity during the three years ended September 30, 2010:
|
2002 Plan
Number of
Options
|
2008 Plan
Number of
Options
|
Total Number of
Options
|
Weighted
Average
Exercise
Price
|
|||||||||||||
|
Outstanding, September 30, 2007
|
15,019,870 | — | 15,019,870 | $ | 0.91 | |||||||||||
|
Granted
|
3,745,000 | 7,231,000 | 10,976,000 | 1.42 | ||||||||||||
|
Exercised
|
(490,000 | ) | — | (490,000 | ) | 0.40 | ||||||||||
|
Cancelled
|
(375,349 | ) | — | (375,349 | ) | 1.44 | ||||||||||
|
Outstanding,
September 30, 2008
|
17,899,521 | 7,231,000 | 25,130,521 | $ | 1.14 | |||||||||||
|
Granted
|
— | 3,460,000 | 3,460,000 | 0.35 | ||||||||||||
|
Exercised
|
(100,000 | ) | — | (100,000 | ) | 0.35 | ||||||||||
|
Cancelled
|
(1,587,365 | ) | (1,002,192 | ) | (2,589,557 | ) | 0.64 | |||||||||
|
Outstanding,
September 30, 2009
|
16,212,156 | 9,688,808 | 25,900,964 | $ | 0.35 | |||||||||||
|
Granted
|
— | 6,765,000 | 6,765,000 | 0.35 | ||||||||||||
|
Exercised
|
(20,000 | ) | — | (20,000 | ) | 0.35 | ||||||||||
|
Cancelled
|
(379,888 | ) | (2,349,476 | ) | (2,729,364 | ) | 0.35 | |||||||||
|
Outstanding,
September 30, 2010
|
15,812,268 | 14,104,332 | 29,916,600 | $ | 0.35 | |||||||||||
|
Exercisable
, September 30, 2010
|
15,267,133 | 14,104,332 | 29,371,465 | $ | 0.35 | |||||||||||
77
The
weighted-average remaining contractual life of the options outstanding at
September 30, 2010 was 6.7 years. The exercise prices of the options outstanding
at September 30, 2010 ranged from $0.25 to $1.00, and information relating to
these options is as follows:
|
Range of Exercise
Prices
|
Stock Options
Outstanding
|
Stock Options
Exercisable
|
Weighted
Average
Remaining
Contractual
Life in years
|
Weighted
Average
Exercise Price
of Options
Outstanding
|
Weighted
Average
Exercise Price of
Options
Exercisable
|
|||||||||||||||
|
$ 0.25-0.34
|
728,000 | 728,000 | 6.26 | $ | 0.25 | $ | 0.25 | |||||||||||||
|
$
0.35-$0.49
|
29,159,200 | 28,614,065 | 6.69 | $ | 0.35 | $ | 0.35 | |||||||||||||
|
$
0.50-1.00
|
29,400 | 29,400 | 0.41 | $ | 1.00 | $ | 1.00 | |||||||||||||
|
Total
|
29,916,600 | 29,371,465 | ||||||||||||||||||
During
fiscal 2010, 2009 and 2008, the Company granted 6,765,000, 3,460,000 and
10,976,000 options, respectively, with a weighted-average grant-date fair value
of $0.17, $0.15 and $0.69 per option, respectively, determined using the
Black-Scholes option-pricing model. Additionally, during fiscal 2010, the
Company’s vested and cancelled options had a weighted-average grant-date fair
value of $0.64 and $0.35 per option, respectively; and the Company’s non-vested
options at the beginning and ending of fiscal 2010 had a weighted-average
grant-date fair value of $0.59 and $0.30 per option, respectively.
During
fiscal 2010, approximately 4,559,000 options vested with an aggregate grant-date
fair value of $2,930,000.
At
September 30, 2010, the Company had 29,371,465 options exercisable with an
aggregate intrinsic value of zero, an aggregate exercise value of $10,226,000,
and a weighted-average remaining contractual life of 6.7 years.
NOTE
11 – EQUITY BASED COMPENSATION
US GAAP
requires recognition of the cost of employee services received in exchange for
an award of equity instruments in the financial statements over the period the
employee is required to perform the services in exchange for the award. US GAAP
also requires measurement of the cost of employee services received in exchange
for an award based on the grant-date fair value of the award. The fair value of
stock options is determined using the Black-Scholes valuation
model.
US GAAP
requires that equity instruments issued to non-employees in exchange for
services be valued at the more accurate of the fair value of the services
provided, or the fair value of the equity instruments issued. For equity
instruments issued that are subject to a required service period, the expense
associated with the equity instruments is recorded as the instruments vest or
the services are provided. For granted options and warrants to non-employees,
the fair value of these equity instruments is recorded on the date of issuance
using the Black-Scholes valuation model, for options and warrants not subject to
vesting terms. For non-employee option and warrant grants subject to vesting
terms, vested shares are recorded at fair value using the Black-Scholes
valuation model and the associated expense is recorded simultaneously or as the
services are provided. Common stock grants to non-employees for services are
valued at the stock market value on the date of issuance. For issued grants
subject to vesting or service requirements, expenses are deferred and recognized
over the more appropriate of the vesting period, or as services are
provided.
Key
assumptions used in valuing options issued during the three years ended
September 30, 2010, 2009, and 2008 are as follows:
|
Years Ended
September 30,
|
||||||||||||
|
2010
|
2009
|
2008
|
||||||||||
|
Risk
Free Rate of Return
|
1.41%-2.58 | % | 1.48%-2.69 | % | 2.30%-4.29 | % | ||||||
|
Volatility
|
95.6% | % | 88%-96 | % | 78%-88 | % | ||||||
|
Dividend
Yield
|
0 | % | 0 | % | 0 | % | ||||||
|
Expected
Life
|
5
yrs
|
.5-5
yrs
|
.5-5
yrs
|
|||||||||
The fair
value of the Company’s share-based compensation was estimated at the date of
grant using the Black-Scholes option-pricing model, assuming no dividends and
using the valuation assumptions noted in the table above. The risk-free rate is
based on the U.S. Treasury yield curve in effect at the time of grant. The
expected life (estimated period of time outstanding) of the stock options
granted was estimated using the historical exercise behavior of employees and
the option expiration date. The estimated volatility for option grants is the
historical volatility for the equivalent look back period for the expected life
of the grant. All volatility calculations were made on a daily
basis.
78
Share-based
compensation included in the results from continuing operations for the three
years ended September 30, 2010, 2009, and 2008 was as follows:
|
Years Ended
September 30,
|
||||||||||||
|
(In Thousands)
|
2010
|
2009
|
2008
|
|||||||||
|
Cost
of products sold
|
$ | 102 | $ | 81 | $ | 63 | ||||||
|
Officer
compensation
|
1,178 | 2,234 | 1,148 | |||||||||
|
Selling
and marketing
|
368 | 630 | 326 | |||||||||
|
Research
and development
|
91 | 834 | 532 | |||||||||
|
General
and administrative
|
940 | 928 | 586 | |||||||||
|
Totals
|
$ | 2,679 | $ | 4,707 | $ | 2,655 | ||||||
As of
September 30, 2010, there was $2.4 million of total unrecognized compensation
cost related to unamortized accrued share-based compensation arrangements
related to stock options consisting of $1.8 million related to employee grants
and $0.6 million related to consultant and director grants. The costs are
expected to be recognized over a weighted-average period of 2.2
years. Such amounts may change as a result of additional grants,
forfeitures, modifications in assumptions and other factors.
All of
our existing options are subject to time of service vesting or vesting on the
achievement of specific performance objectives. Our stock options
vest either on an annual or a quarterly basis for options subject to time of
service vesting, or on specific performance measurements for option vesting tied
to performance criteria. Compensation cost is generally calculated on
a daily basis over the requisite service period incorporating actual vesting
period dates, and includes expected forfeiture rates between 0% and
1.2%. Compensation cost is subsequently adjusted upon a termination
and actual forfeiture event, as appropriate.
In
January, 2009, the Company’s Board of Directors voted to approve a re-pricing of
all individuals continuing to provide ongoing services to the Company including
substantially all employee, director, and consultant stock
options. The Company treated the re-pricing as a modification of
terms of the options outstanding. The Company expensed the
incremental fair value for all vested and re-priced options during the year
ended September 30, 2009. The Company will continue to expense the
incremental fair value for unvested and re-priced options as these options are
vested. The fair value of the modification was determined as the
difference in the fair value of each option immediately before and after the
re-pricing using the Black-Scholes option-pricing model with a dividend rate of
0%, a risk free rate of 1.48%, a volatility of 96%, a life of 4 years, and a
market price of $0.30 per share. As a result of this re-pricing, the
Company expensed $554,000 during the year ended September 30, 2009, which is
included in the table above, for options which had vested prior to the
re-pricing.
In
September, 2009, the Company sold substantially all of the assets of its DeWind
subsidiary and terminated all of its DeWind employees as of September 4,
2009. For DeWind employees who remained as employees through
September 4, 2009 the Company accelerated the vesting of certain options granted
between 2007 and 2009 to provide for up to one year of additional option vesting
service credit and extended the option exercise period to September 4, 2010 for
all vested options held by these employees including any options subject to such
acceleration. All remaining unvested options for the DeWind employees
were cancelled. The acceleration of vesting resulted in an
additional 1,053,503 options vested which resulted in $834,000 in additional
expense, included in the loss from discontinued operations for the year ended
September 30, 2009. A total of 2,136,860 options with an intrinsic
value of $798,000, including the options subject to acceleration, had the
exercise period extended to September 4, 2010. A total of 718,140
options with an intrinsic value of $251,000 were unvested and cancelled on
September 4, 2009. For the years ended September 30, 2010, 2009 and
2008, all DeWind employee share-based compensation expense was reported in the
loss from discontinued operations in the amounts of $89,000, $1,784,000 and
$318,000, respectively (see further discussion at Note 2).
Tax
Effect related to Share-based Compensation Expense
US GAAP
provides that income tax effects of share-based payments are recognized in the
financial statements for those awards that will normally result in tax
deductions under existing tax law. Under current U.S. federal tax law, the
Company would receive a compensation expense deduction related to non-qualified
stock options only when those options are exercised and vested shares are
received. Accordingly, the financial statement recognition of compensation cost
for non-qualified stock options creates a deductible temporary difference which
results in a deferred tax asset and a corresponding deferred tax benefit in the
statement of operations. Due to the uncertainty surrounding the future utility
of the Company’s deferred tax assets, all deferred tax assets are fully reserved
as of September 30, 2010.
79
NOTE
12 – INCOME TAXES
The
provision for income taxes from continuing operations differs from the amount of
income tax determined by applying the applicable U.S. statutory federal income
tax rate of 34% to pre-tax loss from continuing operations as a result of the
following:
|
For the Years Ended September 30,
|
||||||||||||||||||||||||
|
(In Thousands)
|
2010
|
2009
|
2008
|
|||||||||||||||||||||
|
Statutory
regular federal tax rate
|
$
|
(7,075
|
)
|
34.0
|
%
|
$
|
(6,607
|
)
|
34.0
|
%
|
$
|
(3,427
|
)
|
34.0
|
%
|
|||||||||
|
Change
in valuation allowance
|
7,007
|
(33.7
|
)%
|
6,568
|
(33.8
|
)%
|
4,261
|
(42.3
|
)%
|
|||||||||||||||
|
State
tax, net of federal benefit
|
7
|
(0.0
|
)%
|
3
|
(0.0
|
)%
|
3
|
(0.0
|
)%
|
|||||||||||||||
|
Research credit
|
—
|
—
|
—
|
—
|
(633
|
)
|
6.3
|
%
|
||||||||||||||||
|
Other
|
75
|
(0.3
|
)%
|
41
|
(0.2
|
)%
|
(201
|
)
|
2.0
|
%
|
||||||||||||||
|
Income
tax expense
|
$
|
14
|
0.0
|
%
|
$
|
5
|
0.0
|
%
|
$
|
3
|
0.0
|
%
|
||||||||||||
Net
deferred tax assets from continuing operations comprised the following at
September 30, 2010 and 2009:
|
(In Thousands)
|
2010
|
2009
|
||||||
|
Deferred
tax assets:
|
||||||||
|
Net
operating loss carry-forwards and tax credits
|
$
|
45,650
|
$
|
39,440
|
||||
|
Warrants
issued for services
|
230
|
230
|
||||||
|
Share-based
compensation
|
4,650
|
3,670
|
||||||
|
Asset
reserves and provisions
|
1,040
|
1,180
|
||||||
|
Fixed
asset depreciation
|
(400
|
)
|
(40
|
) | ||||
|
Less:
Valuation allowance
|
(51,170
|
)
|
(44,480
|
)
|
||||
|
Net
deferred tax assets
|
$
|
—
|
$
|
—
|
||||
The
valuation allowance increased by $6.7 million and $7.3 million during 2010 and
2009, respectively. The increases were due to the full reservation of additional
deferred tax assets, primarily the additional net operating loss carry-forwards
generated from the Company’s annual net losses from continuing
operations.
In
assessing the realizability of the net deferred tax assets, management considers
whether it is more likely than not that some or all of the deferred tax assets
will not be realized. The ultimate realization of deferred tax assets depends
upon either the generation of future taxable income during the periods in which
those temporary differences become deductible or the carry-back of losses to
recover income taxes previously paid during the carry-back period. As of
September 30, 2010, the Company had provided a full valuation allowance to
reduce net deferred tax assets to zero.
Discontinued
Operations (see Note 2): The Company recognized an income tax expense of $1,000,
$0 and $21,000 for the years ended September 30, 2010, 2009 and 2008,
respectively. At September 30, 2010 and 2009, net deferred tax assets amounted
to $30,520,000 and $42,730,000, respectively, which are primarily comprised of
net operating loss carry-forwards. Consistent with continuing operations, the
Company has provided a full valuation allowance against the discontinued
operations net deferred tax assets, as discussed above.
As of
September 30, 2010 and 2009, the Company had consolidated net operating loss
(NOL) carry-forwards for federal and state income tax purposes of approximately
$117,105,000 and $106,930,000, and $109,007,000 and $114,545,000, respectively.
Federal NOL carry-forwards begin expiring in 2020 and state NOL carry-forwards
began to expire in 2010.
Utilization
of the NOL and R&D credit carry-forwards may be subject to a substantial
annual limitation due to ownership change limitations that may have occurred or
that could occur in the future, as required by Section 382 of the Internal
Revenue Code of 1986, as amended (the “Code”), as well as similar state and
foreign provisions. These ownership changes may limit the amount of NOL and
R&D credit carry-forwards that can be utilized annually to offset future
taxable income and tax, respectively. In general, an “ownership change” as
defined by Section 382 of the Code results from a transaction or series of
transactions over a three-year period resulting in an ownership change of more
than 50 percentage points of the outstanding stock of a company by certain
stockholders or public groups. Since the Company’s formation, the Company has
raised capital through the issuance of capital stock on several occasions which,
combined with the purchasing shareholders’ subsequent disposition of those
shares, may have resulted in such an ownership change, or could result in an
ownership change in the future upon subsequent disposition.
The
Company has not fully completed a study to assess whether an ownership change
has occurred or whether there have been multiple ownership changes since the
Company’s formation due to the complexity and cost associated with such a study,
and the fact that there may be additional such ownership changes in the future.
If the Company has experienced an ownership change at any time since its
formation, utilization of the NOL or R&D credit carry-forwards would be
subject to an annual limitation under Section 382 of the Code, which is
determined by first multiplying the value of the Company’s stock at the time of
the ownership change by the applicable long-term, tax-exempt rate, and then
could be subject to additional adjustments, as required. Any limitation may
result in expiration of a portion of the NOL or R&D credit carry-forwards
before utilization. Further, until a study is fully completed and any limitation
known, no amounts are being considered as an uncertain tax position or disclosed
as an unrecognized tax benefit under US GAAP rules. Due to the existence of the
valuation allowance, future changes in the Company’s unrecognized tax benefits
will not impact its effective tax rate. Any carry-forwards that will expire
prior to utilization as a result of such limitations will be removed from
deferred tax assets with a corresponding reduction of the valuation
allowance.
80
Under
current FASB provisions for accounting for uncertainty in income taxes, the
Company did not recognize any uncertain tax positions during the years ended
September 30, 2010, 2009 and 2008. As of September 30, 2010, the Company did not
increase or decrease the liability for unrecognized tax benefits related to tax
positions in prior periods nor did the Company increase the liability for any
tax positions in the current year. Furthermore, there were no adjustments to the
liability or lapse of statute of limitation or settlements with taxing
authorities. Refer to additional discussion in Note 1 “Income
Taxes”.
The
Company expects resolution of unrecognized tax benefits, if created, would occur
while the full valuation allowance of deferred tax assets is maintained;
therefore, the Company does not expect to have any unrecognized tax benefits
that, if recognized, would affect the effective tax rate.
NOTE
13 – COMMITMENTS AND CONTINGENCIES
Leases
We do not
own any real estate. We lease operations facilities in Irvine, California
and Beijing, China.
On
January 1, 2004 we commenced leasing a combination manufacturing and office
facility in Irvine, California. The original lease was for seven years amounting
to an average rental cost of $83,000 per month. On April 1, 2010, we
renegotiated and renewed the lease for an additional three years amounting to an
average rental cost of $69,000 per month with rent starting at $72,533 per month
for the first year and increasing by $2,102 on April 1 of each subsequent year
of the lease term..
On
September 9, 2010 we commenced leasing an office facility in Beijing, China at
approximately $6,700 per month over a twenty-six month term. The
lease contains no accelerations.
Additionally,
the Company leases office equipment with minimum payments of approximately
$1,726 per month. The office equipment leases expire through September
2013. Total rent expense was $995,000, $1,065,000, and $992,000 for
the years ended September 30, 2010, 2009, and 2008, respectively.
Future
minimum operating lease payments at September 30, 2010 are as
follows:
|
(In Thousands)
|
Year ending September 30,
|
Operating
Leases
|
||||
|
2011
|
$
|
963
|
||||
|
2012
|
1,004
|
|||||
|
2013
|
461
|
|||||
|
2014
|
—
|
|||||
|
2015
|
—
|
|||||
|
Thereafter
|
—
|
|||||
|
$
|
2,428
|
|||||
Professional
Services Agreements
The
Company and its CTC Cable subsidiary currently have one management consulting
agreement and two legal services agreements for professional services with
entities affiliated with its Director, Michael McIntosh as follows:
An
agreement between The Mcintosh Group (TMG) and CTC Cable to provide legal and
intellectual property services. This agreement is for $250,000 per
year, payable monthly, and is scheduled to expire December 31,
2012. This agreement may be terminated by either party upon thirty
days prior written notice.
An
agreement between Technology Management Advisors (TMA) and the Company to
provide management services related to the Company’s intellectual property and
management. This agreement is for $250,000 per year and is scheduled
to expire on October 31, 2012. The agreement may be terminated by
either party on each anniversary of the effective date of the
agreement.
An
agreement between TMG and the Company to provide legal and intellectual property
services. This agreement is for $250,000 per year, payable monthly,
and is scheduled to expire on October 31, 2012. This agreement may be
terminated by either party upon thirty days prior written notice.
81
NOTE
14 – LITIGATION
Below we
describe the legal proceedings we are currently involved in or which were
resolved during the fiscal year ended September 30, 2010 through the date we
prepared this report:
(i) The FKI related
matters:
FKI
PLC and FKI Engineering Ltd v. Stribog Ltd and De Wind GmbH
On or
about January 21, 2010, FKI Engineering Ltd. and FKI Engineering, formerly FKI
Plc., filed an action against Stribog Ltd., formerly DeWind Ltd., in the
Commercial Court, Queen’s Bench Division, United Kingdom (Case No. 2010 Folio
61). FKI’s claim is brought pursuant to an assignment agreement executed by the
insolvency administrator assigning FKI the right to pursue claims on behalf of
DeWind GmbH for amounts allegedly owed to DeWind GmbH from Stribog Ltd. In
particular, the claim alleges that Stribog Ltd. is in breach of an August 1,
2005 business transfer agreement where DeWind GmbH agreed to sell and DeWind
Ltd. agreed to purchase the assets of DeWind GmbH. FKI Engineering Ltd. and FKI
Ltd. claim that DeWind GmbH is owed approximately 46,681,543 Euros (US
$60,677,000 at November 30, 2010 exchange rates), which sum is comprised by a
claim for principal in the sum of Euros 28,346,590 plus Value Added Tax of Euros
4,542,181, together with either interest of Euros 13,792,772 as at 21 January
2010 (continuing at a daily rate of Euros 7,316.63) or, in the alternative,
statutory interest. Stribog Ltd. disputes that it owes any funds to DeWind GmbH
and is vigorously contesting the validity of this allegation. Amongst other
issues in dispute, the validity of the Assignment is currently subject to
proceedings in both the Luebeck court in Germany (commenced by the company
against FKI in September 2009) and the English courts (commenced by FKI in
January 2010). The Luebeck court is expected to determine the dispute in the
first half of 2011. Stribog also applied to stay the English proceedings on the
basis that the issue was first filed in the German courts. This stay was not
given in May 2010 but the Court of Appeal granted leave to appeal that decision
in October 2010, which is likely to be heard in February 2011.
Stribog
Ltd. (formerly DeWind Ltd.) v. FKI Plc. and FKI Engineering Ltd.
On
September 18, 2009 the Company’s wholly owned subsidiary, Stribog Ltd. (formerly
DeWind Ltd.), filed an action for negative declaration in the Court of Lubeck,
Germany against FKI Engineering Ltd. and FKI Ltd., formerly FKI Plc (“FKI”)
(Case No. 17 O256/09) to obtain a court’s declaration that FKI is not entitled
to any rights to rescission and claims against Stribog Ltd. pursuant to an
assignment agreement executed by the German Insolvency administrator of DeWind
GmbH assigning such rights to FKI. In its defense, FKI states (i) that the
license agreement dated August 1, 2005 and the following transfer of those
licenses for a purchase price of 500,000 Euros (US $650,000 at November 30, 2010
exchange rates) from DeWind GmbH to Stribog Ltd. in August 2008 could be
challenged, in particular as the transferred licenses would have a significant
higher value and (ii) that claims for damages could arise from a sale and
transfer agreement dated August 1, 2005. Any particular amount in this respect
was not provided by FKI. The Company believes that (i) fair market value was
paid for this intellectual property and that the transactions were conducted at
arm’s length, therefore any rights to rescission do not exist and (ii) that the
assignment agreement was invalid. Stribog Ltd. has not recorded a liability as
it is uncertain (i) whether the court decides that such rights to challenge the
transfer exist or not and whether the assignment of such rights to FKI is valid
and (ii) if the court decides that such rights can be claimed by FKI, whether
FKI will challenge the transfer accordingly.
Insolvency
of DeWind GmbH
On August
29, 2008 in Lubeck Local Court – Bankruptcy Court, Lubeck Germany, DeWind GmbH,
an indirect subsidiary of the Company, filed for voluntary insolvency in lieu of
a required recapitalization under German law of approximately 5,000,000 Euros
(US $6,499,000 at November 30, 20010 exchange rates) (Case No. 53a1E 8/08 ). The
DeWind GmbH subsidiary had limited operational function for the DeWind segment,
functioning solely to provide services on wind turbines that remained under
warranty and which warranties were entered into prior to June, 2005.
On
September 18, 2008 an insolvency receiver was appointed and set an initial
reporting date in December, 2008 and which was primarily procedural in nature.
No formal reporting has been received since December, 2008. Since the date of
insolvency, the insolvency receiver has, or is in the process of assigning all
actual and potential claims of DeWind GmbH including without limitation,
potential claims of DeWind GmbH against the Company’s remaining Stribog
subsidiaries, primarily Stribog Ltd, the Company’s remaining operating
subsidiary in the UK. On September 8, 2009, the insolvency receiver for DeWind
GmbH and FKI entered into an Agreement in regard to a Settlement of Claims in
which the insolvency receiver assigned any potential claim DeWind GmbH held
against the Company, DeWind, Inc. and related Company entities to FKI for
undisclosed consideration. All liabilities associated with these potential
claims are recorded in liabilities from discontinued operations. This assignment
has been disputed as discussed above.
82
(ii) The
Mercury related matters:
Composite
Technology Corporation and CTC Cable Corporation v. Mercury Cable & Energy,
LLC, Ronald Morris, Edward Skonezny, Wang Chen, and “Doe” Defendants 1-100
(“Mercury”)
On August
15, 2008 the Company filed suit in the Superior Court of the State of
California, County of Orange, Central Justice Center (Case No. 30-2008 00110633)
against the Mercury parties including multiple unknown “Doe” defendants,
expected to be named in discovery proceedings, claiming Breach of Contract,
Unfair Competition, Fraud, Intentional Interference with Contract, and
Injunctive Relief. Several of the Mercury parties had filed a claim under the
Company’s Chapter 11 bankruptcy proceedings which was settled during the
bankruptcy and which provided for certain payments for sales made to China. The
settlement agreement included non-compete agreements and stipulated the need to
maintain confidentiality for the Company’s technology, processes, and business
practices. The Company claims that the Mercury parties have taken actions, which
violate the Settlement Agreement and the Bankruptcy Court Order, including the
development of and attempting to market similar conductor products and misusing
confidential information and the Company further claims that the Settlement
Agreement was entered into with fraudulent intent. The Company claims that the
Mercury parties engaged in unlawful, unfair, and deceptive conduct and that
these actions were performed with malice and with intent to cause injury to the
Company. Discovery is underway and trial is currently scheduled for June,
2011.
CTC
Cable Corporation v. Mercury Cable & Energy, LLC, Energy Technology
International, General Cable Corporation, Diversified Composites, Ronald Morris,
Edward Skonezny, Wang Chen, and Todd Harris
On March
3, 2009, CTC Cable filed action against Mercury Cable for patent infringement in
the U.S. District Court, Central District of California, Southern Division (Case
No. SACV 09-261 DOC (MLGx)). CTC Cable believes upon information that the
Defendants have infringed, contributed to infringement of, and/or actively
induced infringement by itself and/or through its agents, unlawfully and
wrongfully making, using, offering to sell, and/or selling products and
materials embodying the patented invention within and outside the United States
without permission or license from CTC Cable. In response to this lawsuit,
Mercury requested the United States Patent and Trademark Office reexamine the
'162 and '319 patents and requested the Court to stay the patent and copyright
lawsuit pending the Patent Office's final reexamination of CTC's patents. The
Court granted Mercury's request to stay the lawsuit pending the Patent Office’s
final decisions. The reexamination has now been completed and all original
claims have been upheld with only minor amendments. No claims have been finally
rejected. The discovery stay has now been lifted and CTC Cable is in process of
discovery.
On
October 18, 2010 the Court approved the expansion of the complaint to include
additional defendants including additional Mercury subsidiaries, Mercury’s
strander, General Cable Corporation, Mercury’s core producer Diversified
Composites, and Individuals Morris, Harris, Chen, and Skonezny. The Company is
asking for actual damages, treble damages, attorneys fees, interest, costs and
injunctive relief. No estimate of such damages can be made at this time and no
accrual for the Company’s future fees and costs is included in the Company's
financial statements at September 30, 2010.
In
Re Composite Technology Corporation Derivative Litigation (Brad Thomas v. Benton
Wilcoxon, Michael Porter, Domonic J. Carney, Michael McIntosh, Stephen Bircher,
Rayna Limited, Keeley Services Limited, Ellsford Management Limited, Laikadog
Holdings Limited, James Carkulis, and Does 1 through 1000 (including D. Dean
McCormick, III, CPA as Doe 1, John P. Mitola, as Doe 2, and Michael K. Lee, as
Doe 3) and Nominal Defendant Composite Technology Corporation)
On June
26, 2009 Mr. Brad Thomas, alleged to be a shareholder of the Company, filed a
shareholder derivative complaint in the Superior Court of the State of
California, County of Orange (Case No. 30-2009-00125211) for damages and
equitable relief. Certain of the defendants are current directors and/or
officers or past officers of the Company. Under the Company’s articles of
incorporation and bylaws, the Company is obligated to provide for
indemnification for director and officer liability.
On
October 13, 2009, the Company and the individual defendants filed demurrers
(motions to strike) to the Complaint on the grounds that Plaintiff Thomas did
not make a written demand on the Company’s board of directors prior to filing
the Complaint as required under Nevada law and that any decisions made by the
individual director/office defendants in relation to the subject matter of the
Complaint are protected under the business judgment rule. Prior to the scheduled
hearing on the demurrer, Plaintiff Thomas filed a First Amended Complaint on or
about November 11, 2009 naming three additional current board members. In
addition, on October 20, 2009, the Company filed a Motion to Stay Discovery in
this matter on the grounds that Plaintiff Thomas should not be permitted to
conduct discovery until such time as the dispute over the sufficiency of the
First Amended Complaint is decided by the Court. On January 22, 2010, the
Company filed another demurrer (motion to strike) to the First Amended Complaint
on the same grounds as the original demurrers. On January 27, 2010, the Court
conducted a hearing on the merits of the demurrer and took the matter under
submission. On March 8, 2010, the Court overruled the demurrer and lifted the
stay on discovery. On March 25, 2010, Plaintiff Thomas filed a Second Amended
Complaint containing substantially the same allegations against the individual
defendants as the previous complaints. On July 19, 2010, the Company filed a
Motion for Judgment on the Pleadings seeking to dismiss the action in its
entirety. On September 7, 2010 the Court heard oral arguments on the Defendants’
Motion for Preliminary Injunction to Enjoin Plaintiff From Service as the
Shareholder Representative of the Company, heard concurrently with the Court’s
own Motion to Review Plaintiff’s Standing. On October 28, 2010 the Honorable
David R. Chaffee dismissed the complaint with prejudice and noted Mercury’s
involvement in the matter.
83
NOTE
15 – RELATED PARTY TRANSACTIONS
As
discussed in Note 13, the Company maintains professional services agreements
with two companies affiliated with a member of the board of
directors.
For the
year ended September 30, 2010 we recorded fees of $458,000 and patent filing
fees of $86,000 for TMG, and fees of $250,000 and incidental expenses of $95,000
for TMA. For the year ended September 30, 2009 we recorded fees of $250,000 and
patent filing fees of $70,000 for TMG, and fees of $250,000 and incidental
expenses of $70,000 for TMA. All of these expenses were recorded to Research and
Development expense.
At
September 30, 2010 the Company had outstanding balances due to TMG and TMA of
$86,000 and $54,000 respectively, included in accounts payable. At September 30,
2009 the Company had outstanding balances due to TMG and TMA of $41,000 and
$24,000 respectively, included in accounts payable.
NOTE
16 – SEGMENT INFORMATION
As of
September 30, 2010, we manage and report our operations through one business
segment: CTC Cable. During the year ended September 30, 2009 we revised our
segments to reflect the disposal of DeWind. DeWind comprised our previously
reported Wind segment, which has been presented as discontinued operations in
our consolidated financial statements (see Note 2). When applicable, segment
data is organized on the basis of products. Historically, the Company evaluates
the performance of its operating segments primarily based on revenues and
operating income, any transactions between reportable segments are eliminated in
the consolidation of reportable segment data.
Located
in Irvine, California with sales personnel located near Portland, Oregon and
Atlanta, Georgia and Texas, CTC Cable produces and sells ACCC®
conductor and related ACCC® hardware
products for the electrical transmission market. ACCC®
conductor production is a two step process. The Irvine operations produce the
high capacity, energy efficient, light weight, patented composite ACCC® core,
which is then shipped to one of eight conductor standing partners in the U.S.,
Belgium, China, Indonesia, Bahrain, Argentina or Colombia where the core is
stranded with conductive aluminum to become ACCC®
conductor. ACCC®
conductor is sold in North America directly by CTC Cable to utilities and
through a license and distribution agreement with Alcan Cable. ACCC®
conductor is sold elsewhere in the world directly to utilities as well as
through license and distribution agreements or other agreements with Lamifil in
Belgium, Midal Cable in Bahrain, Far East Composite Cable Co. in China, through
two Indonesian companies, PT KMI Wire and Cable and PT Tranka Kabel, IMSA in
Argentina and Centelsa in Colombia. ACCC®
conductor has been sold commercially since 2005 and is currently marketed
worldwide to electrical utilities, transmission companies and transmission
design/engineering firms.
The
Company operates and markets its services and products on a worldwide
basis:
|
For the Years Ended September 30,
|
||||||||||||
|
(In Thousands)
|
2010
|
2009
|
2008
|
|||||||||
|
Europe
|
$ | 145 | $ | 873 | $ | 6,896 | ||||||
|
China
|
181 | 10,499 | 24,900 | |||||||||
|
Middle
East
|
606 | 1,445 | — | |||||||||
|
Other
Asia
|
3,860 | 422 | — | |||||||||
|
North
America
|
4,309 | 5,409 | 851 | |||||||||
|
South
America
|
1,741 | 26 | 68 | |||||||||
|
Latin
America
|
— | 928 | — | |||||||||
|
Total
Revenue
|
$ | 10,842 | $ | 19,602 | $ | 32,715 | ||||||
All
long-lived assets, comprised of property and equipment, are located in the
United States.
For the
year ended September 30, 2010, six customers represented 82% of revenue (two in
Indonesia at 31%, two in the U.S. at 30%, one in Chile at 15% and one in the
Middle East at 6%). For the year ended September 30, 2009, three
customers represented 78% of revenue (one in China at 54%, one in Canada at 17%
and one in the Middle East at 7%). For the year ended September 30,
2008, two customers represented 96% of revenue (one in China at 76% and one in
Europe at 20%). No other customer represented greater than 5% of
consolidated revenue.
NOTE
17 – SUBSEQUENT EVENTS (Unaudited)
Subsequent
to year-end, the Company and our Senior Secured Loan lender agreed to amendments
of the debt covenants resulting in a temporary waiver to its debt covenants
(refer to Note 9).
84
NOTE
18 – SUPPLEMENTAL FINANCIAL INFORMATION (Unaudited)
Supplemental
Quarterly Financial Information
(In
Thousands)
|
Fiscal year ended September 30, 2010
|
December 31
|
March 31
|
June 30
|
September 30
|
||||||||||||
|
Revenue
|
$
|
2,701
|
$
|
4,252
|
$
|
583
|
$
|
3,306
|
||||||||
|
Gross
profit (loss)
|
218
|
1,011
|
(159
|
)
|
930
|
|||||||||||
|
Loss
from continuing operations before income taxes
|
(6,472
|
)
|
(5,535
|
)
|
(5,780
|
)
|
(3,022
|
)
|
||||||||
|
Net
loss from continuing operations
|
(6,486
|
)
|
(5,535
|
)
|
(5,780
|
)
|
(3,022
|
)
|
||||||||
|
Income
(loss) from discontinued operations
|
(1,222
|
)
|
2,307
|
2,376
|
(2,405
|
)
|
||||||||||
|
Net
loss
|
(7,708
|
)
|
(3,228
|
)
|
(3,404
|
)
|
(5,427
|
)
|
||||||||
|
Basic
and diluted loss per share - continuing operations
|
(0.02
|
)
|
(0.02
|
)
|
(0.02
|
)
|
(0.01
|
)
|
||||||||
|
Basic
and diluted income (loss) per share - discontinued
operations
|
(0.01
|
)
|
0.01
|
0.01
|
(0.01
|
)
|
||||||||||
|
Total
basic and diluted loss per share
|
$
|
(0.03
|
)
|
$
|
(0.01
|
)
|
$
|
(0.01
|
)
|
$
|
(0.02
|
)
|
||||
|
Fiscal year ended September 30, 2009
|
December 31
|
March 31
|
June 30
|
September 30
|
||||||||||||
|
Revenue
|
$
|
4,360
|
$
|
6,202
|
$
|
3,562
|
$
|
5,478
|
||||||||
|
Gross
profit
|
1,278
|
2,152
|
631
|
1,256
|
||||||||||||
|
Loss
from continuing operations before income taxes
|
(4,201
|
)
|
(3,828
|
)
|
(4,469
|
)
|
(6,935
|
)
|
||||||||
|
Net
loss from continuing operations
|
(4,204
|
)
|
(3,828
|
)
|
(4,469
|
)
|
(6,937
|
)
|
||||||||
|
Loss
from discontinued operations
|
(4,132
|
)
|
(6,825
|
)
|
(22,456
|
)
|
(20,900
|
)
|
||||||||
|
Net
loss
|
(8,336
|
)
|
(10,653
|
)
|
(26,925
|
)
|
(27,837
|
)
|
||||||||
|
Basic
and diluted loss per share - continuing operations
|
(0.02
|
)
|
(0.01
|
)
|
(0.02
|
)
|
(0.02
|
)
|
||||||||
|
Basic
and diluted loss per share - discontinued operations
|
(0.01
|
)
|
(0.03
|
)
|
(0.07
|
)
|
(0.08
|
)
|
||||||||
|
Total
basic and diluted loss per share
|
$
|
(0.03
|
)
|
$
|
(0.04
|
)
|
$
|
(0.09
|
)
|
$
|
(0.10
|
)
|
||||
ITEM
9 - CHANGES IN AND DISAGREEMENTS WITH ACCOUNTANTS ON ACCOUNTING AND FINANCIAL
DISCLOSURE
None.
ITEM
9A - CONTROLS AND PROCEDURES
Evaluation
of Disclosure Controls and Procedures
Our
management, with the participation of our Chief Executive Officer and Chief
Financial Officer, evaluated the effectiveness of our disclosure controls and
procedures, as defined in Rules 13a-15(e) and 15d-15(e) under the Exchange Act
of 1934. Disclosure controls and procedures are controls and other procedures of
a company that are designed to ensure that information required to be disclosed
by a company in the reports that it files or submits under the Exchange Act is
recorded, processed, summarized and reported, within the time periods specified
in the SEC’s rules and forms. Disclosure controls and procedures include,
without limitation, controls and procedures designed to ensure that information
required to be disclosed by a company in the reports that it files or submits
under the Exchange Act is accumulated and communicated to the company’s
management, including its principal executive and principal financial officers,
as appropriate to allow timely decisions regarding required disclosure.
Management recognizes that any controls and procedures, no matter how well
designed and operated, can provide only reasonable assurance of achieving their
objectives and management necessarily applies its judgment in evaluating the
cost-benefit relationship of possible controls and procedures. Based on that
evaluation, our Chief Executive Officer and Chief Financial Officer concluded
that our disclosure controls and procedures were ineffective as of September 30,
2010 because of the material weaknesses identified below.
Management's
Annual Report on Assessment of Internal Control over Financial
Reporting
The
management of the Company is responsible for establishing and maintaining
adequate internal control over financial reporting for the Company. Internal
control over financial reporting is defined in Rule 13a-15(f) and 15d-15(f)
promulgated under the Securities Exchange Act of 1934 as a process designed by,
or under the supervision of, the Company’s principal executive and principal
financial officers and effected by the Company’s Board of Directors, management
and other personnel, to provide reasonable assurance regarding the reliability
of financial reporting and the preparation of financial statements for external
purposes in accordance with U.S. Generally Accepted Accounting Principles and
includes those policies and procedures that:
85
|
|
•
|
Pertain to the maintenance of
records that in reasonable detail accurately and fairly reflect the
transactions and dispositions of the assets of the
Company;
|
|
|
•
|
Provide reasonable assurance that
transactions are recorded as necessary to permit preparation of financial
statements in accordance with U.S. Generally Accepted Accounting
Principles, and that receipts and expenditures of the Company are being
made only in accordance with authorizations of management and directors of
the Company; and
|
|
|
•
|
Provide reasonable assurance
regarding prevention or timely detection of unauthorized acquisition, use
or disposition of the Company’s assets that could have a material effect
on the financial statements.
|
Because
of its inherent limitations, internal control over financial reporting may not
prevent or detect misstatements. Projections of any evaluation of effectiveness
to future periods are subject to the risk that controls may become inadequate
because of changes in conditions, or that the degree of compliance with the
policies or procedures may deteriorate.
The
Company’s management assessed the effectiveness of the Company’s internal
control over financial reporting as of September 30, 2010. In making this
assessment, the Company’s management used the criteria set forth in the
framework established by the Committee of Sponsoring Organizations of the
Treadway Commission (COSO) entitled “Internal Control – Integrated
Framework.”
Based on
their assessment, management concluded that, as of September 30, 2010, the
Company’s internal control over financial reporting is not effective based on
those criteria, because of the material weaknesses identified
below.
A
material weakness is a deficiency, or a combination of deficiencies, in internal
control over financial reporting, such that there is a more than remote
likelihood that a material misstatement of the company’s annual or interim
financial statements will not be prevented or detected on a timely
basis.
During
management's annual review of our internal control over financial reporting, we
determined the following processes contain material weaknesses as of September
30, 2010:
|
|
·
|
Inventory costing and management process
over on-hand inventory and inventory on
consignment
|
|
|
·
|
Information technology controls
and related systems
|
|
|
·
|
Financial close and
reporting
|
These
material weaknesses related to the entity as a whole affect all of our
significant accounts and could result in a material misstatement to our annual
or interim consolidated financial statements that would not be prevented or
detected.
During
the year ended September 30, 2010, the Company improved certain internal
controls over financial reporting related to material weaknesses that were
identified as of September 30, 2009, as follows:
|
(1)
|
During
fiscal 2010, the Company improved its controls over fixed assets by
implementing an annual physical observation process to verify existence
and completeness of fixed assets.
|
|
(2)
|
During
fiscal 2010, the Company improved its controls over financial reporting by
improving its segregation of duties involving shifting certain accounting
and reporting responsibilities from the principal accounting officer and
between the Controller and Director of Finance, as well as adding a review
and approval process to all accounting transactions and quarterly
reporting information. Additionally, senior accounting personnel and the
principal accounting officer are required to review complex, non-routine
transactions to evaluate and approve the accounting treatment for such
transactions.
|
|
(3)
|
In
January 2010, the Company implemented a share-based compensation
and equity administration software system. Transactions are now processed
and reported by the accounting department, our legal department reviews
contractual terms, and accounting executives perform a complete review of
inputs and outputs prior to recording in the general
ledger.
|
|
(4)
|
In
March 2010, the Company implemented a financial planning and
analysis (FP&A) process, which included creating a complete
consolidated and departmental fiscal 2010 annual budget. Departmental and
executive management are now reviewing budget to actual data on a monthly
basis. Additionally, accounting management reviews the FP&A results,
assists with the process and records accounting adjustments when
appropriate.
|
86
|
(5)
|
In
October 2008, the Company completed an important phase of the upgrade to
its accounting and manufacturing IT systems to more adequately track and
maintain inventory quantities and to automate manufacturing and inventory
variances. Accounting controls over perpetual inventory and manufacturing
variances based on this IT upgrade were successfully implemented in fiscal
2010. In connection with this improvement, we added system driven matching
controls over the receiving function for inventory parts and supplies,
including tolerances for inventory related pricing and quantities
received.
|
|
(6)
|
In
fiscal 2010, the Company implemented a purchasing reporting process to
enable management review. All purchases are reviewed by
management.
|
The
Company's management has identified the steps necessary to address the material
weaknesses existing as of September 30, 2010 described above, as
follows:
(1)
Hiring additional accounting and operations personnel and engaging outside
contractors with technical accounting expertise, as needed, and reorganizing the
accounting and finance department to ensure that accounting personnel with
adequate experience, skills and knowledge relating to complex, non-routine
transactions are directly involved in the review and accounting evaluation of
our complex, non-routine transactions;
(2)
Involving both internal accounting and operations personnel and outside
contractors with technical accounting expertise, as needed, early in the
evaluation of a complex, non-routine transaction to obtain additional guidance
as to the application of generally accepted accounting principles to such a
proposed transaction;
(3)
Documenting to standards established by senior accounting personnel and the
principal accounting officer the review, analysis and related conclusions with
respect to complex, non-routine transactions;
(4)
Evaluating an internal audit function in relation to the Company's financial
resources and requirements;
(5)
Investing in additional enhancements to our IT systems including enhancements to
processing manufacturing and inventory transactions, and security over user
access and administration;
(6)
Creating policy and procedures manuals for the accounting, finance and IT
functions; and
(7)
Improving our purchasing and accounts payable cycle controls.
The
Company began to execute the remediation plans identified above in the first
fiscal quarter of 2011. These remediation efforts are expected to continue
through fiscal 2011.
SingerLewak
LLP, our independent registered public accounting firm, has issued an audit
report on the Company's internal control over financial reporting as of
September 30, 2010. The report on the audit of internal control over financial
reporting appears in this Annual Report on Form 10-K, Item 8.
Changes
in Internal Control over Financial Reporting
There was
no change in our internal control over financial reporting during the fourth
quarter ended September 30, 2010 that has materially affected, or is reasonably
likely to materially affect, our internal control over financial reporting.
During fiscal 2010, certain other improvements in our internal control over
financial reporting were implemented as noted above.
ITEM
9B - OTHER INFORMATION
None.
87
PART
III
ITEM
10 - DIRECTORS, EXECUTIVE OFFICERS AND CORPORATE GOVERNANCE
The
information required by Item 10 of Form 10-K is incorporated by reference from
the information contained in the sections captioned "DIRECTORS AND EXECUTIVE
OFFICERS", "CORPORATE GOVERNANCE" and "SECTION 16(A) BENEFICIAL OWNERSHIP
REPORTING COMPLIANCE" in the Proxy Statement that will be filed with the SEC no
later than 120 days after the close of fiscal 2010 and delivered to our
shareholders in connection with our March 1, 2011 Annual Meeting of
Shareholders.
ITEM
11 - EXECUTIVE COMPENSATION
The
information required by Item 11 of Form 10-K is incorporated by reference from
the information contained in the section captioned "EXECUTIVE COMPENSATION:
COMPENSATION DISCUSSION AND ANALYSIS" in the Proxy Statement that will be filed
with the SEC no later than 120 days after the close of fiscal 2010 and delivered
to our shareholders in connection with our March 1, 2011 Annual Meeting of
Shareholders.
ITEM
12 - SECURITY OWNERSHIP OF CERTAIN BENEFICIAL OWNERS AND MANAGEMENT AND RELATED
SHAREHOLDER MATTERS
The
information required by Item 12 of Form 10-K is incorporated by reference from
the information contained in the section captioned "SECURITY OWNERSHIP OF
CERTAIN BENEFICIAL OWNERS AND MANAGEMENT AND RELATED SHAREHOLDER MATTERS" in the
Proxy Statement that will be filed with the SEC no later than 120 days after the
close of fiscal 2010 and delivered to our shareholders in connection with our
March 1, 2011 Annual Meeting of Shareholders.
ITEM
13 - CERTAIN RELATIONSHIPS AND RELATED TRANSACTIONS, AND DIRECTOR
INDEPENDENCE
The
information, if any, required by Item 13 of Form 10-K is incorporated by
reference from the information contained in the sections captioned "CORPORATE
GOVERNANCE" and "CERTAIN RELATIONSHIPS AND RELATED TRANSACTIONS" in the Proxy
Statement that will be filed with the SEC no later than 120 days after the close
of fiscal 2010 and delivered to our shareholders in connection with our March 1,
2011 Annual Meeting of Shareholders.
ITEM
14 - PRINCIPAL ACCOUNTANT FEES AND SERVICES
The
information required by Item 14 of Form 10-K is incorporated by reference from
the information contained in the section captioned "INDEPENDENT ACCOUNTANTS" in
the Proxy Statement that will be filed with the SEC no later than 120 days after
the close of fiscal 2010 and delivered to our shareholders in connection with
our March 1, 2011 Annual Meeting of Shareholders.
PART
IV
ITEM
15 - EXHIBITS, FINANCIAL STATEMENT SCHEDULES
The
following documents are filed as part of this report:
(1)
Financial Statements. See Index to Consolidated Financial Statements under Item
8 above.
(2)
Financial Statement Schedule. See Schedule II - Valuation and Qualifying
Accounts and Reserves in this section of this 10-K.
(3)
Exhibits. See Index to Exhibits following the signatures to this
report.
88
COMPOSITE
TECHNOLOGY CORPORATION AND SUBSIDIARIES
SCHEDULE
II — VALUATION AND QUALIFYING ACCOUNTS
FOR
EACH FISCAL YEAR IN THE THREE YEAR PERIOD
ENDED
SEPTEMBER 30, 2010
(In
Thousands)
|
Balance at
beginning
of year
|
Reserves
Acquired
|
Additions
charged to
costs and
expenses
|
Payment or
utilization
|
Balance at
end of year
|
|||||||||||
|
FY2010
|
|||||||||||||||
|
Allowance
for doubtful accounts
|
$
|
81
|
$
|
—
|
$
|
162
|
$
|
(26
|
)
|
$
|
217
|
||||
|
Inventory
reserve
|
923
|
—
|
935
|
(603
|
)
|
1,255
|
|||||||||
|
Warranty
reserve
|
564
|
—
|
265
|
(305
|
)
|
524
|
|||||||||
|
FY2009
|
|||||||||||||||
|
Allowance
for doubtful accounts
|
$
|
—
|
$
|
—
|
$
|
81
|
$
|
—
|
$
|
81
|
|||||
|
Inventory
reserve
|
978
|
—
|
223
|
(278
|
)
|
923
|
|||||||||
|
Warranty
reserve
|
219
|
—
|
513
|
(168
|
)
|
564
|
|||||||||
|
FY2008
|
|||||||||||||||
|
Allowance
for doubtful accounts
|
$
|
—
|
$
|
—
|
$
|
—
|
$
|
—
|
$
|
—
|
|||||
|
Inventory
reserve
|
376
|
—
|
602
|
—
|
978
|
||||||||||
|
Warranty
reserve
|
—
|
—
|
259
|
(40
|
)
|
219
|
|||||||||
89
SIGNATURES
Pursuant
to the requirements of Section 13 or 15(d) of the Securities Exchange Act of
1934, the registrant has duly caused this report to be signed on its behalf by
the undersigned, thereunto duly authorized.
COMPOSITE
TECHNOLOGY CORPORATION
(Registrant)
|
/s/
Benton H Wilcoxon
|
|
Benton
H Wilcoxon
|
|
Chief
Executive Officer
|
Date:
December 14, 2010
|
/s/
Domonic J. Carney
|
|
Domonic
J. Carney
|
|
Chief
Financial Officer
|
Date: December
14, 2010
Pursuant
to the requirements of the Securities Exchange Act of 1934, this report has been
signed below by the following persons on behalf of the registrant and in the
capacities and on the dates indicated.
|
/s/
Benton H Wilcoxon
|
|
Benton
H Wilcoxon
|
|
Chief
Executive Officer and
|
|
Chairman
(Principal Executive Officer)
|
Date:
December 14, 2010
|
/s/
Domonic J. Carney
|
|
Domonic
J. Carney
|
|
Chief
Financial Officer (Principal Financial and Accounting
Officer)
|
Date:
December 14, 2010
|
/s/ D. Dean
McCormick III
|
|
D. Dean
McCormick III
|
|
Director
|
Date:
December 14, 2010
|
/s/
Michael D. McIntosh
|
|
Michael
D. McIntosh
|
|
Director
|
Date:
December 14, 2010
|
/s/
Dennis C. Carey
|
|
Dennis
C. Carey
|
|
Director
|
Date:
December 14, 2010
90
|
/s/
Michael Lee
|
|
Michael
Lee
|
|
Director
|
Date: December 14,
2010
91
EXHIBIT
INDEX
|
Number
|
Description
|
|
|
2.1
(8)
|
Asset
Purchase Agreement by and between Daewoo Shipbuilding & Marine
Engineering Co. Ltd. and DeWind, Inc. and the Registrant dated as of
August 10, 2009.
|
|
|
2.2
(8)
|
Asset
Purchase Agreement by and between Daewoo Shipbuilding & Marine
Engineering Co. Ltd. and DeWind, Ltd. dated as of August 10,
2009.
|
|
|
2.3
(9)
|
Amendment
No. 1 dated as of September 4, 2009 to the Asset Purchase
Agreement by and between Daewoo Shipbuilding & Marine
Engineering Co. Ltd. and DeWind, Inc. and the Registrant dated as of
August 10, 2009.
|
|
|
2.4
(9)
|
Amendment
No. 1 dated as of September 4, 2009 by and between Daewoo Shipbuilding
& Marine Engineering Co. Ltd. and DeWind, Ltd. dated as of August 10,
2009.
|
|
|
3.1(1)
|
Articles
of Incorporation of the Company.
|
|
|
3.2(2)
|
Certificate
of Amendment to Articles of Incorporation.
|
|
|
3.3(3)
|
Bylaws
of Composite Technology Corporation, as modified January 6,
2006.
|
|
|
10.1(4)
|
Promotion
Letter, executed on September 3, 2008, by and between Composite Technology
Corporation and Robert Rugh.
|
|
|
10.2
(5)
|
Letter
Agreement with Michael K. Lee.
|
|
|
10.3
(5)
|
Option
Agreement with Michael K. Lee.
|
|
|
10.4
(6)
|
Form
of 2002 Non-Qualified Stock Compensation Plan Master Option Agreement.
|
|
|
10.5
(6)
|
Form
of 2002 Non-Qualified Stock Compensation Plan Stock Option Notice of
Modification and Reissuance.
|
|
|
10.6 (6)
|
Form
of 2008 Stock Option Plan Stock Option Grant Notice.
|
|
|
10.7 (6)
|
Form
of 2008 Stock Option Plan Master Option Agreement.
|
|
|
10.8
(7)
|
Loan
Agreement dated as of June 30, 2009.
|
|
|
10.9
(7)
|
Promissory
Note dated as of June 30, 2009.
|
|
|
10.10 (7)
|
Form
of Warrant to purchase common stock.
|
|
|
10.11 (7)
|
Security
Agreement dated as of June 30, 2009.
|
|
|
10.12
(7)
|
Stock
Pledge Agreement (including form of Irrevocable Proxy) dated as of June
30, 2009.
|
|
|
10.13 (7)
|
Subsidiary
Guaranty dated as of June 30, 2009.
|
|
|
10.14 (7)
|
Grant
of Security Interest in Trademarks between the Lender and the Company
dated as of June 30, 2009.
|
|
|
10.15 (7)
|
Grant
of Security Interest in Patents between the Lender and CTC Cable
Corporation dated as of June 30, 2009.
|
|
|
10.16 (7)
|
Grant
of Security Interest in Copyright between the Lender and CTC Cable
Corporation dated as of June 30, 2009.
|
|
|
10.17
(7)
|
Grant
of Security Interest in Trademarks between the Lender and CTC Cable
Corporation dated as of June 30, 2009.
|
|
|
10.18 (7)
|
Grant
of Security Interest in Patents between the Lender and DeWind, Inc. dated
as of June 30, 2009.
|
|
|
10.19
(9)
|
Escrow
Agreement dated as of September 4, 2009 by and among Daewoo Shipbuilding
& Marine Engineering Co. Ltd., DeWind, Inc., the Registrant and U.S.
Bank National Association, as escrow
agent.
|
92
|
10.20
(9)
|
Trademark
Assignment Agreement dated as of September 4, 2009 by and among the
Registrant and DeWind Turbine Co., a wholly-owned subsidiary of
DSME.
|
|
|
10.21
(10)
|
Offer
letter between the Registrant and John Brewster dated December 14,
2009.
|
|
|
10.22
(11)
|
Loan
and Security Agreement among the Company, CTC Cable Corporation, CTC
Renewables Corporation and PARTNERS FOR GROWTH II, L.P. dated as of April
12, 2010.
|
|
|
10.23
(11)
|
Warrant
Purchase Agreement between the Company and PARTNERS FOR GROWTH II, L.P.
dated April 12, 2010.
|
|
|
10.24
(11)
|
Intellectual
Property Security Agreement among the Company, CTC Cable Corporation, CTC
Renewables Corporation and PARTNERS FOR GROWTH II, L.P. dated April 12,
2010.
|
|
|
10.25
(12)
|
Form
of 2010 Composite Technology Corporation Omnibus Incentive
Plan.
|
|
|
10.26
(12)
|
Cross-Corporate
Continuing Guaranty and Security Agreement among the Company, CTC Cable
Corporation, CTC Renewables Corporation and Stribog, Inc. dated April 12,
2010.
|
|
|
10.27
(12)
|
Warrants
related to Warrant Purchase Agreement between the Company and PARTNERS FOR
GROWTH II, L.P. dated April 12, 2010.
|
|
|
10.28
(13)
|
Offer
letter by the Registrant to Stewart Ramsay effective as of August 16,
2010.
|
|
|
10.29
(14)
|
Letter
Agreement between the Registrant and Dennis C. Carey.
|
|
|
10.30
(14)
|
Option
Agreement between the Registrant and Dennis C. Carey.
|
|
|
10.31
(14)
|
Confidential
Information and Inventions Assignment Agreement between the Registrant and
Dennis C. Carey.
|
|
|
10.32
(14)
|
Resignation
letter of John Mitola from Independent Directorship of the
Registrant.
|
|
|
18.1
(15)
|
Preferability
Letter of SingerLewak LLP regarding
a change in accounting estimate effected by a change in accounting
principal.
|
|
| 21.1 (11) | List of Subsidiaries of Registrant | |
|
23.1
(15)
|
Consent
of SingerLewak LLP.
|
|
|
31.1
(15)
|
Rule
13a-14(a) / 15d-14(a)(4) Certification of Chief Executive
Officer.
|
|
|
31.2
(15)
|
Rule
13a-14(a) / 15d-14(a)(4) Certification of Chief Financial
Officer.
|
|
|
32.1
(15)
|
Section
1350 Certification of Chief Executive Officer.
|
|
|
32.2
(15)
|
Section
1350 Certification of Chief Financial
Officer.
|
(1)
Incorporated herein by reference to Form 10-KSB filed as a Form 10-KT with the
U. S. Securities and Exchange Commission on February 14, 2002.
(2)
Incorporated herein by reference to Form 8-K filed with the U.S. Securities and
Exchange Commission on December 18, 2007.
(3)
Incorporated herein by reference to Form 8-K filed with the U.S. Securities and
Exchange Commission on January 12, 2006.
(4)
Incorporated herein by reference to Form 8-K filed with the U.S. Securities and
Exchange Commission on September 9, 2008.
(5)
Incorporated herein by reference to Form 8-K filed with the U.S. Securities and
Exchange Commission on January 26, 2009.
(6)
Incorporated herein by reference to Form 8-K filed with the U.S. Securities and
Exchange Commission on February 10, 2009.
(7)
Incorporated herein by reference to Form 8-K filed with the U.S. Securities and
Exchange Commission on July 7, 2009.
93
(8)
Incorporated herein by reference to Form 8-K filed with the U.S. Securities and
Exchange Commission on August 14, 2009; and to Form 8-K/A filed with the U.S.
Securities and Exchange Commission on December 8, 2010.
(9)
Incorporated herein by reference to Form 8-K filed with the U.S. Securities and
Exchange Commission on September 11, 2009; and to Form 8-K/A filed with the U.S.
Securities and Exchange Commission on December 8, 2010.
(10)
Incorporated herein by reference to Form 8-K filed with the U.S. Securities and
Exchange Commission on December 18, 2009.
(11)
Incorporated herein by reference to Form 8-K filed with the U.S. Securities and
Exchange Commission on April 16, 2010.
(12)
Incorporated herein by reference to Form 8-K filed with the U.S. Securities and
Exchange Commission on April 30, 2010.
(13)
Incorporated herein by reference to Form 8-K filed with the U.S. Securities and
Exchange Commission on August 20, 2010.
(14)
Incorporated herein by reference to Form 8-K filed with the U.S. Securities and
Exchange Commission on September 13, 2010.
(15)
Filed herewith.
94