Attached files
| file | filename |
|---|---|
| 8-K - FORM 8-K - REGAL BELOIT CORP | d8k.htm |
| EX-99.1 - NEWS RELEASE OF REGAL BELOIT CORPORATION DATED DECEMBER 13, 2010 - REGAL BELOIT CORP | dex991.htm |
 John
M. Perino Vice President
Investor Relations
December 13, 2010
Charles A. Hinrichs
Vice President
Chief Financial Officer
Mark J. Gliebe
President
Chief Operating Officer
Henry Knueppel
Chairman
Chief Executive Officer
Regal Beloit’s acquisition of A.O. Smith’s
Electrical Products Company
A Strategically Important
Acquisition
Exhibit 99.2 |
 1
Safe Harbor Statement
This presentation
contains
“forward-looking
statements”
as
defined
in
the
Private
Securities
Litigation
Reform Act of 1995.
Forward-looking statements represent our management’s judgment regarding
future events. In many cases, you can identify forward-looking statements by
terminology such as “may,”
“will,”
“plan,”
“expect,”
“anticipate,”
“estimate,”
“believe,”
or “continue”
or the negative of these terms or other similar words.
Actual results and events could differ materially and adversely from those contained in
the forward-looking statements due to a number of factors, including:
our
ability
to
timely
and
successfully
consummate
the
acquisition
of
EPC,
including
the
ability
to
satisfy
all
of
the
conditions
precedent
to
consummation
of
the transaction;
our
ability
to
timely
and
successfully
realize
the
potential
synergies
of
the
EPC
transaction;
economic
changes
in
global
markets where we
do business, such as reduced demand for products we sell, weakness in the housing and
commercial real estate markets, currency exchange rates, inflation rates,
interest rates, recession, foreign government policies and other external factors that we cannot control; unanticipated fluctuations in commodity prices
and raw material costs; cyclical downturns affecting the global market for capital
goods; unexpected issues, costs or liabilities arising from the acquisition and
integration of
EPC
and
other
acquired
companies
and
businesses,
or
the
effects
of
purchase
accounting
that
may
be
different
than
expected;
marketplace acceptance of new and existing products including the loss of, or a decline
in business from, any significant customers; the impact of capital market
transactions that we may effect; the availability and effectiveness of our information technology systems; unanticipated costs associated with
litigation matters; actions taken by our competitors, including new product
introductions or technological advances, and other events affecting our industry
and competitors; difficulties in staffing and managing foreign operations; other
domestic and international economic and political factors unrelated to our
performance, such as the current substantial weakness in economic and business
conditions; and other risks and uncertainties including but not limited to those
described in Item 1A-Risk Factors of the Company’s Annual Report on Form 10-K filed on March 2, 2010 and from time to time in our reports filed with
U.S.
Securities
and
Exchange
Commission.
All
subsequent
written
and
oral
forward-looking
statements
attributable
to
us
or
to
persons
acting
on
our
behalf
are expressly qualified in their entirety by the applicable cautionary
statements. The forward-looking statements included in this presentation are made only
as of
their
respective
dates,
and
we
undertake
no
obligation
to
update
these
statements
to
reflect
subsequent
events
or
circumstances.
See
also
Item 1A -
Risk Factors in the Company’s Annual Report on Form 10-K filed on March
2, 2010. The financial data prior to fiscal 2009 included in this
presentation have not been adjusted for our adoption of Financial Accounting Standards Board Staff
Position APB 14-1, "Accounting for Convertible Debt Instruments that May Be
Settled in Cash Upon Conversion (Including Partial Cash Settlement)," the
effects of which are described in Note 2 to our Condensed Consolidated Financial
Statements in our Quarterly Report on Form 10-Q for the Quarterly Period
Ended August 6, 2010. |
 2
Agenda
Transaction overview
Overview of A.O. Smith Electrical Products Company
Transaction rationale and analysis
Questions |
 3
Overview of Regal Beloit’s acquisition of EPC
Acquiror
Regal Beloit Corporation
Target
Electrical Products Company (“EPC”) of A.O. Smith Corporation
Consideration
$875 million
–
$700 million of cash
–
$175 million of RBC stock
–
2,834,026 shares based on the 10-day volume weighted share price
of $61.7496
Projected Synergies
and Tax Benefit
Targeted
synergies
of
$30
million
to
$40
million
achieved
over
3
to
4
years
Tax benefits expected to be at least $45 million to $55 million
Projected Earnings
Impact
Accretive in the first full year following the acquisition excluding
one- time transaction-related expenses and purchase accounting
adjustments |
 4
Acquisition in line with strategic objectives
The Acquisition Of EPC Consistent With Regal Beloit’s Strategy
Objective
Increase revenues
by 15% annually
Objective
Improve
profitability
Objective
Improve customer
experience
Materially increases RBC top line
Additional channels to drive energy efficient technology
Approximately 150 unique patents
$30 million to $40 million of projected synergies
Provides meaningfully greater scale
EPC has improved profitability over the last two years
Allows RBC to offer a more complete suite of products and technologies to its
customers
Combined energy efficient technology provides ability to deliver
additional
value
to customers |
 5
EPC
Key facts and figures
General
Industries
8%
Pump
16%
HVAC&R
21%
Hermetic
31%
Distribution
24%
Revenue distribution (based on 2010E):
7,800 employees as of 9/30/10
$688 million of revenue for LTM 9/30/10
Headquarters: Tipp City, Ohio
Manufacturing footprint: Global in low-cost regions
|
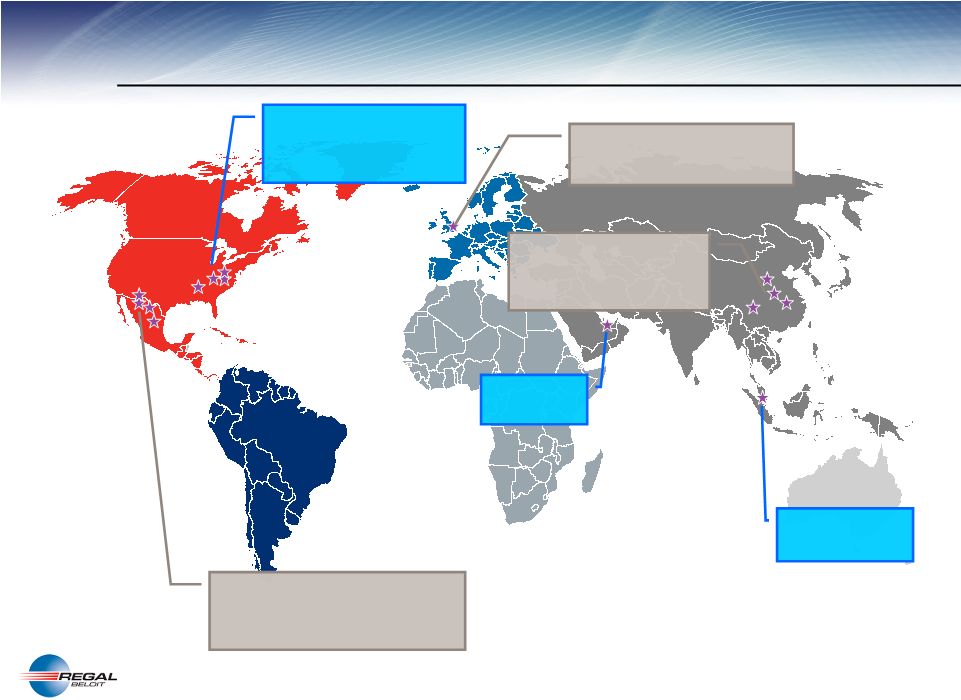 EPC’s
Low Cost Manufacturing Footprint
United States
Headquarters, 2 Manufacturing Facilities, 2
Distribution Facilities
.
751 Employees
Gainsborough, United Kingdom
Manufacturing Facility
91 Employees
China
3 Manufacturing Facilities, 1 Procurement
Office
2,317 Employees
Dubai, UAE
Sales Office
3 Employees
Singapore
Sales Office
4 Employees
Mexico
13 Manufacturing Facilities, 1 Center of Excellence, 1
Warehouse
4,693 Employees
6 |
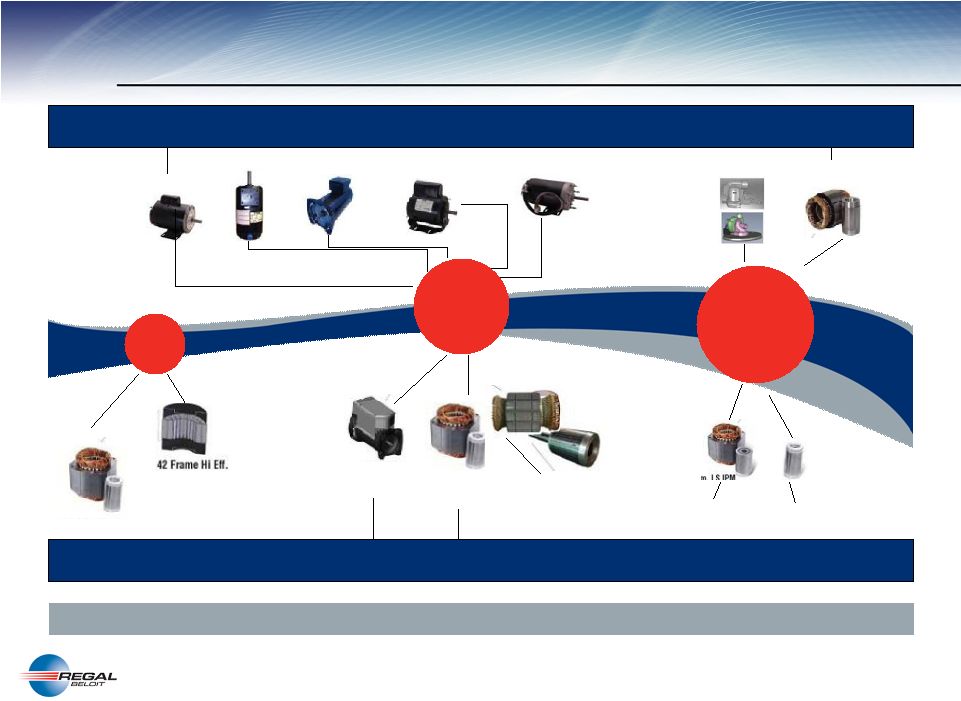 7
EPC’s
Track Record of New Products
New Products That Meet Customer Needs and Fuel Growth
2010
Commercial
Oil Fryer
Commercial
Rolled Steel
Residential
Pool
Commercial
Gate Operator Motor
Commercial
Garage Operator Motor
Residential
Commercial
A/C Compressor
2009
GI-Oil Circulator
IP55
Guardian
GI-Gate
Opener Motor
GI-SX Garage Door
Opener Motor
Power Vent
Water Heater Blower
Herm. VS IPM
2008
Residential
A/C Compressor
Res. –
A/C System
& Furnace Blower
Commercial
A/C Compressor
Residential
Pool
Residential
A/C Compressor
Residential
A/C Compressor
Residential
A/C Compressor
42 Frame Hi Eff.
Pump
56 Frame
Premium Eff.
Hermetic
1,500 HP –
13,800 Volts
Herm LS IPM
Herm. VS
IPM |
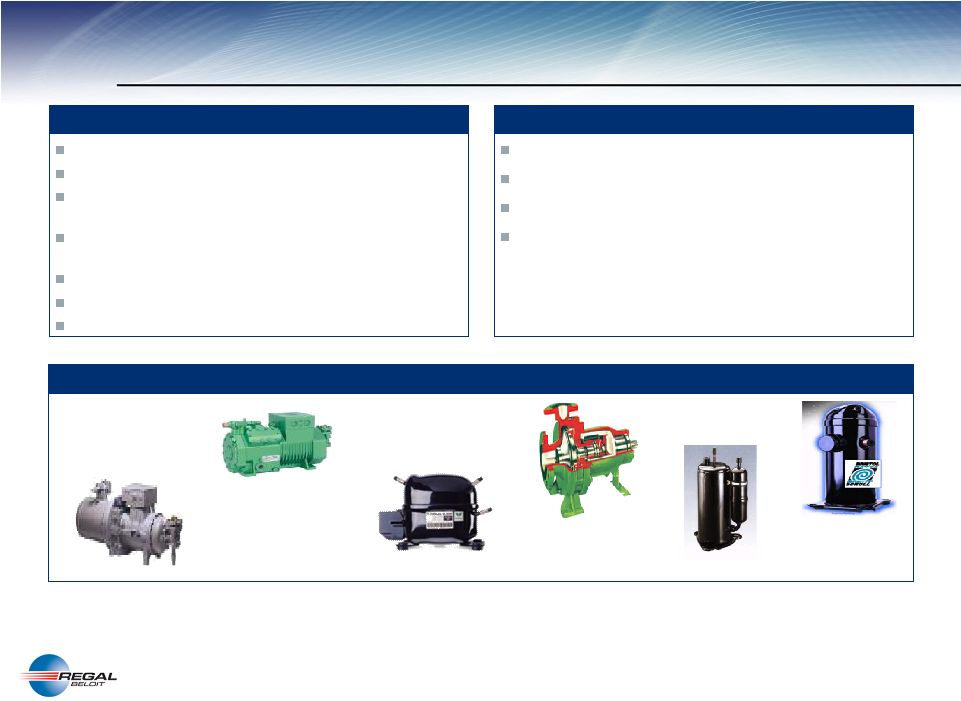 8
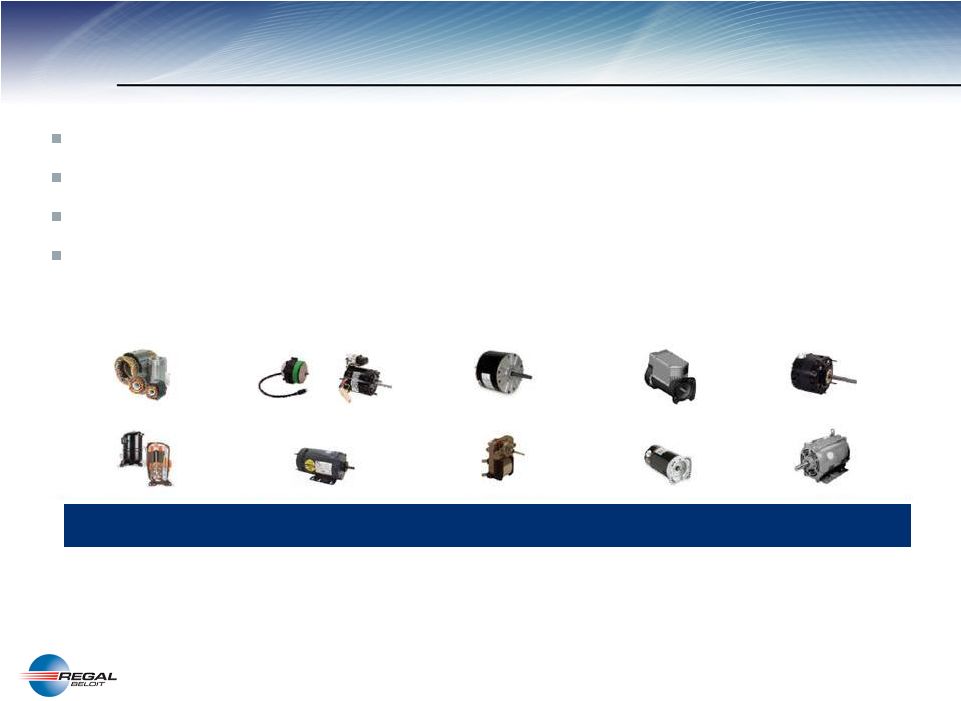
EPC: A Leader in Hermetic motors
Segment Commentary
Key Applications
Select Products
Leading independent supplier of hermetic motors
Strong relationships with leading customers in the industry
Supplier to a number of key OEM residential and
commercial HVAC&R industry participants
Strong global platform of commercial hermetic motors sold
throughout China, Japan, Europe and North America
Manufactured in Mexico and China
New variable speed capability for energy efficiency
Expected growth rates: 13.4% in 2010E & 11.8% in 2011E
Screw compressors
Reciprocating compressors
Scroll compressors
Centrifugal compressors |
  9
EPC financial summary
($ in millions)
Electrical Products Company
Year ended
December 31,
Nine months
ended September 30,
LTM
September 30,
2009
2009
2010
2010
Sales
$620.4
$472.0
$539.4
$687.8
Adj. EBITDA
$62.5
$52.0
$87.3
$97.8
% Margin
10.1%
11.0%
16.2%
14.2%
Adj. Income from Operations
$33.0
$29.9
$67.6
$70.7
% Margin
5.3%
6.3%
12.5%
10.3%
Capex
$14.3
$10.5
$10.4
$14.2
% of Sales
2.3%
2.2%
1.9%
2.1%
Source:
Public filings and A.O. Smith management. |
 10
Combination creates compelling value
Strong Cultural Fit And Similar Manufacturing Footprint Facilitates
Integration Increases scale
Complementary product
offerings
Creates shareholder
value
Builds upon strong product offering
Augments presence in low cost manufacturing locations
Talented management
Highly complementary products
Commercial and Residential Hermetic
Aftermarket and general industry distribution
Accretive in the first full year following the acquisition, excluding
one- time transaction-related expenses and purchase accounting
adjustments
Strategically deploys cash and utilizes debt capacity
Generates significant Free Cash Flow |
 11
$35.0
$35.0
$30.0
$20.0
$10.0
YR 1
YR 2
YR 3
YR 4
YR 5
$30 million to $40 million of synergies
Anticipated Gross Synergies
Anticipated Integration costs
Explanation of synergies
Procurement Synergies
Logistics Synergies
Manufacturing Synergies
Revenue Synergies
Regal Beloit Projects Meaningful Synergies Resulting From The Acquisition Of
EPC ($ in millions)
$5.8
$2.2
$2.2
$0.0
$0.0
YR 1
YR 2
YR 3
YR 4
YR 5
($ in millions)
Explanation of integration costs
Expense
Capital |
 12
Financial impact of combination
Combined Company Will Have Ability To Rapidly De-lever
($ in millions)
Pro Forma LTM 9/30/10 Financial Data
RBC
+
EPC
=
PF RBC
Sales
$2,146
$688
$2,833
Adj. EBITDA
$326
$98
$424
% Margin
15.2%
14.2%
15.0%
Capex
$38
$14
$52
% of Sales
1.8%
2.1%
1.8%
Free cash flow
$288
$84
$372
Total Debt
$433
$600
$1,033
Shareholder's Equity
$1,348
$175
$1,523
Total Debt / Capital
24.3%
40.4%
Source:
Public filings and A.O. Smith management.
(1)
Calculated as EBITDA less capex.
(2)
Assumes $600 million of new debt and $175 million of new equity issued in
connection with the transaction. (2)
(2)
(1) |
 13
Regal Beloit and EPC: A Strong Combination
Nearly $3 billion of combined revenue and over $400 million of EBITDA in
2010E Broader reach with complementary product offerings
Combined technology offers additional value to customers
Additional channels to drive energy efficient technology
Global, low-cost manufacturing footprint
Combined management strength with deep bench
Creates meaningful shareholder value through accretion and significant Free Cash
Flow |
 14 |
  15
Adjusted EBITDA reconciliation –
EPC
($ in millions)
Electrical Products Company
Year ended
December 31,
Nine months
ended September 30,
LTM
September 30,
2009
2009
2010
2010
Income from Operations
$32.5
$27.5
$61.9
$66.9
Adjustments
Hedges
3.0
3.0
–
–
Inventory & LIFO
(6.8)
(2.1)
3.4
(1.3)
Restructuring & Other
4.3
1.5
2.3
5.1
Total Adjustments
0.5
2.4
5.7
3.8
Adjusted Income from Operations
$33.0
$29.9
$67.6
$70.7
D&A
29.5
22.1
19.7
27.1
Adjusted EBITDA
$62.5
$52.0
$87.3
$97.8
Source:
Public filings and A.O. Smith management. |
 16
Adjusted EBITDA reconciliation –
RBC
Regal Beloit
Corporation
LTM September 30,
2010
Income from Operations
$253.0
D&A
72.9
Adjusted EBITDA
$325.9
Source:
Public filings.
($ in millions) |