Attached files
| file | filename |
|---|---|
| 8-K - FORM 8-K - NUVEEN INVESTMENTS INC | c61765e8vk.htm |
Exhibit 99.1

| December 13, 2010 Presentation to Lenders |

| Agenda Business Update Transaction Overview 2 |
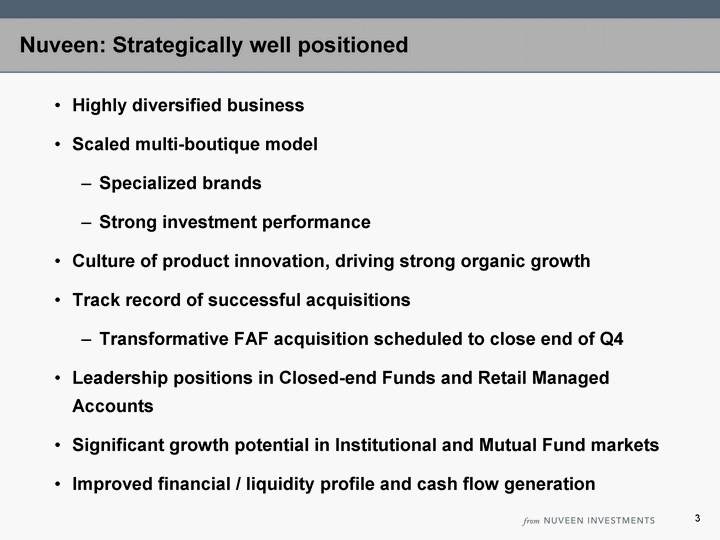
| Nuveen: Strategically well positioned Highly diversified business Scaled multi-boutique model Specialized brands Strong investment performance Culture of product innovation, driving strong organic growth Track record of successful acquisitions Transformative FAF acquisition scheduled to close end of Q4 Leadership positions in Closed-end Funds and Retail Managed Accounts Significant growth potential in Institutional and Mutual Fund markets Improved financial / liquidity profile and cash flow generation 3 |

| MF Institutional CEF RMA East 16 30 30 24 A Highly Diversified Business AUM* by Product AUM* by Asset Class AUM* by Affiliate Retail Managed Accounts 24% Closed End Funds 30% Mutual Funds 16% Institutional 30% Equities Taxable Fixed Income Municipals East 45 9 46 Equities 45% Municipal Bonds 46% Taxable Fixed Income 9% Nuveen - municipals Tradewinds - global equity NWQ - value equity Symphony - credit & alternatives Winslow - growth equity Santa Barbara - growth equity HydePark - index equity 52 19 12 5 9 2 1 52% 12% 19% 2% 1% 9% 5% Approximately $167 billion of assets in multiple asset classes and channels .... under seven distinct brand names 2009** 2008 ($10.2) $3.9 Oct 2010 YTD $12.2 Nuveen - fixed income *** Tradewinds - global equity NWQ - value equity Symphony - credit & alternatives Winslow - growth equity Santa Barbara - growth equity Hyde Park - index equity * As of October, 2010 ** Adjusted for one-time items *** Includes externally sub-advised assets Net Flows (adjusted for extraordinary items) 4 |

| Scaled Multi-Boutique Model: Specialized investment teams benefiting from shared Nuveen platform Specialized, Separately Branded Affiliates Retail Sales and Service Product Management and Marketing Legal, Compliance and Risk Management Operations and Information Technology Administration Scaled, Shared Nuveen Platform $80.4B $20.9B $32.1B $8.4B $14.3B $3.3B Note: AUM as of October, 2010; excludes externally sub-advised assets 5 |
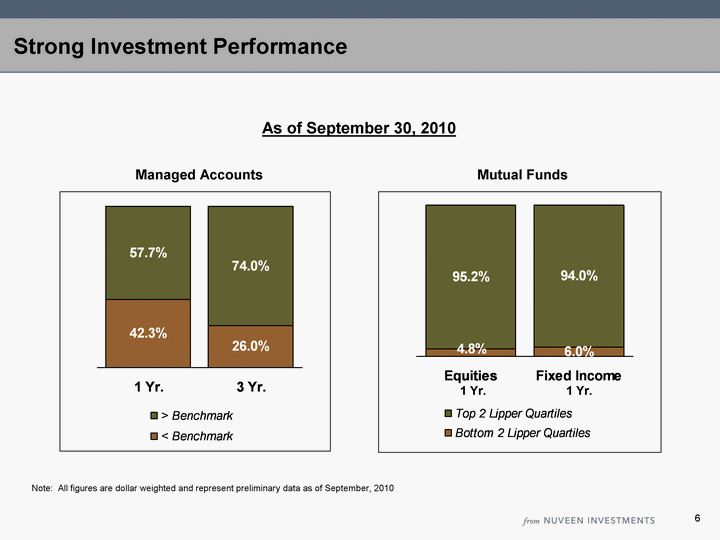
| Strong Investment Performance Note: All figures are dollar weighted and represent preliminary data as of September, 2010 1 Yr. 3 Yr. < Benchmark 0.423 0.26 > Benchmark 0.577 0.74 Managed Accounts Equities Fixed Income Bottom 2 Lipper Quartiles 0.048 0.06 Top 2 Lipper Quartiles 0.952 0.94 Mutual Funds As of September 30, 2010 1 Yr. 1 Yr. 6 |
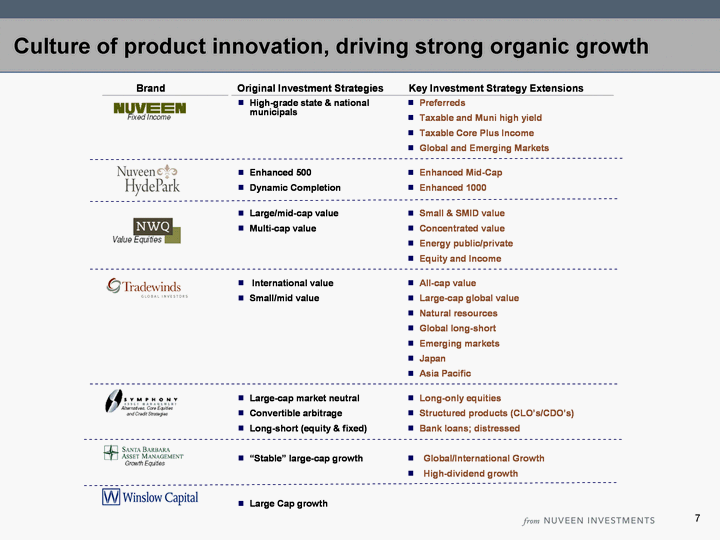
| Culture of product innovation, driving strong organic growth Culture of product innovation, driving strong organic growth 7 |

| 2010* AUM 2001 Alternatives, Credit Strategies, and Risk-Managed Equity $8.4B 2002 Value Equities 20.9 2005 Growth Equities 3.3 2006 Global Equities 32.1 2007 Enhanced Equity Strategies 1.4 2008 Large Cap Growth Equities 14.3 2010 FAF ** Fixed Income, Real Assets and Equity Strategies 26.9 * As of October, 2010 ** Anticipate closing by year-end 2010 Track Record of Successful Acquisitions (from NWQ) 8 |
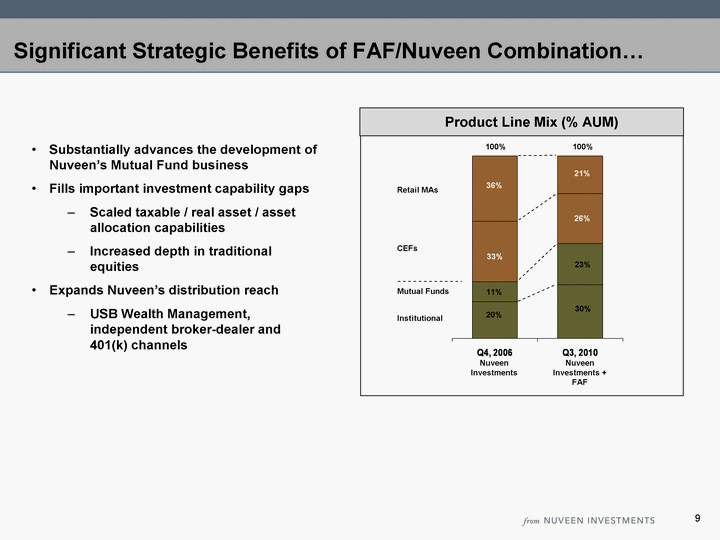
| Significant Strategic Benefits of FAF/Nuveen Combination... Product Line Mix (% AUM) Q4, 2006 Q3, 2010 Institutional 0.2 30 Mutual Funds 0.11 23 CEFs 0.33 28 Retail Managed Accts. 0.36 21 Retail MAs CEFs Mutual Funds Institutional 20% 11% 33% 36% 30% 23% 26% 21% 100% 100% Nuveen Investments Nuveen Investments + FAF Substantially advances the development of Nuveen's Mutual Fund business Fills important investment capability gaps Scaled taxable / real asset / asset allocation capabilities Increased depth in traditional equities Expands Nuveen's distribution reach USB Wealth Management, independent broker-dealer and 401(k) channels 9 |

| ...Combined with meaningful financial benefits Creates opportunity to accelerate growth Expanded and complementary distribution capabilities Broadened product offering Adds $40 million of run-rate EBITDA (including synergies) Synergies anticipated to come largely from combining distribution and back office functions Reduces leverage (debt/EBITDA) by more than 0.5x in the near term Transaction consideration primarily equity Cash consideration funded from available cash on Nuveen's balance sheet (no debt required) Reduces risk by providing added diversification: asset class, product & channel 10 |

| Leadership Positions in Closed-end Funds & Retail Managed Accounts... Significant untapped potential in Institutional and Mutual Funds Closed-end Funds $50B AUM* Retail Managed Accounts $41B AUM* Mutual Funds $26B AUM* Institutional $50B AUM* 102 Muni Funds 14 Taxable Funds 9 Equity-based Funds 1 Commodity Fund 32 Muni Funds 41 Equity-based and Taxable Fixed Income funds Value Growth Global/international Alternatives Fixed Income Significant Untapped Growth Potential #1 Share Position * As of October, 2010 Value Growth Muni Global/International 11 |

| Strong Year-to-date AUM Growth 2009 Market Net Flows October 2010 AUM 144.8 144.8 154.9 167.1 10.1 12.2 0 $144.8 $10.1 $12.2 $167.1 AUM ($Bn) Institutional $7.4 Mutual Funds 3.5 CEF's 1.4 RMA (1.0) 12 October 2010 |
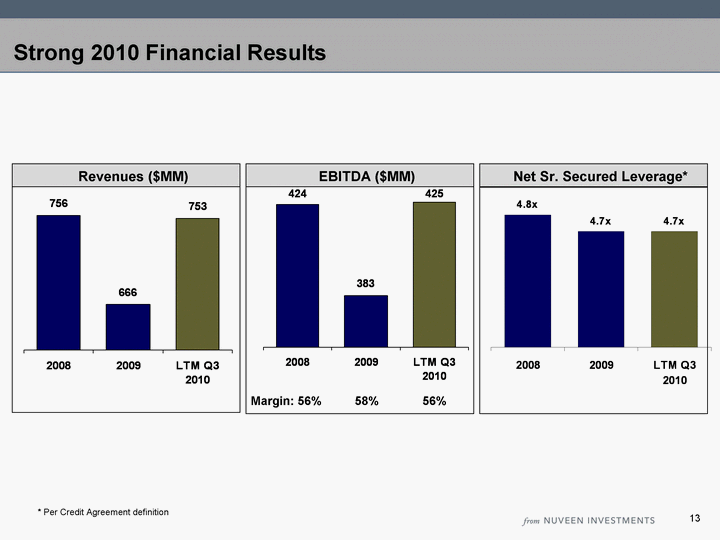
| Strong 2010 Financial Results 2008 2009 LTM Q3 2010 East 424 383 425 EBITDA ($MM) Net Sr. Secured Leverage* 13 2008 2009 LTM Q3 2010 East 756 666 753 Revenues ($MM) Margin: 56% 58% 56% * Per Credit Agreement definition |
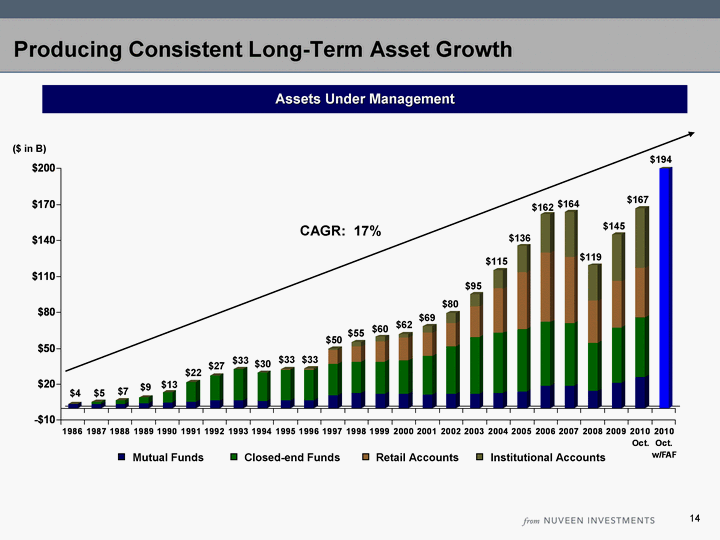
| Producing Consistent Long-Term Asset Growth Assets Under Management Mutual funds Closed-end Funds Retail accounts Institutional accounts Total 1986 3.83 - - 0 3.83 1987 3.54 1.79 - 0 5.33 1988 3.78 3.07 - 0 6.85 1989 4.18 5.14 - 0 9.32 1990 4.8 8.44 - 0 13.24 1991 5.71 16.29 - 0 22 1992 6.4 20.85 0.15 0 27.4 1993 6.92 25.8 0.23 0 32.95 1994 5.97 23.73 0.34 0 30.04 1995 6.57 25.78 0.69 0 33.04 1996 6.93 25.43 0.7 0.2 33.26 1997 10.885 26.117 11.622 0.97 49.594 1998 12.71 26.22 12.7 3.6 55.23 1999 12.04 26.85 17 3.9 59.79 2000 11.96 28.36 18.6 3.1 62.02 2001 11.81 32 19 5.7 68.51 2002 11.849 39.943 19.4 8.5 79.69 2003 12.3 47.1 25.7 10.3 95.4 2004 12.7 50.2 37 15.6 115 2005 14 52 47.7 21.9 135.6 2006 19 53 58 32 162 2007 19 52 55 38 164 2008 14.7 39.9 34.9 29.8 119.2 2009 21.4 46 38.5 39 144.9 2010 Oct. 26 50 41 50 167 2010 Oct. w/FAF 300 0 0 0 194 CAGR: 17% ($ in B) 14 $4 $95 $69 $80 $22 $13 $9 $7 $5 $62 $60 $55 $50 $33 $33 $30 $33 $27 $115 $136 $162 $164 $119 $145 $194 $167 Mutual Funds Closed-end Funds Retail Accounts Institutional Accounts |
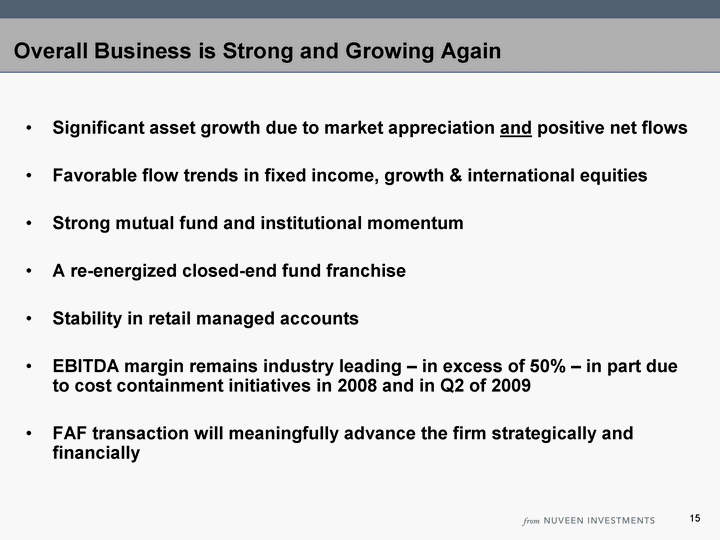
| Overall Business is Strong and Growing Again Significant asset growth due to market appreciation and positive net flows Favorable flow trends in fixed income, growth & international equities Strong mutual fund and institutional momentum A re-energized closed-end fund franchise Stability in retail managed accounts EBITDA margin remains industry leading - in excess of 50% - in part due to cost containment initiatives in 2008 and in Q2 of 2009 FAF transaction will meaningfully advance the firm strategically and financially 15 |
| Agenda Business Update Transaction Overview 16 |
| Transaction Summary Nuveen is seeking an amendment and extension of its First Lien Credit Facilities to opportunistically reduce the size of its 2013 and 2014 debt maturities The amendment and extension addresses the following: $1.0 billion extension of the existing $2.1 billion First Lien Term Loan Facility by 2.5 years into a new Extended First Lien Term Loan Facility maturing in May 2017 Targeting a $250 million(a) extension of the Revolving Credit Facility by 2.0 years into a new Extended Revolving Credit Facility maturing in November 2015 Amend the leverage covenant to provide increased cushions and operating flexibility 17 (a) Represents target extension amount. Presentation assumes $200 million extension achieved. |

| Transaction Overview 18 |

| Transaction Materially Enhances Maturity Profile 19 Current maturity profile (Weighted average maturity of 4.2 years) Pro forma maturity profile (Weighted average maturity of 5.0 years) |

| Amend & Extend Summary of Indicative Terms 20 Borrower: Nuveen Investments, Inc. Description: Amend credit agreement to allow for an extension of $1,000 million in First Lien Term Loan and full $250 million Revolving Credit Facility Extension offer made to all First Lien lenders on a pro rata basis Extended loans are placed into a new tranche with new economic terms Amend First Lien Leverage Covenant to remain at 5.75x for the life of the loan Extended revolver: $250 million with 25% of extended lenders converting to extended First Lien Term Loan Extended term loan: $1,000 million Extension tenor: 2.5 years for First Lien Term Loan and 2.0 years for Revolving Credit Facility, with springing maturity to the Second Lien Term Loan and no more than 1x EBITDA of 2015 bonds due within 90 days of maturity. Extended Revolving Credit Facility will also have a springing maturity to the non-extended First Lien Term Loan. New spread: L + 550 for extending Lenders (250 bps increase) Security and guarantees: Same as existing First Lien Credit Facilities Amortization: Same as existing First Lien Term Loan Optional prepayment: Prepayments may be directed to non-extended First Lien Term Loan 101 soft call for 1 year on extended First Lien Term Loan for "repricing" transactions |

| Amend & Extend Summary of Indicative Terms (continued) 21 Future refinancings: Ability for credit facility refinancings at par or applicable premium with first / second lien notes / loans, unsecured notes / loans, and/or new tranches of term loans or revolver under Credit Agreement Price protection: Future term loan extensions permitted subject to 25 bps MFN protection for extended First Lien Term Loans for 18 months Mandatory prepayments: Pro rata to each tranche of First Lien Term Loans (existing and new), except as provided below Company may elect to apply proceeds from permitted debt refinancings as follows: (i) first, ratably to non-extended existing first lien term loans and existing revolving loans, and (ii) thereafter, to first lien term loan and revolving loan classes with the then earliest maturity (ratably among classes with the same maturity) Consent fee: 25 bps to consenting Lenders, whether or not electing to extend Effectiveness: Contingent upon closing of FAF acquisition |

| Transaction Timeline 22 12/13 Lender conference call 12/17 Commitments due from lenders 1/5 Estimated transaction closing |
| Transaction Rationale Nuveen continues to experience strong operating momentum with positive net flows and market appreciation While the Company currently has no pending debt maturities before 2013, the proposed amendment and extension transaction allows us to further extend our maturity profile at attractive long-term rates The transaction is opportunistic in nature and will also result in a more staggered maturity profile that is less concentrated in future years The extension is leverage neutral and while pro forma interest expense will increase, this increase will be partially offset by interest rate swaps that recently expired in November As previously disclosed, the FAF acquisition, which is anticipated to close by year end, will further delever the Company by adding approximately $40 million of incremental EBITDA with no increase in debt The proposed elimination to future step-downs in the leverage covenant will maintain the current covenant level for the life of the loan to protect against unforeseen market movements and provide additional operating flexibility 23 |
