Attached files
| file | filename |
|---|---|
| 8-K - NOBEL LEARNING COMMUNITIES, INC. -- FORM 8-K - NOBEL LEARNING COMMUNITIES INC | d8k.htm |
 Nobel Learning Communities, Inc.
December, 2010
Exhibit 99.1 |
 2
Nobel Learning Communities –
Safe Harbor
Except for historical information contained in this presentation, the information in this
herein consists of forward-looking statements
pursuant
to
the
safe
harbor
provisions
of
the
Private
Securities
Litigation
Reform
Act
of
1995.
These
statements involve risks and uncertainties that could cause actual results to differ
materially from those in the forward- looking statements. Potential risks and
uncertainties include among others, the implementation and results of the
Company’s ongoing strategic initiatives; the Company’s ability to compete with new
or existing competitors; dependence on
senior
management
and
other
key
personnel;
changes
in
general
economic
conditions;
and
the
impact
on
our
business
and
the
price
of
our
common
stock
caused
by
the
concentration
of
ownership
of
our
common
stock.
Other
risks
and
uncertainties are discussed in the Company's filings with the SEC. These statements are
based only on management's knowledge and expectations on the date of this
presentation. The Company will not necessarily update these statements or other
information in this press release based on future events or circumstances. In this
presentation, financial measures are presented both in accordance with United States generally accepted
accounting principles ("GAAP") and also on a non-GAAP basis. Adjusted EBITDA is a
non-GAAP financial measure. Adjusted EBITDA is commonly presented as a
reconciliation starting with net income. Due to the number of non-operating related
items included in net income, we present Adjusted EBITDA. The Company believes that the use of certain non-
GAAP financial measures enables the Company and its investors and potential investors to
evaluate and compare the Company's
results
from
operations
generated
from
its
business
in
a
more
meaningful
and
consistent
manner
and
provides
an
analysis
of
operating
results
using
the
same
measures
used
by
the
Company's
chief
operating
decision
makers
to
measure
the
performance
of
the
Company.
Please
see
the
financial
summary
at
the
end
of
this
presentation
for
information reconciling non-GAAP financial measures to comparable GAAP financial
measures |
 3
NLCI Business Summary
•
Leading education provider as an operator of 184 schools
–
#4 private preschool operator (units)
–
#1 private K12 operator (units)
•
Portfolio of schools
–
Preschools –
148
–
Elementary/Middle schools (29) and specialty schools (7)
–
Online K-12 Distance Learning School
•
Fully invested in people, curriculum, technology, real estate
•
Dual income families; high average household income
•
Primarily private pay customer
•
Revenue for fiscal year ended June 2010 increased 5.4% to $232mm
|
 4
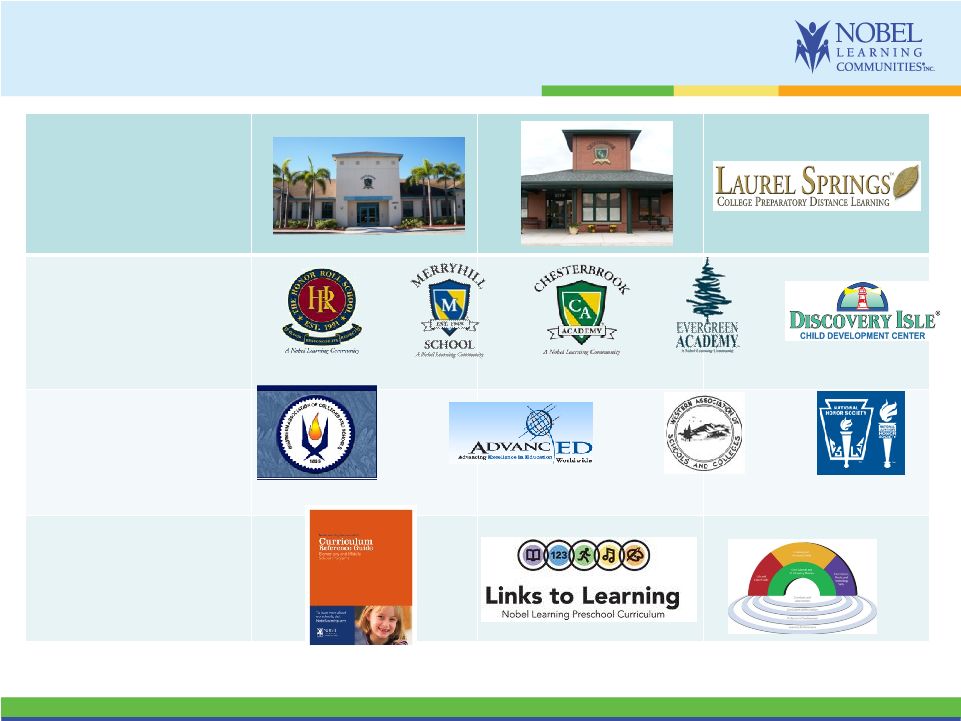
Program
Premier Portfolio
of Local Brands
Accreditations
National Curricula
Platform spans PreK-12 with proprietary
curriculum and accredited programs
21
st
Century Skills |
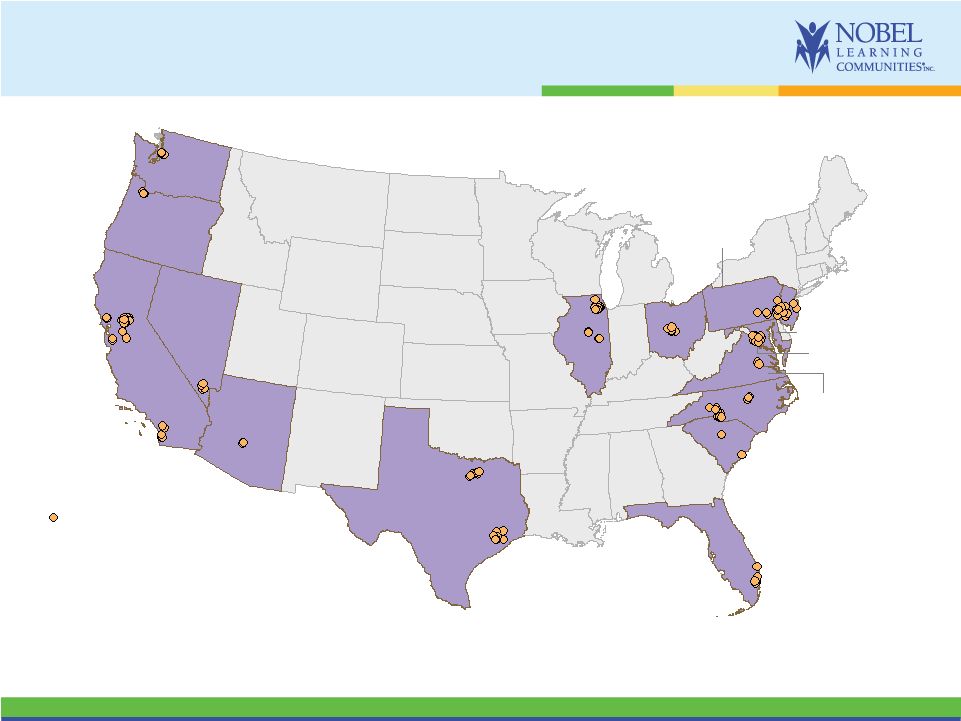 5
We operate 184 schools in 15 states
Note: As 12/2/2010
184 total schools
Arizona
1
California
37
Florida
8
Illinois
20
Maryland 1
Nevada
10
New Jersey 10
Oregon
3
Ohio
9
South Carolina 2
Texas
17
Virginia 19
Washington
5
District of
Columbia 1
North Carolina 17
Pennsylvania
24 |
 6
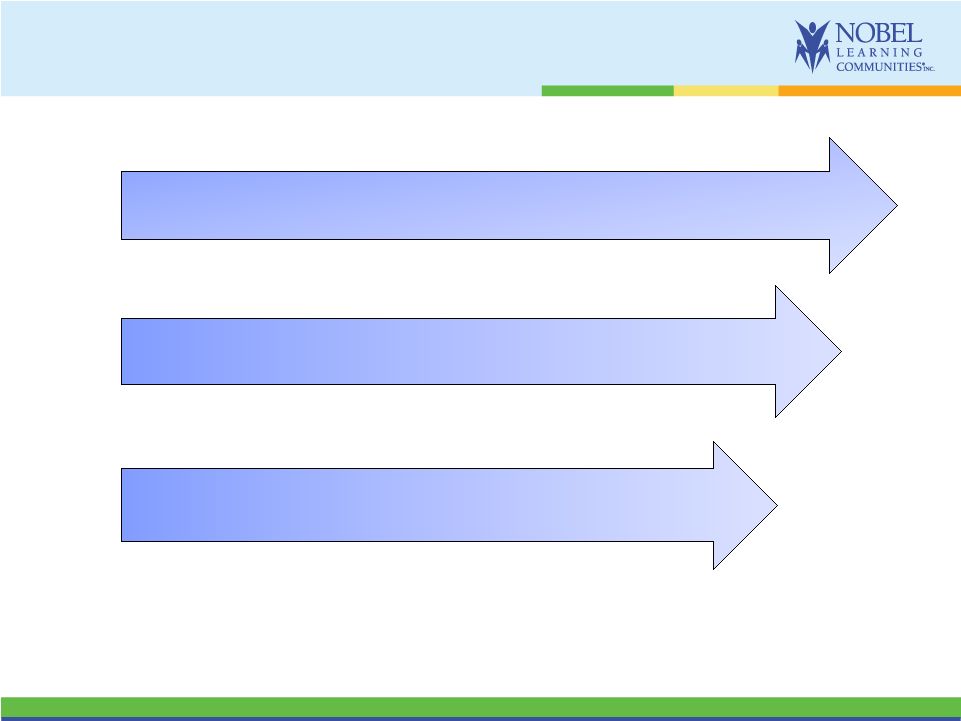
NLCI has a multi-channel growth strategy
Organic Growth: Enrollment growth plus annual tuition
increases in existing schools; open new ones
Acquisition of K+ and Preschools
Expand online and distance learning presence into
new market segments; highly scalable |
 7
Our platform strategy has dual tracks
•
Curriculum based preschools
•
Strong, Proprietary curriculum
•
Predictable cash flows
•
Opportunity for quick gains in economic recovery
•
Growth through new builds and acquisitions at attractive
multiples
Pure Play Preschool Track |
 8
Preschool Operating Highlights
Average preschool
•
102 full-time equivalents
•
$1.25 million revenue
•
9,000 square feet
Staffing
•
23 people (2 admins, 20 teachers, 1 other)
Compensation
•
Principal salary range: $30,000 to $57,000
•
Teachers (infant to K): $9 to $27 per hour
Key operating metrics
•
Revenue, payroll, controllable expenses, contribution to fixed
•
Enrollment trends, occupancy, FTEs, inquiries, tours, sales
conversions
•
Parent satisfaction scores |
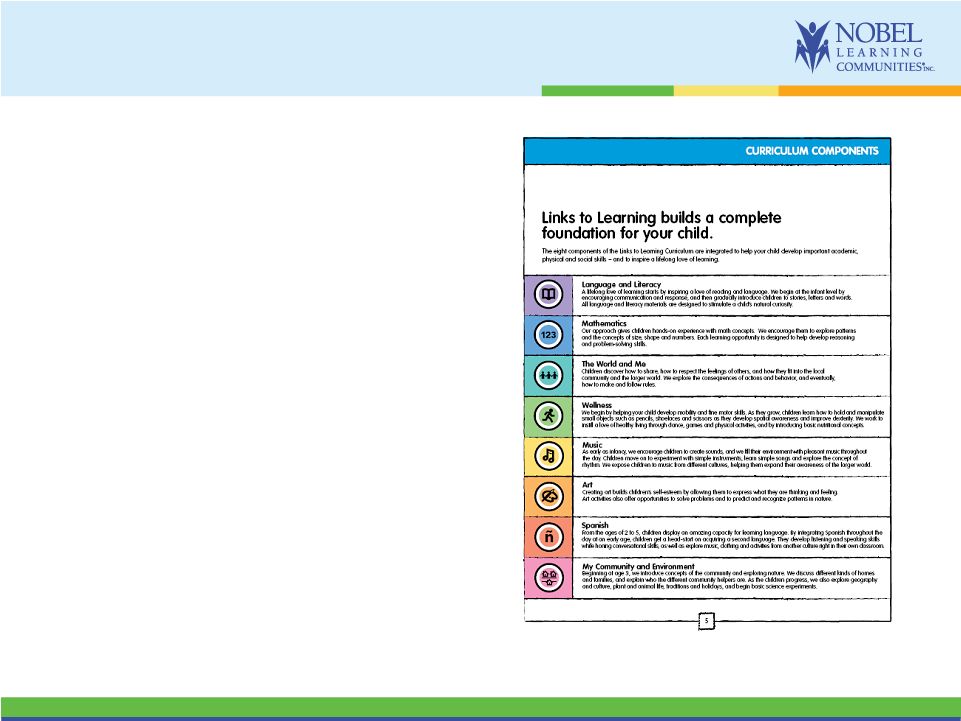 9
Links to Learning –
Preschool Product Overview
•
Preschool curriculum includes:
–
Teacher materials
–
Developmental Skills Sheet, Months at
a
Glance-
monthly pacing guides, Weeks at a
Glance-
weekly pacing guides Daily Skills
Sheet, LTL lesson plan template
–
Parent connections
–
Weekly lesson plans
–
Week-at-a-glance sheets
–
Parent friendly month-at-a-glance
–
Parent friendly Spanish poster with phonetic
pronunciation (Beginner-PreK)
–
Developmental skills sheet
–
What We Did Today
–
Monthly letters explaining how to link
learning from school with activities at home
–
End of Month folder |
 10
•
K-8 onsite schools and K-12 distance learning school
•
Private pay
•
Capability for multiple delivery modalities
•
Bring online opportunities to onsite schools
•
Develop blended model schools and partnerships
•
Strong growth opportunity, including international
Integrated K-12 Track
Our platform strategy has dual tracks |
 11
K+ Operating Highlights
Average K+ school
•
153 full-time students
•
$1.7 million revenue
•
4,000 to 40,000 square feet
Staffing
•
17 people (3 admins, 13 teachers, 1 other)
Compensation
•
Principal salary range: $55,000 to $121,000
•
Teacher salary range: $13 to $30 per hour
•
Teachers are contracted for 10 months
Key operating metrics
•
Revenue, payroll, controllable expenses, contribution to fixed
•
Enrollment trends, occupancy, inquiries, tours, sales
conversions
•
Educational outcomes and parent satisfaction scores |
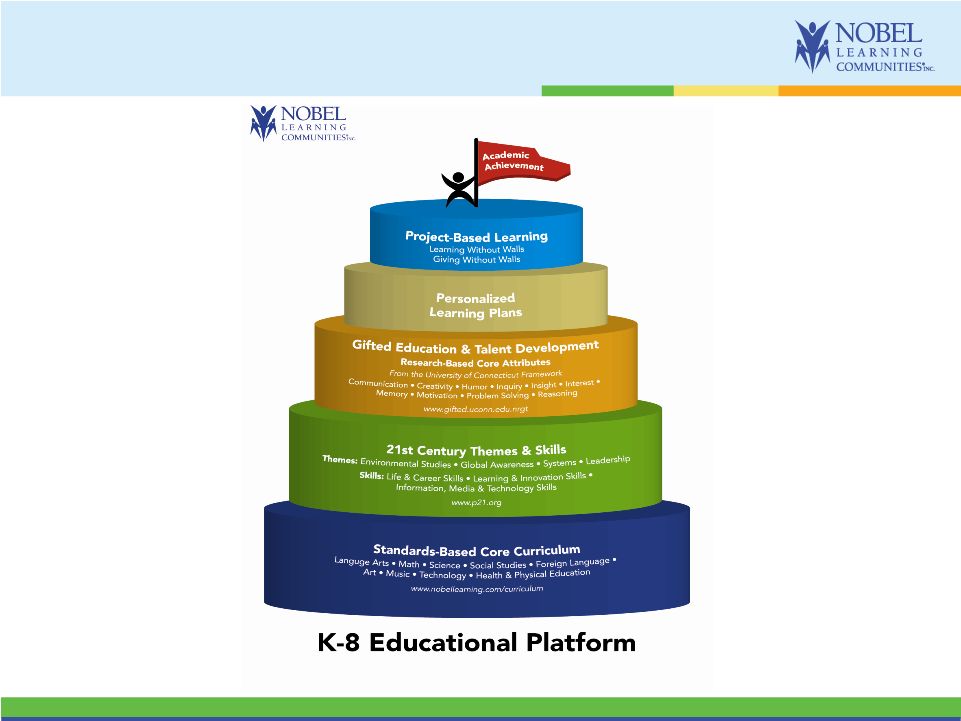 12
Educational Platform: Curriculum and
Curriculum Delivery |
 13
Laurel Springs Overview
•
A private, distance learning K-12 College Prep school founded in 1991
•
WASC accredited; NCAA approved; Univ. of CA A-G approved (non-lab
courses) •
Curriculum is combination of proprietary and licensed
•
Includes honors and AP courses
•
Gifted and Talented diploma program
•
Serves high-end, private pay markets focusing on college bound students
•
Excellent test scores (Terra Nova, AP, ACT, SAT, SATII)
•
Excellent placement record to selective universities
•
College planning and counseling services
•
Graduates receive over $1mm of scholarships annually
•
Mastery based
•
The most “high touch”
and high service online school, featuring:
•
Learning styles assessment
•
Enrollment counselors
•
Academic advisors and college prep coaches
•
On site Prom, Graduation and Year Book |
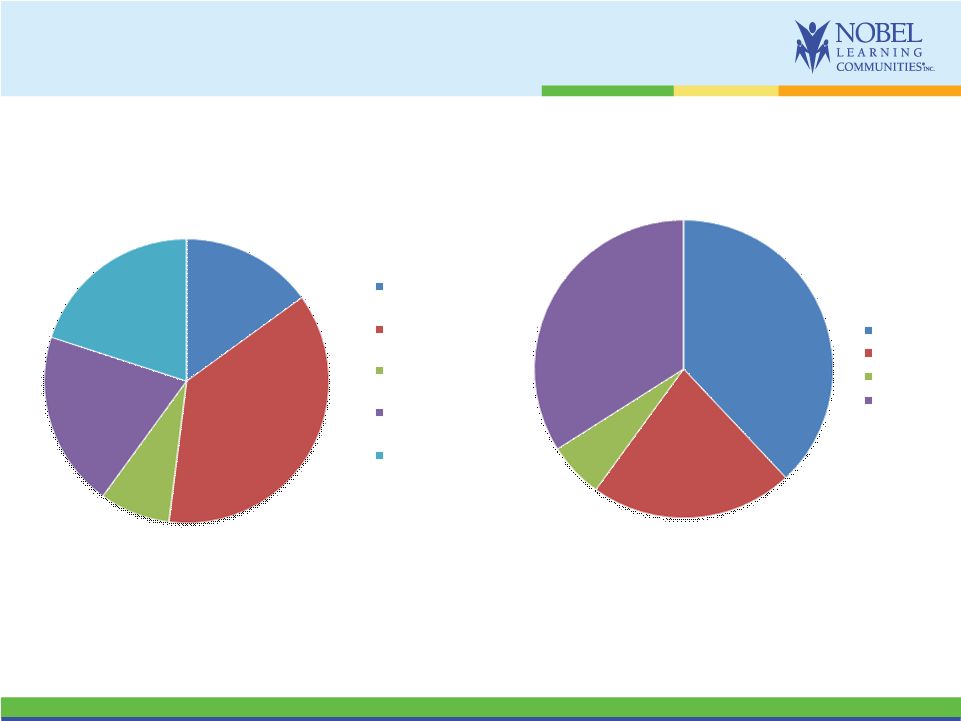 14
Laurel Springs serves students in several
profitable niche markets
15%
37%
8%
20%
20%
Student Population
Concurrent
Enrollments
"New" Home
Schoolers
International
Elite Athlete
Entertainment and
Performing Arts
38%
22%
6%
34%
Student Enrollment
FT 9-12
PT 9-12
PT K-8
FT K-8
FY 2010 student distribution |
 15
Business model relationship to the
economy
Preschool
Track
K-12 Strategy Track
On –
site
On -
line
Relationship
to Economy
•
Lagging Indicator
•
Local Economy
•
Lagging indicator
•
Local economy
•
Slight lagging
indicator
•
National economy
Largest
Economic
Factor(s)
•
Unemployment
•
Unemployment
•
Local public school
funding
•
Local public school
funding
Growth
Drivers
•
Job creation
•
Program strength
versus competitors
•
Job creation
•
Trend to multiple
delivery modalities
•
Personalized
learning
•
Rapid penetration of
online education
•
International demand
for U.S. diplomas |
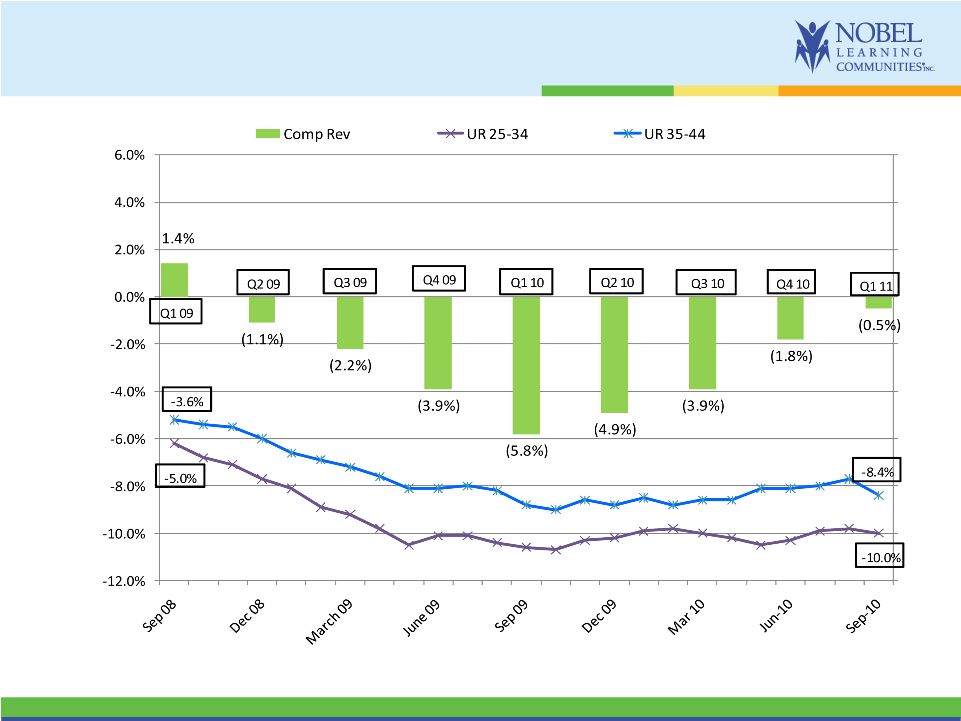 16
Comparable School Revenue Versus
Unemployment Rate
NOTE:
UR 25-34 and UR 35-44 data from BLS.gov |
 17
October Achieved Positive Enrollments
•
September
–
1
st
month
of
positive
comp
school
Revenue
in
23
months
•
October
–
1
st
month
of
positive
comp
school
Enrollment
in
2
½
years
•
Positive comparable school revenue and enrollments in October
–
Both preschools and K+ schools had positive enrollments
|
 18
Nobel Learning Communities, Inc.
Financial Information |
 19
Key characteristics of our Model
•
Sources of Strength
–
Revenue growth –
tuition, enrollment, new facilities, acquisitions
–
Strong recurring revenues –
high student retention rate
–
Highly attractive private pay demographic target
–
Proven acquirer with successful integration track record
•
Margin and Earnings Leverage
–
Comparable school revenue growth = Margin expansion
–
Distance learning online school delivers leverage with scalable
platform
•
Attractive Cash Flow
–
Generate cash before services delivered
–
Modest capital requirements –
real estate leased, not owned
–
Dry powder -
$75mm revolving credit facility; over $50mm
available |
 20
Most Recent Performance: Q1, FY 2011
•
Record Q1 revenue of $52.2mm, up 3.2%
•
Generated TTM adjusted EBITDA of $16.6 mm
•
EPS Q1 2011 = ($0.23) compared to Q1 2010 = ($0.14)
•
Q1 Performance Items
–
DOJ relate professional fees impacted EBITDA by ($275K) and EPS ($0.02)
–
Increased discounts (mostly retention oriented or agency related) over LY
($395K)
–
Controllable spend (bounceback, HVAC, new classrooms) ($500K) over LY
–
Comparable school payroll variance over LY ($300K)
•
Comparable school revenue and enrollment trending better in September and
continued into October |
 21
$18
$20
$21
$18
2007
2008
2009
2010
$181
$204
$220
$232
2007
2008
2009
2010
$8
$8
$7
$6
$12
$21
$7
$12
2007
2008
2009
2010
Acquisition spend
Capex
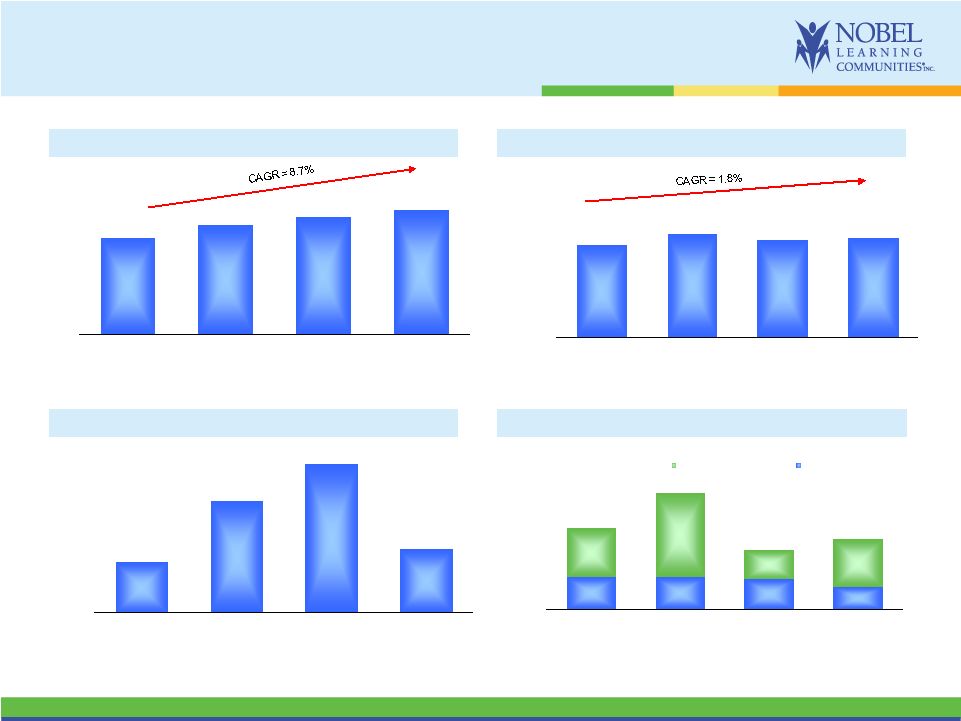
Four year performance
Revenue
growth
12.9%
7.8%
$27
$31
$29
$29
2007
2008
2009
2010
%
margin
15.1%
15.0%
13.2%
EBITDA
margin
9.9%
9.8%
9.8%
5.4%
12.5%
7.9%
13.1%
Revenue ($ millions)
Gross profit ($ millions)
Adjusted EBITDA ($ millions)
Capex
and acquisition spend ($ millions) |
 22
Non-GAAP information
Financial information should be read in conjunction with Financial Statements and
Notes thereto file with the SEC Trailing
Twelve
Months
October 2,
2010
September 26,
2009
October 2,
2010
Net (loss) income
(2,451)
$
(1,432)
$
853
$
Interest expense
417
267
1,721
Tax (benefit) expense
(1,602)
(771)
877
Depreciation and amortization expense
2,507
2,300
10,201
EBITDA
(1,129)
$
364
$
13,652
$
Net loss from discontinued operations - net of depreciation
85
189
705
Stock compensation expense
286
305
1,089
DOJ litigation costs
275
158
1,077
Non-capitalizable transaction costs from acquisitions
-
128
83
Adjusted EBITDA
(483)
$
1,144
$
16,606
$
Thirteen Weeks Ended
Reconciliation of Non-GAAP Financial Measures |