Attached files
| file | filename |
|---|---|
| 8-K - FORM 8-K - APOLLO EDUCATION GROUP INC | p18358e8vk.htm |
| EX-99.1 - EX-99.1 - APOLLO EDUCATION GROUP INC | p18358exv99w1.htm |
Exhibit 99.2


The 2010 University of Phoenix Academic Annual Report addresses the issue of
academic quality and discusses why it appears to be difficult to define, measure, and
deliver. Academic quality, always the mainstay of education, has become more important
than ever as we endeavor to return the United States to a global leadership role in
education.
Never before have students, governments, and taxpayers clamored so loudly for increased
accountability and transparency in education. The call is coming from all sides to show
the links between the classroom, academic quality, and success in the workplace. While
the impatience grows, the difficulty defining academic quality and appropriate metrics
for a changing educational and work landscape continues.
Today’s economics demand that more significant numbers of people continue their
education to complete a degree, to repurpose careers, or to stay current with
technology and changes in the professions. For quite some time, the traditional
residential student going directly from high school to college has been the exception
rather than the rule. As a result of the needs of the new majority, and because
technology has advanced to a point that anyone can attend class at any time and almost
anywhere, delivery methods have evolved and determining the appropriate metrics to
measure quality have yet to be defined.
The University of Phoenix has determined that academic quality must be discussed from
two perspectives: as a measure of internal integrity in which key indicators that tie
academic outcomes to student success are a part of a system of continuous improvement,
and as a set of measures by which institutions can be compared in regard to student
achievement. The University has identified curriculum, assessment of student learning
outcomes, and faculty preparation as basic to the enterprise. These elements must be
continually improved as part of the internal integrity process that defines academic
quality and results in student achievement that can be compared externally. How the
University accomplishes this is discussed in detail in the report that follows.
In the second section of the 2010 Academic Annual Report, the University reviews
student performance on a series of internal and external metrics. These include the
National Survey of Student Engagement (NSSE), the Standardized Assessment of
Information Literacy Skills, and the ETS® Proficiency Profile
(EPP). The latter was previously known as the Measure of Academic Proficiency and
Progression (MAPP). The assessment remains the same; the name is the only change.
In general, there is congruency in results this year as compared to the last
two Academic Annual Reports. The completion rates for the University
show a slight decline this year. The University believes that most of
these changes arise from difficulties associated with current
economic conditions.
Finally, the Report reviews the initiatives announced in last year’s report the
University Orientation, the First-Year Sequence, and Just-In-Time remediation through
the University’s Centers for Writing and Mathematics Excellence. Going forward, the
University continues to make data-driven decisions on how best to continually improve
its systems and curriculum in ways that will best benefit our students.
2

University of Phoenix (UOPX) was founded on an agenda of social responsibility to
provide educational access to underserved populations. This agenda has served the
University and its students well, and the policies underpinning that agenda have
become an integral part of the culture of University of Phoenix.
Over the last three decades, University of Phoenix has worked to build an
institution with the agility to directly address the shifting economic and academic
challenges that working adults face. The University’s growth over the last thirty
years has been fueled by constant innovation and ongoing efforts to improve the
learning experience through advanced technology.
University of Phoenix has evolved to meet the changing needs of students and employers.
Today the University is a comprehensive learning institution enrolling 470,800
students, with a faculty of more than 32,000 and nearly 600,000 alumni.
In this, the third Academic Annual Report issued, the University analyzes academic
quality in higher education and attempts to answer why quality is so difficult to
define and ensure. In the second half, the report reviews the Academic Scorecard for
University of Phoenix students.
Mission and Purposes
The Mission of University of Phoenix is to provide access to higher
education opportunities that enable students to develop the knowledge and skills
necessary to achieve their professional goals, improve the productivity of their
organization, and provide leadership and service to their communities.
1. To facilitate cognitive and affective student learning, knowledge, skills
and values, and to promote use of that knowledge in the student’s workplace.
2. To develop competence in communication, critical thinking,
collaboration, and information utilization, together with the
commitment to lifelong learning for enhancement of students’
opportunities for career success.
3. To provide instruction that bridges the gap between theory and practice
through faculty members who bring to their classroom not only advanced
academic preparation, but also the skills that come from the current practice
of their professions.
4. To provide General Education and foundational instruction and services
that prepare students to engage in a variety of university curricula.
5. To use technology to create effective modes and means of instruction
that expand access to learning resources and that enhance collaboration
and communication for improved student learning.
6. To assess student learning and use assessment data to improve the
teaching/learning system, curriculum, instruction, learning resources,
counseling and student services.
7. To be organized as a for-profit institution in order to foster a spirit of
innovation that focuses on providing academic quality, service, excellence,
and convenience to the working student.
8. To generate the financial resources necessary to support the University’s mission.
3

What Is It? Where Is It?
Never before have students, governments, and taxpayers clamored so loudly for
increased accountability and transparency in education. The demand to show the links
between the classroom, academic quality, and ultimately success in the workplace is
affecting all levels of education. This situation becomes more problematic when trying
to define academic quality in specific terms. The collective wisdom of academia has not
been able to reach consensus. Nor has the federal government been able, despite repeated
efforts, to come up with a definition of academic quality. Over time, various metrics
have been proposed as significant indicators of quality; these include graduation rates,
job placement rates, transfer rates,
and rates of attrition and retention.1 While such numbers
provide a type of quantification, they are often difficult for the public to
understand and are subject to a wide anger of interpretation and discussion as to
efficacy.
“The world-wide expansion of access to higher education has also created an increasing
national and global demand for consumer information on academic quality. Because a college
education is a rare purchase and an increasingly important as
well as expensive decision in one’s life, students and their families are
seeking information that will help them make informed choices in the selection
of a university and/or an academic program.”
A Cross-National Analysis of University Ranking Systems, 2005
In the book Academic Quality
Work: A Handbook for Improvement,
it is
noted that there is currently a
“growing worldwide impatience with the
quality of education, and indeed, with
university outcomes
generally.”2
That is hardly an understatement. The
U.S. Department of Education is
particularly interested in the process
of regional accreditation and whether
it can properly regulate higher
education. The Department has sought
to
demand standardized, quantifiable
metrics while the accrediting bodies
maintain
that a standard set of
metrics does not
ensure the quality of a broad
spectrum of institutions, organized to meet a variety of
needs, and with varying missions. Parents, students, and increasingly taxpayers want
to know that an investment in higher education is one that will have value for
individuals as well as the public in general. The dilemma is that while impatience
grows, the difficulty with defining academic quality and determining appropriate
metrics remains.
Defying Definition and Tradition
American society has progressed from an agrarian to industrialized economy and
from there to the manufacturing giant that propelled the United States to global
leadership. Today the American economy has evolved further to an information-driven,
knowledge-based society. But while American society has transformed significantly,
traditional higher education has remained a fairly consistent monolith, defined by
historical conditions that no longer exist.
Most institutions of higher education still operate on a schedule designed to allow
students to spend summers harvesting crops, returning to the classroom in the fall.
And the classroom environment remains a product of formulas that equate quality with
time in class. The structure of that time, in the traditional lecture format, remains
despite clear evidence of its minimal effectiveness as a learning model.
Such basic issues point to seminal questions concerning quality. Primary among these
is the issue of seat time as an indication of quality instruction. Indeed, once one
looks beyond historical constraints, one wonders if time-to-degree is not merely an
outgrowth of an earlier societal imperative. And in an era where knowledge is not the
purview of the few—the faculty—who then disperse it to the many—the students—it
must be asked whether learning is not better facilitated by constructing knowledge,
rather than by regurgitating facts memorized for midterms and finals which are then
forgotten.
With more and more Americans wanting and needing quality education, and with
American prosperity riding on it, higher education must find a way of accommodating
growing
4

numbers of students while ensuring academic integrity in programs. This is not, however,
only an American dilemma. The same discussions are being held worldwide, most noticeably in the
Bologna Project,3 which looks to increase mobility and employability
throughout
Europe, to create participative equality, to allow more students to pursue higher education, and
to correct the imbalance between rich and poor.
Misaligned Metrics
Most of the current measures of academic quality are those applied to full-time on-campus
students, who make up only about one quarter of the total college enrollment in America.
These students go directly from high school to college, attend classes full time, and
experience residential life on campus. They then proceed to the world of work. For these
students there is an orderly progression that can be tracked and quantified institutionally by
such measures as graduation rates, job placement rates, or lifetime earnings.
However, some three-quarters of all students in America today do not fit this mold. They
are older; they work full or part time and have family responsibilities, including financial
obligations. These are the students we termed “Next Generation Learners” in the 2009
Academic Annual Report. Their progression is not linear or orderly and is complicated by a
variety of life factors (i.e., risks), and yet access to higher education is vital.
For these students, measures such as graduation rates are not the best indicators of
institutional success. To be specific, take the recent report With Their Whole Lives Ahead of Them4 commissioned by the Bill and
Melinda Gates Foundation. The authors
found that the majority of students who
leave college do so, not because the
institution failed to keep them engaged or
because they found the work too difficult,
but due to finances. The main reason for
students failing to complete a degree
program is that they must drop out in
order to work. Of those surveyed who
dropped out, more than a third said
that even if tuition and book fees were
waived, they could not continue working toward a degree.
They had to work to earn a living.
Because money and
“Student success in college cannot be documented-as it usually is-only in terms
of enrollment, persistence, and degree attainment. These widely used metrics, while important, miss
entirely the question of whether students who have placed their hopes for the future in higher education
are actually achieving the kind of learning they need for a complex and volatile world.”
College Learning for the New Global Century, 2007
finances account for the majority of college
dropouts,5 graduation rates are a misleading metric of institutional
academic quality.
Similarly, job placement and earnings are subject to a multitude of pragmatic factors such as
the state of the economy, the subject in which the student majors, the skill sets gained, and
whether the applicant has the requisite interpersonal and interviewing skills to obtain a
position. More to the point, these factors are largely irrelevant for working adults who are
already in the job market.
In a related and highly charged issue, there is a call today to show the linkage between
higher education and what the Department of Education has termed “gainful
employment.”6
The proposed regulation involves complex formulas linking student loans to potential
earnings for graduates. Although the “gainful employment” spotlight has been focused on
proprietary institutions, all of higher education should be alert to the fact that return on
investment is becoming a key concern as public monies shrink and governments must ensure
efficient use of taxpayer dollars.
Such gainful employment measures should in fact be only a portion of the larger equation,
as they simply do not represent academic quality, nor do they encourage broad education goals
designed to prepare students for the jobs of the future. Indeed, the innovations for
5

industries that have not yet been created will make it imperative for students to have strong
foundations in critical thinking, teamwork, math, science, and the language arts rather than
narrowly defined fields of employment.
Defining Quality: Where to Look and What to Look For
In a general sense, academic quality must be discussed from two perspectives. The first is
as a measure of internal integrity in which key indicators that tie academic outcomes to student
success are part of a system of continuous improvement. The second is as a set of measures by
which, for better or worse, institutions can be compared in regard to student achievement.
That said, University of Phoenix has sought to improve the quality of its educational offerings by
focusing on the essential elements of the student academic experience. This has permitted the
University to identify those elements that must be addressed through an internal system of
continuous improvement in order to better serve students, elements that can be tied to external
benchmarks in order to ensure that students are indeed being better served. Through this process
the University has identified curriculum, assessment of student learning outcomes, and faculty
preparation as basic to the enterprise. It is these elements, we contend, that must be continually
improved as part of the internal integrity process that defines academic quality at the University
and which in turn results in student achievement that can be compared externally. This is a
three-step process: 1) build quality, 2) measure quality, and 3) deliver quality.
Building Quality: Curriculum Development
To ensure academic integrity and to be certain that all courses map to the appropriate
learning outcomes, University of Phoenix draws on the content expertise of more than 32,000
faculty. Curriculum is developed by the colleges in concert with a team of instructional
designers who build courses and programs to outcomes informed by both internal and external
constituencies: faculty, students, employers, programmatic accrediting bodies, and industry
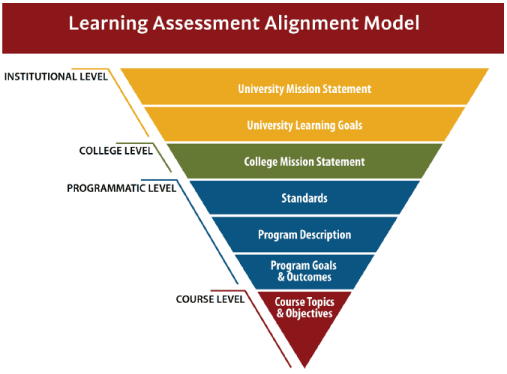
standards. The diagram below shows alignment from the University’s Mission down to course
objectives.
6

The implications of this system are significant as the higher education community considers
the issues of awarding credit and how learning outcomes are tied to student success. Specifically,
this system provides the ability to identify where within a course or program the learning
experiences are provided to develop each student-learning outcome, the ways in which the outcome
has been measured, and the results of that measurement. This measurement need not be tied to seat
time or conventional definitions which, as we have discussed, are largely unrelated to actual
learning.
In 2010 University of Phoenix received the Showcase in Excellence Award from the Arizona Quality
Alliance (AQA)7 in recognition of the University’s commitment to the
development of quality academics through the Program Development Process.
In recognizing University of Phoenix, the Arizona Performance Excellence Award Program used
the Baldrige National Quality Program criteria. The award committee indicated that the University
of Phoenix Program Development Process consisted of four deliberate phases designed to optimize
the alignment with three Baldrige-based core values: customer-driven
excellence, agility, and management by
fact. The phases of the Program
Development Process include research,
conceptual design, and alignment with
institutional and programmatic
accrediting agency requirements. The process
is designed to engage key stakeholder groups
by directly utilizing their input, which in
turn informs the development of academic
programs.
“Recipients of the [Showcase in Excellence] award represent a high level of achievement in approach,
deployment, learning, and integration of organizational process that produce excellent results.
Recipients are expected to share their learning with other organizations.”
AQA Performance Excellence Program
Measuring
Quality: Assessment
As mentioned earlier the Bologna Project, which has been operating for some years in Europe,
has been making recent headlines. In a June 2010 article in The Chronicle of Higher Education, the
Lumina Foundation stated it was “pleased enough with the initial results of the project, which
focused on defining the knowledge and skills that a degree in a given discipline represents, that
it wants to move on to the next stage.”8 This focus—defining the knowledge
and skills students are expected to possess upon graduating with a degree in a given
discipline—has been at the core of both the curriculum design and the assessment process at
University of Phoenix for several years. It is, in fact, one of the major ways
that the University believes academic quality can be engaged, ensured, and evaluated for
improvement.
Assessment is two pronged: one prong devoted to student learning and one for institutional
learning and change. Multiple methods are used to assess each student-learning outcome. From an
internal perspective, the integrity of the learning assessment and institutional evaluation
processes is essential because the data generated provide the fuel for continuous improvement. The
data also provide the means for the faculty and administration to
assess the degree to which goals related to student learning and achievement are being
accomplished. In addition, they serve as a tool for identifying gaps and making improvements
that will increase academic quality. Assessment of student learning leads
to institutional learning. Finally, assessment data provide a basis for measuring outcomes
against external benchmarks.
The University colleges review programmatic data to make changes and improvements in
curriculum, instruction, and assessment processes. Each program is on an improvement cycle with
its respective college. This allows the college to close the loop expediently wherever a gap in
performance may occur. Armed with the information
gained in the assessment processes, each college is well positioned to effectively allocate the
time, resources, and expertise required to enhance student learning.
7

Delivering Quality: Faculty
University of Phoenix currently has more than 32,000 total faculty members. The faculty
consists of Core and Associate Faculty members. Core Faculty make up approximately five percent of
the total and their duties include a combination of instruction and curriculum oversight. The
Associate Faculty are those faculty members contracted to teach on a course-by-course basis. The
role of the faculty member in ensuring academic quality cannot be overstated. For many students,
the faculty member is the face of the institution. This is particularly true in a non-residential
institution such as University of Phoenix.
University of Phoenix faculty unite the curriculum with the student, and faculty members are
encouraged to do this in a way that stimulates discovery, discussion, inquiry, knowledge sharing,
and critical thinking skills. Faculty members are asked to facilitate learning by whatever means
best suits the specific learning outcome they are addressing.
Faculty members at University of Phoenix, whether in the brick and mortar classroom or the virtual
classroom, are asked to ensure that the learning is student centered. To assist faculty in this
collaborative enterprise and to ensure fairly applied expectations, the University requires all
potential faculty members, regardless of their previous teaching experience, to undergo a rigorous
application, certification, and continuous-training process.
Through faculty recruitment, certification, assessment, and mentorship, the University provides
the faculty members with a baseline set of outcomes to be successful and instruction in how to
assess student learning. In addition, the University has implemented assessment procedures and
metrics to gauge faculty success that allow for coaching, development, and timely intervention.
The journey to become a faculty member at University of Phoenix is both challenging and rewarding
and ultimately is focused on enabling the faculty member to provide the best possible learning
experience for students. Faculty selection is a process that includes three phases and in most
cases takes between three and five months to complete. The process is as follows:

Many people express interest in becoming a member of the faculty at the University of
Phoenix. Those interested get information by calling one of the campuses or through the website
www.phoenix.edu.
All prospective candidates must have an advanced degree from an accredited institution. A
candidate may submit an online application which is then reviewed to determine if the applicant’s
background and credentials meet the instructional needs of the University.
Once the applicants become candidates, they are asked to complete Faculty Certification which is
a four-week process that includes but is not limited to managing classrooms, meeting learning
objectives, and grading and evaluation. All candidates are assessed and evaluated throughout the
certification process. Certification also gives faculty candidates an opportunity
to experience the University in the same way students do. Candidates are asked to complete
assignments and to make use of the learning assets and tools available to them and to the students.
Once the candidates have successfully completed Faculty
Certification, they are assigned contracts to teach a class under the supervision of Faculty
Mentors who provide feedback. The Faculty Mentors also
make recommendations to the administration as to the suitability of the candidates. The process
from application to approval as a member of the University of Phoenix faculty can take from three
to five months to complete.
8

Phase 1: Initial Application
| • | Potential faculty members express interest. | |||
| • | Faculty applicants are screened for required credentials which are matched to current curricular needs. | |||
| • | Each credentialed, qualified applicant participates in general and content-area interviews that allow Core Faculty at each campus to assess, beyond credentials, each applicant’s background and content-area knowledge, helping identify those applicants who would best meet the instructional needs of the University. | |||
| • | Following successful interviews, all official documentation of credentials is gathered and verified, including transcripts and licensures. | |||
| • | Applicants are then given an opportunity to demonstrate their instructional aptitude and ability to facilitate learning in the classroom while being assessed by campus faculty. |
Phase 2: Faculty Certification
| • | Once the faculty applicant completes the initial application phase, he or she becomes a faculty candidate. | |||
| • | Faculty candidates complete Faculty Certification which is an extensive knowledge,
competency, and skills training and assessment process. Faculty Certification addresses the following topics: |
| ü | Facilitating adult learning | |||
| ü | Managing classroom skills | |||
| ü | Meeting learning objectives | |||
| ü | Grading and evaluation | |||
| ü | University of Phoenix resources available to students and faculty | |||
| ü | University of Phoenix policies and procedures |
| • | Faculty Certification lasts for four weeks, during which time evaluation of the applicants continues with a more thorough assessment of their ability to facilitate learning and exhibit the positive interpersonal qualities required. Specialized training is provided for some programs, and all faculty candidates are assessed on a weekly basis by a faculty member who is the trainer during the four weeks. | |||
| • | Throughout the certification process, faculty members experience the University in much the same way that students do. Faculty members are asked to complete assignments using the learning assets and tools available to the students so that they know not only where the tools are located, but also how and when to use them to their best advantage. This also gives faculty candidates empathetic insight into what the students experience in an accelerated learning environment. |
Phase 3: Mentorship
| • | After successfully completing faculty certification, clearing a background check, and submitting the University’s new hire documentation, which includes proof of authorization to work in the United States, each faculty candidate continues the selection process by teaching a paid mentorship class with coaching and assessment by a Faculty Mentor (an experienced faculty member). | |||
| • | The faculty candidate is contracted to teach a course under the Mentor’s supervision. The Faculty Mentor provides ongoing feedback to the candidate and makes a recommendation to Academic Affairs based on his or her assessment of the faculty candidate at the end of the mentorship class. | |||
| • | Following successful completion of the mentorship class and a positive recommendation from the Faculty Mentor, the candidate is invited by campus Academic Affairs leadership to join the faculty. |
9

The University is committed to the ongoing professional development of its faculty. This
commitment is evidenced by the variety of programs and activities available to develop and
enhance faculty effectiveness. Regular training and development activities are offered at the
brick and mortar classroom as well as online. These activities provide opportunities for faculty
members to enhance and expand their teaching, assessment, and professional skills. Also, ongoing
faculty evaluation continues at both campus Academic Affairs and the Central Administration
levels. Quality-control processes and systems have been developed to measure and monitor quality
in the classroom.
Reports are generated, distributed on the University-wide intranet, and reviewed by Central
Administration Academic Operations as well as campus personnel. These include the following:
| • | Grade Variance Reports | |||
| • | Student End-of-Course Surveys | |||
| • | Classroom Issues Tracking (CIT) – Classroom issues can be reported by students, Academic Advisors, or administrators. The campus, the faculty member, or the student’s Academic Advisor will follow up on CIT issues for the purpose of achieving success. |
In addition, faculty members are evaluated in several ways, including the following:
| • | Faculty materials for entry-point classes are reviewed periodically. | |||
| • | Unscheduled classroom observations are conducted from time to time by the Directors of Academic Affairs, Program Managers, or Campus College Chairs. | |||
| • | Every instructor is given a peer review by another faculty member, who is trained in reviewing techniques, to provide feedback and best practices at least once every two years. |
The results of these three integrated systems devoted to quality can be measured externally
by the performance of University of Phoenix students as compared to national benchmarks. These
results, along with the lessons learned to date, are presented in the next section.
10

Today the United States competes in a knowledge-based global economy. The demands
of the workplace require workers who will continue their education beyond high
school—and in most cases, throughout their lifetimes. To meet that demand the
University offers more than 100 degree programs at the associate through doctoral
levels. Students can attend class online, in a brick and mortar classroom, or a
combination of both.
Associate Programs |
||
Accounting
|
Information Technology | |
Business
|
IT Networking | |
Communications
|
IT Web Design | |
Criminal Justice
|
IT Support | |
Elementary Education
|
IT Database Development | |
Financial Services
|
Paraprofessional Education | |
General Studies
|
Psychology | |
Health Care Administration
|
Sport Management | |
Health Care Medical Records
|
Travel, Hospitality, and Tourism | |
Health Care Pharmacy Practice
|
Visual Communication | |
Human Services Management |
||
Baccalaureate Programs
BSB
Accounting
Administration
Communications
e-Business
Finance
Global Business Management
Green and Sustainable Enterprise Management
Hospitality Management
Human Resource Management
Information Systems
Integrated Supply chain and Operations
Management
Management
Marketing
Organizational Innovation
Public Administration
Retail Management
Small Business Entrepreneurship
BS
Accounting
Biology
Communication
Environmental Science
History
Psychology
BSM
Management
BA
English
BSEd
Elementary Education
BSHA
Health Administration
Information Systems
Long-Term Care
BSHS
Human Services
Management
BSN
LPN/LVN to BS in Nursing
RN to BS in Nursing
International
BSIT
Business Systems Analysis
Computer Support
Database Administration
Information System Security
Multimedia and Visual Communication
Networking
Software Engineering
Web Development
BSCJA
Criminal Justice Administration
BSOSM
Organizational Security and Management
11

Graduate Programs
MBA
Accounting
Energy Management
Global Management
Health Care Management
Human Resources Management
Marketing
Project Management
Public Administration
Small Business Management
Technology Management
MBA (Spanish)
Global Management (Spanish)
Accounting
Energy Management
Global Management
Health Care Management
Human Resources Management
Marketing
Project Management
Public Administration
Small Business Management
Technology Management
MBA (Spanish)
Global Management (Spanish)
MM
Human Resource Management
Public Administration
International
Human Resource Management
Public Administration
International
MSA
Accountancy
Accountancy
MPA
Public Administration
Public Administration
MHA
Gerontology
Health Care Education
Health Care Informatics
Gerontology
Health Care Education
Health Care Informatics
MIS
Information Systems
Information Systems
MSAJS
Information Systems
Information Systems
MSP
Psychology
Psychology
MAEd
Administration and Supervision
Curriculum and Instruction
Curriculum and Instruction
Administration and Supervision
Curriculum and Instruction
Curriculum and Instruction
| • | ESL | |
| • | Computer Education | |
| • | Mathematics | |
| • | Language Arts |
Early Childhood
Teacher Education/Elementary
Teacher Education/Secondary
Teacher Leadership
Special Education
Adult Education and Training
Teacher Education/Elementary
Teacher Education/Secondary
Teacher Leadership
Special Education
Adult Education and Training
MSN
Health Administration
Nurse Practitioner
MBA/Health Care
Health Administration
Nurse Practitioner
MBA/Health Care
MSC
Community Counseling
Marriage and Family Counseling
Marriage and Family Therapy
Marriage, Family and Child Therapy
Mental Health Counseling
School Counseling
Community Counseling
Marriage and Family Counseling
Marriage and Family Therapy
Marriage, Family and Child Therapy
Mental Health Counseling
School Counseling
Doctoral Programs
DBA
Business Administration
Business Administration
DM
Organizational Leadership
Organizational Leadership/
Organizational Leadership
Organizational Leadership/
| • | Information Systems and Technology |
DHA
Health Administration
Health Administration
EdD
Educational Leadership
Educational Leadership
Educational Leadership
Educational Leadership
| • | Curriculum and Instruction | |
| • | Educational Technology |
EDS
Educational Specialist
Educational Specialist
PhD
Industrial/Organizational Psychology
Higher Education Administration
Nursing
Industrial/Organizational Psychology
Higher Education Administration
Nursing
12

Accreditation
University of Phoenix operates campuses and learning centers in 39 states, the District
of Columbia, and Puerto Rico. The University must conform to all state and national laws
regarding licensed businesses and the regulations of various departments of education as well
as higher education regulatory authorities in each jurisdiction in which the University
operates.
University of Phoenix is regionally accredited by the Higher Learning Commission
and a member of the North Central Association of Colleges and
Schools9 and has held this
accreditation since 1978. In addition to regional accreditation, the University has applied
for and been granted programmatic accreditation for several individual academic programs:
Table 1: Programmatic Accreditation
| Accrediting Body | Acronym | Contact Information | |||||||||
Nursing
|
Commission on Collegiate Nursing Education |
CCNE | www.aacn.nche.edu American Association of Colleges of Nursing One Dupont Circle NW Suite 530 Washington, DC 20036 |
||||||||
Counseling
|
Council for Accreditation of Counseling and Related Educational Programs | CACREP | www.cacrep.org Council for Accreditation of Counseling and Related Educational Programs 1001 North Fairfax Street, Suite 510 Alexandria, VA 22314 |
||||||||
Business
|
Accreditation Council for Business Schools and Programs | ACBSP | www.acbsp.org Accreditation Council for Business Schools and Programs 11520 West 119th Street Overland Park , KS 66213 |
||||||||
Education
|
Teacher Education Accreditation Council |
TEAC | www.teac.org Teacher Education Accreditation Council One Dupont Circle NW Suite 320 Washington, DC 20036 |
||||||||
Benchmarking Quality: Accountability and Transparency
In general, there is congruency in results this year as compared to the last two Academic
Annual Reports (2008, 2009). Student and faculty diversity in ethnicity and
gender remain about the same as last year. In the area of student satisfaction, the results
reported in the
National Survey of Student Engagement (NSSE)10 are essentially the same
as in 2009.
In the area of information literacy, the results shown from the Standardized Assessment of
Information Literacy Skills (SAILS)11 indicate that scores for seniors
are greater than those for freshmen. The general education knowledge and skills of freshmen
and seniors, as measured by the ETS® Proficiency
Profile,12
were roughly equivalent to the scores of freshmen and
seniors from last year.
The completion rates for the University show a slight decline in the percentage of students
graduating in 150 percent of the traditional time to degree completion. The University believes
that these changes arise from difficulties associated with current
economic conditions. However, the University believes the new
orientation program (outlined in the 2009 Academic Annual Report and
detailed later in this report) could mitigate this decline, in part
by ascertaining student commitment.
13

DEMOGRAPHICS
The Students
Throughout its history, the University has sought to provide access to higher education to
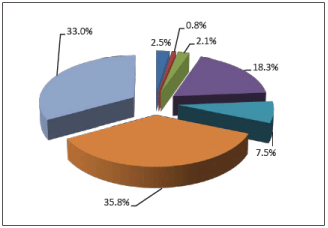
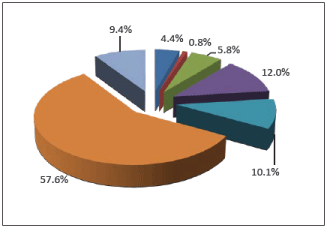
all those who were willing to put in the effort to earn a degree. Close to half of the University’s
enrollment consists of students from underrepresented racial or ethnic communities.
Graph 1: UOPX Total Student Ethnicity
|
Graph 2: National Total Student Ethnicity | |
|
 |
|
Source: Original data submitted by UOPX to NCES through IPEDS Fall Enrollment Survey 2009-2010. |
Source: IPEDS Fall Enrollment Survey for 2009-2010 including 2,774 four-year institutions. |
n Non-resident Alien
|
n Hispanic or Latino/Hispanic | |
n American Indian or Alaskan Native
|
n White/White non-Hispanic | |
n Asian/Native Hawaiian or other Pacific Islander
|
n Race/Ethnicity Unknown | |
n Black or African American/Black non-Hispanic |
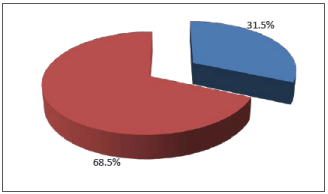
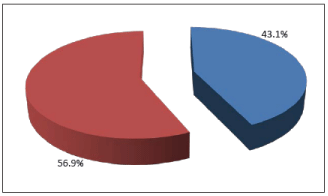
Female students make up two thirds of the total enrollment at University of Phoenix as
opposed to just over half of the overall enrollment in colleges in universities nationwide.
Graph 3: UOPX Total Student Gender
|
Graph 4: National Total Student Gender | |
|
 |
|
Source: Original data submitted by UOPX to NCES through IPEDS Fall Enrollment Survey 2009-2010. |
Source: IPEDS Fall Enrollment Survey for 2009-2010 including 2,774 four-year institutions. |
n Male
n Female
14

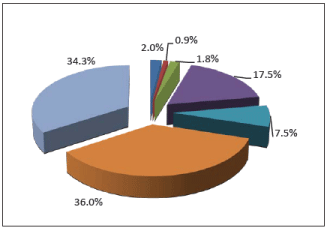
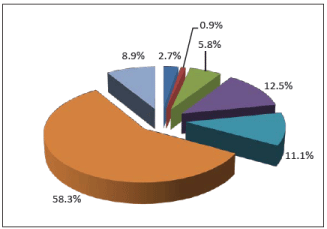
Undergraduate enrollment at University of Phoenix is more ethnically diverse than the latest
national enrollment figures provided by NCES.13
Graph 5: UOPX Undergraduate Student Ethnicity
|
Graph 6: National Undergraduate Student Ethnicity | |
|
 |
|
Source:
Original data submitted by UOPX to NCES through IPEDS Fall Enrollment Survey 2009-2010. |
Source: IPEDS Fall Enrollment
Survey for 2009- 2010 including 2,774 four-year institutions. |
n Non-resident Alien
|
n Hispanic or Latino/Hispanic | |
n American Indian or Alaskan Native
|
n White/White non-Hispanic | |
n Asian/Native Hawaiian or other Pacific Islander
|
n Race/Ethnicity Unknown | |
n Black or African American/Black non-Hispanic |
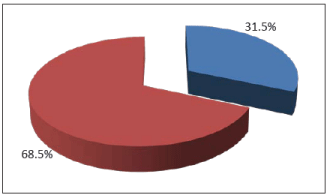
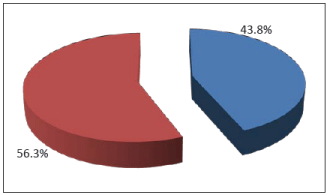
Female students make up more than 68 percent of the undergraduate University of
Phoenix enrollment as compared to approximately 56 percent of the national undergraduate
enrollment.
Graph 7: UOPX Undergraduate Student Gender
|
Graph 8: National Undergraduate Student Gender | |
|
 |
|
Source: Original data submitted by UOPX to NCES through IPEDS Fall Enrollment Survey 2009-2010. |
Source: IPEDS Fall Enrollment Survey for 2009-2010 including 2,774 four-year institutions. |
n Male
n Female
15

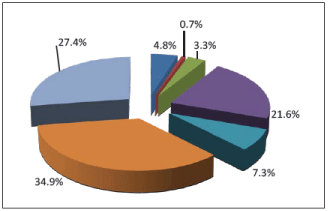
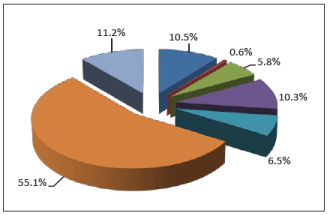
Graduate student enrollment at University of Phoenix is ethnically diverse with more than 50
percent minority enrollment.
Graph 9: UOPX Graduate Student Ethnicity
|
Graph 10: National Graduate Student Ethnicity | |
|
 |
|
Source:
Original data submitted by UOPX to NCES through IPEDS Fall Enrollment Survey 2009-2010. |
Source: IPEDS Fall Enrollment Survey for 2009-2010 including 2,774 four-year institutions. |
n Non-resident Alien
|
n Hispanic or Latino/Hispanic | |
n American Indian or Alaskan Native
|
n White/White non-Hispanic | |
n Asian/Native Hawaiian or other Pacific Islander
|
n Race/Ethnicity Unknown | |
n Black or African American/Black non-Hispanic |
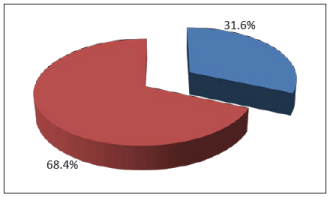
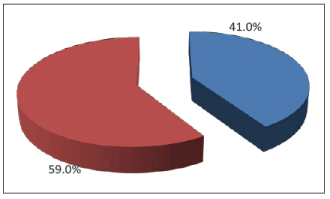
Female graduate students make up 68 percent of the University’s graduate enrollment as
compared to approximately 60 percent nationally.
Graph 11: UOPX Graduate Student Gender
|
Graph 12: National Graduate Student Gender | |
|
 |
|
Source:
Original data submitted by UOPX to NCES through IPEDS Fall Enrollment Survey 2009-2010. |
Source: IPEDS Fall Enrollment
Survey for 2009-2010 including 2,774 four-year institutions. |
n Male
n Female
16

The Faculty
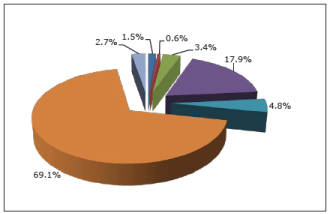
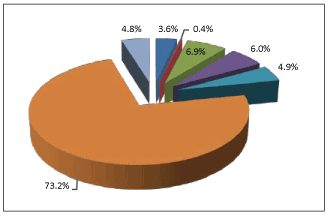
The following charts show the ethnicity and gender breakdown for University of Phoenix
faculty, as well as national faculty demographics. Faculty ethnicity for the University is more
diverse than the figures provided by the National Center for Educational Statistics for American
faculty in general.
Graph 13: UOPX Faculty Ethnicity
|
Graph 14: National Faculty Ethnicity | |
|
 |
|
Original data submitted by UOPX to IPEDS
Human Resources Survey |
IPEDS Human Resources Survey for 2009 |
n Non-resident Alien
|
n Hispanic or Latino/Hispanic | |
n American Indian or Alaskan Native
|
n White/White non-Hispanic | |
|
n Asian/Native Hawaiian or other Pacific Islander
|
n Race/Ethnicity Unknown | |
|
n Black or African American/Black non-Hispanic |
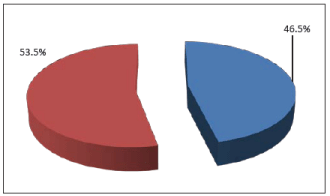
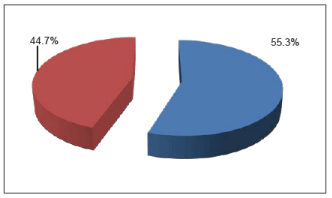
Women now make up more than half of University of Phoenix faculty. The percentage of
female faculty at University of Phoenix rose from 49 percent in 2009 to 53.5 percent this
year.
Graph 15:UOPX Faculty Gender
|
Graph 16: National Faculty Gender | |
|
 |
|
Original
data submitted by UOPX to IPEDS Human Resources Survey |
IPEDS Human Resources Survey for 2009 |
n Male
n Female
17

Comparative Outcome Results
Student Satisfaction
The University regularly conducts student satisfaction surveys and uses these results to
implement change within the organization. The following tables show student satisfaction at
University of Phoenix as compiled from internal surveys.
Student End-of-Course Surveys
As these surveys indicate, University of Phoenix students rate each category high at
approximately 90 percent or better in each area.
Table 2: UOPX Student Satisfaction
| End-of-Course Survey | 09/2009 to 04/2010 | ||||
Faculty Effectiveness |
92.2% | ||||
Curriculum Effectiveness |
92.6% | ||||
Academic Services |
94.7% | ||||
Financial Aid Services |
89.4% | ||||
Note: Results shown for a partial year, as a change in the measurement tool was implemented
after April 2010.
Source: University of Phoenix Student End-of-Course Surveys, available to
students at the end of every course.
End-of-Program Surveys
End-of-Program Surveys indicate that students feel their experience at the University was
a positive one. When asked at the end of their degree programs how they felt about their
experiences at the University, they rated all services and categories well above average.
Table 3: UOPX Student End-of-Program Graduate Surveys
| End-of-Program Survey | 09/2009 to 08/2010 | ||||
Enrollment Counseling |
4.29 | ||||
Academic Advising |
4.20 | ||||
Financial Aid Services |
3.86 | ||||
Quality of Instruction |
4.37 | ||||
Availability of Faculty |
3.75 | ||||
Learning Teams |
3.83 | ||||
Library/Learning Resources |
4.39 | ||||
Note: End-of-Program Surveys are based on a Likert scale of 1-5 (where 1 = Strongly Disagree
and 5 = Strongly Agree).
Source: University of Phoenix Student End-of-Program Surveys, available to students at the
conclusion of the students’ programs.
18

Alumni Survey
The satisfaction level with a University of Phoenix education and experience continues after
students graduate. Overall, alumni rated the University positively in all categories.
Table 4: UOPX Alumni Survey
| Alumni Survey | Mean Score | “n” varies by | ||||||||||
| 2010 | item | |||||||||||
Education met expectations. |
4.01 | 5977 | ||||||||||
UOPX offers high quality education. |
4.09 | 5987 | ||||||||||
UOPX education is useful in profession. |
3.99 | 5973 | ||||||||||
UOPX degree comparable to similar degrees from other institutions. |
3.74 | 5978 | ||||||||||
Note: Mean score computations derived from Likert-type items, 1= Strongly Disagree to
5=Strongly Agree. Calculations weighted based on program proportion (stratum) for master’s and
bachelor’s degree levels combined. Source: 2010 Academic Questionnaire for Alumni, web-based
survey administered to sample of FY2006-FY2009 graduates.
National Survey of Student Engagement
University of Phoenix also uses an external measure of student satisfaction, the National
Survey of Student Engagement (NSSE). This year’s survey reports on the 2009 academic year. In an
effort to ensure a geographically diverse sample, the FY09 NSSE was administered on a voluntary
basis to all freshmen and seniors at four University of Phoenix campuses: Atlanta, Detroit,
Houston, and Phoenix.
As noted in the following tables, University of Phoenix seniors’ responses that relate to
the stated University of Phoenix Learning Goals14 are compared to
accumulated average responses by students attending other institutions of higher education
offering at least baccalaureate through master’s degree programs. In nine of the ten categories,
University
of Phoenix students rate the University higher than the national average response rating; in
the remaining category, University of Phoenix students rate their satisfaction with “Acquiring a
broad general education” at the same rate as their peer group.
Table 5: National Survey of Student Engagement
| NSSE Questions that relate to UOPX Learning Goals | UOPX | Master’s | ||||||||
| Percentage of seniors who felt their college/university | FY 2009 | Universities and | ||||||||
| contributed “quite a bit” or “very much” to their knowledge, | Collegesb | |||||||||
| skills, and personal development in the following areas: | n = 781a | n = 68,066a | ||||||||
Acquiring a broad general education |
84% | 84% | ||||||||
Acquiring
job- or work-related knowledge and skills |
82% | 77% | ||||||||
Developing a personal code of values and ethics |
67% | 63% | ||||||||
Thinking critically and analytically |
91% | 88% | ||||||||
Analyzing quantitative problems |
82% | 75% | ||||||||
Solving complex real-world problems |
75% | 64% | ||||||||
Writing clearly and effectively |
90% | 79% | ||||||||
Speaking clearly and effectively |
87% | 75% | ||||||||
Using computing and information technology |
84% | 80% | ||||||||
Working effectively with others |
89% | 81% | ||||||||
| a Exact
sample size varies by item. b “Master’s Universities and Colleges” refers to institutions that offer baccalaureate through master’s degrees. |
|
19

Information Literacy
The skills required to become successful in the digital workplace are woven throughout the
five Learning Goals required for all University of Phoenix courses and programs: professional
competence and values, critical thinking and problem solving, communication, information
utilization, and collaboration.
In addition, the University has taken steps to ensure that the way students learn emulates the
way professionals work today. The University Library houses more than 75,000 unique full-text
publications and 280 information resources. The University Library is available to users seven
days a week from anywhere there is an Internet connection. The University has been building an
eBook Collection that now contains approximately 1,900 books and reference sources being used in
91 percent of all courses. Students and faculty have access to the entire eBook Collection
throughout their degree programs.
Another example is Virtual Organizations, which are realistic web-based businesses, schools,
health care, and government organizations that promote authentic assessment by immersing
students into problem-based learning environments. Virtual Organizations provide a solution to
the difficulties students have in gaining access to proprietary information. They also provide a
relevant context for students to practice solving workplace problems. Virtual Organizations are
distinct from simulations and case studies because they present students with a microcosm of the
real world. Students must first determine what data is needed to solve a problem, locate the
appropriate information by data mining a specific Virtual Organization, and apply that
information to solve the problem. Virtual Organizations provide students a full range of data
that includes financial statements, personnel records, and other information essential to
practice applying theoretical knowledge to solving problems. An average of 50,000 unique users
access Virtual Organizations each month.
Standardized Assessment of Information Literacy Skills
In an effort to benchmark student achievement in information literacy as compared
to students from other similar institutions and to make internal University of Phoenix
comparisons, the University makes use of the Standardized Assessment of Information
Literacy Skills (SAILS) originally developed by Kent State University.15
The SAILS assessment is based on the following Association of College and Research
Libraries (ACRL)16 Information Literacy Competency Standards for
Higher Education:
| • | Standard I: The information literate student determines the nature and extent of the information needed. | ||
| • | Standard II: The information literate student accesses needed information effectively and efficiently. | ||
| • | Standard III: The information literate student evaluates information and its sources critically and incorporates selected information into his or her knowledge base and value system. | ||
| • | Standard V:* The information literate student understands many of the economic, legal, and social issues surrounding the use of information and accesses and uses information ethically and legally. | ||
| *ACRL Standard IV is not used in the SAILS assessment. |
20

A random sample of undergraduate University of Phoenix students was asked via email to
voluntarily participate in the SAILS program. The sampling frame included students who had
attended a course in the last six months but who were not included in the SAILS administration
in 2009.
As the SAILS Freshmen table shows, on average University of Phoenix freshmen scored as well or
better in half of the eight areas measured through the SAILS assessment; in the four remaining
areas, they had lower scores than freshmen students at other institutions offering at least
baccalaureate through master’s level programs. However, after taking into account the standard
error, the performances between the two groups were essentially equivalent except on the
Documenting Sources skill set. On that skill set, University of Phoenix freshmen on average
underperformed students in the comparison group.
Table 6: SAILS Freshmen
| Skill Set | UOPX FY 2010 | Master’s Universities | UOPX Performance | ||||||||||||
| & Collegesa | versus | ||||||||||||||
| n = 542 | n = 8,494 | Comparison Group | |||||||||||||
| Mean | Std. Errorb | Mean | Std. Errorb | ||||||||||||
Developing Research Strategy |
547 | 9 | 542 | 2 | Equivalent | ||||||||||
Selecting Finding Tools |
547 | 11 | 533 | 3 | Equivalent | ||||||||||
Searching |
519 | 9 | 520 | 2 | Equivalent | ||||||||||
Using Finding Tools Features |
536 | 14 | 544 | 3 | Equivalent | ||||||||||
Retrieving Sources |
531 | 13 | 539 | 4 | Equivalent | ||||||||||
Evaluating Sources |
569 | 9 | 559 | 2 | Equivalent | ||||||||||
Documenting Sources |
525 | 11 | 543 | 3 | Underperformed | ||||||||||
Understanding Economic, Legal,
Social Issues |
522 | 10 | 518 | 2 | Equivalent | ||||||||||
Note: “Outperformed” = UOPX students had a statistically significant higher mean score on the skill set compared
to the normative group. “Underperformed” = UOPX students had a statistically significant lower
mean score. “Equivalent” = the mean scores were
statistically equivalent. Alpha (α) = 0.05 for
all significance tests. Scores range from 0 to 1000.
a
“Master’s Universities & Colleges” refers to institutions that
offer baccalaureate through master’s degrees.
b Std. Error = Standard error.
21

The next table, SAILS Seniors, shows that University of Phoenix seniors compare favorably or
the same in benchmark comparisons to students at other similar institutions.
Table 7: SAILS Seniors
| Skill Set | UOPX FY 2010 | Master’s Universities | UOPX Performance | ||||||||||||
| & Collegesa | versus | ||||||||||||||
| n = 183 | n = 2,374 | Comparison Group | |||||||||||||
| Mean | Std. Errorb | Mean | Std. Errorb | ||||||||||||
Developing Research Strategy |
584 | 16 | 576 | 4 | Equivalent | ||||||||||
Selecting Finding Tools |
574 | 20 | 570 | 5 | Equivalent | ||||||||||
Searching |
559 | 16 | 558 | 4 | Equivalent | ||||||||||
Using Finding Tools Features |
575 | 23 | 581 | 6 | Equivalent | ||||||||||
Retrieving Sources |
596 | 26 | 594 | 7 | Equivalent | ||||||||||
Evaluating Sources |
599 | 15 | 592 | 4 | Equivalent | ||||||||||
Documenting Sources |
586 | 18 | 595 | 5 | Equivalent | ||||||||||
Understanding Economic, Legal,
Social Issues |
563 | 17 | 556 | 5 | Equivalent | ||||||||||
Note: “Outperformed” = UOPX students had a statistically significant higher mean score on the skill set compared
to the normative group. “Underperformed” = UOPX students had a statistically significant lower
mean score. “Equivalent” = the mean scores were
statistically equivalent. Alpha (α) = 0.05 for
all significance tests. Scores range from 0 to 1000.
a
“Master’s Universities & Colleges” refers to institutions that
offer baccalaureate through master’s degrees.
b Std. Error = Standard error.
University of Phoenix seniors performed significantly higher than University of Phoenix
freshmen on seven of the eight skill sets.
Table 8: SAILS UOPX Seniors vs. UOPX Freshmen
| Skill Set | UOPX Freshmen | UOPX Seniors | UOPX Seniors vs. | ||||||||||||
| n = 542 | n = 183 | UOPX Freshmen | |||||||||||||
| Mean | Std. Errora | Mean | Std. Errora | ||||||||||||
Developing Research Strategy |
547 | 9 | 584 | 16 | Outperformed | ||||||||||
Selecting Finding Tools |
547 | 11 | 574 | 20 | Equivalent | ||||||||||
Searching |
519 | 9 | 559 | 16 | Outperformed | ||||||||||
Using Finding Tools Features |
536 | 14 | 575 | 23 | Outperformed | ||||||||||
Retrieving Sources |
531 | 13 | 596 | 26 | Outperformed | ||||||||||
Evaluating Sources |
569 | 9 | 599 | 15 | Outperformed | ||||||||||
Documenting Sources |
525 | 11 | 586 | 18 | Outperformed | ||||||||||
Understanding Economic, Legal,
Social Issues |
522 | 10 | 563 | 17 | Outperformed | ||||||||||
Note: “Outperformed” = UOPX seniors had a statistically significant higher mean score on the
skill set compared to UOPX freshmen. “Underperformed” = UOPX seniors had a statistically
significant lower mean score. “Equivalent” = the mean scores were statistically equivalent. Alpha
(α) = 0.05 for all significance tests. Scores range from 0 to
1000.
a Std. Error = Standard error.
22

Academic Proficiency and Progress
In the last twenty years, the accreditation community has placed significantly
greater emphasis on the importance of assessing student learning.
ETS® Proficiency Profile
As a part of the assessment process, University of Phoenix has used the Measure of Academic
Proficiency and Progress (MAPP) assessment developed by the Educational Testing Service (ETS) and
reported the results in the 2008 and 2009 Academic Annual Reports. This year,
ETS® changed the name from MAPP to the ETS®
Proficiency Profile (EPP). The skill sets measured and the metrics used remain the
same.17
ETS is a non-profit organization with a mission to advance” quality and equity in
education for people worldwide by creating assessments based on rigorous
research.”18 ETS administers the EPP, a test of college-level skills in
critical thinking, reading, writing,
mathematics, humanities, social sciences, and natural sciences for undergraduate students.
The assessment was developed to assist institutions in evaluating the outcomes of general
education programs to improve the quality of instruction and learning. According to their
website, EPP results allow the institution to:
| • | Gain a unified picture of the effectiveness of the general education program to meet requirements for accreditation and performance funding. |
| • | Promote curriculum improvement with actionable score reports that can be used to pinpoint strengths and areas of improvement. |
By providing comparative data on more than 380 institutions and 375,000 students
nationwide, it provides quantitative data to measure continuous improvement. The
results of the EPP assessment are shown on the following tables.
| • | University of Phoenix freshmen slightly underperformed freshmen in the comparison group in the areas of Critical Thinking, Reading, Writing, and Natural Sciences; however, the differences between the two groups were slight and of limited practical significance. | |||
| • | University of Phoenix freshmen moderately underperformed freshmen in the comparison group in the area of Mathematics. | |||
| • | University of Phoenix freshmen performed equivalently on items related to the Humanities and Social Sciences. | |||
| • | University of Phoenix seniors slightly underperformed seniors in the comparison group in the areas of Critical Thinking, Humanities, Social Sciences, and Natural Sciences; however, the differences between the two groups were slight and of limited practical significance. | |||
| • | University of Phoenix seniors moderately underperformed seniors in the comparison group in the areas of Reading, Writing, and Mathematics. | |||
| • | University of Phoenix seniors slightly outperformed University of Phoenix freshmen in all of the areas except Natural Sciences, where the groups performed equivalently. |
23

Table
9: ETS® Proficiency Profile (EPP) Freshmen Institutional Comparison
| Skill Set | UOPX FY 2010 | Master’s Universities | UOPX Performance | |||||||||||||||||
| & Collegesa b | versus | |||||||||||||||||||
| n = 4,003 | n = 7,728 | Comparison Group | ||||||||||||||||||
| Mean | Std. Dev.c | Mean | Std. Dev.c | |||||||||||||||||
Critical Thinking |
108.2 | 5.2 | 109.6 | 5.9 | Slightly Underperformed | |||||||||||||||
Reading |
113.9 | 6.8 | 116.6 | 7.0 | Slightly Underperformed | |||||||||||||||
Writing |
110.8 | 4.8 | 113.3 | 5.0 | Slightly Underperformed | |||||||||||||||
Mathematics |
108.3 | 4.4 | 112.4 | 5.8 | Moderately Underperformed | |||||||||||||||
Humanities |
112.6 | 5.9 | 113.3 | 6.2 | Equivalent | |||||||||||||||
Social Sciences |
111.0 | 5.7 | 112.1 | 6.0 | Equivalent | |||||||||||||||
Natural Sciences |
111.9 | 5.8 | 113.6 | 5.7 | Slightly Underperformed | |||||||||||||||
Note: “Strongly Outperformed” = significant difference between means in a positive direction with an effect size >
0.80; “Moderately Outperformed” = significant difference between means in a positive direction with an effect size
of 0.51-0.80; “Slightly Outperformed” = significant difference between means in a positive direction with an effect
size of 0.20-0.50; “Equivalent” = either no significant difference or a significant difference with an effect size of <
0.20; “Slightly Underperformed” = significant difference between means in a negative direction with an effect size
of 0.20-0.50; “Moderately Underperformed” = significant difference between means in a negative direction with
an effect size of 0.51-0.80; “Strongly Underperformed” = significant difference between means in a negative direction with
an effect size of > 0.80. Alpha (α) = 0.05 for all significance tests. Scores range from 100 to 130.
| a Weighted totals. |
| b “Master’s Universities & Colleges” refers to institutions that offer baccalaureate through master’s degrees. |
| c Std. Dev. = Standard deviation |
Table 10: ETS® Proficiency Profile (EPP) Seniors Institutional Comparison
| Skill Set | UOPX FY 2010 | Master’s Universities | UOPX Performance | |||||||||||||||||
| & Collegesa b | versus | |||||||||||||||||||
| n = 2,428 | n = 42,649 | Comparison Group | ||||||||||||||||||
| Mean | Std. Dev.c | Mean | Std. Dev.c | |||||||||||||||||
Critical Thinking |
109.5 | 5.9 | 112.1 | 6.5 | Slightly Underperformed | |||||||||||||||
Reading |
115.6 | 7.4 | 119.5 | 9.8 | Moderately Underperformed | |||||||||||||||
Writing |
112.4 | 5.1 | 115.1 | 4.8 | Moderately Underperformed | |||||||||||||||
Mathematics |
110.2 | 5.4 | 114.0 | 6.1 | Moderately Underperformed | |||||||||||||||
Humanities |
114.1 | 6.4 | 115.7 | 6.5 | Slightly Underperformed | |||||||||||||||
Social Sciences |
112.3 | 6.1 | 114.4 | 6.4 | Slightly Underperformed | |||||||||||||||
Natural Sciences |
113.0 | 6.1 | 115.9 | 5.8 | Slightly Underperformed | |||||||||||||||
Note: “Strongly Outperformed” = significant difference between means in a positive direction with an effect size >
0.80; “Moderately Outperformed” = significant difference between means in a positive direction with an effect size
of 0.51-0.80; “Slightly Outperformed” = significant difference between means in a positive direction with an effect
size of 0.20-0.50; “Equivalent” = either no significant difference or a significant difference with an effect size of <
0.20; “Slightly Underperformed” = significant difference between means in a negative direction with an effect size
of 0.20-0.50; “Moderately Underperformed” = significant difference between means in a negative direction with
an effect size of 0.51-0.80; “Strongly Underperformed” = significant difference between means in a negative direction with an effect
size of > 0.80. Alpha (α) = 0.05 for all significance tests. Scores range from 100 to 130.
| a Weighted totals. |
| b “Master’s Universities & Colleges” refers to institutions that offer baccalaureate through master’s degrees. |
| c Std. Dev. = Standard deviation. |
24

Table
11: ETS® Proficiency Profile (EPP) Seniors vs. Freshmen UOPX Comparison
| Skill Set | UOPX Freshmen | UOPX Seniorsa | UOPX Seniors | |||||||||||||||||
| FY 2010 | FY 2010 | versus | ||||||||||||||||||
| n = 4,003 | n = 2,428 | UOPX Freshmen | ||||||||||||||||||
| Mean | Std. Devb | Mean | Std. Devb | |||||||||||||||||
Critical Thinking |
108.2 | 5.2 | 109.5 | 5.9 | Slightly Outperformed | |||||||||||||||
Reading |
113.9 | 6.8 | 115.6 | 7.4 | Slightly Outperformed | |||||||||||||||
Writing |
110.8 | 4.8 | 112.4 | 5.1 | Slightly Outperformed | |||||||||||||||
Mathematics |
108.3 | 4.4 | 110.2 | 5.4 | Slightly Outperformed | |||||||||||||||
Humanities |
112.6 | 5.9 | 114.1 | 6.4 | Slightly Outperformed | |||||||||||||||
Social Sciences |
111.0 | 5.7 | 112.3 | 6.1 | Slightly Outperformed | |||||||||||||||
Natural Sciences |
111.9 | 5.8 | 113.0 | 6.1 | Equivalent | |||||||||||||||
Note: Strongly Outperformed = significant difference between means in a positive direction with an effect size >
0.80; Moderately Outperformed = significant difference between means in a positive direction with an effect size of
0.51-0.80; Slightly Outperformed = significant difference between means in a positive direction with an effect size
of 0.20-0.50; Equivalent = either non-significant difference or a significant difference with an effect size of < 0.20;
Slightly Underperformed = significant difference between means in a negative direction with an effect size of
0.20-0.50; Moderately Underperformed = significant difference between means in a negative direction with an effect size
of 0.51-0.80; Strongly Underperformed = significant difference between means in a negative direction with an effect
size of > 0.80. Alpha (α) = 0.05 for all significance tests. Scores
range from 100 to 130.
| a Weighted totals. |
| b Std. Dev. = Standard Deviation |
Completion Rates
Below are completion rates for University of Phoenix showing associate, baccalaureate,
and graduate students, as well as the Integrated Postsecondary Education Data System
(IPEDS)19 public institution completion rates. IPEDS only considers
“first-time” college students. University of Phoenix, however, includes all students.
The University calculates completion rates of all enrolled students, including first-time
attendees as well as those with prior college experience. The University completion rate is
defined as the percentage of students who completed at least three credits and went on to be
degree-complete within 150 percent of normal degree completion time. Data are
collected on the number of students entering the institution as degree-seeking students in a
particular cohort year.
Table 12: UOPX Completion Rates
| Program Level | 3 Years | >3 Years | 6 Years | >6 Years | ||||||||||||||||||
Associate 2005 Cohort |
23 | % | 24 | % | ||||||||||||||||||
Bachelor 2002 Cohort |
34 | % | 36 | % | ||||||||||||||||||
Graduate 2005 Cohort |
55 | % | 63 | % | ||||||||||||||||||
Source: UOPX Academic Dashboard.
25

In accordance with the Higher Education Act (HEA) of 1965, as amended, each postsecondary
educational institution must publish information regarding graduation rates as defined by the
National Center for Education Statistics (IPEDS).20 This graduation measure
includes
only undergraduate degree–seeking students who have never attended another institution of
higher learning and who graduate within 150 percent of normal time to completion. Data
are collected on the number of students entering the institution as full-time, first-time
degree seeking or certificate-seeking undergraduate students in a particular cohort year.
Table 13: IPEDS Graduation Rates
| Program Level | 3 years | 6 years | ||||||||||
Associate 2005 cohort |
20% | |||||||||||
Bachelor 2002 cohort |
53% | |||||||||||
Graduate 2005 cohort |
n/a | |||||||||||
Note: IPEDS rates shown are for public institutions.
Source: NCES-Table 26.
Source: NCES-Table 26.
Lessons Learned: Improving the Quality of the Student Experience
The completion rates for the University show a slight decline from the rates shown in
the 2009 Academic Annual Report in the percentage of students graduating in 150 percent of
the traditional time to degree completion. The University believes that most of these
changes arise from difficulties associated with current economic conditions. However, the University’s
orientation program announced in the 2009 Academic Annual Report may help mitigate future declines by giving
students the opportunity to better understand the demands of a college education, and if needed, self-select
out prior to enrolling at the University.
The orientation program was developed in an effort to assist students succeed at the University
and to try to assist prospective students in making an informed decision about whether to invest
their time, money, and effort. The University began limited beta testing of a no-charge,
pass/fail orientation in 2009. The orientation program was designed for those students entering
the University with fewer than 24 credits.
“The more institutions accept their responsibility [for student learning] the more the
students will. Where institutions are clear as to the expected learning outcomes, where there
are meaningful assessments of student learning, and where these assessments guide continuous
efforts to improve the quality of learning, the student’s sense of responsibility for truly
mastering learning soars.”
The Future of Higher Education, 2004
University Orientation is three weeks long and delivered in the same format as a regular
class. Students must complete non-graded assignments that are similar in nature to the way they
will be working in class. With the addition of this requirement prior to enrollment, prospective
students gain a better understanding of the time commitments required for university-level study
and how it will or will not fit into their busy lives.
The beta test of the new University Orientation program was rolled out to approximately
30,000 students. The results of that beta group show that approximately 80 percent of the students
who start the University Orientation finish it. The retention rates for those who complete
University Orientation are higher than those for students who do not go through the program.
26

The increase in initial retention rate suggests that program completion rates may eventually
improve, which is one of the goals of the University Orientation. These students also appear to be
faring better in the critical first three classes; these initial courses are the ones
that historically have proven to be the point at which most students drop out. Anecdotal
evidence from faculty indicates that the students who have completed orientation are better
prepared for the rigors of the classroom. Students report that they come out of University
Orientation with a positive attitude. This was reported by a large group of students, which
included those students who did not complete the orientation successfully, and those who, after
gaining a clear understanding of what would be expected of them, self-selected out and did not
enroll in a degree program.
University administrators have reviewed the comments and results of the new student
orientation and have determined that this program is a valuable tool to increase student
retention, academic success, and an understanding of expectations prior to enrollment.
Student participation in an orientation that mirrors the way they will be expected to learn
in an accelerated environment, with a clear understanding of the type of assignments that will be
required, will assist the University in placing the right student in the right program.
The University believes that the results of the new student orientation, although somewhat
preliminary in nature, show that students are benefiting from the new program. It is hoped that
the increase in course completion by students who have successfully completed the new orientation
will continue and may eventually result in increased persistence throughout the students’ degree
programs. The orientation was implemented University-wide in November 2010, and the resulting
increase in retention will not show up as an increase in completion rates until sometime in the
future when the students earn their degrees.
Affordability and Return on Investment
Student Salary Increases While Enrolled
Many University of Phoenix students are employed full time while enrolled. Internal research
has shown that University of Phoenix students’ average annual salaries for the time they are
enrolled in their program of study increase at higher rates than the national average salary
increase for the same time period.
Table 14: UOPX Average Student Salary Increases
| UOPX Average | National Average | |||||||||||
| 2010 Graduating Cohorts | Annual Salary | Annual Salary | ||||||||||
| Increase during | Increase same | |||||||||||
| program enrollment | period | |||||||||||
Associates Reporting (n = 2,544) |
5.9 | % | ||||||||||
Bachelors Reporting (n = 9,683) |
6.8 | % | ||||||||||
Masters Reporting (n = 1,652) |
6.5 | % | 2.9 | % | ||||||||
Doctors Reporting (n = 336) |
5.0 | % | ||||||||||
All Reporting (n = 14,215) |
6.6 | % | ||||||||||
Note: All post–pre differences
are statistically significant (p < .001).
Source: UOPX Institutional Research – Entering Student Income, UOPX Registration Survey – Completing Student Income, and UOPX End-of-Program Survey. National data is for all job classifications, from Bureau of Labor Statistics and www.culpepper.com/eBulletin/2010/SalaryIncreaseBudgets0910.asp.
Source: UOPX Institutional Research – Entering Student Income, UOPX Registration Survey – Completing Student Income, and UOPX End-of-Program Survey. National data is for all job classifications, from Bureau of Labor Statistics and www.culpepper.com/eBulletin/2010/SalaryIncreaseBudgets0910.asp.
27

Cost To Taxpayers
University of Phoenix cost to taxpayers is substantially less than public and non-profit
institutions.
Table 15: Cost to Taxpayers
| Public | Independent | Proprietary | University | |||||||||||||||||
| (2 and | Private | (2 and | of Phoenix | |||||||||||||||||
| 4 year) | (2 and 4 year) | 4 year) | ||||||||||||||||||
Direct Government Support |
$10,785 | $5,621 | $3,751 | $1,082 | ||||||||||||||||
(Grants, Appropriations, etc.) |
||||||||||||||||||||
Federal Support on |
40 | 85 | 146 | 94 | ||||||||||||||||
Subsidized Loans |
||||||||||||||||||||
Defaults on Title IV Loans |
507 | 1,324 | 4,515 | 3,032 | ||||||||||||||||
Recovery on Title IV Loans |
-307 | -802 | -2,736 | -1,838 | ||||||||||||||||
Donor Tax Benefit on Gifts |
315 | 823 | 0 | 0 | ||||||||||||||||
Sales and Other Taxes |
0 | 0 | -65 | -38 | ||||||||||||||||
Taxes on Corporate Profits |
0 | 0 | -1,092 | -824 | ||||||||||||||||
Net Cost to Taxpayer |
$11,340 | $7,051 | $4,519 | $1,509 | ||||||||||||||||
per Student |
||||||||||||||||||||
See Appendix for explanatory notes and definitions.
Source: Higher Education at a Crossroads, Apollo Group Position Paper, August 2010
http://www.apollogrp.edu/Investor/Reports/Higher%20Education%20at%20a%20Crossroads%20FINAL%20
v3.pdf
28

The 2010 Academic Annual Report has focused on the issue of quality and input measures
that can be directly associated with student success and institutional effectiveness.
The 2009 Academic Annual Report outlined issues that the University is addressing as
opportunities to increase student academic achievement and success. The quality initiatives
identified in the 2010 Report, in addition to those described in the 2009 report, have begun to
bear results.
In the 2009 Report, we described the curriculum for a three-week orientation program that would
allow prospective students an opportunity to “test drive” the University prior to enrolling.
The orientation was designed to address the heuristic skills necessary for success at
University of Phoenix as well as to introduce the participants to the format and accelerated
environment in which they would be learning should they decide to enroll.
In October 2009, the University rolled out the University Orientation to campuses that had been
shown to have a high drop-out rate in the first four classes. In the original rollout, more than
30,000 students participated in the new student orientation. As indicated earlier in this
report, the results of that beta group show that approximately 80 percent of the students who
start the University Orientation finish it. The retention rates for those who complete
University Orientation are higher than those for students who do not go through the program.
As a result, the orientation was rolled out University-wide on November 1, 2010. It is
the University’s hope that this program may increase student retention and overall success.
The University is currently gathering analytical data and feedback from students and faculty
members on a regular basis in order to continue to update and improve the orientation.
The second phase of the administration’s plans outlined in the 2009 Academic Annual Report
was the initiation of a First-Year Sequence for students in the associate program and those
students enrolling in the bachelor’s programs with fewer than 24 credits. In FY2009 nearly all
associate degree-seeking students and a substantial percentage of students entering the bachelor’s
programs fell into that category.
The First-Year Sequence was introduced at all campuses in February 2010 and was designed
with a laddering concept with material taught over multiple courses. In this way, concepts
introduced in early classes are reinforced with work done in later classes. The First-Year
Sequence was also designed to provide a stable foundation and a sense of community for
entry-level students.
Results of the First-Year Sequence will be reported in the 2011 Academic Annual Report.
Finally, the third initiative discussed in the 2009 Report was a new perspective on remediation in
the form of Just-In-Time skills. The University introduced services to students that would allow
them to access the skills they needed when they needed them and when they could apply them to the
appropriate coursework. The premise of this new approach
is that an all-or-nothing course, taken before a student can enter a program or enroll in
specific classes, does nothing to promote long-term learning or the ability to apply the skills
when they are required—in some cases months or perhaps years after going through a remedial
course.
Today the Centers for Mathematics and Writing Excellence provide students with access to the
assistance and tools necessary to solve complicated math problems and write at an academic
level effectively and concisely.
In 2010 the Center for Mathematics Excellence expanded the services offered to students by
adding Live Class Tutoring and a Worksheet Center. In the Live Classrooms, students are able to
talk with a tutor via a toll-free teleconference line as well as login to the Center
29

for visual demonstrations. The Worksheet Center allows students to work through math
functions and basic geometric formulas. The worksheets are processed on a whiteboard and answers
are provided immediately. This allows students to work in private and self-evaluate where they need
to focus their efforts in improving their mathematics skills. In an average month, more than 5,600
unique users access the tutoring services provided by the Center.
In addition, the Center for Mathematics Excellence continues to assist students with
hundreds of math tutorials and videos as well as pre-algebra assistance. The Math Anxiety
Center helps students deal with the complexities and perceived problems associated with math
classes. In an average month, more than 20,000 unique users access the Center for Mathematics
Excellence for information on how to succeed in mathematics.
Resources contained in the Center for Writing Excellence include the
WritePointsm System, Tutor Review, the Spanish Writing Lab, Tutorials and
Guides, and the Turnitin Plagiarism Checker. WritePointsm is an automated
system that provides students with immediate feedback on grammar, punctuation, word usage, and
some style points. This is accomplished within minutes and is operational 24/7.
WritePointsm reviews an average of more than 150,000 papers each month.
Overall, the University continues to make data-driven decisions on how best to continually improve
its systems and curriculum in ways that will best benefit our students. As we learn from our
efforts, we will continue to report on the results and improvements.
30

NOTES AND DEFINITIONS FOR TABLE 15 COST TO TAXPAYERS
Institutions: Analysis includes all U.S, degree granting institutions that
are eligible for Title IV.
Student Enrollment Data: Information obtained from IPEDS for all schools as
reported under the IPEDS definition for Fall 2008 full-time equivalent students.
Direct Government Support: Information obtained from IPEDS for GASB institutions and
private non-profit institutions or public institutions using FASB includes
federal/state/local government operating contracts and appropriations (Pell awards
included). Information obtained from IPEDS for FASB proprietary institutions includes
state/local government grants and federal/state/local government appropriations (Pell
awards excluded). Pell award information for FASB proprietary institutions was
obtained from the Department of Education website.
Interest on Subsidized Loans: Subsidized Title IV loan information obtained from the
Department of Education website. The three month Treasury bill rate was used assuming
a one year interest subsidy for amounts loaned.
Loan Defaults: Assumes that although more than 100 percent is collected on
average for each Title IV dollar loaned by the government, the government could earn
the equivalent amount of interest through the issuance of treasury bills. In
addition, data is not available to determine if interest repayment trends are
different between institutional types.
However, lifetime default rates vary significantly between institutional types.
The lifetime budgeted default rates for the 2007 cohort of students, per a report by
the Department of Education issued in December 2009, along with 2007 two year cohort
default rates, also published by the Department of Education, were used to determine
expected default rates by institutional type. Public and Private Non-Profit: The
lifetime budgeted default rates of
17.2 percent used for the public and private non-profit institutions is based on an
average of four-year freshman - senior rates. Proprietary: The lifetime budgeted
default rate of 39.5 percent used for the proprietary institutions is based on the
two-year proprietary institutions lifetime budgeted default rate. The two-year
proprietary institutions lifetime budgeted default rate of 47 percent was weighted at
20 percent based on the number of full-time equivalent students in the two-year
category as a percentage of the total in the proprietary institutions. The four-year
proprietary institutions rate was determined based on the relationship of the
four-year proprietary institutions 2007 cohort default rate of 9.8 percent as compared
to the two-year proprietary institutions rate of approximately 12.25 percent and
applying this ratio to the two-year proprietary institutions lifetime budgeted default
rate of 47 percent. This rate for the expected four-year proprietary institutions
lifetime budgeted default rate was then weighted at 80 percent based on the number of
full-time equivalent students in the four-year category as a percentage of the total
in the proprietary institutions.
Recovery on Loans: The recovery rate used for defaulted loans is the same for all
institutions, 60.6 percent. This was then multiplied by the defaulted loans total to
get the recovery dollar amount. The recovery rate was calculated using information
from the Department of Education - SFA Collections, The White
House - Office of
Management and Budget (“The President’s Budget 2009”), student loan collection
industry’s collection fees, and Apollo Group estimates.
31

| 1. | Judith S. Eaton, “Higher Education, Government and Expectations of Academic Quality and Accountability: Where Do We Go From Here?” American Academic 2, no. 1 (2006): 73-87, http://www.aft.org/pdfs/highered/academic/march06/Eaton.pdf | |||
| 2. | William F. Massy, Steven W. Graham, and Paula Myrick Shor, Academic Quality Work: A Handbook for Improvement (Bolton, MA: Anker, 2007). | |||
| 3. | http://www.progettobologna.it/ | |||
| 4. | Jean Johnson and Jon Rochkind with Amber Ott and Samantha DuPont, With Their Whole Lives Ahead of Them: Myths and Realities About Why So Many Students Fail to Finish College (New York: Public Agenda, with support from the Bill and Melinda Gates Foundation, 2010). http://www.publicagenda.org/files/pdf/theirwholelivesaheadofthem.pdf | |||
| 5. | Ibid. | |||
| 6. | http://www.ed.gov/news/press-releases/department-education-establishes-new-student-aid-rules-protect-borrowers-and-tax | |||
| 7. | Arizona Quality Alliance, Showcase in Excellence Awards,
http://www.arizona-excellence.com/2010%20 PDF%20Recipients/UOPX%20Synopsis.pdf |
|||
| 8. | Karin Fischer, “Lumina to Continue With Project Bringing Bologna Process’s Lessons to United States,” Chronicle of Higher Education, June 4, 2010, http://chronicle.com/article/Lumina-to-Continue-With/65797/ | |||
| 9. | The Higher Learning Commission 230 South LaSalle Street, Suite 7-500, Chicago, Illinois 60604-1413. http://www.ncahlc.org/ | |||
| 10. | National Survey of Student Engagement, http://www.nsse.iub.edu/ | |||
| 11. | Project SAILS, https://www.projectsails.org/ | |||
| 12. | Education Testing Service, http://www.ets.org/proficiencyprofile/about | |||
| 13. | National Center for Education Statistics, http://nces.ed.gov/ | |||
| 14. | University of Phoenix, http://www.phoenix.edu/about_us/about_university_of_phoenix/university_learning_goals.html | |||
| 15. | Project SAILS, https://www.projectsails.org/ | |||
| 16. | Association of College and Research Libraries http://www.ala.org/ala/mgrps/divs/acrl/standards/ informationliteracycompetency.cfm | |||
| 17. | “‘Although the name has changed, the assessment hasn’t,’ says David G. Payne, ETS Vice President and COO for College and Graduate Programs. ‘It’s still the same great assessment—just with a new name.’” ETS press release, “ETS MAPP Assessment Gets New Name—ETS® Proficiency Profile” (December 10, 2009), http://www.pr-inside.com/print1626364.htm. See also http://www.ets.org/proficiencyprofile/about/. | |||
| 18. | Education Testing Service, http://www.ets.org/about/who/ | |||
| 19. | National Center for Education Statistics, http://nces.ed.gov/ipeds/ | |||
| 20. | Ibid. |
32
