Attached files
| file | filename |
|---|---|
| 8-K - FORM 8-K - PNC FINANCIAL SERVICES GROUP, INC. | d8k.htm |
 The PNC
Financial Services Group, Inc. Goldman Sachs
Financial Services Conference
December 7, 2010
Exhibit 99.1 |
 2
Cautionary Statement Regarding Forward-Looking
Information and Adjusted Information
This
presentation
includes
“snapshot”
information
about
PNC
used
by
way
of
illustration.
It
is
not
intended
as
a
full
business
or
financial
review
and
should
be
viewed
in
the
context
of
all
of
the
information
made
available
by
PNC
in
its
SEC
filings.
The
presentation
also
contains
forward-looking
statements
regarding
our
outlook
or
expectations
relating
to
PNC’s
future
business,
operations,
financial
condition,
financial
performance,
capital
and
liquidity
levels,
and
asset
quality.
Forward-looking
statements
are
necessarily
subject
to
numerous
assumptions,
risks
and
uncertainties,
which
change
over
time.
The
forward-looking
statements
in
this
presentation
are
qualified
by
the
factors
affecting
forward-looking
statements
identified
in
the
more
detailed
Cautionary
Statement
included
in
the
Appendix,
which
is
included
in
the
version
of
the
presentation
materials
posted
on
our
corporate
website
at
www.pnc.com/investorevents.
We
provide
greater
detail
regarding
some
of
these
factors
in
our
2009
Form
10-K
and
2010
Form
10-Qs,
including
in
the
Risk
Factors
and
Risk
Management
sections
of
those
reports,
and
in
our
subsequent
SEC
filings
(accessible
on
the
SEC’s
website
at
www.sec.gov
and
on
or
through
our
corporate
website
at
www.pnc.com/secfilings).
We
have
included
web
addresses
here
and
elsewhere
in
this
presentation
as
inactive
textual
references
only.
Information
on
these
websites
is
not
part
of
this
presentation.
Future
events
or
circumstances
may
change
our
outlook
or
expectations
and
may
also
affect
the
nature
of
the
assumptions,
risks
and
uncertainties
to
which
our
forward-looking
statements
are
subject.
The
forward-looking
statements
in
this
presentation
speak
only
as
of
the
date
of
this
presentation.
We
do
not
assume
any
duty
and
do
not
undertake
to
update
those
statements.
In
this
presentation,
we
will
sometimes
refer
to
adjusted
results
to
help
illustrate
the
impact
of
certain
types
of
items,
such
as
our
third
quarter
2010
gain
related
to
the
sale
of
PNC
Global
Investment
Servicing
Inc.
(“GIS”),
the
acceleration
of
accretion
of
the
remaining
issuance
discount
on
our
TARP
preferred
stock
in
connection
with
the
first
quarter
2010
redemption
of
such
stock,
our
fourth
quarter
2009
gain
related
to
BlackRock’s
acquisition
of
Barclays
Global
Investors
(the
“BLK/BGI
gain”),
our
fourth
quarter
2008
conforming
provision
for
credit
losses
for
National
City,
and
integration
costs
in
the
2010
and
2009
periods.
This
information
supplements
our
results
as
reported
in
accordance
with
GAAP
and
should
not
be
viewed
in
isolation
from,
or
a
substitute
for,
our
GAAP
results.
We
believe
that
this
additional
information
and
the
reconciliations
we
provide
may
be
useful
to
investors,
analysts,
regulators
and
others
as
they
evaluate
the
impact
of
these
respective
items
on
our
results
for
the
periods
presented
due
to
the
extent
to
which
the
items
are
not
indicative
of
our
ongoing
operations.
We
may
also
provide
information
on
pretax
pre-provision
earnings
(total
revenue
less
noninterest
expense),
as
we
believe
that
pretax
pre-provision
earnings,
a
non-GAAP
measure,
is
useful
as
a
tool
to
help
evaluate
the
ability
to
provide
for
credit
costs
through
operations.
Where
applicable,
we
provide
GAAP
reconciliations
for
such
additional
information.
In
certain
discussions,
we
may
also
provide
information
on
yields
and
margins
for
all
interest-earning
assets
calculated
using
net
interest
income
on
a
taxable-equivalent
basis
by
increasing
the
interest
income
earned
on
tax-exempt
assets
to
make
it
fully
equivalent
to
interest
income
earned
on
taxable
investments.
We
believe
this
adjustment
may
be
useful
when
comparing
yields
and
margins
for
all
earning
assets.
We
may
also
use
annualized,
proforma,
estimated
or
third
party
numbers
for
illustrative
or
comparative
purposes
only.
These
may
not
reflect
actual
results.
This
presentation
may
also
include
discussion
of
other
non-GAAP
financial
measures,
which,
to
the
extent
not
so
qualified
therein
or
in
the
Appendix,
is
qualified
by
GAAP
reconciliation
information
available
on
our
corporate
website
at
www.pnc.com
under
“About
PNC–Investor
Relations.” |
 3
Today’s Discussion
2010 has been a year of strategic achievements for
PNC in a challenging environment
PNC is well positioned to deliver strong returns
PNC has substantial opportunities for growth to
achieve even greater shareholder value
PNC Continues to Build a Great Company.
PNC Continues to Build a Great Company. |
 4
Footprint covering nearly 1/3 of the U.S.
population
Retail
Corporate & Institutional
A leader in serving middle-market
customers and government entities
One of the largest bank-held asset
managers in the U.S.
Asset Management
Residential Mortgage
One of the nation’s largest mortgage
platforms
PNC -
A Powerful Franchise
8
th
$260 billion
Assets
U.S. Rank
1
Sept. 30, 2010
6,626
2,461
$179 billion
5
th
ATMs
5
th
Branches
6
th
Deposits
(1) Rankings source: SNL DataSource; Banks headquartered in U.S.
CO
TX
KS
OK
BlackRock
A leader in investment management, risk
management
and
advisory
services
worldwide
A
Focus on
Achievement |
 5
Building a High Quality,
Differentiated Balance Sheet
(1) December 31, 2008 was the closing date of our National City acquisition.
$260.1
29.4
.6
11.1
39.8
179.2
10.3
40.7
$128.2
$260.1
46.5
150.1
$63.5
Sept. 30,
2010
(9.3)
Other
(7.3)
Preferred equity
($30.9)
Total liabilities and equity
(12.5)
Borrowed funds
(13.3)
Other time/savings
(13.7)
Total deposits
11.9
Common equity
(17.6)
Retail CDs
$17.2
Transaction deposits
(25.5)
Other assets
(25.4)
Total loans
($30.9)
Total assets
$20.0
Change from
Dec. 31, 2008
1
Investment securities
(billions)
Loans to deposits ratio of 84%
Loans declined driven by loan
payoffs, sales, net charge-offs and
ongoing soft demand
Continued to grow transaction
deposits while reducing higher cost
brokered and retail CDs
Added high quality, short-duration
investment securities
Significant improvement in common
equity
Sept. 30, 2010 highlights
A
Focus on
Achievement |
 6
Continued Credit Quality Improvement
$5.1
$5.7
$5.8
$5.1
$4.8
3Q09
4Q09
1Q10
2Q10
3Q10
Quarter end nonperforming loans
1
Accruing loans past due
2
Nonperforming loans
1
$2.4
$2.4
$2.5
$1.9
$1.4
$0.9
$0.9
$0.8
$0.6
$0.6
3Q09
4Q09
1Q10
2Q10
3Q10
30-89 Days
90 Days +
(1)
Loans
acquired
from
National
City
that
were
impaired
are
not
included
as
they
were
recorded
at
estimated
fair
value
when
acquired
and
are
currently
considered
performing
loans
due
to
the
accretion
of
interest
in
purchase
accounting.
Does
not
include
loans
held
for
sale
or
foreclosed
and
other
assets.
(2)
Excludes
loans
that
are
government
insured/guaranteed,
primarily
residential
mortgages.
A
Focus on
Achievement |
 7
Well-Positioned Capital Level to Support Growth
Ratios as of quarter end. Source: Company reports, MTB is estimated.
Sept. 30, 2010 Tier 1 common ratio
PNC’s capital priorities
4.8%
6.4%
7.3%
7.6%
7.6%
8.0%
8.5%
8.6%
9.0%
9.5%
9.6%
10.0%
8.2%
8.0%
PNC
MTB
FITB
RF
USB
STI
WFC
COF
BAC
KEY
BBT
JPM
PNC
CMA
Maintain strong
levels
Support our clients
Invest in our
businesses
Basel III clarity
Return capital to
shareholders when
appropriate
A
Focus on
Achievement |
 8
Sustaining Solid Returns
Return on tangible common equity¹
33%
13%
27%
18%
20%
21%
16%
6%
10%
2%
2%
6%
9%
8%
0%
10%
20%
30%
40%
1Q09
2Q09
3Q09
4Q09
1Q10
2Q10
3Q10
PNC
Peer
2
average
(1)
Return
on
tangible
common
equity
calculated
as
net
income
divided
by
(common
equity
less
intangible
assets),
annualized.
PNC
believes
that
return
on
tangible
common
equity,
a
non-GAAP
measure,
is
useful
as
a
tool
to
help
measure
and
assess
a
company’s
use
of
equity.
(2)
Peers
represent
banks
identified
in
the
Appendix
as
available.
COF
not
available.
Source:
SNL
DataSource.
(3)
Excludes
the
$687
million
after-
tax,
$1,076
million
pretax,
BLK/BGI
gain.
ROTCE
including
the
gain
was
49%.
(4)
Excludes
the
$328
million
after-tax,
$639
million
pretax,
gain
on
the
sale
of
GIS.
ROTCE
including
the
gain
was
23%.
Return
on
common
equity
including
the
gain
was
15%
and
excluding
the
gain
was
11%.
Further
information
on
(1),
(3)
and
(4)
is
provided
in
the
Appendix.
3
4
3Q10 ROTCE
1
A
Focus on
Achievement
(23%)
BAC
(8%)
RF
4%
CMA
5%
STI
9%
BBT
12%
KEY
12%
FITB
15%
JPM
16%
PNC
4
17%
WFC
20%
MTB
21%
USB |
 9
PNC’s Growth Opportunities
A
Focus on
Growth
Time
Disciplined
expense
management
Growth
through
execution
Growth
through
lending
Growth
through
innovation
Growth
through
market share
Credit quality
improvement
Capital
management
Higher
interest rates |
 10
YTD10 sales up 8% vs. YTD09
100%
of
markets
exceeded
YTD10
goal
YTD10 sales up 27%
vs. YTD09
3Q10 sales up 27% linked quarter
75% of markets exceeded YTD10 goal
Sales Momentum Across the Franchise
Corporate
Banking
Wealth
Management
Institutional
Investments
Commercial
Banking
Sales contribution by region
YTD10 annualized
Products
Eastern
markets
57%
Western
markets
43%
YTD10
franchise
sales
up
15%
vs.
YTD09
Growth
Through
Execution |
 11
Growing Corporate Services Revenue
2009
2010
Treasury Management
$841
$919
Revenue
1
(1) Consolidated PNC amounts. Not all of these revenues are reflected in noninterest
income. September YTD
Capital Markets
One of the nation's top
treasury management
providers
Excellent source of low
cost deposits
Continued growth in
purchasing cards
Strong pipeline including
healthcare providers,
gov’t agencies and
middle market companies
2009
2010
$346
$411
Revenue
1
September YTD
A leading provider of
innovative investment
banking solutions to the
middle market
In terms of deals
-
#2 middle market deal
bookrunner
-
#4 U.S. real estate
bookrunner
-
#4 U.S. asset-based
credit lead arranger
Harris Williams YTD10
revenue up $40 million
from YTD09
Sales at 116% of
YTD10 cross-sell goal
Sales at 115% of
YTD10 cross-sell goal
Growth
Through
Execution |
 12
Growing Asset Management and
Residential Mortgage Revenue
(1) Consolidated PNC amounts. Includes earnings from our equity investment in BlackRock.
2009
2010
$639
$751
Revenue
1
September YTD
Asset Management
Asset Management Group
continued to outperform
sales and client
acquisition goals
PNC assets under
administration over $200
billion at Sept. 30, 2010
PNC assets under
management up 6%
linked quarter to $105
billion
2009
2010
$171
$196
Servicing Fees
September YTD
Residential Mortgage
Aligning the business
with PNC’s model
Focused on leveraging
the customer value
relationship with
differentiated service
Capturing cross-sell
opportunities with
banking businesses
3Q10 loan origination
volumes up 17% linked
quarter
Sales at 108% of
YTD10 cross-sell goal
Growth
Through
Execution |
 13
Growing and Deepening Customer Relationships
Online banking
2,682
2,968
Online bill payment
753
942
Checking relationships
Growing and retaining checking relationships
Retail active customers
3
(thousands)
3Q09
3Q10
3Q09
3Q10
3Q08
1
3Q09
2
3Q10
+37,000
+43,000
+53,000
(Growth during the quarter)
(1) Excludes the impact of the conversion of Sterling Financial Corporation accounts. (2)
Excludes the impact of the required divestitures related to the National City
acquisition. (3) At quarter end. Growth
Through
Execution |
 14
0
25
50
75
100
2003
2004
2005
2006
2007
2008
2009
2010
2011
2012
2013
Recognizing Changing Customer Preferences
Customers have more choices and want more control
US banking transactions by channel (billions)
Mobile
Online
ATM
Call center
Branch
Source: Tower Group, McKinsey & Co.
Growth in electronic
channels continues to
reduce consumer check
payments
In 2002, checks
accounted for 48% of
non-cash transactions
By 2012, checks are
expected to account for
only 17% of non-cash
transactions
Growth
Through
Innovative
Thinking
Forecast
Actual |
 15
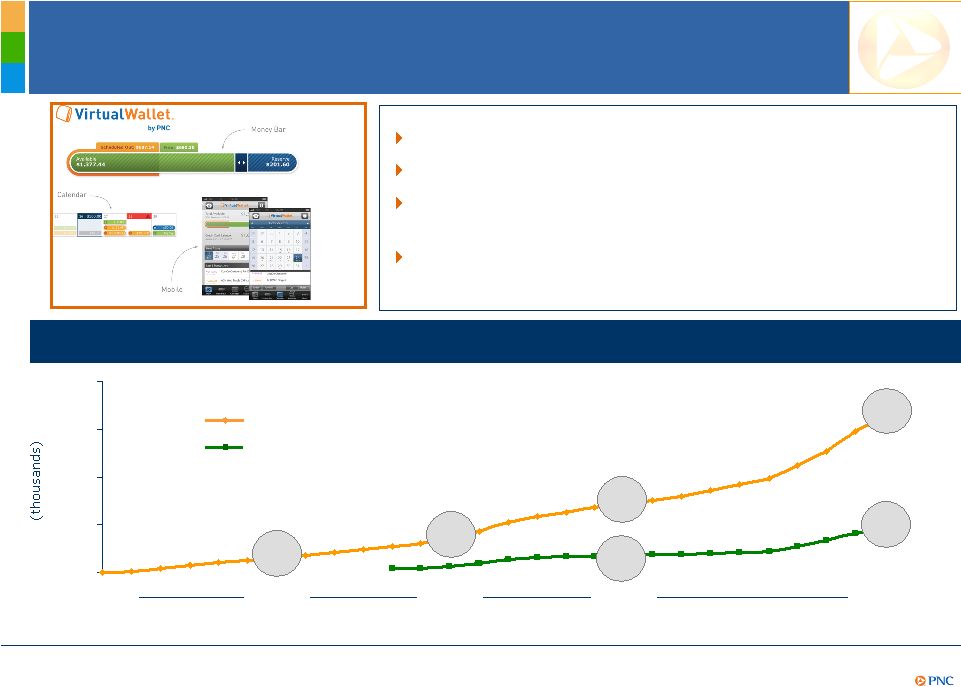
Delivering Innovative Products and Services
Recognized as an industry leading payment account
Overall
site
ranked
#1
-
Inside
Online
Banking
2010
A tremendously successful platform for PNC to reach a
broader consumer base over time
Virtual
Wallet
-
Student
Edition
recognized
by
2010
CIO
100
and
InformationWeek
2010
0
100
200
300
400
2Q08
Sep 10
Virtual Wallet growth
Virtual Wallet accounts
Virtual Wallet Student Edition accounts
2Q09
Growth
Through
Innovative
Thinking
4Q08
4Q09
323
30
73
142
35
90 |
 16
Capturing More Share of the Wallet
Growth
Through
Innovative
Thinking
While PNC’s footprint includes some
lower growth markets…
…the footprint also includes some of the
wealthiest.
Sources: SNL DataSource as of June 30, 2010, IRS Statistics of Income Division, August
2008. PNC retail footprint states. Top 20 states
based on wealth
holders with
>$1.5 million in
net worth
Arizona
Wyoming
Colorado
Wisconsin
Washington
Connecticut
Maryland
Virginia
North Carolina
Ohio
Michigan
Georgia
New Jersey
Massachusetts
Pennsylvania
Texas
Illinois
Florida
New York
California
State
11
3
11
2
3
5
1
4
13
Deposit
market share
20
19
18
17
16
15
14
13
12
11
10
9
8
7
6
5
4
3
2
1
PNC’s retail
footprint covers
9 of the top 20
wealthiest states
Average
2010-2015
CMA COF FITB
JPM KEY MTB
PNC USB
BBT BAC RF
STI WFC
2.2%
4.5%
Projected population
growth
PNC has
demonstrated
the ability to
grow and attract
customers in all
markets
PNC continues to
leverage its suite
of innovative
products to
deepen customer
relationships |
 17
Helping Clients Manage Their Businesses
Industry-wide, nearly $2 trillion in annual healthcare
payments are processed; growing at 7% annually
PNC was the first bank accredited by the Electronic
Healthcare Network Accreditation Commission for both
clearinghouse and lockbox operations
PNC has worked with more than 1,400 healthcare
organizations across the country
$104
$85
$69
$62
$55
$45
$38
2004
2005
2006
2007
2008
2009
2010
(millions)
Growth
Through
Innovative
Thinking
PNC healthcare-related revenue growth
1
(1) For the nine months ended September 30, annualized. |
 18
PNC’s net interest income, excluding purchase accounting, has remained stable
PNC’s Net Interest Income Trend
$1.7
$1.7
$1.8
$1.8
$2.0
$1.9
$1.9
$.5
$.4
$.5
$.4
$.5
$.6
$.3
NII excluding purchase accounting accretion
Impact of purchase accounting accretion
Net interest
income
(billions)
$2.3
$2.2
$2.2
$2.3
$2.4
$2.4
$2.2
1Q09
2Q09
3Q09
4Q09
1Q10
2Q10
3Q10
$244
$243
$236
$231
$227
$225
$224
Average interest-earning assets
Growth
From
Higher
Rates |
 19
(6)
(5)
(4)
(3)
(2)
(1)
0
1
2
3
4
0%
1%
2%
3%
4%
5%
6%
Active Balance Sheet Management
PNC Duration
of Equity
(At Quarter End)
Fed Funds
Effective Rate
(At Quarter End)
2007
2008
2009
+4.6%
100 bps increase
(5.9%)
1
100 bps decrease
Effect on NII in 2nd
year from
gradual interest rate change
over preceding 12 months
Effect on NII in 1st
year from
gradual interest rate change
over following 12 months
PNC 3Q10 NII Sensitivity
(1.8%)
1
+1.5%
100 bps decrease
100 bps increase
Q1
Q2
Q3
Q4
Q1
Q2
Q3
Q4
Q1
Q2
Q3
Q4
Q1
Q2
2010
Q3
Growth
From
Higher
Rates
(1) Given the inherent limitations in certain of these measurement tools and techniques,
results become less meaningful as interest rates approach zero.
|
 20
Capturing Lending Opportunities
Corporate & Institutional
Increased loan utilization
Commercial real estate
Retail
Small business
Credit card
Direct/indirect auto
Residential mortgage
Growth
Through
Lending
3Q10 loans/deposits
84%
84%
89%
93%
93%
96%
96%
96%
99%
102%
103%
106%
76%
JPM
KEY
PNC
RF
WFC
FITB
BAC
STI
BBT
CMA
USB
MTB
COF
Information as of quarter end. Peer source: SNL DataSource.
Substantial lending potential |
 21
Leveraging the PNC Brand to Drive
Revenue Growth
Growth
Through
Market
Share
(1) Includes YTD10 from corporate banking, commercial banking, wealth management, and
institutional investment products. (2) Source: SNL DataSource
as of June 30, 2010.
Revenue
per sales FTE by selected tier 1 market
.6x
.6x
.4
x
Tier 1 market baseline average
.4x
Revenue
per
sales
FTE
by
selected
tier
2
market
.5x
.4
x
.7x
Tier 2 market baseline average
.6x
.2x
1/3
2
3
4
6
4
1/1
4
6
8
13
5
Deposit market share²
Washington D.C., Columbus and
Indianapolis higher than 2009
St. Louis, Florida and Milwaukee
higher than 2009
.5x
1
1 |
 22
PNC Is Well Positioned to Capture
Growth Opportunities
A
Focus on
Growth
Time
Disciplined
expense
management
Growth
through
execution
Growth
through
lending
Growth
through
innovation
Growth
through
market share
Credit quality
improvement
Capital
management
Higher
interest rates
Non-distressed
loan
contraction
beginning
to
level
off
Balance
sheet
remains
well-positioned
for
rising
rates
Continuous
improvement
culture
taking
hold
across
franchise
PNC’s view
Continued
low
cost
deposit
growth
expected
Credit
metrics
expected
to
continue
to
improve
with
a
stable
to
improving
economy
Proven
products
growing
with
more
in
pipeline
Sales,
cross-sell
and
client
acquisition
well
ahead
of
2009
pace |
 23
A Demonstrated Ability to Achieve
Greater Shareholder Value
PNC 5-year CAGR versus peers¹ through 3Q10
(1)
Peers
represents
average
of
banks
identified
in
the
Appendix.
Source:
SNL
DataSource.
(2)
Excludes
our
3Q10
$328
million
after-tax,
$639
million
pretax,
gain
on
the
sale
of
GIS.
Including
the
gain,
our
annualized
net
income
and
annualized
EPS
CAGRs
were
27%
and
13%,
respectively.
Further
information
is
provided
in
the
Appendix.
A
Focus on
Growth
Total shareholder return
Annualized EPS
Annualized net income
Book value/share
Deposits
Assets
As of or for the three months
ended Sept. 30
+1%
+5%²
+18%²
+14%
+24%
+23%
PNC
(10%)
(14%)
(23%)
+1%
+12%
+13%
Peers¹ |
 24
Summary
PNC Continues to Build a Great Company.
PNC Continues to Build a Great Company.
2010 has been a year of strategic achievements for
PNC in a challenging environment
PNC is well positioned to deliver strong returns
PNC has substantial opportunities for growth to
achieve even greater shareholder value |
 25
Cautionary Statement Regarding Forward-Looking
Information
Appendix
This
presentation
includes
“snapshot”
information
about
PNC
used
by
way
of
illustration
and
is
not
intended
as
a
full
business
or
financial
review.
It
should
not
be
viewed
in
isolation
but
rather
in
the
context
of
all
of
the
information
made
available
by
PNC
in
its
SEC
filings.
We
also
make
statements
in
this
presentation,
and
we
may
from
time
to
time
make
other
statements,
regarding
our
outlook
or
expectations
for
earnings,
revenues,
expenses,
capital
levels,
liquidity
levels,
asset
quality
and/or
other
matters
regarding
or
affecting
PNC
that
are
forward-looking
statements
within
the
meaning
of
the
Private
Securities
Litigation
Reform
Act.
Forward-looking
statements
are
typically
identified
by
words
such
as
“believe,”
“plan,”
“expect,”
“anticipate,”
“intend,”
“outlook,”
“estimate,”
“forecast,”
“will,”
“should,”
“project,”
“goal”
and
other
similar
words
and
expressions.
Forward-looking
statements
are
subject
to
numerous
assumptions,
risks
and
uncertainties,
which
change
over
time.
Forward-looking
statements
speak
only
as
of
the
date
they
are
made.
We
do
not
assume
any
duty
and
do
not
undertake
to
update
our
forward-
looking
statements.
Actual
results
or
future
events
could
differ,
possibly
materially,
from
those
that
we
anticipated
in
our
forward-looking
statements,
and
future
results
could
differ
materially
from
our
historical
performance.
Our
forward-looking
statements
are
subject
to
the
following
principal
risks
and
uncertainties.
We
provide
greater
detail
regarding
some
of
these
factors
in
our
2009
Form
10-K
and
2010
Form
10-Qs,
including
in
the
Risk
Factors
and
Risk
Management
sections
of
those
reports,
and
in
our
subsequent
SEC
filings.
Our
forward-looking
statements
may
also
be
subject
to
other
risks
and
uncertainties,
including
those
that
we
may
discuss
elsewhere
in
this
presentation
or
in
our
filings
with
the
SEC,
accessible
on
the
SEC’s
website
at
www.sec.gov
and
on
or
through
our
corporate
website
at
www.pnc.com/secfilings.
We
have
included
these
web
addresses
as
inactive
textual
references
only.
Information
on
these
websites
is
not
part
of
this document.
•Our
businesses
and
financial
results
are
affected
by
business
and
economic
conditions,
both
generally
and
specifically
in
the
principal
markets
in
which
we
operate.
In
particular,
our
businesses
and
financial
results
may
be
impacted
by:
o
Changes
in
interest
rates
and
valuations
in
the
debt,
equity
and
other
financial
markets;
o
Disruptions
in
the
liquidity
and
other
functioning
of
financial
markets,
including
such
disruptions
in
the
markets
for
real
estate
and
other
assets
commonly
securing
financial
products;
o
Actions
by
the
Federal
Reserve
and
other
government
agencies,
including
those
that
impact
money
supply
and
market
interest
rates;
o
Changes
in
our
customers’,
suppliers’
and
other
counterparties’
performance
in
general
and
their
creditworthiness
in
particular;
o
A
slowing
or
failure
of
the
moderate
economic
recovery
that
began
last
year;
o
Continued
effects
of
the
aftermath
of
recessionary
conditions
and
the
uneven
spread
of
the
positive
impacts
of
the
recovery
on
the
economy
in
general
and
our
customers
in
particular,
including
adverse
impact
on
loan
utilization
rates
as
well
as
delinquencies,
defaults
and
customer
ability
to
meet
credit
obligations;
o
Changes
in
levels
of
unemployment;
and
o
Changes
in
customer
preferences
and
behavior,
whether
as
a
result
of
changing
business
and
economic
conditions,
climate-related
physical
changes
or
legislative
and
regulatory
initiatives,
or
other
factors.
•A
continuation
of
turbulence
in
significant
portions
of
the
US
and
global
financial
markets,
particularly
if
it
worsens,
could
impact
our
performance,
both
directly
by
affecting
our
revenues
and
the
value
of
our
assets
and
liabilities
and
indirectly
by
affecting
our
counterparties
and
the
economy
generally. |
 26
Cautionary Statement Regarding Forward-Looking
Information (continued)
Appendix
•We
will
be
impacted
by
the
extensive
reforms
enacted
in
the
Dodd-Frank
Wall
Street
Reform
and
Consumer
Protection
Act.
Further,
as
much
of
that
Act
will
require
the
adoption
of
implementing
regulations
by
a
number
of
different
regulatory
bodies,
the
precise
nature,
extent
and
timing
of
many
of
these
reforms
and
the
impact
on
us
is
still
uncertain.
•Financial
industry
restructuring
in
the
current
environment
could
also
impact
our
business
and
financial
performance
as
a
result
of
changes
in
the
creditworthiness
and
performance
of
our
counterparties
and
by
changes
in
the
competitive
and
regulatory
landscape.
•Our
results
depend
on
our
ability
to
manage
current
elevated
levels
of
impaired
assets.
•Given
current
economic
and
financial
market
conditions,
our
forward-looking
financial
statements
are
subject
to
the
risk
that
these
conditions
will
be
substantially
different
than
we
are
currently
expecting.
These
statements
are
based
on
our
current
view
that
the
moderate
economic
recovery
that
began
last
year
will
continue
throughout
the
rest
of
2010
and
slowly
gather
momentum
in
2011
amidst
continued
low
interest
rates.
•Legal
and
regulatory
developments
could
have
an
impact
on
our
ability
to
operate
our
businesses
or
our
financial
condition
or
results
of
operations
or
our
competitive
position
or
reputation.
Reputational
impacts,
in
turn,
could
affect
matters
such
as
business
generation
and
retention,
our
ability
to
attract
and
retain
management,
liquidity,
and
funding.
These
legal
and
regulatory
developments
could
include:
o
Changes
resulting
from
legislative
and
regulatory
responses
to
the
current
economic
and
financial
industry
environment;
o
Other
legislative
and
regulatory
reforms,
including
broad-based
restructuring
of
financial
industry
regulation
as
well
as
changes
to
laws
and
regulations
involving
tax,
pension,
bankruptcy,
consumer
protection,
and
other
aspects
of
the
financial
institution
industry;
o
Unfavorable
resolution
of
legal
proceedings
or
other
claims
and
regulatory
and
other
governmental
investigations
or
other
inquiries.
In
addition
to
matters
relating
to
PNC’s
business
and
activities,
such
matters
may
also
include
proceedings,
claims,
investigations,
or
inquiries
relating
to
pre-acquisition
business
and
activities
of
acquired
companies
such
as
National
City;
o
The
results
of
the
regulatory
examination
and
supervision
process,
including
our
failure
to
satisfy
the
requirements
of
agreements
with
governmental agencies;
o
Changes
in
accounting
policies
and
principles;
o
Changes
resulting
from
legislative
and
regulatory
initiatives
relating
to
climate
change
that
have
or
may
have
a
negative
impact
on
our
customers’
demand
for
or
use
of
our
products
and
services
in
general
and
their
creditworthiness
in
particular;
and
o
Changes
to
regulations
governing
bank
capital,
including
as
a
result
of
the
so-called
“Basel
III”
initiatives.
•Our
business
and
operating
results
are
affected
by
our
ability
to
identify
and
effectively
manage
risks
inherent
in
our
businesses,
including,
where
appropriate,
through
the
effective
use
of
third-party
insurance,
derivatives,
and
capital
management
techniques,
and
by
our
ability
to
meet
evolving
regulatory
capital
standards.
•The
adequacy
of
our
intellectual
property
protection,
and
the
extent
of
any
costs
associated
with
obtaining
rights
in
intellectual
property
claimed
by
others,
can
impact
our
business
and
operating
results.
•Our
ability
to
anticipate
and
respond
to
technological
changes
can
have
an
impact
on
our
ability
to
respond
to
customer
needs
and
to
meet
competitive demands.
•Our
ability
to
implement
our
business
initiatives
and
strategies
could
affect
our
financial
performance
over
the
next
several
years.
•Our
expansion
with
our
National
City
acquisition
in
geographic
markets
and
into
business
operations
in
areas
in
which
we
did
not
have
significant
experience
or
presence
prior
to
2009
presents
greater
risks
and
uncertainties
than
were
present
for
us
in
other
recent
acquisitions.
•Competition
can
have
an
impact
on
customer
acquisition,
growth
and
retention,
as
well
as
on
our
credit
spreads
and
product
pricing,
which
can
affect
market
share,
deposits
and
revenues. |
 27
Cautionary Statement Regarding Forward-Looking
Information (continued)
Appendix
•Our
business
and
operating
results
can
also
be
affected
by
widespread
disasters,
terrorist
activities
or
international
hostilities,
either
as
a
result
of
the
impact
on
the
economy
and
capital
and
other
financial
markets
generally
or
on
us
or
on
our
customers,
suppliers
or
other
counterparties
specifically.
•Also,
risks
and
uncertainties
that
could
affect
the
results
anticipated
in
forward-looking
statements
or
from
historical
performance
relating
to
our
equity
interest
in
BlackRock,
Inc.
are
discussed
in
more
detail
in
BlackRock’s
filings
with
the
SEC,
including
in
the
Risk
Factors
sections
of
BlackRock’s
reports.
BlackRock’s
SEC
filings
are
accessible
on
the
SEC’s
website
and
on
or
through
BlackRock’s
website
at
www.blackrock.com.
This
material
is
referenced
for
informational
purposes
only
and
should
not
be
deemed
to
constitute
a
part
of
this
document.
We
grow
our
business
in
part
by
acquiring
from
time
to
time
other
financial
services
companies.
Acquisitions
present
us
with
risks
in
addition
to
those
presented
by
the
nature
of
the
business
acquired.
These
include
risks
and
uncertainties
related
both
to
the
acquisition
transactions
themselves
and
to
the
integration
of
the
acquired
businesses
into
PNC
after
closing.
Acquisitions
may
be
substantially
more
expensive
to
complete
(including
unanticipated
costs
incurred
in
connection
with
the
integration
of
the
acquired
company)
and
the
anticipated
benefits
(including
anticipated
cost
savings
and
strategic
gains)
may
be
significantly
harder
or
take
longer
to
achieve
than
expected.
Acquisitions
may
involve
our
entry
into
new
businesses
or
new
geographic
or
other
markets,
and
these
situations
also
present
risks
resulting
from
our
inexperience
in
those
new
areas.
As
a
regulated
financial
institution,
our
pursuit
of
attractive
acquisition
opportunities
could
be
negatively
impacted
due
to
regulatory
delays
or
other
regulatory
issues.
Regulatory
and/or
legal
issues
relating
to
the
pre-acquisition
operations
of
an
acquired
business
may
cause
reputational
harm
to
PNC
following
the
acquisition
and
integration
of
the
acquired
business
into
ours
and
may
result
in
additional
future
costs
or
regulatory
limitations
arising
as
a
result
of
those
issues.
Any
annualized,
proforma,
estimated,
third
party
or
consensus
numbers
in
this
presentation
are
used
for
illustrative
or
comparative
purposes
only
and
may
not
reflect
actual
results.
Any
consensus
earnings
estimates
are
calculated
based
on
the
earnings
projections
made
by
analysts
who
cover
that
company.
The
analysts’
opinions,
estimates
or
forecasts
(and
therefore
the
consensus
earnings
estimates)
are
theirs
alone,
are
not
those
of
PNC
or
its
management,
and
may
not
reflect
PNC’s
or
other
company’s
actual
or
anticipated
results. |
 28
Non-GAAP to GAAP Reconcilement
Appendix
In millions except per share data and percentages
Adjustments,
pretax
Income taxes
(benefit)
1
Net income
Net income
attributable to
common
shareholders
Diluted EPS
from net
income
Average
Assets
Return on
Avg. Assets
Net income, diluted EPS, and return on avg. assets, as reported
$1,103
$1,094
$2.07
$264,579
1.65%
Adjustments:
Gain on sale of GIS
$(639)
$311
(328)
(328)
(.62)
Integration costs
96
(34)
62
62
.11
Net income, diluted EPS, and return on avg. assets, as adjusted
$837
$828
$1.56
$264,579
1.27%
In millions except per share data
Adjustments,
pretax
Income taxes
(benefit)
1
Net income
Net income
attributable to
common
shareholders
Diluted EPS
from net
income
Net income and diluted EPS, as reported
$803
$786
$1.47
Adjustment:
Integration costs
$100
($35)
65
65
.13
Net income and diluted EPS, as adjusted
$868
$851
$1.60
In millions except per share data
Adjustments,
pretax
Income taxes
(benefit)
1
Net income
Net income
attributable to
common
shareholders
Diluted EPS
from net
income
Net income and diluted EPS, as reported
$559
$467
$1.00
Adjustment:
Integration costs
$89
($31)
58
58
.12
Net income and diluted EPS, as adjusted
$617
$525
$1.12
For the three months ended September 30, 2010
For the three months ended June 30, 2010
For the three months ended September 30, 2009
PNC
believes
that
information
adjusted
for
the
impact
of
certain
items
may
be
useful
due
to
the
extent
to
which
the
items
are
not
indicative
of
our
ongoing
operations.
(1)
Calculated
using
a
marginal
federal
income
tax
rate
of
35%
and
includes
applicable
income
tax
adjustments.
The
after-tax
gain
on
the
sale
of
GIS
also
reflects
the
impact
of state income taxes. |
 29
Non-GAAP to GAAP Reconcilement
Appendix
In millions except per share data and percentages
Adjustments,
pretax
Income taxes
(benefit)
1
Net income
Net income
attributable to
common
shareholders
Diluted EPS
from net
income
Average
Assets
Return on
Avg. Assets
Net income, diluted EPS, and return on avg. assets, as reported
$2,577
$2,213
$4.24
$265,355
1.30%
Adjustments:
Gain on sale of GIS
$(639)
$311
(328)
(328)
(.63)
Integration costs
309
(108)
201
201
.38
TARP preferred stock accelerated discount accretion² 250
.48
Net income, diluted EPS, and return on avg. assets, as adjusted
$2,450
$2,336
$4.47
$265,355
1.23%
In millions except per share data
Adjustments,
pretax
Income taxes
(benefit)
1
Net income
Net income
attributable to
common
shareholders
Diluted EPS
from net
income
Net income and diluted EPS, as reported
$1,296
$992
$2.17
Adjustment:
Integration costs
$266
($83)
183
183
.40
Net income and diluted EPS, as adjusted
$1,479
$1,175
$2.57
(2) Represents accelerated accretion of the remaining issuance discount on redemption of the
preferred stock in February 2010. (1)
Calculated
using
a
marginal
federal
income
tax
rate
of
35%
and
includes
applicable
income
tax
adjustments.
The
after-tax
gain
on
the
sale
of
GIS
also
reflects
the
impact
of state income taxes.
PNC
believes
that
information
adjusted
for
the
impact
of
certain
items
may
be
useful
due
to
the
extent
to
which
the
items
are
not
indicative
of
our
ongoing
operations.
For the nine months ended September 30, 2010
For the nine months ended September 30, 2009 |
 30
Non-GAAP to GAAP Reconcilement
Appendix
Sept. 30, 2010
Sept. 30, 2009
In millions except ratio
Total revenue
$11,273
$11,342
Noninterest expense
6,273
6,864
Pretax pre-provision earnings
$5,000
$4,478
Provision
$2,060
$2,881
Income from continuing operations before income taxes and
noncontrolling interests (Pretax earnings)
$2,940
$1,597
Pretax pre-provision earnings/provision
2.4
1.6
PNC believes that pretax pre-provision
earnings, a non-GAAP measure, is useful as a tool to help evaluate the ability to provide for credit costs through operations.
For the nine months ended
In millions except per percentages
March 31
June 30
Sept. 30
Dec. 31
March 31
June 30
Sept. 30
Common shareholders' equity
$18,546
$19,363
$20,997
$22,011
$26,466
$27,725
$29,394
Intangible assets
12,178
12,890
12,734
12,909
12,714
12,138
10,518
Common shareholders' equity less intangible assets
6,368
6,473
8,263
9,102
13,752
15,587
18,876
Net income
$530
$207
$559
$1,107
$671
$803
$1,103
Net income, if annualized
$2,120
$828
$2,236
$4,428
$2,684
$3,212
$4,412
Return on common shareholders' equity
11%
4%
11%
20%
10%
12%
15%
Return on tangible common equity
33%
13%
27%
49%
20%
21%
23%
After-tax BLK/BGI gain, $1,076 pretax
(687)
After-tax gain on sale of GIS, $639 pretax
(328)
Net income excluding BLK/BGI and GIS gains
$420
$775
Net income excluding BLK/BGI and GIS gains, if annualized
$1,680
$3,100
Return on common shareholders' equity excluding gains
8%
11%
Return on tangible common equity excluding gains
18%
16%
2009
2010
PNC
believes
that
return
on
tangible
common
equity,
a
non-GAAP
measure,
is
useful
as
a
tool
to
help
measure
and
assess
a
company's
use
of
equity
and
that
information
adjusted
for
the
impact
of
the
BLK/BGI
and
GIS
gains,
respectively,
may
be
useful
due
to
the
extent
to
which
those
items
are
not
indicative
of
our
ongoing
operations.
After-tax
gains
are
calculated
using
a
marginal
federal
income
tax
rate
of
35%
and
include
applicable
income
tax
adjustments.
The
after-
tax gain on the sale of GIS also reflects the impact of state income taxes.
For the three months ended |
 31
Non-GAAP to GAAP Reconcilement
Appendix
In millions except per share data and percentages
Adjustments,
pretax
Income taxes
(benefit)
1
Net income
Net income
attributable to
common
shareholders
Diluted EPS
from net
income
Net income and diluted EPS, as reported
$1,103
$1,094
$2.07
Adjustments:
Gain on sale of GIS
$(639)
$311
(328)
(328)
(.62)
Net income and diluted EPS, as adjusted
$775
$766
$1.45
2005
As reported
As reported
As adjusted for
GIS gain
Based on
reported
Based on
adjusted for
GIS gain
Net income
$334
$1,103
$775
Net income, if annualized
$1,336
$4,412
$3,100
27%
18%
Diluted EPS
$1.14
$2.07
$1.45
Diluted EPS, if annualized
$4.56
$8.28
$5.80
13%
5%
For the three months ended September 30, 2010
PNC
believes
that
information
adjusted
for
the
impact
of
our
gain
on
the
sale
of
GIS
may
be
useful
due
to
the
extent
to
which
that
item
is
not
indicative of our ongoing operations.
(1)
Calculated
using
a
marginal
federal
income
tax
rate
of
35%
and
includes
applicable
income
tax
adjustments.
The
after-tax
gain
on
the
sale
of
GIS also reflects the impact of state income taxes.
2010
For the three months ended September 30
CAGR |
 32
Peer Group of Banks
Appendix
The PNC Financial Services Group, Inc.
PNC
BB&T Corporation
BBT
Bank of America Corporation
BAC
Capital One Financial, Inc.
COF
Comerica Inc.
CMA
Fifth Third Bancorp
FITB
JPMorgan Chase
JPM
KeyCorp
KEY
M&T Bank
MTB
Regions Financial Corporation
RF
SunTrust Banks, Inc.
STI
U.S. Bancorp
USB
Wells Fargo & Co.
WFC
Ticker |