Attached files
| file | filename |
|---|---|
| 8-K - THE LACLEDE GROUP INC 8-K 12-7-2010 - SPIRE MISSOURI INC | form8k.htm |
Exhibit 99.1

Investor Presentation
December 2010
December 2010
Douglas H. Yaeger
Chairman, President, and Chief Executive Officer
Mark D. Waltermire
Chief Financial Officer
Steven P. Rasche
Vice President, Finance, Laclede Gas Company
James A. Fallert
Controller, Laclede Gas Company
Investor Presentation
December 2010
This presentation contains forward-looking statements within the meaning of the Private
Securities Litigation Reform Act of 1995. Forward-looking statements are typically identified by
words such as, but not limited to, “estimates,” expects,” “anticipates,” “intends,” and similar
expressions. Although our forward-looking statements are based on our reasonable
assumptions, future performance or results may be different than those currently anticipated.
Our forward-looking statements in this presentation speak only as of today, and we assume no
duty to update them. Factors that could cause actual results to differ materially from those
expressed or implied are discussed in our most recent annual report on Form 10-K and other
filings with the Securities and Exchange Commission in the “Risk Factors” section as well as
under the “Forward-Looking Statements” heading.
3
www.thelacledegroup.com
§ Company established in 1857
§ Public utility holding company
formed 2001
formed 2001
§ Consistent earnings performance
paired with a strong balance sheet
and credit rating
paired with a strong balance sheet
and credit rating
§ Rewarding shareholders with a
continuous and growing dividend
continuous and growing dividend
§ Listed on the NYSE (LG) for over
120 years
120 years
§ S&P Small Cap 600 Company
4
§ Pipeline transport of
petroleum products
petroleum products
§ Non-regulated
activities include 2010
propane transaction
activities include 2010
propane transaction
§ Potential growth
platform for related
investments
platform for related
investments
§ Core natural gas utility
§ Stable, primarily
residential customer
base
residential customer
base
§ Investing to improve
customer service and
operating efficiency
customer service and
operating efficiency
§ Established mix of
wholesale and retail
customers
wholesale and retail
customers
§ Leverages expertise in
the natural gas market
the natural gas market
§ Opportunities to
expand
expand
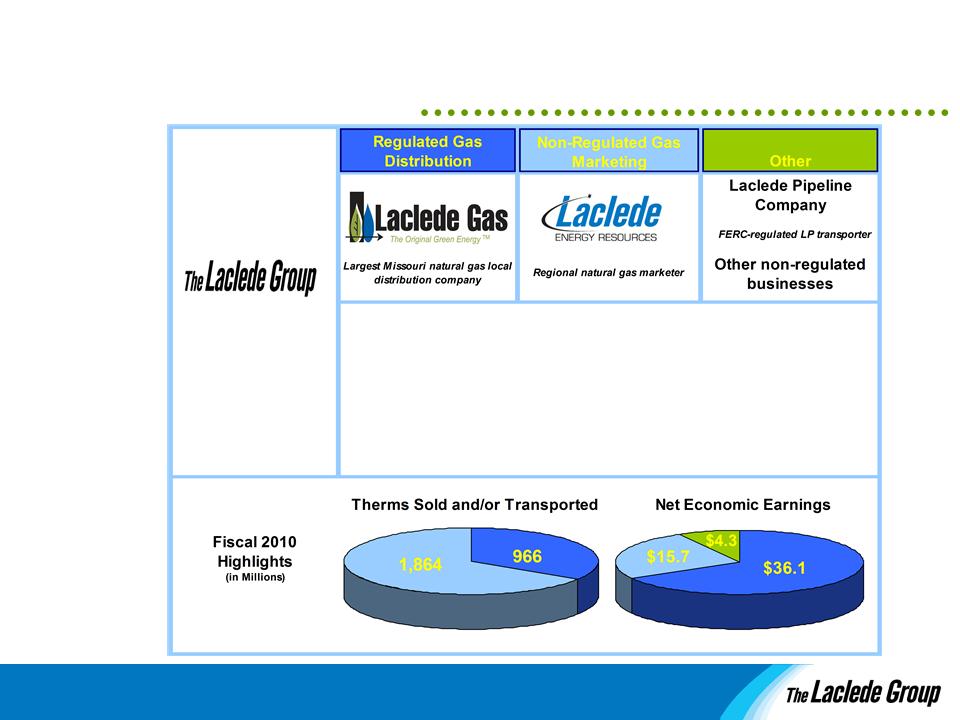
See Appendix for further discussion of non-GAAP measures
2,830
$56.1
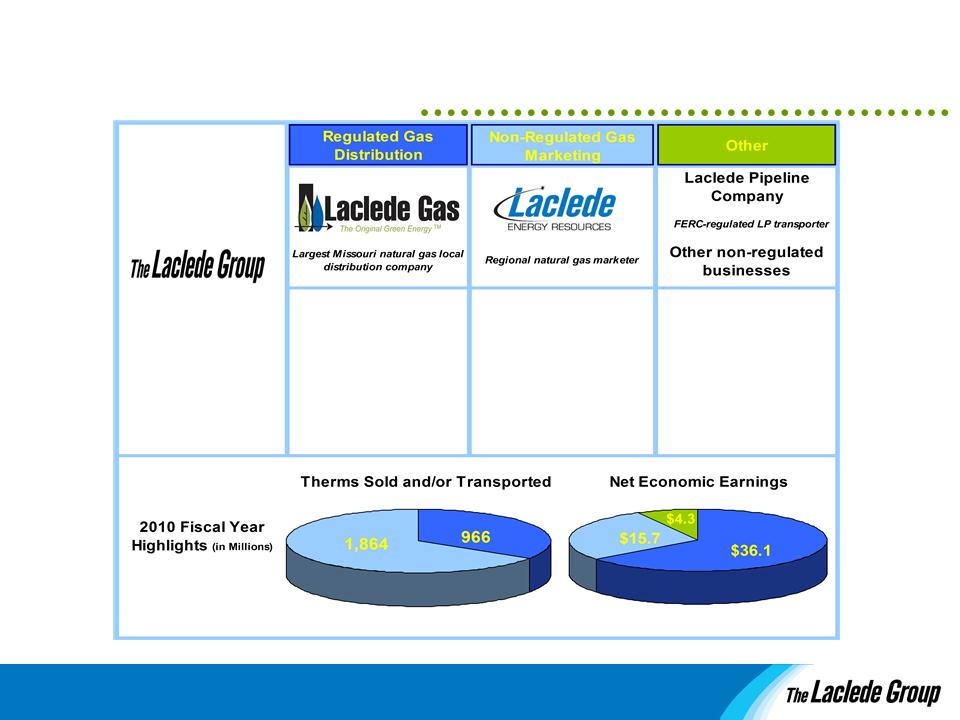
Laclede Group at a Glance

5
Strategic Objectives
§ Build on success of the core regulated utility business
§ Leverage LER’s competencies and strengths
§ Pursue logical growth opportunities
§ Enhance our financial strength

7
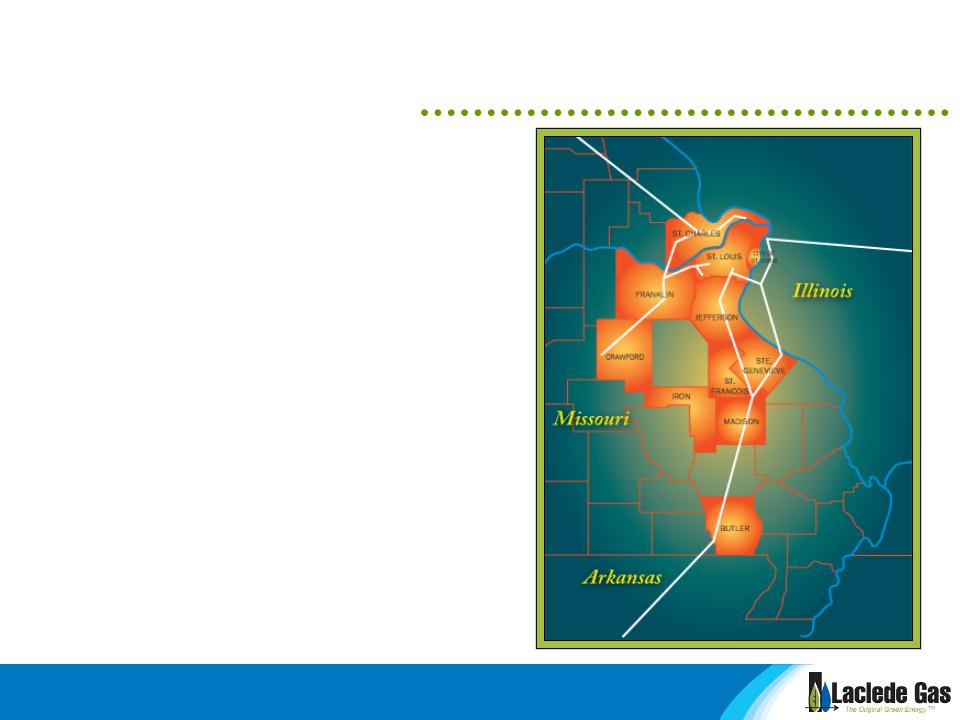
Our System and Strengths
§ Largest LDC in Missouri
• Approximately 630,000 customers
• Over 16,000 miles of pipe
• 2010 revenues of $874.6 million
• 2010 net economic earnings of $39.8 million
§ Diversified gas supply
• 31 suppliers, with limited exposure to
Gulf supply issues
Gulf supply issues
• Transportation on 7 interstate pipelines
• Ready access to conventional and
shale supplies
shale supplies
§ Significant operating storage capacity
• Market area: ~4 Bcf natural gas, ~3
Bcfe liquid propane
Bcfe liquid propane
• Upstream contracted storage: 23 Bcf
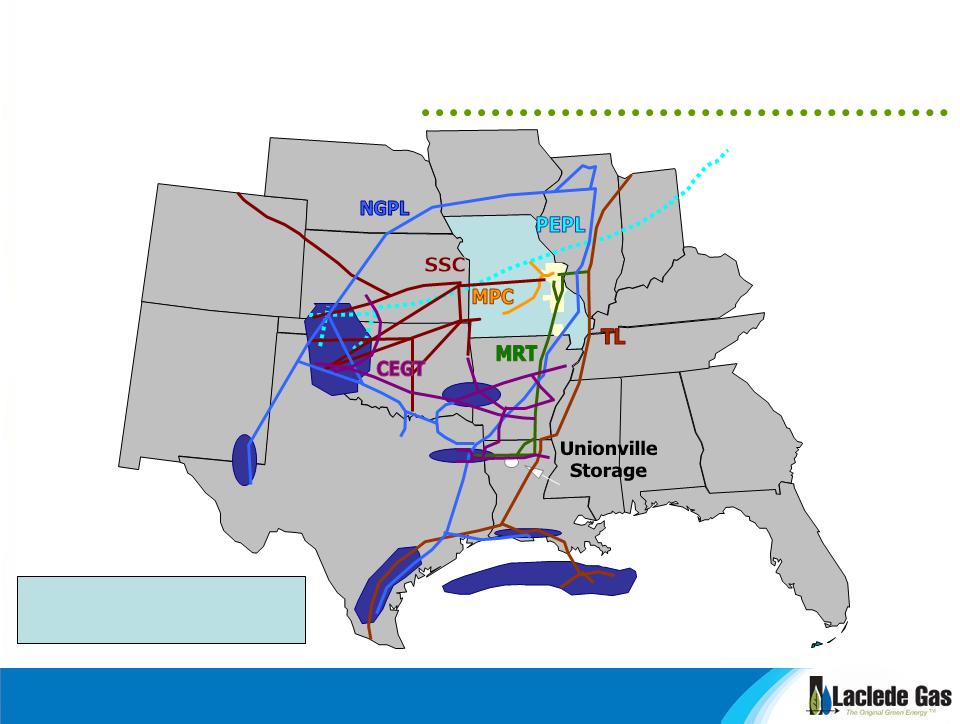
8
Diversified Conventional Gas Supply
Peak day
Flowing gas capacity
1.1 Bcf
0.7 Bcf
Top 5 gas suppliers:
§ ONEOK Energy
§ Southwestern
Energy
Energy
§ ConocoPhillips
§ CenterPoint Energy
§ Virginia Power
(Dominion)
(Dominion)
9
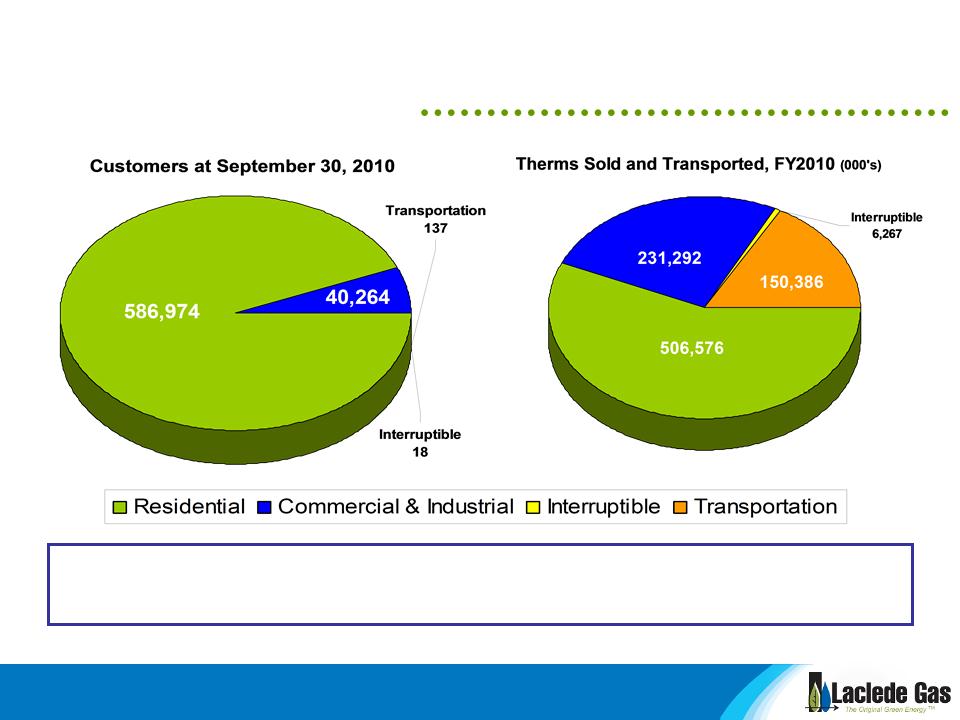
627,393
894,521
Customer Base
§ Stable customer base
§ Diverse commercial and industrial market with minimal by-pass threat
Therms sold and transported exclude fiscal 2010 off-system sales.

10
Regulatory Strategy
§ Consistent recovery of operating costs and reasonable returns
§ Long-standing focus on customer service, safety and reliability
§ Stability of rates
• Largely de-coupled rate design
– Mitigates exposure to weather and customer conservation
– Shifts recovery from total usage to customer charge and first block usage
• Infrastructure System Replacement Surcharge (ISRS)
– Timely recovery of facility-related costs between rate cases
– Includes depreciation, property taxes and rate of return
• Purchased Gas Adjustment clause to ensure recovery of gas costs
• Prudent hedging programs to reduce gas cost volatility

11
Recent Rate Activity
§ Latest general rate case became effective September 1, 2010
• Increased base rates by $31.4 million, or $20.5 million net increase after
factoring in current ISRS revenues
factoring in current ISRS revenues
• Continued weather mitigation rate design
• Recovery of higher pension costs
§ ISRS filed on October 29, 2010
• Requests recovery of $2.57 million
• Anticipated effective in early 2011
12
Consumer Awareness
Creates partnership between
customer and business objectives
customer and business objectives
§ Promotes energy efficiency
§ Identifies additional uses for natural gas
Enhances customer awareness
§ Educates customer on environmental advantages of
natural gas
§ Provides practical ways of reducing carbon footprint
Incorporates all customer touch points
§ Advertising
§ Newsletters
§ Websites/online presence
§ Direct marketing
§ Collateral materials
www.OriginalGreenEnergy.com
13
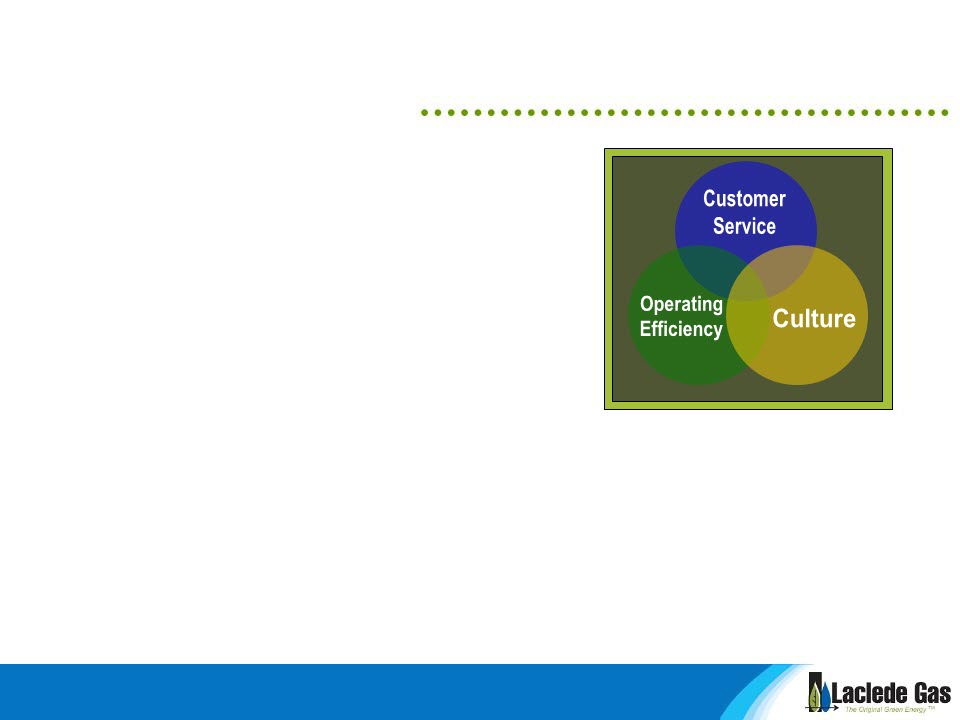
Key Accomplishments:
§ Improved Customer Care
• New call system
• Reorganized reporting structure
§ Shortened Read-to-Bill Cycle
• Improves cash flow
• Reduces borrowing costs
§ Strategic Sourcing Initiative
• Better pricing, performance from vendors
§ GPS Technology
• Quicker response times, improved work flow
Continuous Improvement


16
Laclede Energy Resources
§ Business profile
• Non-regulated natural gas marketer
– Serving large end-users since 1996
– Growing wholesale business since 2002
– Provide customers flexible pricing alternatives
• Operating primarily in the central United States
• Transactions normally settled with the physical delivery of gas
• Conducting business on 13 interstate pipelines
• Experienced management team
§ 2010 operating results
• Revenues of $859 million
• Net economic earnings of $15.7 million

17
Target Markets
§ Long-term relationships with high-quality, creditworthy
customers
customers
§ Approximately 270 customers during FY 2010
§ Major customer groups
• Utilities, municipalities and power generators
• Marketing affiliates of utilities and producers
• Diverse group of large Midwestern end-users
• Small independent producers with varying needs
§ Capture incremental opportunities using combination of
firm and interruptible pipeline services
firm and interruptible pipeline services
18
Henry Hub
Barnett
Fayetteville
Woodford
Marcellus
Market dynamics are shifting dramatically due to new supply sources
that are abundant and economical to produce
Eagleford
Active supply centers
Shale supplies
Shifting Supply

19
Supply Portfolio
§ Diverse supplier base
• 80 different suppliers used (Fiscal 2010)
• 100% onshore production
§ Top 5 Suppliers (by volume)
• Shell Energy North America
• ConocoPhillips
• Newfield Exploration (shale)
• Chesapeake Energy (shale)
• PetroQuest Energy (shale)


21
LER Risk Management
§ Conservative approach with strong oversight
§ Formal price and business risk management policy with
daily monitoring
daily monitoring
• Value at risk
• Mark-to-market trends
• Open fixed price and basis positions
§ Credit and liquidity exposure
• Strategy incorporates master netting arrangements, letters of
credit and pre-payments
credit and pre-payments
• Exposures and counterparty limits reviewed daily
• Focuses on margin quality, not volume quantity
22
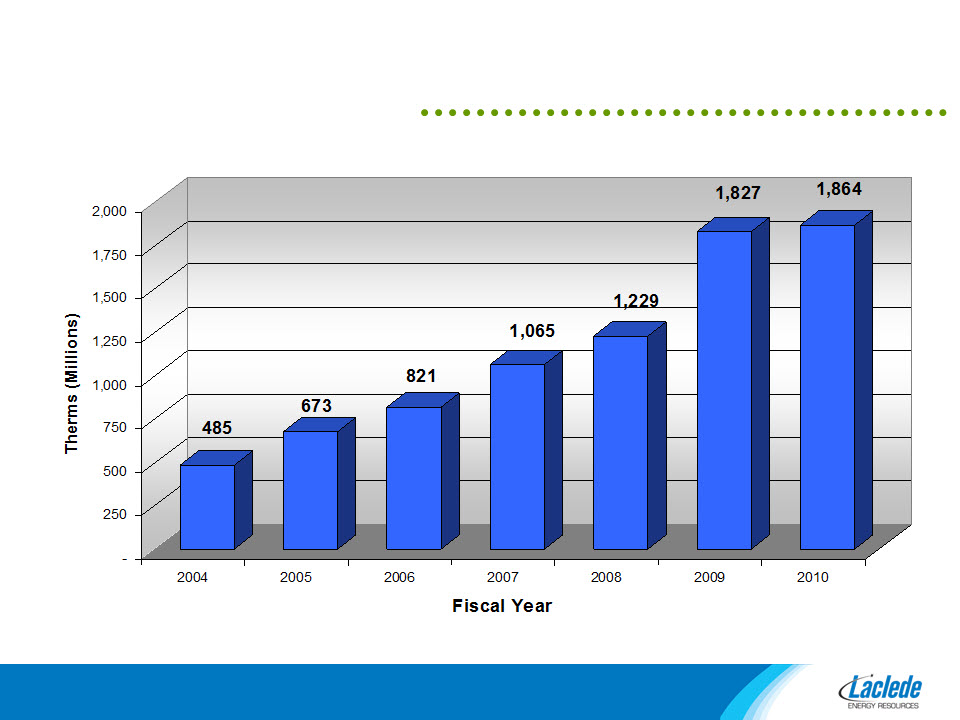
LER Volume Growth

23
Volume Growth
§ Volume growth driven by
• Expansion of overall portfolio
– Additional long-term transportation capacity and gas supplies
– Increased number of counterparties
• Growth in sales base
– New retail / wholesale customers
– Producer services
– Gas-fired electric generation
– Customer asset management
§ Resulting FY 2010 sales volumes increased 2% over
FY 2009
FY 2009

24
FY 2010 Earnings
§ 2010 net economic earnings declined to $15.7 million
from $28.1 million in FY 2009
from $28.1 million in FY 2009
§ Decline reflects
• Smaller regional price differentials
• Reduced price volatility
§ Partially offset by ability to capture seasonal basis
differential opportunities through park and loan
transactions
differential opportunities through park and loan
transactions
25
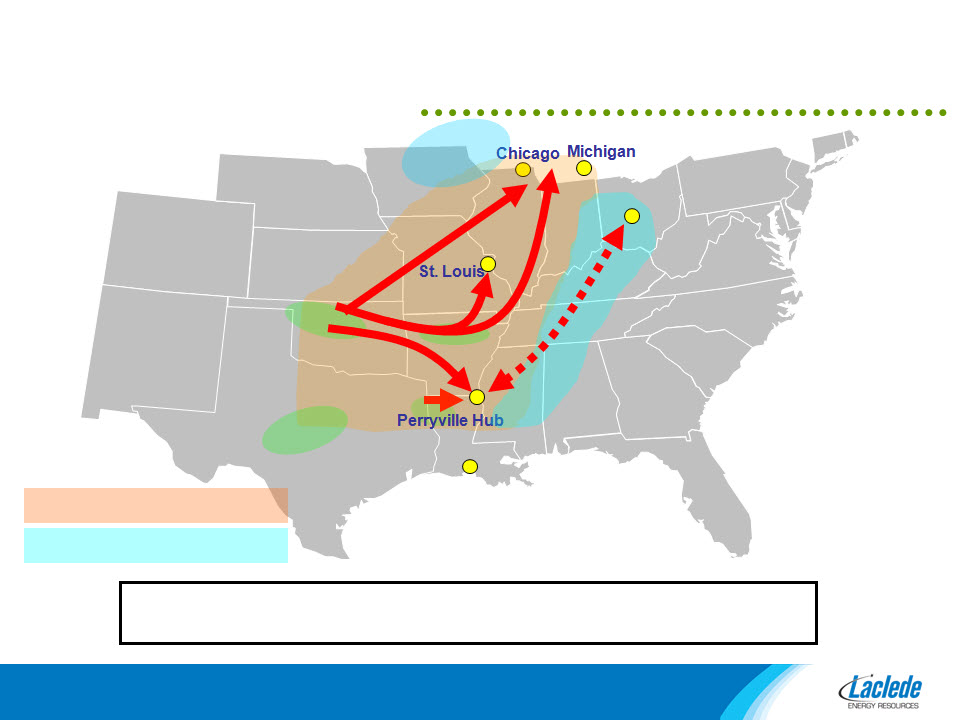
Henry Hub
Columbia Gas Transmission
(TCO)
(TCO)
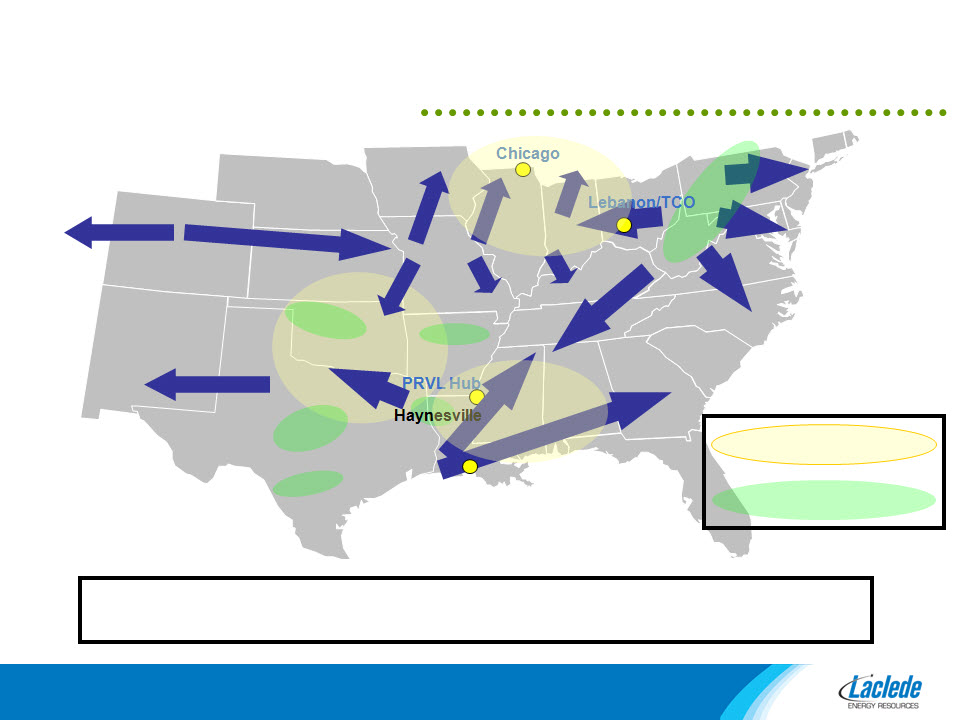
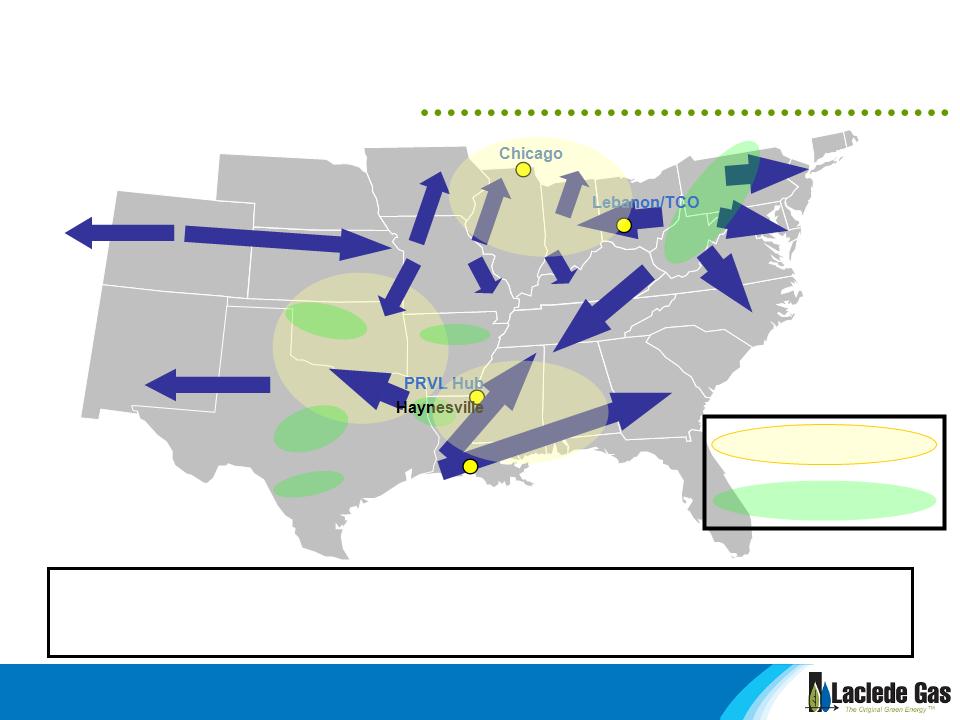
Existing Markets
Current Expansion Focus
LER continues to execute on a measured expansion approach,
reflecting current market conditions
reflecting current market conditions
Measured Expansion

Opportunities
27
Henry Hub
Barnett
Fayetteville
Woodford
Marcellus
Eagleford
Active supply centers
Shale supplies
Supply Shift
§ New shale supplies
• Represent a more cost-effective and plentiful on-shore supply
• Have driven increased pipeline capacity, especially into the Midwest and East Coast
28
Existing Businesses
Growth Opportunities
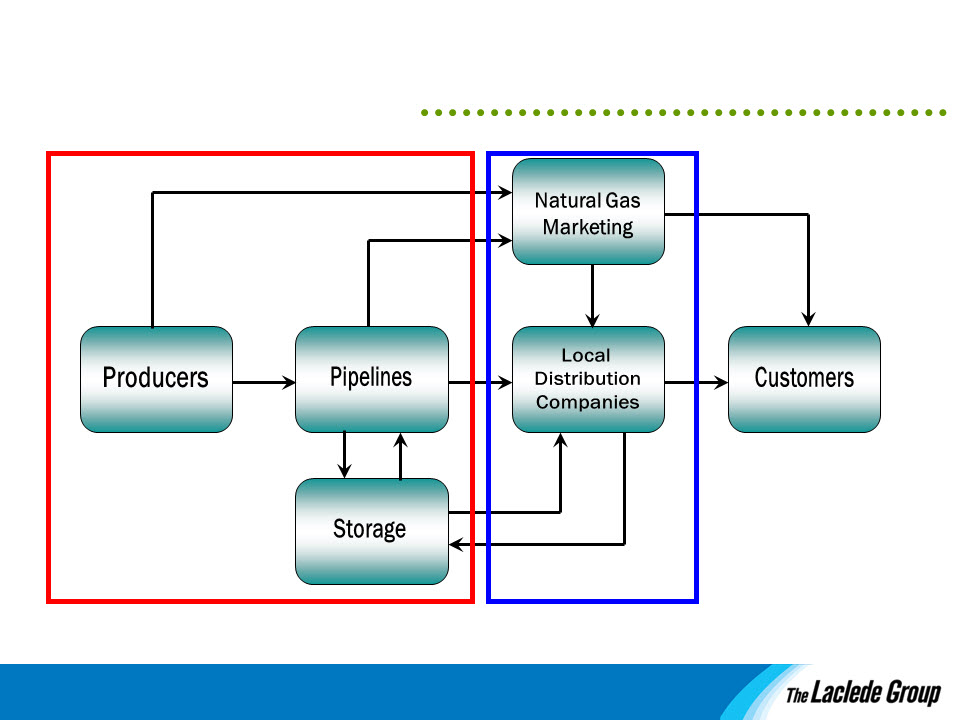
Natural Gas Industry

29
Rational, disciplined approach
Current Focus
§ Growth investment potential in
• Complementary upstream market opportunities
• Other distribution properties
• Leveraging Laclede Pipeline and existing peak shaving assets
§ Capital capacity, including available cash reserves
§ Managing a strategic balance of regulated and non-
regulated businesses
regulated businesses

Financial Overview

31
Financial Profile
§ Solid core operating earnings
§ Strong balance sheet and stable free cash flow
§ Top-tier credit rating
§ Sustainable dividend provides additional return
32
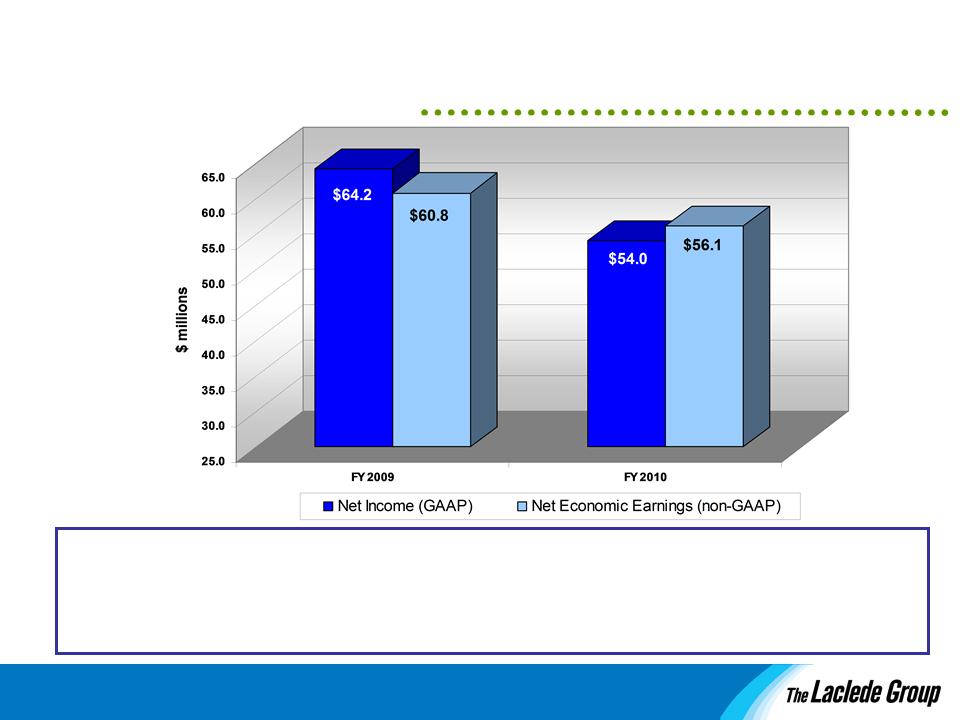
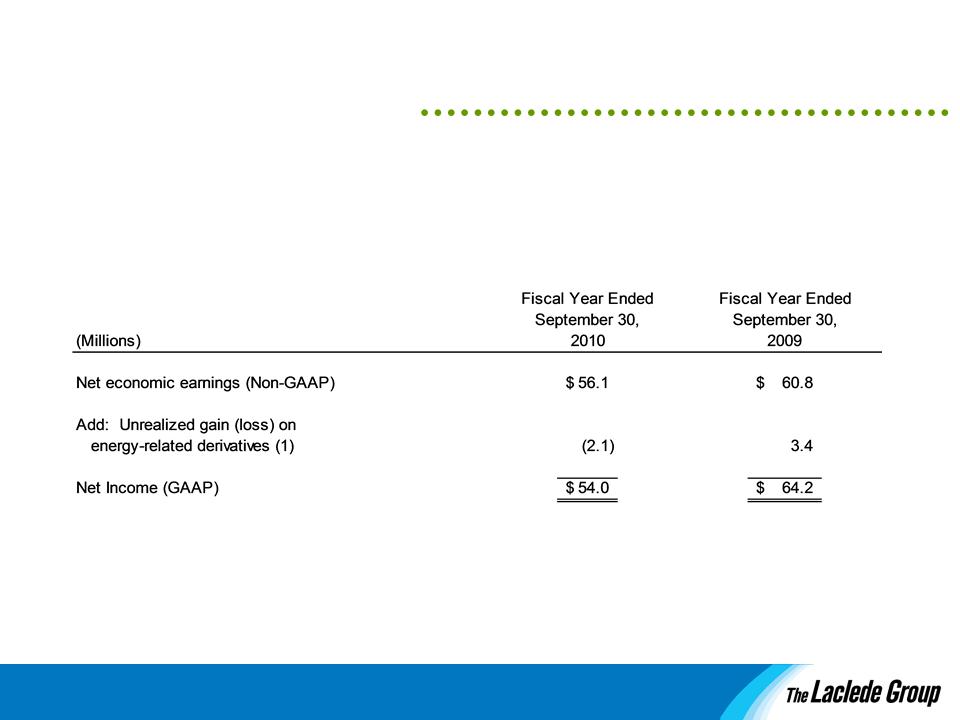
§ Net economic earnings reflect earnings on actual settled transactions, excluding
earnings volatility and timing differences associated with fair value accounting (as
required by GAAP) for transactions that have not yet been completed or settled
earnings volatility and timing differences associated with fair value accounting (as
required by GAAP) for transactions that have not yet been completed or settled
§ See Appendix for further discussion of non-GAAP measures
GAAP and Net Economic Earnings

33
FY 2010 Earnings
§ Year over year earnings decline reflected improved utility
earnings offset by lower, market-driven LER results
earnings offset by lower, market-driven LER results
§ Laclede Gas earnings benefited from:
• Non-regulated propane transaction
• Discipline in controlling operating costs
• Increased ISRS recovery
• General rate increase effective September 1, 2010
§ LER earnings declined due to
• Industry-wide narrowing of regional basis spreads
• Partially offset by park and loan transactions
• Remained solidly profitable
34
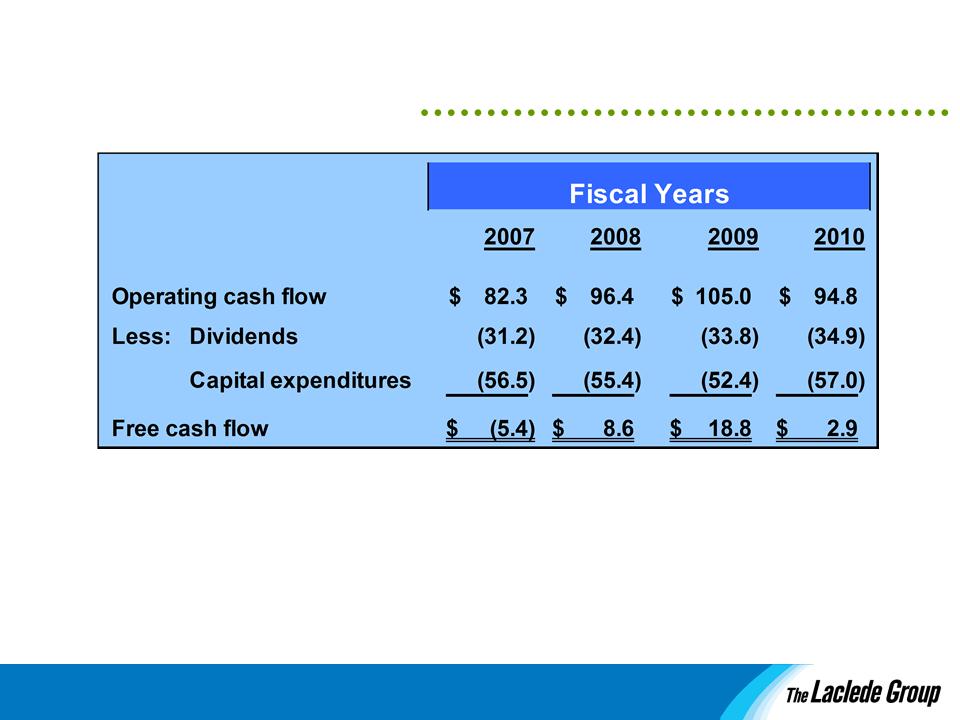
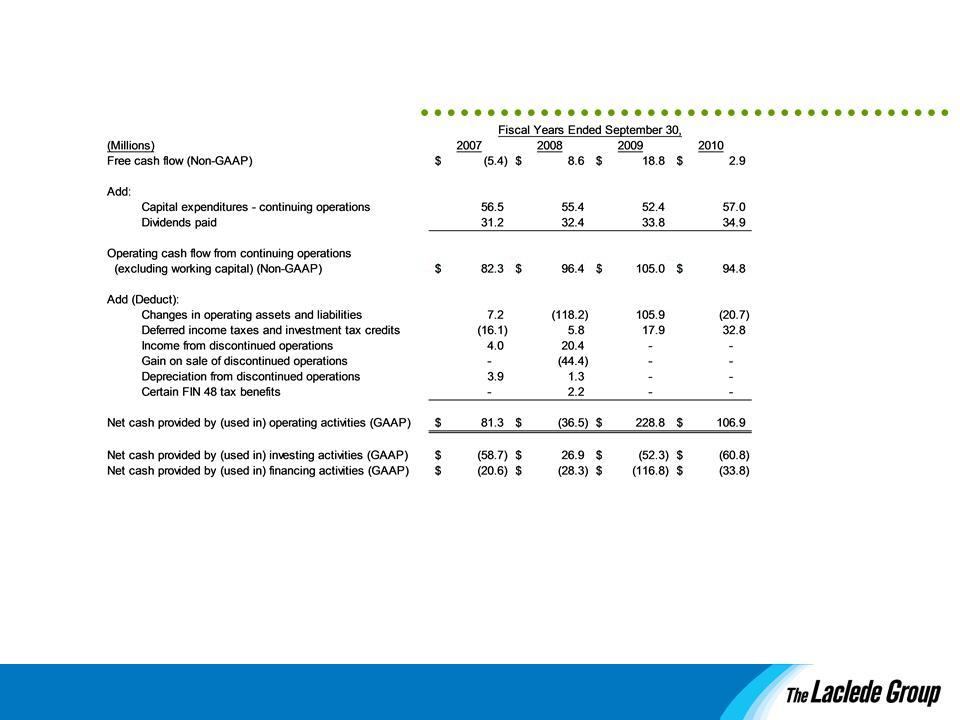
§ Cash flow continues to support business requirements
§ Capital spending reflects prudent investment in utility infrastructure
* All amounts shown are from continuing operations; see Appendix for discussion of non-GAAP measures
Cash Flow
35
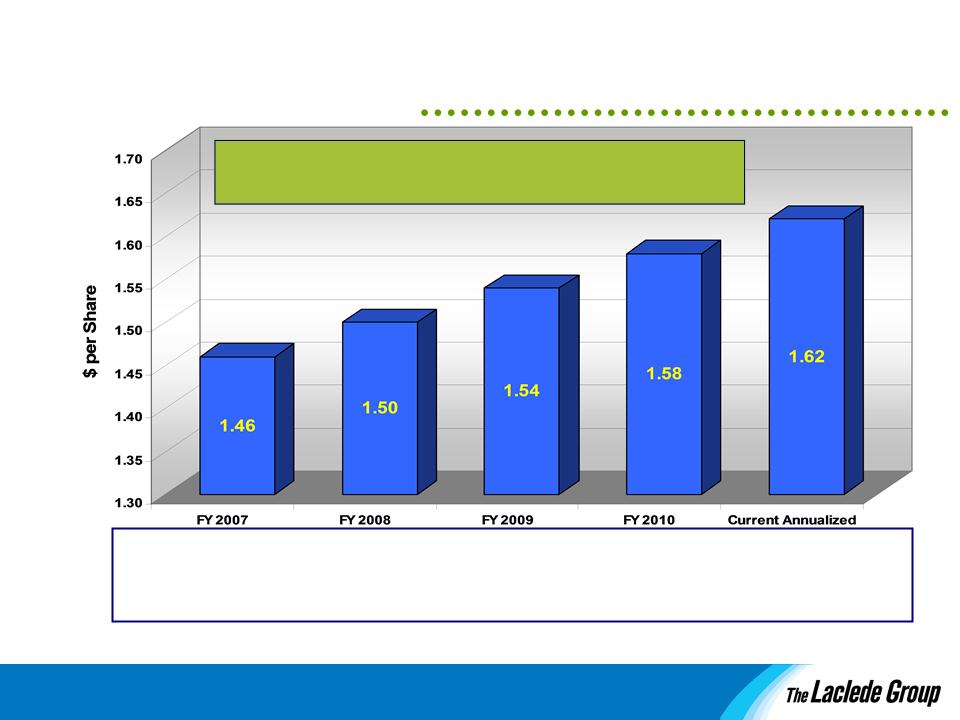
§ Dividend paid continuously since 1946
§ Quarterly dividend increased to $.405 per share; seventh consecutive annual increase
§ Dividend Yield: 4.5%
* FY 2008 payout ratio calculation excludes the gain on disposal of SM&P and related disposal costs
63%
62%
53%
Payout Ratio
65%
Dividends

36
§ Strong credit ratings
§ Ample credit facilities to finance short-term needs
• Laclede Group: $ 50 million
• Laclede Gas: $320 million
§ Long-term debt maturities
• $25 million retired in November 2010
• $25 million due October 2012
|
|
Laclede Group
|
Laclede Gas
FMB
|
Laclede Gas
CP
|
|
Standard
& Poor’s |
A
|
A
|
A-1
|
|
Moody’s
|
|
A2
|
P-2
|
|
Fitch
|
A-
|
A+
|
F1
|
Liquidity and Financial Capacity
37
Laclede Group - Key Takeaways
§ Solid core regulated utility business
§ Financial strength and cash flow to support current needs
and future investments
and future investments
§ Able to leverage knowledge and expertise to capitalize on
market opportunities
market opportunities
§ Seeking logical expansion opportunities to deliver long-term
growth
growth

Appendix
40
(1) Amounts presented net of income taxes. Income taxes are calculated by applying federal, state, and local income tax rates applicable to
ordinary income to the amounts of unrealized gain (loss) on energy-related derivative contracts. For fiscal years ended September 30,
2010 and 2009, the amount of income tax expense (benefit) included in the reconciling items above are ($1.3) million and $2.2 million,
respectively.
ordinary income to the amounts of unrealized gain (loss) on energy-related derivative contracts. For fiscal years ended September 30,
2010 and 2009, the amount of income tax expense (benefit) included in the reconciling items above are ($1.3) million and $2.2 million,
respectively.
This presentation includes the non-GAAP financial measure of “net economic earnings.” As LER continues to expand its business, the
number of transactions accounted for through fair value measurements has increased. As a result, management also uses this non-
GAAP measure internally when evaluating the Company’s performance. Net economic earnings exclude from net income the after-tax
impacts of net unrealized gains and losses on energy-related derivatives resulting from the current changes in the fair value of financial
and physical transactions prior to their completion and settlement. Management believes that excluding these timing differences
provides a useful representation of the economic impact of only the actual settled transactions and their effects on results of operations.
These internal non-GAAP operating metrics should not be considered as an alternative to, or more meaningful than, GAAP measures
such as net income. The schedule below provides a reconciliation of this non-GAAP measure to the most directly comparable GAAP
measure:
Net Economic Earnings Reconciliation
41
This presentation includes the non-GAAP measures of “free cash flow” and “operating cash flow from continuing operations (excluding working capital).”
Management uses these non-GAAP measures when evaluating the Company’s performance. Operating cash flow from continuing operations (excluding working
capital) is calculated as income from continuing operations plus depreciation, amortization, and accretion expense (from continuing operations), plus certain non-
cash charges (credits) to income (which are reflected in the “Other-net” line of the Statement of Cash Flows), minus certain tax-related benefits recorded pursuant
to FIN 48 (as codified in ASC 740). Free cash flow is operating cash flow from continuing operations (excluding working capital) reduced for capital expenditures
from continuing operations and dividends paid. Management believes that these measures provide a useful representation of the cash flows from continuing
operations generated by the Company because they exclude temporary working capital and other changes, which are primarily attributable to variations in the
timing of the collections of Laclede Gas’ gas cost and the utilization of its gas inventories. Further, by reflecting cash requirements for capital
expenditures and dividends, management believes that free cash flow provides an additional useful measure of the Company’s cash flow performance. These
internal non-GAAP measures should not be considered as an alternative to, or more meaningful than, GAAP measures such as net cash provided by (used in)
operating activities. The schedule above provides a reconciliation of these non-GAAP measures to the most directly comparable GAAP measure.
Cash Flow Reconciliation