Attached files
| file | filename |
|---|---|
| 8-K - ROSE UPDATED PRESENTATION - NBL Texas, LLC | roseupdatedpres.htm |

1
Exhibit 99.1
ROSETTA RESOURCES INC.
4th Annual Canaccord Genuity Global Energy Conference
&
J. P. Morgan Chase SMid Cap Conference
December 2010

2
All statements, other than statements of historical fact, included in this presentation are forward-looking statements within the
meaning of the Private Securities Litigation Reform Act of 1995. Forward-looking statements are statements that are not
historical facts, such as expectations regarding drilling plans, changes in acreage positions, and expected capital expenditures.
The assumptions of management and the future performance of the Company are subject to a wide range of business risks and
uncertainties and there is no assurance that these statements and projections will be met. Factors that could affect the
Company's business include, but are not limited to: the risks associated with drilling of oil and natural gas wells; the Company's
ability to find, acquire, market, develop, and produce new reserves; the risk of drilling dry holes; oil and natural gas price
volatility; uncertainties in the estimation of proved, probable, and possible reserves and in the projection of future rates of
production and reserve growth; inaccuracies in the Company's assumptions regarding items of income and expense and the level
of capital expenditures; uncertainties in the timing of exploitation expenditures; operating hazards attendant to the oil and
natural gas business; drilling and completion losses that are generally not recoverable from third parties or insurance; potential
mechanical failure or underperformance of significant wells; pipeline construction difficulties; climatic conditions; availability and
cost of material and equipment; the risks associated with operating in a limited number of geographic areas; availability of
capital; regulatory developments; environmental risks; general economic and business conditions (including the effects of the
worldwide economic recession); industry trends; and other factors detailed in the Company's most recent Form 10-K and other
filings with the Securities and Exchange Commission. If one or more of these risks or uncertainties materialize (or the
consequences of such a development change), or should underlying assumptions prove incorrect, actual outcomes may vary
materially from those forecasted or expected. The Company undertakes no obligation to publicly update or revise any forward-
looking statements except as required by law.
Forward-Looking Statements

3
Cautionary Statement Concerning Resources
The United States Securities and Exchange Commission permits oil and gas companies, in their filings with the SEC, to disclose
only proved, probable and possible reserves that a company anticipates as of a given date to be economically and legally
producible by application of development projects to known accumulations. We may use certain terms in this presentation, such
as “Risked Project Inventory,” “Project Counts,” “Net Risked Resources,” “Total Resources,” “Unrisked Potential,” “Unrisked
Original Resources in Place,” and “Unrisked EUR Potential” that the SEC's guidelines strictly prohibit us from including in filings
with the SEC. These estimates are by their nature more speculative than estimates of proved reserves and accordingly are
subject to substantially greater risk of actually being realized.
For filings reporting year-end 2009 reserves, the SEC permits the optional disclosure of probable and possible reserves. The
Company has elected not to report probable and possible reserves in its filings with the SEC. We use the term “net risked
resources” to describe the Company’s internal estimates of volumes of natural gas and oil that are not classified as proved
reserves but are potentially recoverable through exploratory drilling or additional drilling or recovery techniques. Estimates of
unproved resources are by their nature more speculative than estimates of proved reserves and accordingly are subject to
substantially greater risk of actually being realized by the Company. Estimates of unproved resources may change significantly as
development provides additional data, and actual quantities that are ultimately recovered may differ substantially from prior
estimates.
We use the term “BFIT NPV10” to describe the Company’s estimate of before income tax net present value discounted at 10
percent resulting from project economic evaluation. The net present value of a project is calculated by summing future cash
flows generated by a project, both inflows and outflows, and discounting those cash flows to arrive at a present value. Inflows
primarily include revenues generated from estimated production and commodity prices at the time of the analysis. Outflows
include drilling and completion capital and operating expenses. Net present value is used to analyze the profitability of a
project. Estimates of net present value may change significantly as additional data becomes available, and with adjustments in
prior estimates of actual quantities of production and recoverable reserves, commodity prices, capital expenditures, and/or
operating expenses.
Forward-Looking Statements (Cont.)

4
• Upgraded Eagle Ford outlook
• Gates Ranch EUR revised upward
• Light Ranch discovery announced
• Pipeline and processing capacity expanded
• Inventory in excess of 1TCFE
• Shift to liquids accelerates
• Bakken evaluation continues
• Six wells drilled
• Additional five wells to be drilled by early 2011
• Completions planned for 2011
• Legacy gas assets do not compete on returns vs. new inventory
• Additional asset sales scheduled
• $310 million Capital Budget in 2010
• 75% of program is liquids-directed
• Critical for maintaining and building momentum on NAV
• Strong alignment with stakeholders remains fundamental driver
Taking it Up a Notch

5
Rosetta Asset Portfolio Status

6
Eagle Ford - Gates Ranch

7
• 4th Quarter 2007
• Rosetta begins to focus on source rocks and unconventional resources in South Texas
• Rosetta has more than 100,000 net acres being developed in the Wilcox sands of South Texas
• EOY 2007
• Rosetta has 5,000 net acres under lease with Eagle Ford potential
• EOY 2008
• Rosetta has 25,000 net acres under lease with Eagle Ford potential
• Rosetta completes vertical pilot drilling program to understand resource potential
• EOY 2009
• Rosetta has 61,000 net acres under lease with Eagle Ford potential
• Rosetta drills its successful horizontal discovery well in Springer Ranch (14,000 net acres)
• Rosetta drills its successful horizontal discovery well in Gates Ranch Area (29,500 net acres)
• Third Quarter 2010
• Rosetta has 65,000 net acres under lease with Eagle Ford potential
• Rosetta begins full delineation of Gates Ranch to ascertain the continuity of well performance
• Rosetta has drilled its 22nd horizontal well at Gates Ranch with 100% success rate
• Gates Ranch EUR revised to 7.2 Bcfe
Rosetta had accumulated roughly 40% of its 65,000 acre position before year-end
2008 and 94% before year-end 2009…
2008 and 94% before year-end 2009…

8
Rosetta’s drilling focus has been primarily on our Gates Ranch Area, however, we
have embarked on the delineation of our other liquids-rich areas…
have embarked on the delineation of our other liquids-rich areas…
|
Area
|
Hydrocarbon Window
|
Net Acres
|
|
Gates Ranch Area
|
Condensate
|
29,960
|
|
Central Dimmit
|
Oil
|
7,450
|
|
Encinal Area
|
Dry Gas
|
14,500
|
|
Gonzales Area
|
Oil
|
6,500
|
|
NE LaSalle Area
|
Oil
|
3,450
|
|
Western Webb
|
Condensate
|
3,000
|
|
Total
|
77% liquids
|
64,860
|

9
Gates Ranch Area
10
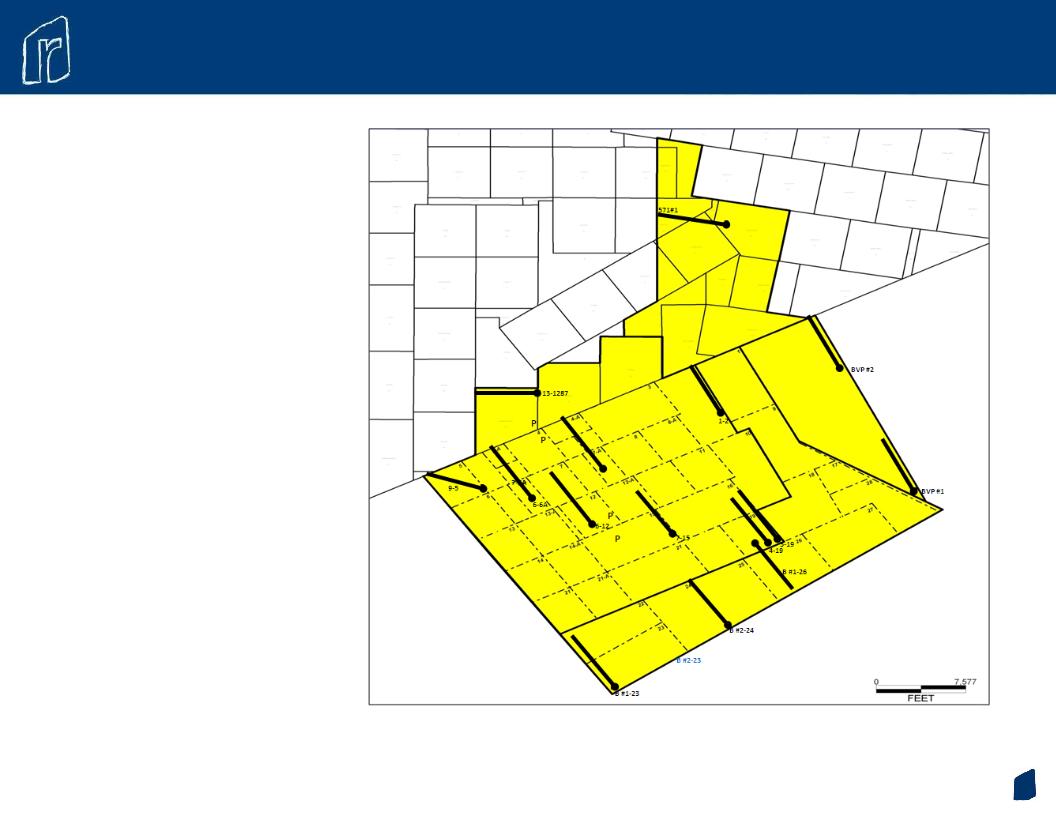
Gates Ranch Delineation
Initial horizontal wells were strategically located to delineate the asset
Delineation Wells
• Gates 05D 9-5
• Gates 05D 3-19
• Gates 05D 4-19
• Gates 05D 13-1287
• Gates 05D 7-7A
• Gates 05D 6-6A
• Gates 09 Rose B 1-23
• Gates 05D 1-2
• Gates 09 Rose B 2-24
• Gates 05D 6-12
• Gates 09 Rose A BVP-2
• Gates 05D 7-15
• Gates 09 Rose A BVP-1
• Gates 09 Rose B 1-26
• Gates 10 Rose A 571-1

11
Delineation Wells
• Gates 05D 9-5
• Gates 05D 3-19
• Gates 05D 4-19
• Gates 05D 13-1287
• Gates 05D 7-7A
• Gates 05D 6-6A
• Gates 09 Rose B 1-23
• Gates 05D 1-2
• Gates 09 Rose B 2-24
• Gates 05D 6-12
• Gates 09 Rose A BVP-2
• Gates 05D 7-15
• Gates 09 Rose A BVP-1
• Gates 09 Rose B 1-26
• Gates 10 Rose A 571-1
Development Wells
• Gates 05D 6-8
• Gates 05D 2-20
• Gates 09 Rose B 1-1
• Gates 09 Rose B 2-23
• Gates 09 Rose A BVP-3
• Gates 05D 1-8A
• Gates 10 Rose A 1000-1
Planned Wells (Drilled by YE 2010)
• Gates 05D 2-8A
• Gates 05D 8-15
• Gates 09 Rose B 2-1
• Gates 09 Rose B 2-26
Including our initial Gates Ranch discovery well, we have drilled 22 horizontal wells in the
field to date…averaging roughly 5,000 feet of horizontal length per well…
field to date…averaging roughly 5,000 feet of horizontal length per well…

12
Gates Ranch New Type Curve
Based on actual well performance, the average EUR has been revised from 4.0 BCFE to 7.2 BCF

13
|
Area
|
Initial
Gas Rate
(mmcfpd)
|
Initial
Oil Rate
(bopd)
|
EUR
(bcfe)
|
NPV Per
Well BFIT10
($MM)
|
Discounted
Payout
(years)
|
Post 2010
Inventory
(Net Wells)
|
NPV Per Area
BFIT10
($)
|
|
Gates North Type Curve
|
5.0
|
450
|
6.7
|
13.0
|
1.6
|
150
|
$1.950 billion
|
|
Gates South Type Curve
|
7.0
|
350
|
8.1
|
14.1
|
1.4
|
90
|
$1.269 billion
|
|
Gates Ranch Type Curve
|
5.7
|
412
|
7.2
|
13.4
|
1.5
|
240
|
$3.219 billion
|
Notes:
Gates Ranch proper only (26,500 net acres)
100 acre well spacing
$8.25 mm total well cost
Strip pricing effective 10/26/2010
‘Per area’ values are ‘per well’ values multiplied by post 2010 net inventory
Gates Ranch Valuation
On average, a typical well has a 7.2 BCFE EUR and a BFIT NPV of $13.4 million…

14
Although the Gates Ranch Area offers us more than 18 rig years...we are defining
Inventory beyond Gates Ranch Area…
Inventory beyond Gates Ranch Area…
Central Dimmit Area

15
Central Dimmit Discovery Well
Initial Test

16
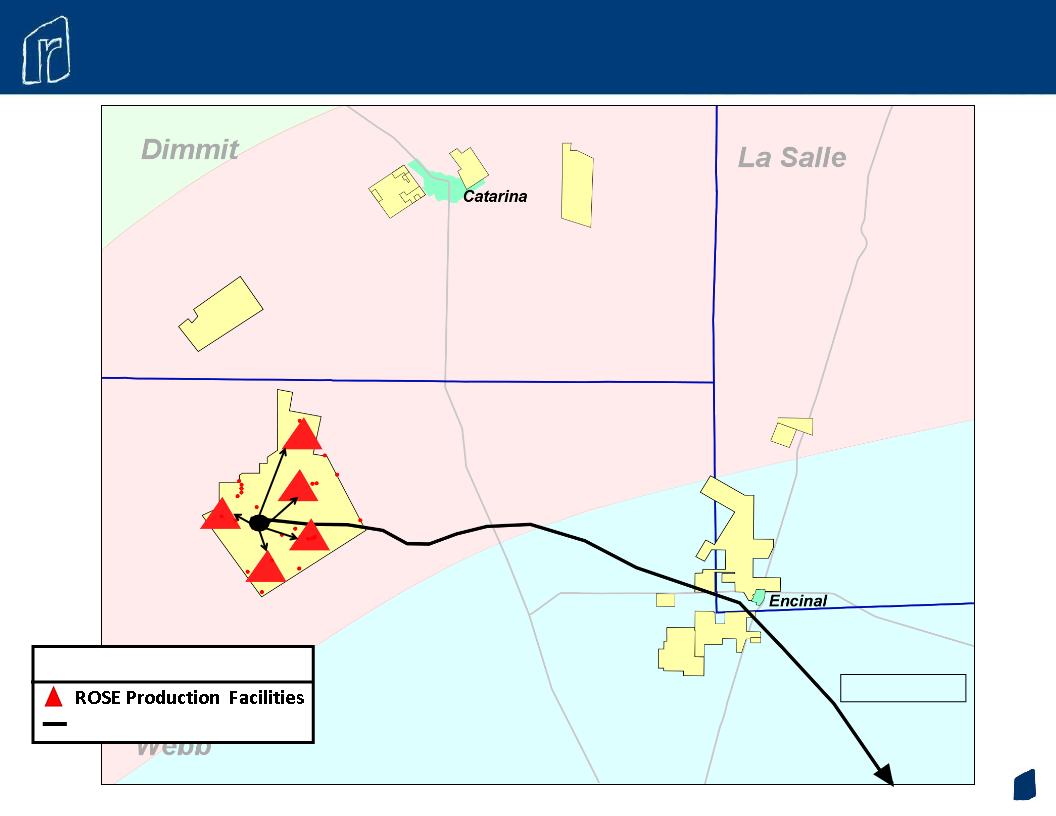
With less than 5% of our Gates Ranch Area inventory drilled and producing, we have built a
legacy asset from scratch that is currently producing more than 70 MMcfe/d…
legacy asset from scratch that is currently producing more than 70 MMcfe/d…
17
Eagle Ford Pipeline Projects
DOS HERMANAS
To HPL
Legend
Dos Hermanas
18
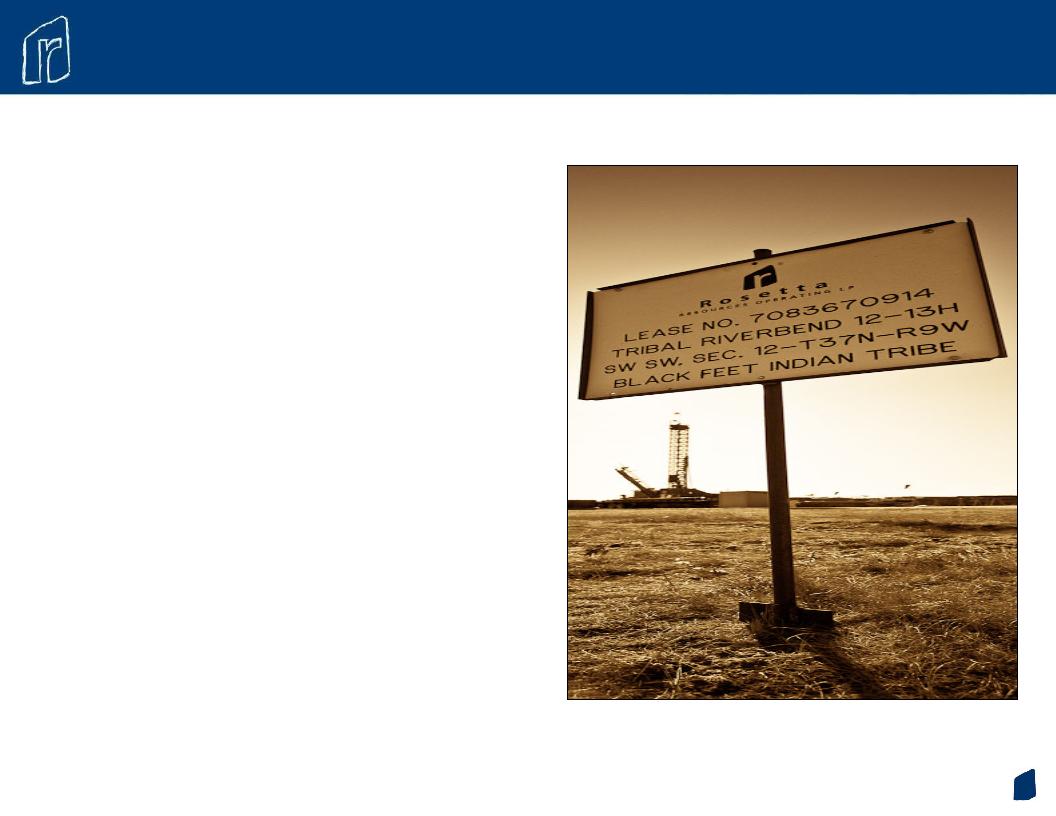
• Alberta Basin Bakken specifics
• Devonian Shale oil play in NW Montana
• Williston Basin analog
• Depths ranging from 4,500’ to 7,500’ TVD
• Over-pressured reservoirs
• Rosetta’s current Bakken position
• 300,000 undeveloped net acres
• 13 - 15 MMBoe per square mile of resource in
place
place
• Rosetta’s assessment to date
• Drilled 5 exploratory delineation wells
• 2 wells on strike 28 miles apart
• 1 well 8 miles downdip
• Drilled a north east extension into interesting
Banff-Big Rock 29-13
Banff-Big Rock 29-13
• Drilled a middle of area well established
continuity-Little Rock Coulee 27-16
continuity-Little Rock Coulee 27-16
• Confirmed significant oil hydrocarbons in place
and over-pressured reservoirs
and over-pressured reservoirs
• Conducted vertical tests in several zones
• Multi-well vertical program underway
Alberta Basin Bakken Opportunity is Unique

19
Exploratory Drilling & Testing
Vertical Well Drilling & Testing - 2H’10/1H’11
Vertical Well Drilling & Testing - 2H’10/1H’11
|
Vertical Exploration
|
|
|
Area
|
Locations
|
|
Big Rock
|
1
|
|
Love Rock
|
1
|
|
Little Rock Coulee
|
1
|
|
West Gunsight
|
1
|
|
Antelope Butte
|
1
|
|
Gunsight
|
1
|
|
Total
|
6
|
20
|
Acres
|
Lessor
|
Terms
|
|
200,000
|
Blackfeet Indian Nation
|
• Five year option with 2 well per year drilling requirement for 10 well total.
• With each commercial well, Rosetta earns the right to lease 20,000 acres
surrounding that well for a 10 year term. • Continuous drilling obligation of 1 well per 9 months beginning on the 4th
year. |
|
30,000
|
WAVE
|
• Terms similar to option acreage.
|
|
52,000
|
Allottee (Blackfeet Families)
|
• Typically 5 year lease terms, with option to extend term at the end of the
primary period. |
|
18,000
|
Fee Acreage
|
|
Southern Alberta Basin
Acreage Recap
Acreage Recap

21
Financial Strategy
• Bias for conservative and disciplined approach to financial
management
management
• Actively manage and monitor use of debt
• Debt to book cap < 40%
• Debt to EBITDAX < 1.75x
• Attempt to maintain high level of liquidity throughout cycles
• Selective hedging program:
• Gas hedges of 55,000 MMBtu/d in 2H’10 and 50,000 MMBtu/d in 2011
• Oil hedges of 800 Bbl/d in 2011/ 600 Bbl/d in 2012
• NGL Hedges of 700 Bbl/d in 2011/ 450 Bbl/d in 2012
• Asset sales to “balance” 2010 capital program
1 Adjusted for the high yield offering

22
Rosetta Resources - 2010 Highlights
• Capital spending of $310 million
• ~10% increase going entirely to liquids programs
• High return / high value programs receiving vast majority of funding
• Capital exceeds internal cash flows, but expect to balance with asset
sales
sales
• Production growth
• Annual production rate of 135 to 140 MMcfe/d
• Exit rate of 145-155 MMcfe/d
• Eagle Ford exit rate of 80-90 MMcfe/d
• Reserve growth
• Double digit reserve growth rate

23
• Develop high return Eagle Ford inventory
• Divest additional legacy assets to fund development
• Simplify and reduce unit cost structure
• Focus on returns
• Test Southern Alberta Bakken position
2011 Preview

24

25
Appendix 1 of 5: 3-Stream Process Flow - Gates Ranch
Note: This example describes the 3-streams of production from the average 2010 Gates Ranch horizontal wells
(based on completions as of July, 2010) and also provides a “rule of thumb” factor to convert “net Rosetta sales
volumes” (measured in Mcfe/d) to “gross wellhead gas” (measured in Mcf/d.) This is important for understanding
Rosetta’s takeway capacity situation. As described, gross wellhead gas, and therefore takeaway capacity, is
multiplied by ~1.3 to determine net sales to Rosetta.
26
Appendix 2 of 5: Converting Wellhead to Sales
|
|
Well Head
Production |
Effect of
Processing
|
Mcfe
Equivalent
|
|
Gas
|
4,430 Wet Mcf/d
|
3,100 Lean Mcf/d
|
3,100 Mcfe/d
|
|
NGL
|
--
|
500 Bbl/d
|
3,000 Mcfe/d
|
|
Condensate
|
320 Bbl/d
|
320 Bbl/d
|
1,920 Mcfe/d
|
|
Gross Production
|
8,020 Mcfe/d
|
||
|
Net Production
|
6,015 Mcfe/d
|
|
|
6,015 Net
|
|
|
|
Uplift
|
|
=
|
1.36
|
|
|
4,430 Gross
|
|
|
Note: This example describes the 3-streams of production from the average 2010 Gates Ranch horizontal wells (based
on completions as of July 2010) and also provides a “rule of thumb” factor to convert “net Rosetta sales volumes”
(measured in Mcfe/d) to “gross wellhead gas” (measured in Mcf/d). This is important for understanding Rosetta’s
takeaway capacity situation. As described, gross wellhead gas, and therefore takeaway capacity, is multiplied by ~1.3
to determine net sales to Rosetta.

27
Appendix 3 of 5: Converting to Net 3-Stream Volumes
|
|
Well Head
Production |
Effect of
Processing
|
Mcfe
Equivalent
|
|
Gas
|
85,000 Wet Mcf/d
|
59,481 Lean
|
59,481 Mcfe/d
|
|
NGL
|
--
|
9,594 Bbl/d
|
57,564 Mcfe/d
|
|
Condensate
|
2,889 Bbl/d
|
6,139 Bbl/d
|
36,834 Mcfe/d
|
|
Gross Production
|
153,879 Mcfe/d
|
||
|
Net Production
|
115,409 Mcfe/d
|
|
|
115,409 Net
|
|
|
|
Uplift
|
|
=
|
1.36
|
|
|
85,000 Gross
|
|
|
Note: This example describes the 3-streams of production from the average 2010 Gates Ranch horizontal wells (based
on completions as of July 2010) and also provides a “rule of thumb” factor to convert “net Rosetta sales volumes”
(measured in Mcfe/d) to “gross wellhead gas” (measured in Mcf/d). This is important for understanding Rosetta’s
takeaway capacity situation. As described, gross wellhead gas, and therefore takeaway capacity, is multiplied by ~1.3
to determine net sales to Rosetta.
on completions as of July 2010) and also provides a “rule of thumb” factor to convert “net Rosetta sales volumes”
(measured in Mcfe/d) to “gross wellhead gas” (measured in Mcf/d). This is important for understanding Rosetta’s
takeaway capacity situation. As described, gross wellhead gas, and therefore takeaway capacity, is multiplied by ~1.3
to determine net sales to Rosetta.

28
Appendix 4 of 5: Gates Ranch NGL Breakdown

29
Appendix 5 of 5: NGL Hedge Detail
|
Barrel Component
|
% of Bbl
|
% WTI
|
Hedged
Volume |
$/GAL
|
$/Bbl
|
|
Ethane
|
50%
|
25%
|
-
|
-
|
-
|
|
Propane
|
25%
|
50%
|
350
|
1.00
|
41.92
|
|
Butane (I&N)
|
17%
|
86%
|
210
|
1.33
|
55.50
|
|
Natural Gasoline
|
8%
|
92%
|
140
|
1.68
|
70.61
|
|
Avg. Price per Bbl
|
|
47%
|
700
|
1.23
|
51.74
|