Attached files
| file | filename |
|---|---|
| 8-K - FORM 8-K - MOSAIC CO | d8k.htm |
 The Mosaic Company
2010 Citi
Basic Materials Conference
December 1, 2010
Larry Stranghoener
Executive Vice President and Chief Financial Officer
Exhibit 99.1 |
| Good morning everyone. I’m delighted to have the opportunity
to speak with you today about Mosaic, the outstanding long-term outlook
for the crop nutrient industry and our strong market position in both potash and
phosphate.
We’d like to thank PJ Juvekar
for coverage of the sector and sponsoring this conference.
This is a great time to be in the ag
business. The world needs crops need nutrients to meet food demand and
Mosaic is positioned to capitalize on this long term opportunity.
|
 This presentation contains forward-looking statements within the meaning of
the Private Securities Litigation Reform Act of 1995. Such statements
include, but are not limited to, statements about future financial and
operating results. Such statements are based upon the current beliefs
and expectations of The Mosaic Company’s management and are subject to
significant risks and uncertainties. These risks and uncertainties include
but are not limited to the predictability and volatility of, and customer
expectations about, agriculture, fertilizer, raw material, energy and
transportation markets that are subject to competitive and other pressures and economic and credit
market conditions; the level of inventories in the distribution channels for crop
nutrients; changes in foreign currency and exchange rates; international
trade risks; changes in government policy; changes in environmental and other
governmental regulation, including greenhouse gas regulation; further developments
in the lawsuit involving the federal wetlands permit for the extension of
the Company’s South Fort Meade, Florida, mine into Hardee County,
including orders, rulings, injunctions or other actions by the court or actions by
the plaintiffs, the Army Corps of Engineers or others in relation to the
lawsuit, or any actions the Company may identify and implement in an effort to
mitigate the effects of the lawsuit; other difficulties or delays in receiving, or
increased costs of, or revocation of, necessary governmental permits or
approvals; the effectiveness of the Company’s processes for managing its
strategic priorities; adverse weather conditions affecting operations in Central
Florida or the Gulf Coast of the United States, including potential
hurricanes or excess rainfall; actual costs of asset retirement, environmental
remediation, reclamation or other environmental regulation differing from
management’s current estimates; accidents and other disruptions
involving Mosaic’s operations, including brine inflows at its Esterhazy,
Saskatchewan potash mine and other potential mine fires, floods,
explosions, seismic events or releases of
hazardous or volatile chemicals, as well as other risks and uncertainties reported
from time to time in The Mosaic Company’s reports filed with the
Securities and Exchange Commission. Actual results may differ from those set
forth in the forward-looking statements.
Safe Harbor Statement
2 |
| Before I proceed, I would like to remind you that our presentation
contains forward-looking statements. The statements include, but
are not limited to, statements about future financial and operating results. They are
based upon management’s beliefs and expectations as of today’s date,
December 1, 2010 and are subject to significant risks and
uncertainties. Actual results may differ materially from those projected in the forward-
looking statements. Additional information concerning factors that could cause
actual results to differ materially from those in the forward-looking
statements is included in our reports filed with the Securities and Exchange
Commission. |
 Introduction
•
Mosaic is the leading P&K company in the
world
–
Potash growth through expansions
–
Largest
integrated
phosphate
producer
–
low
cost
and geographic advantage
•
Crop nutrient markets extremely tight due
to a variety of supply and demand factors
•
Healthy farmer economics support
continued investment in crop nutrients
3 |
| This
morning
I
will
first
review
Mosaic’s
strategy.
We
are
very
upbeat
about
the
long
term
fundamentals
of
our
business and continue to position ourselves for the growth of this sector.
To meet this growth we are undertaking major expansion projects in our potash business and
strengthening the cost position of our phosphate business.
Current supply and demand factors for each of these nutrients are very tight, as you will hear later
in my remarks.
Finally, I will discuss our market outlook and today’s favorable conditions.
|
 Strategic Overview
As a global leader in crop nutrients, Mosaic
is positioned to benefit from attractive long
term agricultural fundamentals:
Potash –
grow volume
–
Brownfield expansion program
Phosphates –
grow value
–
Leverage scale and geographic location
–
Extend phosphate reserves
Global distribution assets aligned with
production
4 |
| At Mosaic, our focus is on shareholder value creation, driven by
the attractive fundamentals of our business.
Our mission is to help the world grow the food it needs. We run
our business with a long term view –
and this
view is compelling!
We are executing well on our strategy. In Potash, we are growing
volume by pursuing brownfield
expansion
opportunities. In Phosphates, we are focusing on growing the value of our
business and maintaining our position as one of the lowest cost phosphate
producers in the world. Our expansive global distribution network,
aligned with our North American production assets, provides us access to the
largest global markets on a counter seasonal basis.
Over time, the combination of two strong product lines has produced great returns
for our shareholders. Our balanced portfolio of both potash and
phosphate gives more stability to our sales volumes and cash flow than
single nutrient focused companies. |
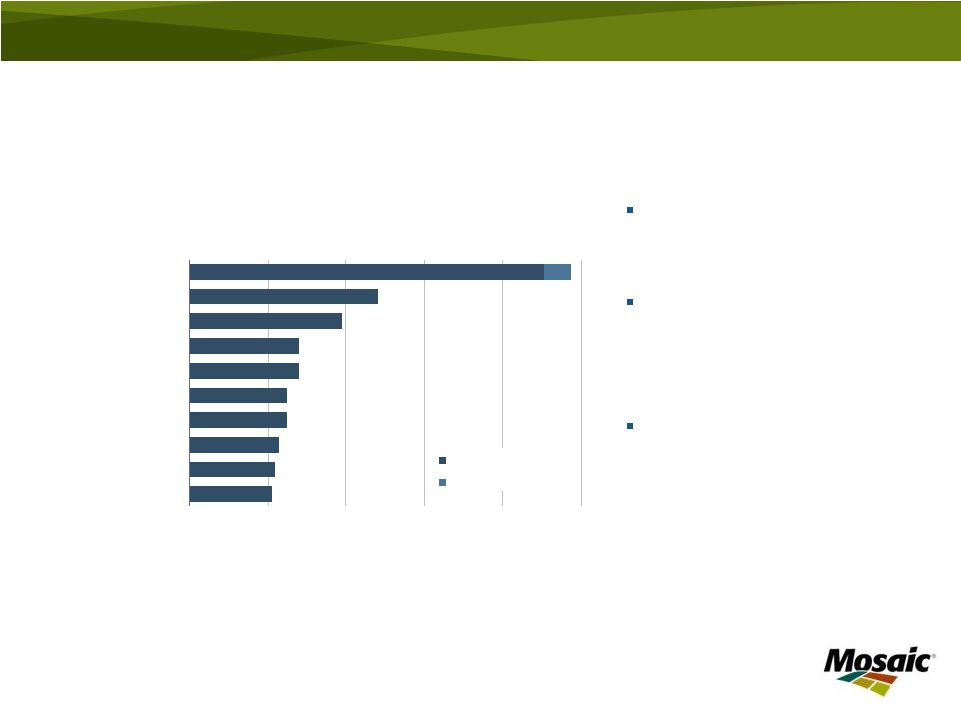
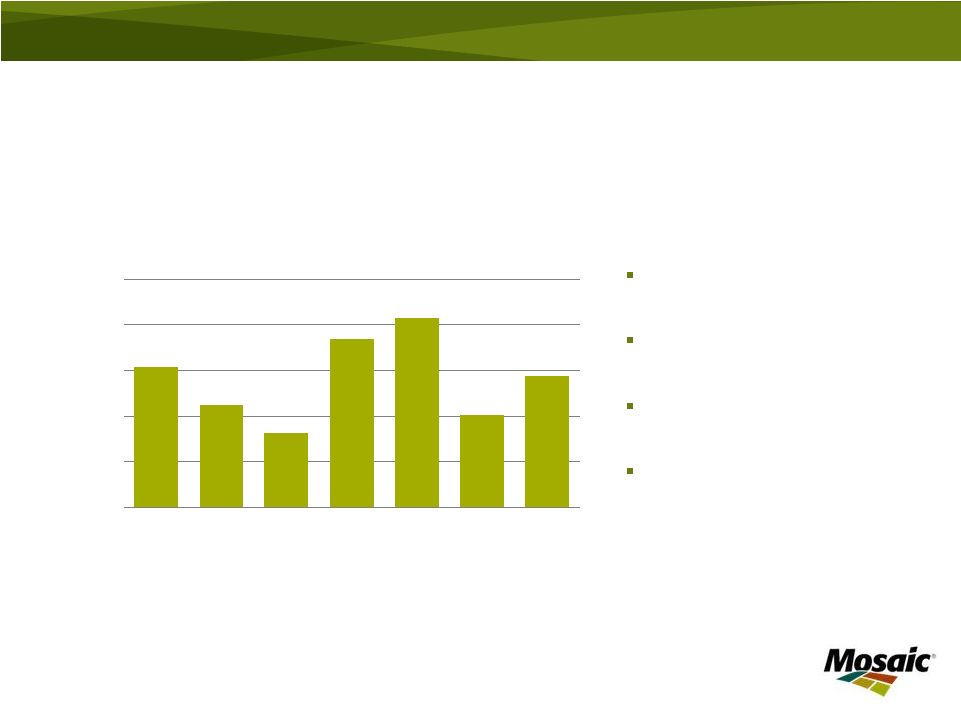
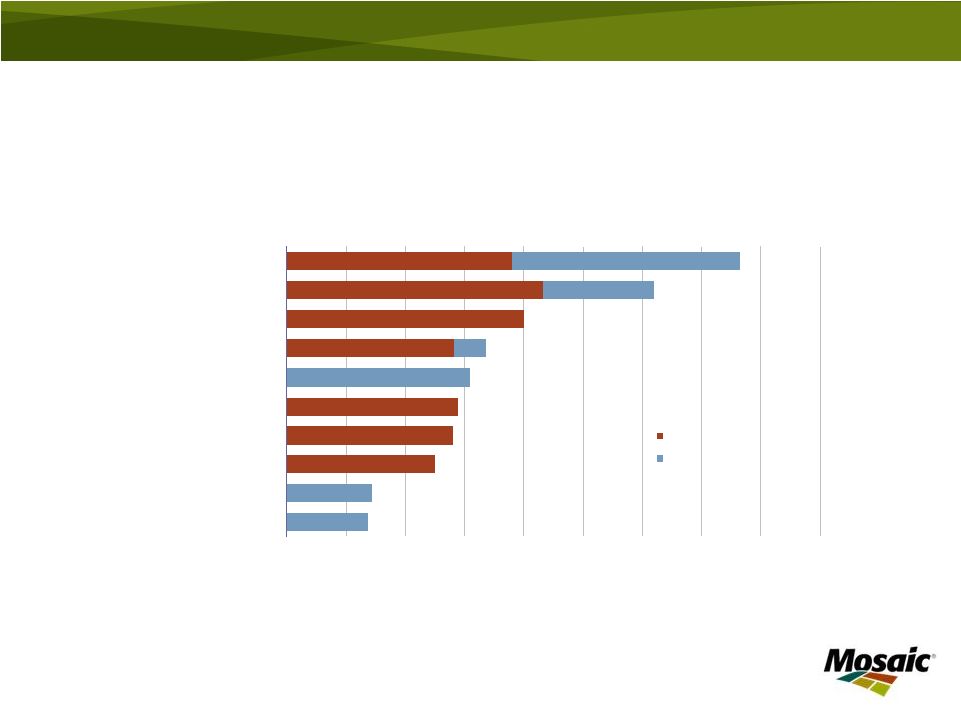 Leader in Potash and Phosphate
5
WORLD’S LARGEST P&K COMPANIES
0
1
2
3
4
5
6
7
8
9
Mosaic
PotashCorp
Belaruskali
Israel Chemicals
OCP
K+S
Silvinit
Uralkali
GCT
Yuntianhua
MILLION TONNES PRODUCTION, 3 YEAR AVERAGE
K2O
P2O5
Source: IFA, company reports and Mosaic estimate
|
| As the leading producer of potash and phosphate, there is no company
better positioned to capture the growth in crop nutrient markets.
Farmers need to plant record areas and harvest ever increasing yields to meet the
world’s accelerating appetite for grains and oilseeds. That
implies strong growth in global crop nutrient markets. Recent
developments reinforce the long-term attractiveness of the crop nutrient sector. Strong agricultural
markets have contributed to high demand for our products. This comes at a
time when producer inventories are low and there are growing supply
concerns. Most of you know about the strong fundamentals for the potash
business. What you may not know is that we are nearly as large as the two
biggest potash companies. When combined with our leading position in phosphates –
which
is
currently
generating
more
profit
than
our
potash
business
–
we
are
the
largest
P&K
company
in
the
world. |
 MURIATE OF POTASH CAPACITY
MILLION TONNES KCL
0
2
4
6
8
10
12
14
PotashCorp
Mosaic
Belaruskali
Silvinit
ICL
Uralkali
K+S
Qinghai
APC
Agrium
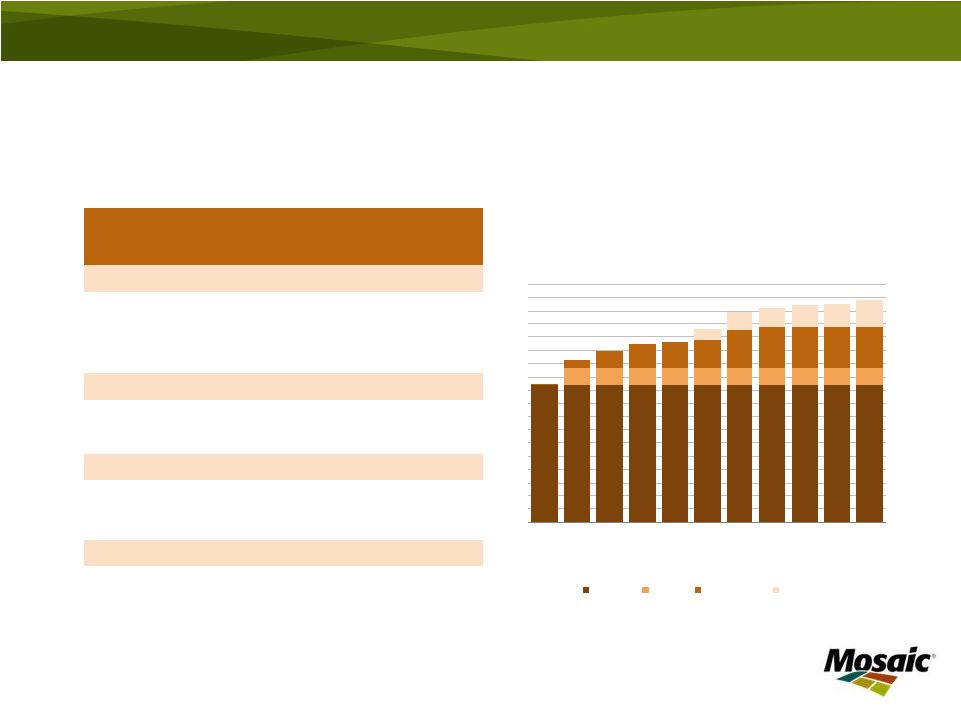
A Leading Global Potash Producer
6
World capacity
approximates 74 million
tonnes
(all potash
products)
Mosaic FY10 MOP
production share
–
12% Global
–
38% North America
World scale & efficient
operations
Brownfield expansions
underway, projected to
add 5.1 million tonnes
capacity
Peaking capacity for PotashCorp, Mosaic and K+S
Source: Fertecon, Mosaic |
| First, let’s talk about potash.
Mosaic is one
of
the
world’s
top
producers
of
potash
with
an
estimated
12%
of
global
market
share.
Potash
is
produced in only 12 countries in the world, and agricultural giants such as China, India and Brazil
depend on imports. |
 Potash –
Grow Volume
Projected additional annual capacity of 5.1
million tonnes
Multiple projects spanning a decade
Reversion of 1.3 million tonnes
currently
produced for a third party under a tolling
agreement expected soon
7 |
| The world will need substantially more potash this decade. In the long-term, we forecast
demand growth of 3.5 –
4% per year.
We believe
the
best
way
to
meet
long
term
demand
growth
is
through
brownfield
expansions
at
existing
mine
sites. Our ongoing expansions in Canada are expected to increase annual capacity by over five
million tonnes by 2020, ensuring that we will maintain our position as one of the premier
potash companies in the world. In addition,
we
have
allocated
up
to
1.3
million
tonnes
of
annual
peaking
capacity
for
Potash
Corp
under
a
tolling agreement. As many of you know the expiration date for this agreement is the subject of
a dispute currently
pending
before
the
Saskatchewan
courts.
Assuming
we
continue
to
deliver
tonnes
at
the
same
rate
as today, we believe that our obligation to provide tonnes to Potash Corp ends next summer, at which
time these tonnes revert to us. |
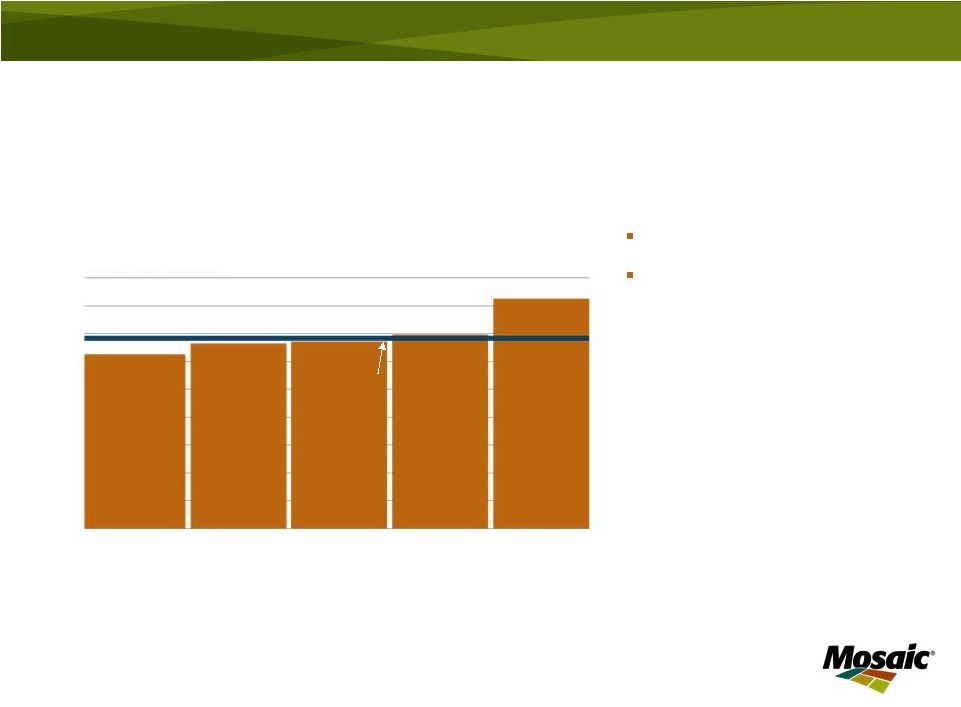
 Potash Capacity Expansions
8
PROJECTED CAPACITY
MILLION TONNES
0
2
4
6
8
10
12
14
16
18
2011
2013
2015
2017
2019
2021
FISCAL YEAR
Existing
Tolling
In progress
Future
INVESTMENT
($ IN BILLIONS)
CAPACITY
(MILLION TONNES)
ESTIMATED
CONSTRUCTION
COMPLETION
(FISCAL YEAR)
IN PROCESS
Belle Plaine
0.5
0.6
2012
Colonsay
0.7
0.7
2014
Esterhazy
2.0
1.8
2011-17
FUTURE
Belle Plaine
1.4
2016-19
Colonsay
0.6
2016
5.1
Tolling agreement
1.3
Capacity at May 31, 2010
10.4
16.8 |
| Our expansion program consists of nearly a dozen separate, multi-year
projects at our three Canadian mines. We have made good progress on a number
of these projects and we can adjust the pace of these projects in response
to supply/demand dynamics.
We expect this additional capacity to begin coming on-line over the next few
years. Within a decade, we expect our capacity to reach almost 17
million tonnes of finished product. |
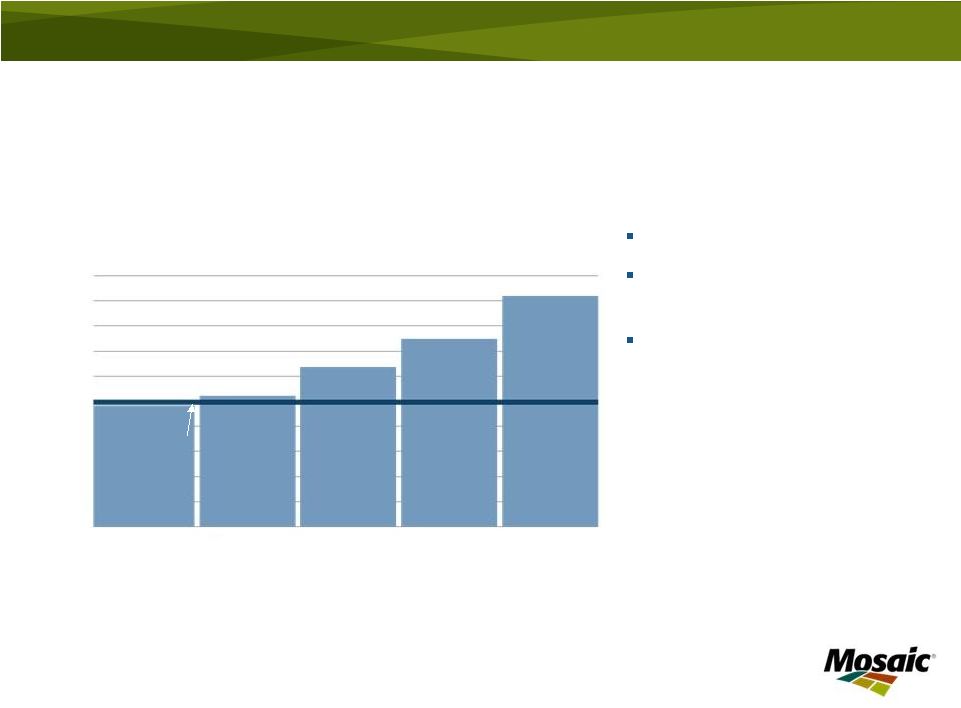
 Competitive Cost
Structure 9
Flat cost curve
Expansions to decrease
our per unit costs
MOP
Delivered
US
Cornbelt
weighted
average
cost
as
of
June
30,
2009,
excludes
Canadian resource taxes and royalties for all Canadian potash producers
Source: Mosaic
MOP PRODUCTION COST CURVE
COST PER TONNE
60
MILLION TONNES MOP
Mosaic
average |
| The global potash industry has a relatively flat cost curve. This
chart shows estimated cost per tonne for all
major potash producers. Mosaic’s potash cost structure is competitive and
will improve as our expansions come on line. The expected increase in sales
and production volumes will leverage the existing assets at our three
Canadian mines – thereby driving lower per tonne
costs.
Our industry leadership, together with our investments to expand
capacity, places us in a strong competitive
position to leverage the growth of this market. |
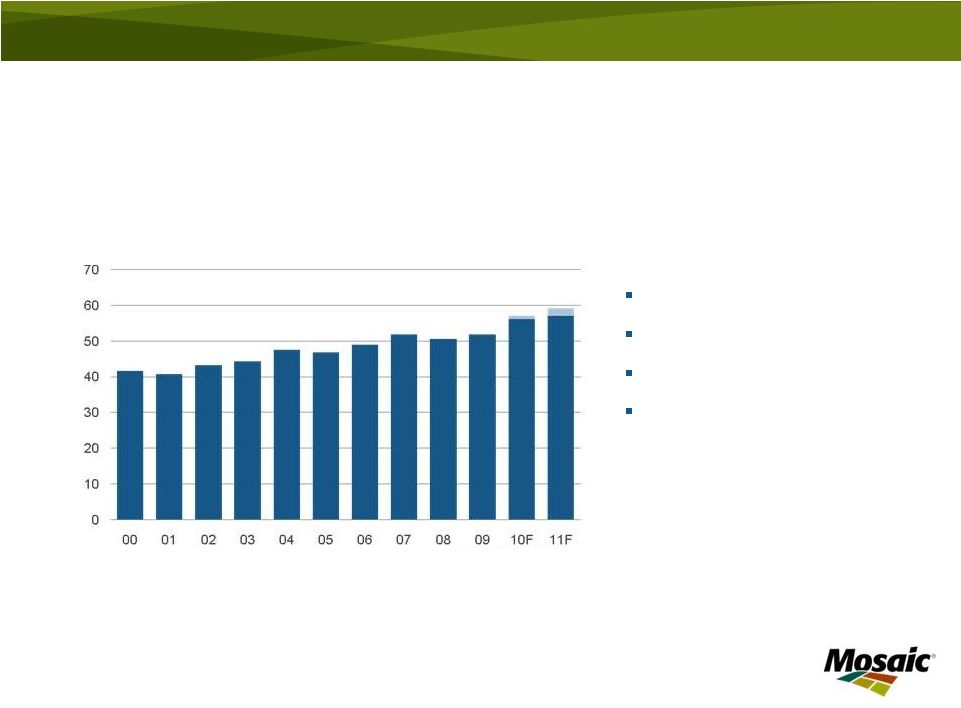
 Rebounding Potash Demand
Positive potash market
fundamentals:
Two step recovery underway
Lean inventories
Healthy farmer economics
Expect 2011 global
shipments of 52 to 55 million
tonnes
10
Source: Fertecon
and Mosaic
WORLD MOP DEMAND
MILLION TONNES
0
10
20
30
40
50
60
00
01
02
03
04
05
06
07
08
09
10F
11F
CALENDAR YEAR |
| Turning
to
demand,
market
sentiment
has
finally
caught
up
to
the
fundamentals.
After
a
significant
drop
in
demand during 2009, the potash market is in the midst of a two step recovery.
We project global MOP shipments to rebound sharply this year and then take
another giant step up in 2011. Producers are running hard to keep up
with heavy demand. Potash prices have been firming. As of last week,
prevailing MOP prices were $510 to $515 Midwest warehouse, up from about
$400 last summer and export potash prices are increasing and narrowing the gap
with domestic prices.
The strong North American fall season was a catalyst for potash demand. The
recent signing of Canpotex agreements with our Chinese, Indian and other
Asian customers is a signal that demand is back on track.
Lean inventories, solid crop prices and healthy farmer economics
all point to a great future for potash. We are
very upbeat about the positive fundamentals driving the potash business.
We are not the only ones bullish on potash. M&A and consolidation
activity has been front and center these past few months. These
developments show that others agree this is a great business with a solid
future. |
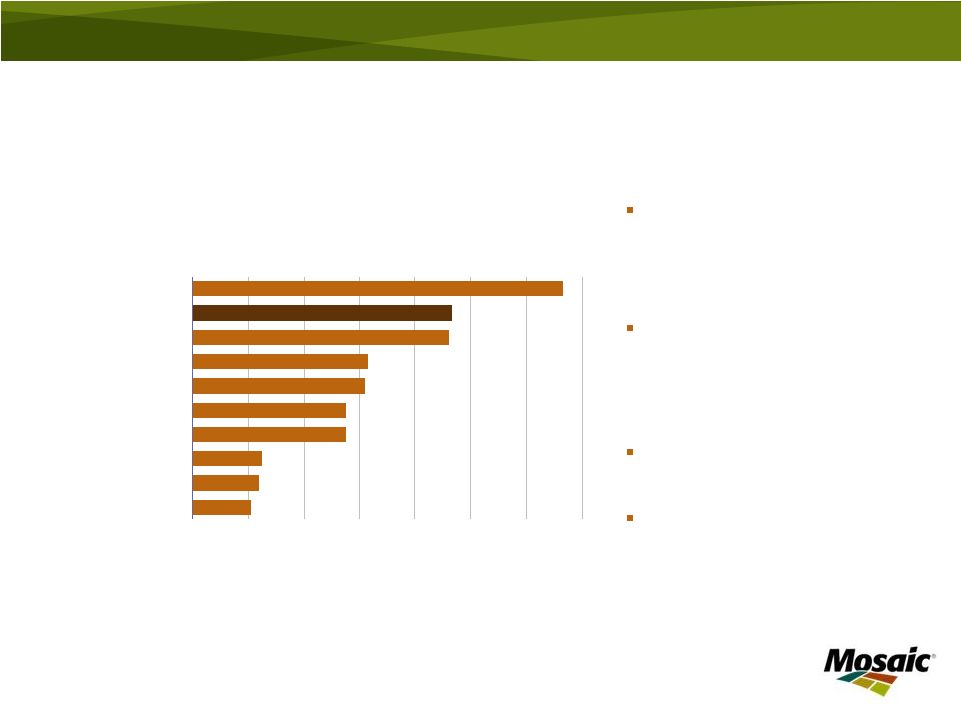
 FINISHED PHOSPHATE CAPACITY
MILLION TONNES
0
2
4
6
8
10
Mosaic
YTH
OCP
Kailin
IFFCO
PhosAgro
Wengfu
GCT
Eurochem
Vale
Crop Nutrients
Feed
World’s Largest Phosphate Producer
11
World capacity
approximates 80 million
tonnes
(DAP/MAP/TSP)
Mosaic FY10 phosphate
production share
–
13% Global
–
56% North America
World scale & efficient
operations
Source: company reports, Mosaic |
| Now, let’s move to phosphate.
Mosaic produces more phosphate crop nutrient and animal feed products than any other company in the
world by a wide margin. We rank among the lowest cost producers in the industry today due
to: •The tight vertical integration of our phosphate rock mining and processing
operations; •The large scale of our mines and chemical plants;
•The
important
location
advantages
we
have
from
being
situated
on
the
Gulf
of
Mexico
and
the
Mississippi
River;
•And, our international distribution business. |
 Phosphates –
Grow
Value
Leverage scale and location
–
Low cost producer
–
Cost advantaged sulfur, competitive ammonia
–
Procurement leverage
Operational excellence
–
Maintenance practices
–
Capital deployment
–
Energy use and co-generation capacity
–
Improve coordination of sales and operations
planning
Extend phosphate reserves
12 |
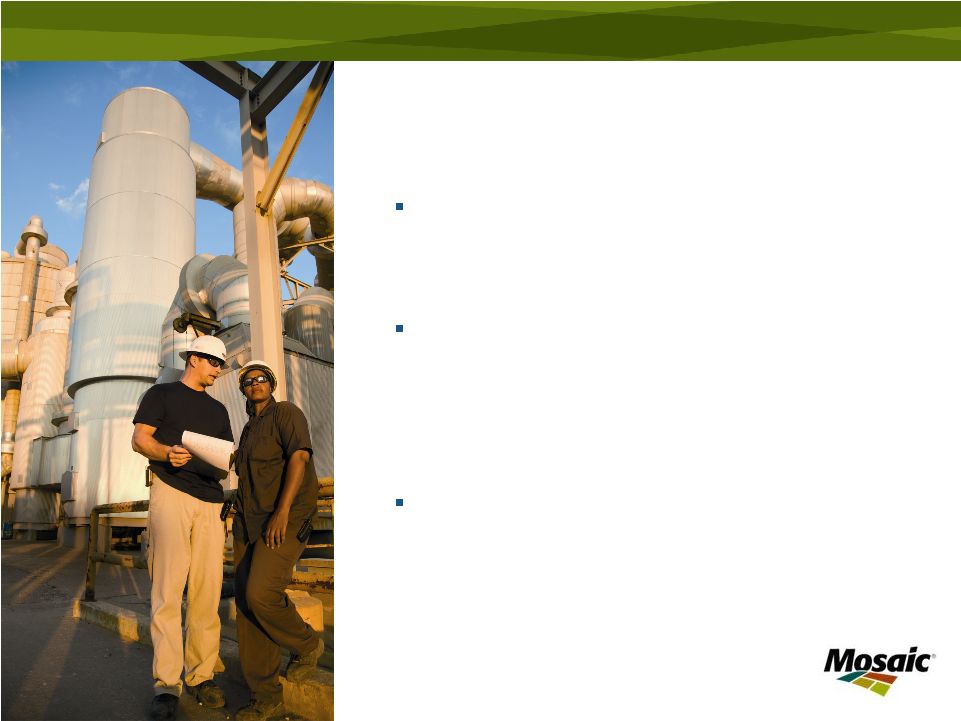
| In order to strengthen our competitive advantage, we are focusing on
three strategic priorities for our Phosphates business:
First, we are working on several initiatives to leverage our scale and
geographic location. We have a strong competitive position due to
low rock and conversion costs as well as preferential geographic access to sulfur
and ammonia. We are also working to better leverage our procurement
processes. Next, we are focused on operational efficiency. We are
implementing improved processes for maintenance, capital deployment,
energy use and co-generation capacity. In addition, our global sales and operations teams
are working closely together to optimize production planning in
order to reduce operating costs.
Finally, we continue work to secure the mineral resource base for our U.S.
operations and to obtain advantaged access to rock reserves elsewhere in the
world. We have started receiving rock from our Miski
Mayo joint
venture. In addition, as many of you know, a permit needed to continue
operations at our South Fort Meade mine is the subject of a lawsuit.
We recently entered into a partial settlement of the ongoing litigation that will
allow us to temporarily restart operations there for about four months. The
process for the South Fort Meade permit was robust and we believe it is not
a matter of if we receive the permit, but rather a matter of when. |
 Low Cost
Producer 13
Low cost producer
Significant economies of
scale
Focus on operational
excellence
Mosaic
average
DAP FOB plant/port weighted average cost as of July 31, 2010
Source: Mosaic
DAP PRODUCTION COST CURVE
COST PER TONNE
20
MILLION TONNES DAP |
| But it’s not just about being the largest. The size and scale
of our phosphate business produces significant cost efficiencies.
We have one of the lowest cost positions in the phosphate industry and we
plan to maintain this position with our continued focus on operational
excellence. |
 Record Phosphate
Demand Positive phosphate market
fundamentals:
Strong demand
Lean inventories
Healthy farmer economics
Expect 2011 global
shipments of 57 to 59 million
tonnes
14
Source: Fertecon
and Mosaic
WORLD PROCESSED PHOSPHATE DEMAND
MILLION TONNES
CALENDAR YEAR |
| Phosphate fundamentals are constructive and we expect the phosphate
market to remain snug for several years. We expect strong demand
coupled with supply uncertainties to keep this market tight during the remainder of this
fertilizer year.
Large shipments to both domestic and offshore destinations have tightened the global
phosphate market. Producer stocks remain at low levels and grain
prices have been supportive. We
forecast
processed
phosphate
demand
will
grow
to
a
record
57
to
59
million
tonnes
in
2011.
Since
last
summer,
prices
have
rebounded
to
the
upper
$500
range
FOB
Tampa
and
dealers
will
soon
position
product for the North American spring season.
In addition to strong demand, several supply uncertainties are exacerbating the
situation. Questions about the Ma’aden
startup
in
Saudi
Arabia,
shut
down
of
Agriphos
and
Fertiberia
phosphate
operations,
raw
material
uncertainty, changes in China’s export duties and permit litigation at our own
South Fort Meade mine have all contributed to the tight market
conditions. |
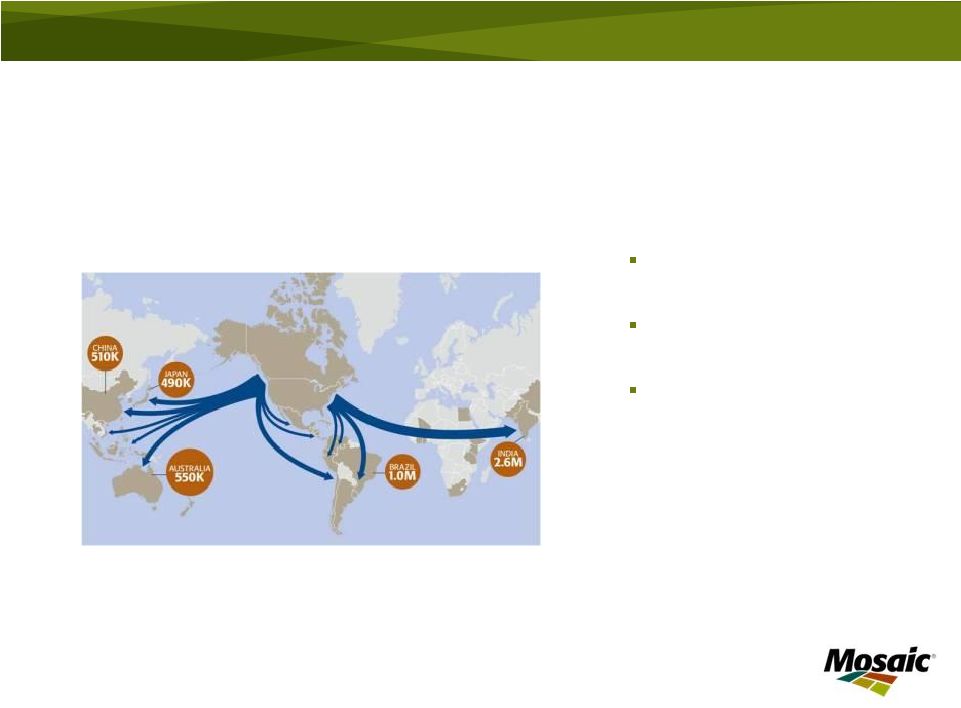 A
Global Distribution Network Mosaic personnel located
in key global markets
Visibility to the entire
value chain
Our distribution capability
helps balance seasonal
demand
TRADE FLOW MAP
VOLUME IN TONNES*
* Three year average, all products. Includes estimated Mosaic share
of Canpotex
sales
15 |
| Mosaic also has a distribution network without peer in our industry
– allowing us to move our products where
and when needed, efficiently and cost-effectively.
Our industry leading North American distribution capabilities are bolstered by
strong networks in prime Asian and Latin American growth regions where we
combine production assets, blending and bagging facilities, ports and other
capabilities. This global network is especially valuable in balancing
seasonal demand patterns. It allows us to run our North
American production plants more efficiently as we can ship products to key regions
around the world as needed. |
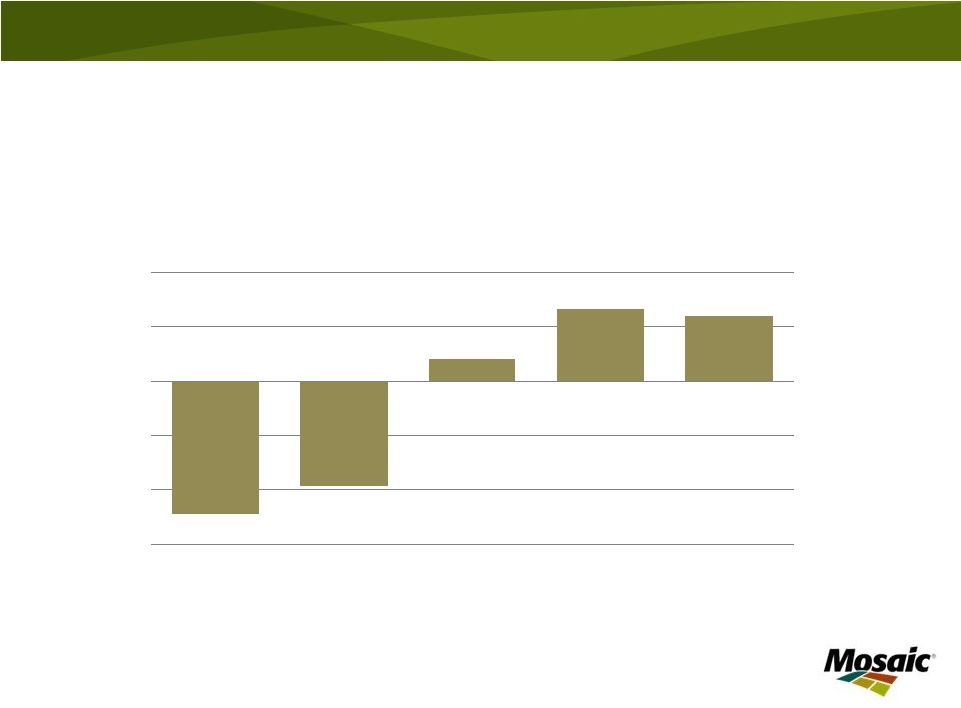 Solid Financial Position
16
*
See appendix for reconciliation of Cash and Cash Equivalents less Debt
TOTAL CASH AND CASH EQUIVALENTS LESS DEBT*
$ IN BILLIONS
(3)
(2)
(1)
-
1
2
2006
2007
2008
2009
2010
FISCAL YEAR |
| As we have noted, our overall strategy is to capitalize on attractive
long-term agriculture fundamentals by investing in and reengineering our
potash and phosphate businesses. Through the ups and downs of the
markets we serve, we have created long-term value through sound capital
allocation decisions. Our strong cash flow has allowed us to build one of the
strongest balance sheets in the industry despite the economic
downturn. We have demonstrated our willingness and ability to make
investments, to divest non-strategic assets and to return cash to shareholders,
as appropriate. Our cash allocation priorities include investing in our
business, maintaining a large liquidity buffer, funding strategic
opportunities and distributing cash to shareholders. |
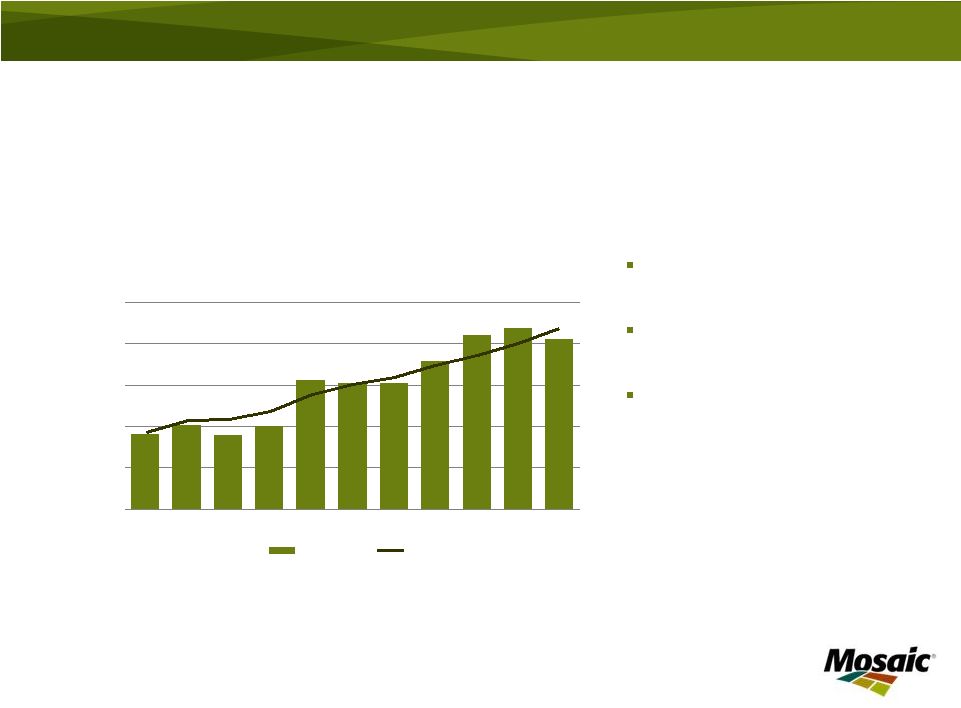 Market Outlook
17
Disappointing global
harvests
Strong agricultural
commodity prices
Need to re-stock crop
nutrients in the
distribution pipeline and
many farm fields
Source: USDA
WORLD GRAIN AND OILSEED PRODUCTION
AND USE
BILLION TONNES
1.8
2.0
2.2
2.4
2.6
2.8
00/01
02/03
04/05
06/07
08/09
10/11F
CROP YEAR
Production
Use |
| Let me finish with a few thoughts on the market outlook.
As you can see, grain and oilseed use has grown slowly, but consistently.
History has proven that economic slowdowns don’t have a large negative
impact on food consumption – people need to eat regardless of the
economic climate. The most recent global economic downturn was no
exception. On the production side, we have seen significant increases over
the past three years. This growth has come from increased harvested
land and above trend yields. However, we need to continue this above trend growth
just to stay even with projected use. |
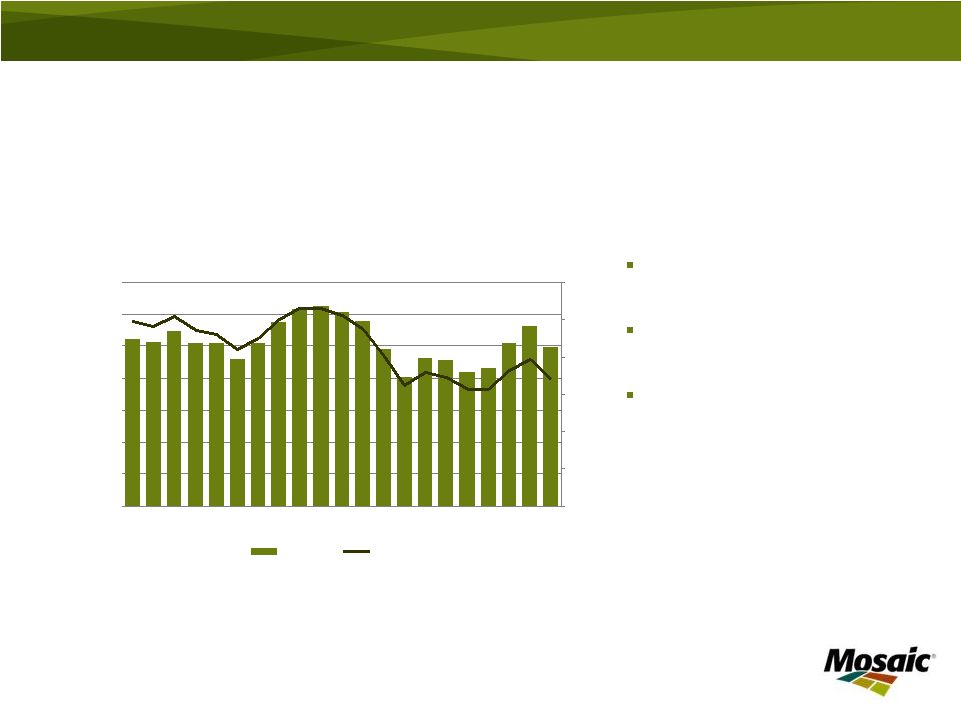 Stocks Remain at Low Levels
18
Days of use remains at
low levels
Stocks still not at secure
levels
2011 new crop prices
signaling farmers to
expand planted area and
intensify cropping
practices
Source: USDA
WORLD GRAIN AND OILSEED STOCKS
MILLION TONNES
0
100
200
300
400
500
600
700
90/91
94/95
98/99
02/03
06/07
10/11F
CROP YEAR
0
20
40
60
80
100
120
Stocks
Days of Use
DAYS OF USE |
| Dramatic improvement in production has not translated into improving
stocks. World grain and oilseed stocks continue to remain at low
levels. We believe global grain and oilseed stocks still are not at levels secure
enough to withstand weather or other shocks over a period of time.
Corn looks especially tight at only 56 days of use estimated for
the end of this crop year. That is the second
lowest ratio since the 1970s. This ratio is even lower if you exclude India
and China which hold large strategic reserves.
|
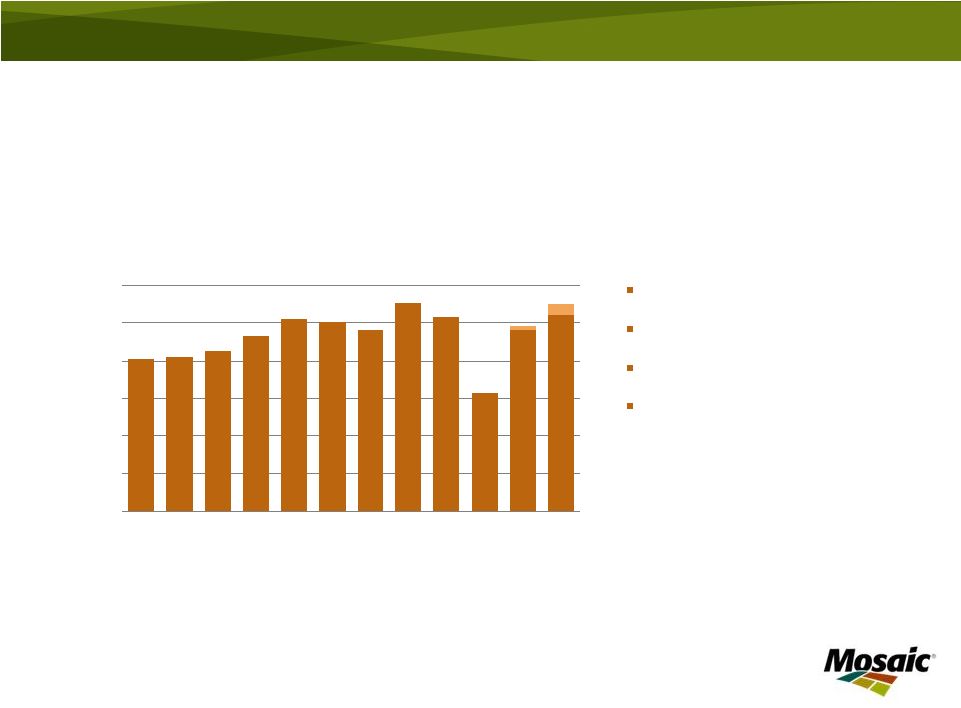
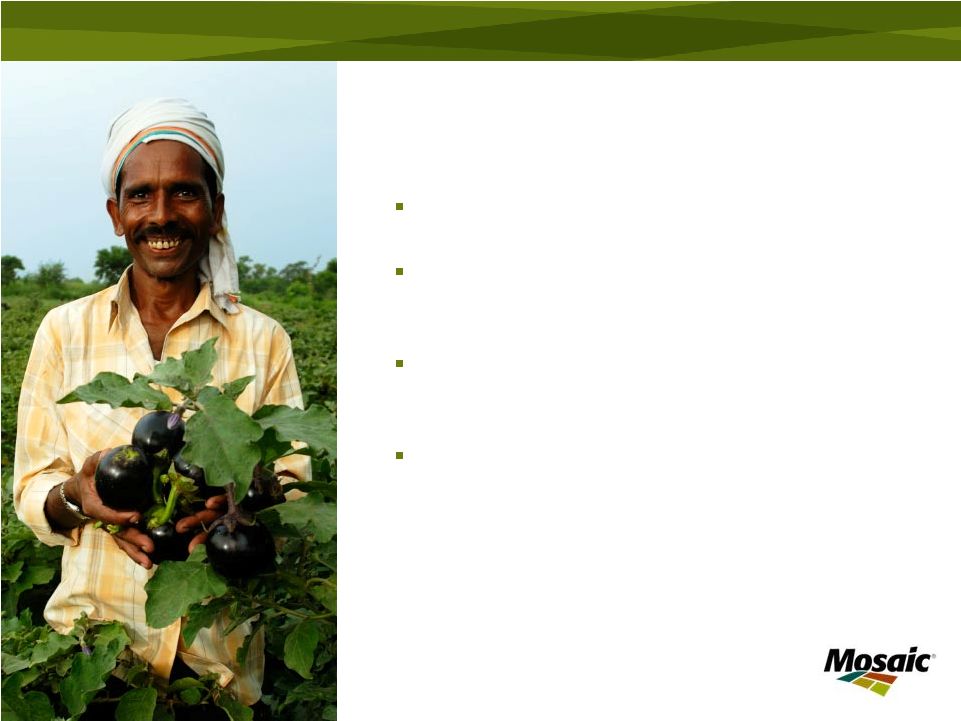
 Farmer Economics
19
Farmer profitability remains at
healthy levels:
Grain prices high relative to
historical prices
Input costs well below their
highs
Similar conditions for
cotton, rice and palm oil
China, Brazil and India farm
economics
at, or near,
record
levels
Source: Iowa State University
CROP NUTRIENT COST –
CORN IN IOWA
BUSHELS OF CORN PER ACRE
31
22
16
37
41
20
29
0
10
20
30
40
50
2005
2006
2007
2008
2009
2010E
2011F
CROP YEAR |
| Farm profitability remains at healthy levels.
Grain prices are at relatively high levels compared to historical prices. At
the same time, farmer input costs have fallen from their high levels of 2008
and 2009. This has allowed farmers to remain profitable. The graph shows
the number of bushels of corn that a farmer would have to sell in order to pay for crop
nutrients. This indicates that the cost of crop nutrients, relative to grain
prices, is well within historic norms. Similar conditions exist for
other crops such as wheat, soybeans, cotton, rice and palm oil. In China,
Brazil and India, farm economics are at record or near record levels due to
high domestic crop prices and, in the case of India, subsidized input
costs. |
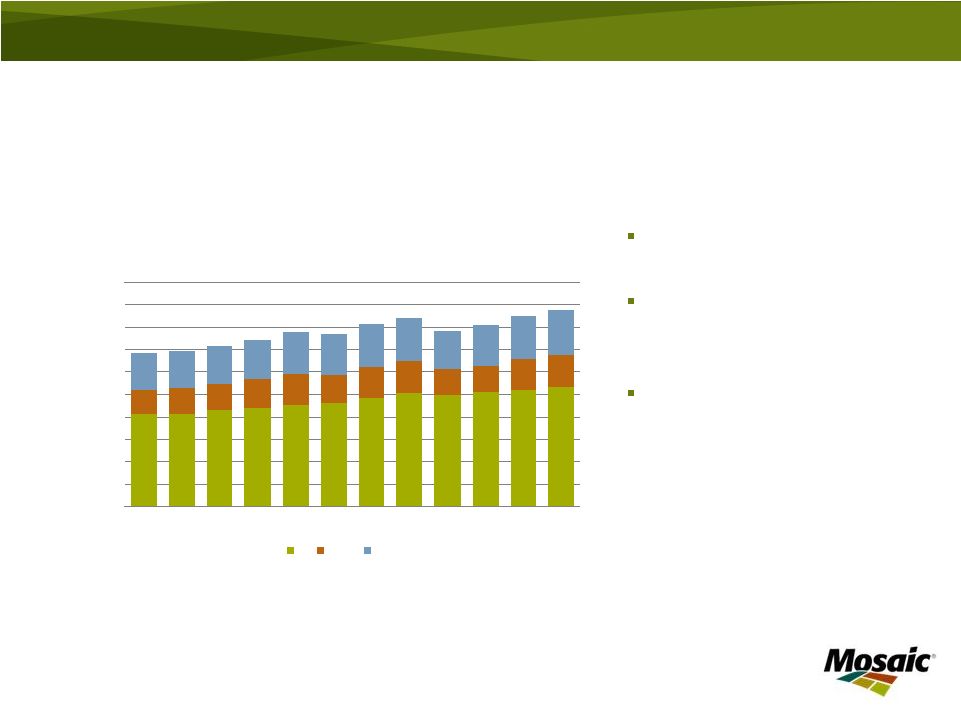 Demand is Back!
20
WORLD NUTRIENT USE
MILLION TONNES
0
20
40
60
80
100
120
140
160
180
200
00
01
02
03
04
05
06
07
08
09
10F
11F
CROP YEAR
N
K2O
P2O5
Adequate and balanced
soil fertility a high priority
Recent commodity price
rallies led to increased
nutrient demand
Projected long-term
growth rates:
–
Phosphate: 2.5% -
3.0%
–
Potash: 3.5% -
4.0%
Source: IFA June 2010 |
| Following
a
drop
in
2008
and
2009,
nutrient
use
has
significantly
rebounded
this
year.
The
science
of
agronomy
and
plant
production
has
not
changed
–
plants
need
balanced
nutrition
to
develop
properly.
Every
plant
and
crop
harvested removes vital and necessary nutrients from the soil. These nutrients must be replaced
in order to maintain productivity of the farm field. To obtain higher yields, crops will
need optimal nutrient application rates. Farmers recognize proper soil fertility is the
foundation on which high yields are built. As world demand for increased yields
stresses the food supply, adequate and balanced soil fertility will continue to be a high
priority. The disappointing global harvest this year combined with continued strong demand has
ignited powerful rallies in a wide array of agricultural commodity prices and bolstered
phosphate and potash demand prospects. Futures markets are sending strong signals to farmers to
expand planted area and intensify cropping practices next year in order for supply to keep pace
with the accelerating demand for agricultural commodities. The increasingly positive outlook
for crop nutrient demand coupled with the need to re-stock both the global distribution
pipeline as well as many farm fields underpins our forecasts for growth in P&K shipments in 2011. |
 Key Points
Potash brownfield
expansions on track to
add five million tonnes
additional capacity
Largest integrated phosphate producer –
low cost, geographic advantage and
expanding reserves
Confluence of supply and demand factors
keeping crop nutrient markets extremely
tight
Healthy farmer economics support
continued investment in crop nutrients
21 |
| Let me recap with a few key points.
First, expected potash demand growth requires that we continue to expand our
production capacity. Second, we are the largest integrated phosphate producer
in the world. We have very low production costs, we have advantage
access to raw materials through our location on the US Gulf coast, and, we are expanding
our sources of rock.
Third, a confluence of supply and demand factors will keep crop nutrient markets
extremely tight until new supply comes on-line, with the phosphate
market even tighter than potash. Finally,
crop
prices
are
providing
farmers
with
the
incentive
to
apply
optimal
amounts
of
crop
nutrient
in
order
to maximize yield.
Mosaic is well positioned in both potash and phosphate to take advantage of these
favorable market conditions. |
 Thank you |
| Thank you for your time today. Now, I will be glad to answer any
questions you may have. |
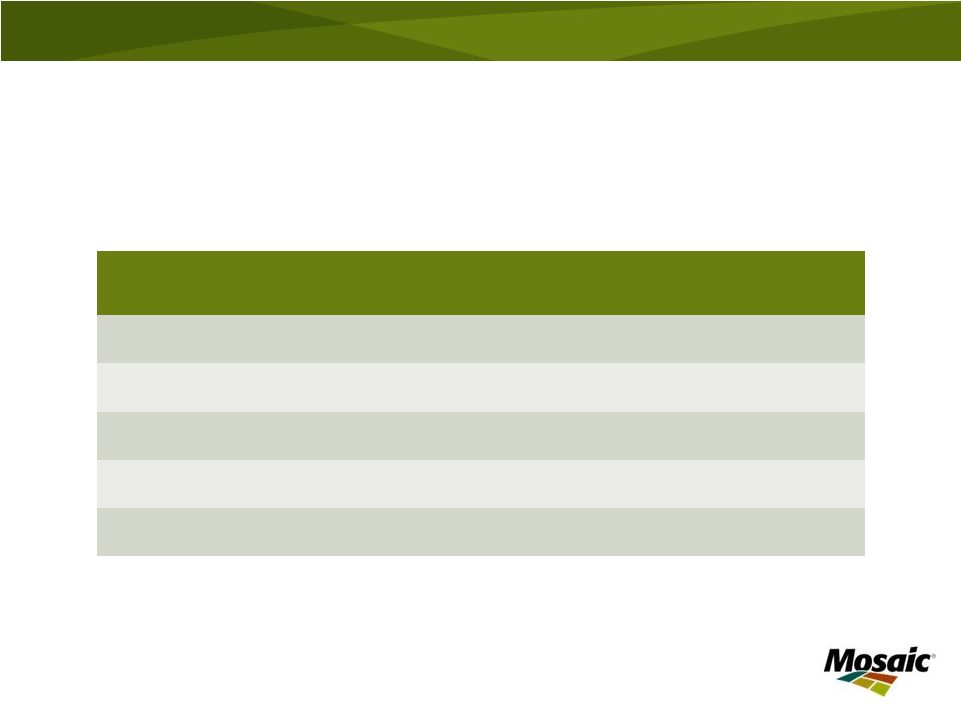 Appendix
23
Period Ended
Cash and
Cash
Equivalents
Short-Term
Debt
Current
Maturities
Long-Term
Debt
Total Debt
Net (Debt)
Cash
2006
173.3
152.8
69.3
2,388.1
2,610.2
(2,436.9)
2007
420.6
138.6
403.8
1,818.1
2,360.5
(1,939.9)
2008
1,960.7
133.1
43.3
1,375.0
1,551.4
409.3
2009
2,703.2
92.7
43.3
1,256.5
1,392.5
1,310.7
2010
2,523.0
83.1
15.2
1,245.6
1,343.9
1,179.1
Reconciliation of Cash and Cash Equivalents less Debt
Source: Cash and cash equivalents from 10Q/10K as filed. Total debt includes
Short term debt, current maturities of long-term debt, long-term
debt less current maturities and long-term debt due to Cargill Inc. and Affiliates. We believe this non-GAAP
measure provides additional information regarding the strong financial position of
the Company. |