Attached files
| file | filename |
|---|---|
| 8-K - FORM 8-K - ABRAXAS PETROLEUM CORP | axas8k113010.htm |
| EX-99.1 - NEWS RELEASE - ABRAXAS PETROLEUM CORP | newsreleas.htm |
Global Energy Conference
November 30 - December 1, 2010
4th Annual
Exhibit 99.2

2
Forward-Looking Statements
The information presented herein may contain predictions, estimates and
other forward-looking statements within the meaning of Section 27A of the
Securities Act of 1933 and Section 21E of the Securities Exchange Act of
1934. Although the Company believes that its expectations are based on
reasonable assumptions, it can give no assurance that its goals will be
achieved.
other forward-looking statements within the meaning of Section 27A of the
Securities Act of 1933 and Section 21E of the Securities Exchange Act of
1934. Although the Company believes that its expectations are based on
reasonable assumptions, it can give no assurance that its goals will be
achieved.
Important factors that could cause actual results to differ materially from
those included in the forward-looking statements include the timing and
extent of changes in commodity prices for oil and gas, the need to develop
and replace reserves, environmental risks, competition, government
regulation and the ability of the Company to meet its stated business
goals.
those included in the forward-looking statements include the timing and
extent of changes in commodity prices for oil and gas, the need to develop
and replace reserves, environmental risks, competition, government
regulation and the ability of the Company to meet its stated business
goals.
3
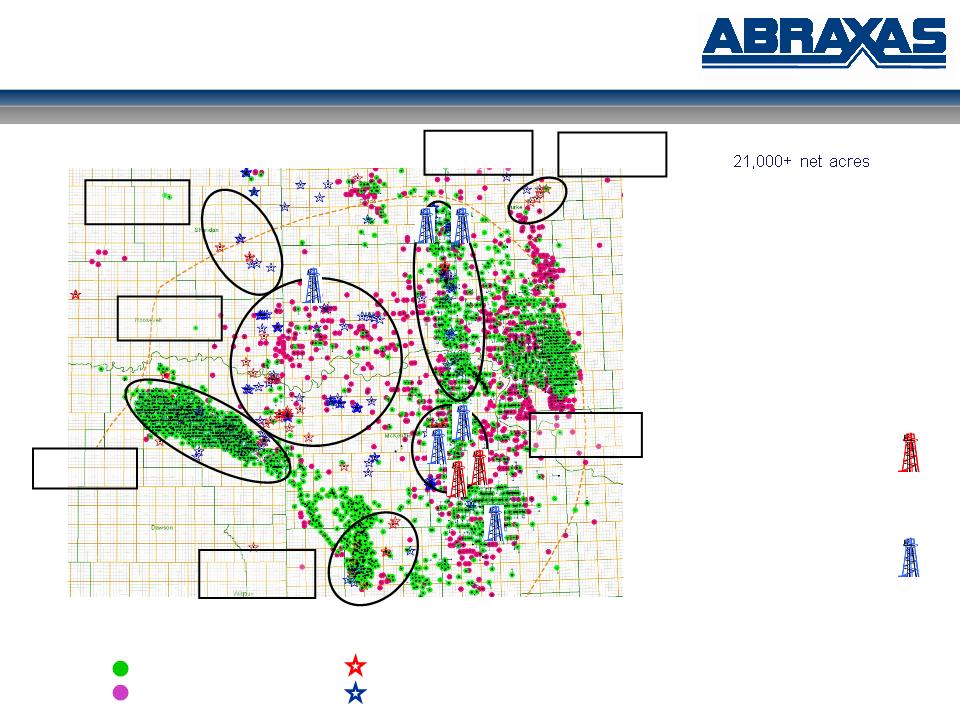
Bakken producers Abraxas operated wells
Bakken permits Abraxas non-operated wells
Bakken (AXAS)
= ~100 gross (1280 acre) units
Numerous opportunities
(operated and non-operated)
NO LEASE EXPIRATIONS -
acreage principally held by
production
acreage principally held by
production
1ST OP WELL: producing
2nd OP WELL: drilling
NON-OP: 11 WELLS
11 gross (0.4 net) wells
Montana North Dakota
Nesson
2,600 net acres
Elm Coulee
440 net acres
Elkhorn Ranch
2,000 net acres
Harding
5,800 net acres
Carter
3,200 net acres
Sheridan
3,000 net acres
1
North Fork
3,200 net acres
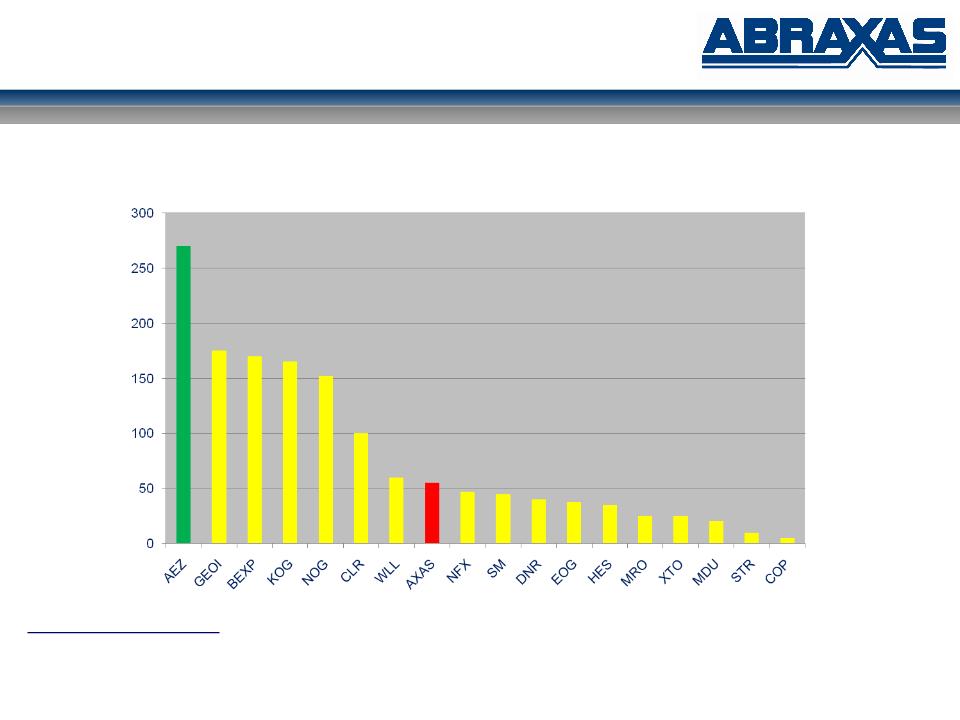
4
Bakken - Net Acres per EV
Source: Pritchard Capital estimates
Net Bakken Acres per $1 Million of Enterprise Value
5
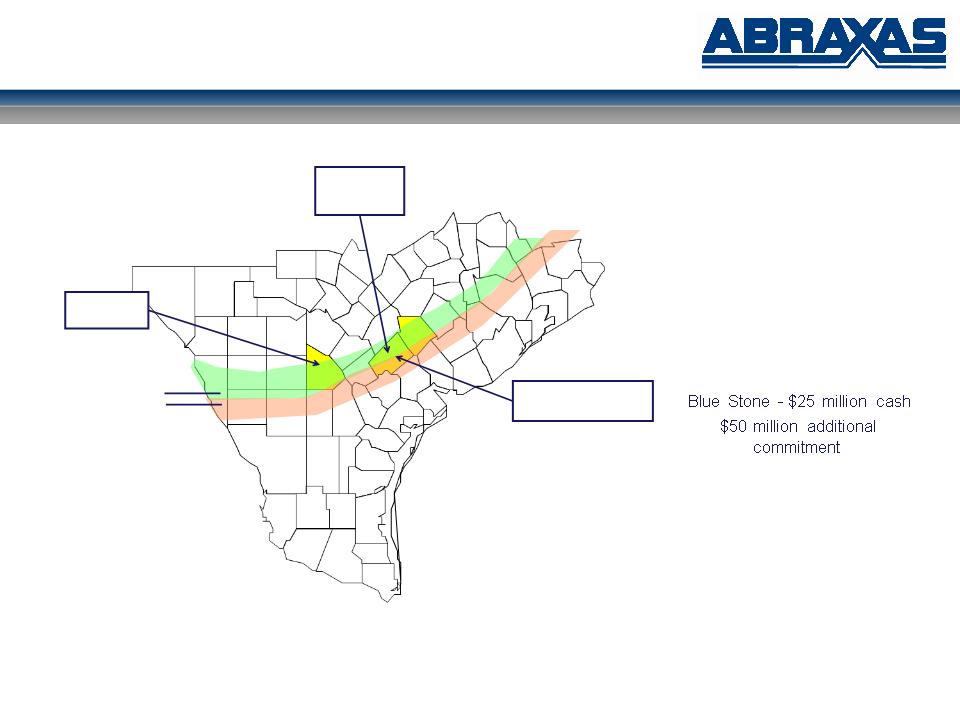
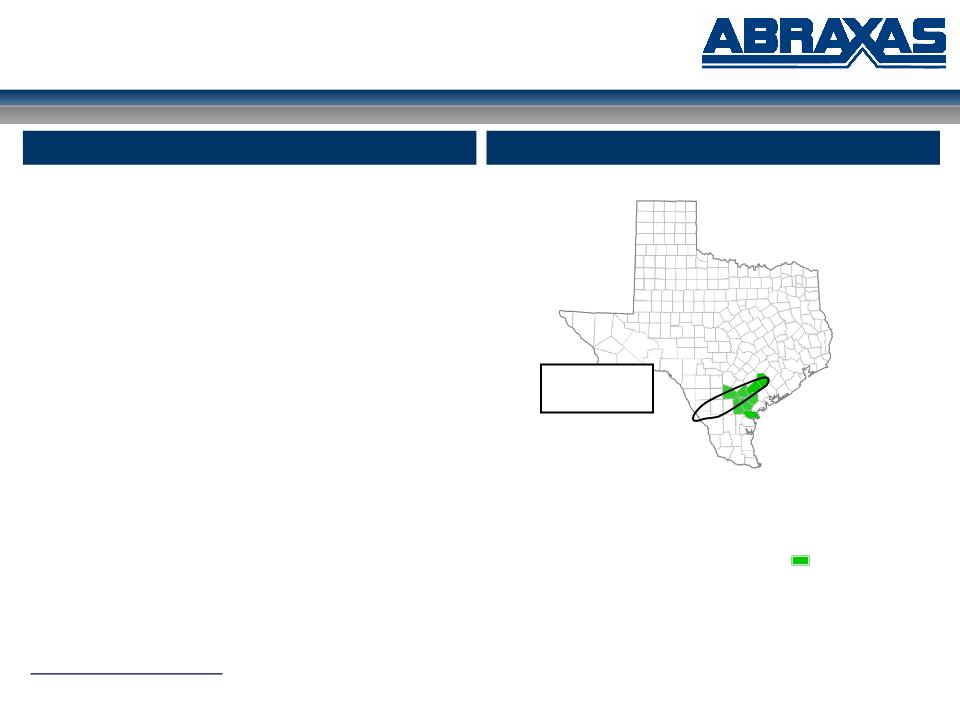
Eagle Ford Shale
Blue Eagle JV: August 18,
2010
2010
AXAS - 8,333 net acres
$25 million
equity investment in JV
43% oil window
35% gas/condensate window
22% gas window
Acquire acreage
Shoot 3-D seismic
Drill ~10 wells
Closing: AXAS 50%
Fully funded: AXAS 25%
1st well: T Bird 1H - drilling
horizontal
horizontal
2nd well: Grass Farms 1H
South Texas
gas window
oil window
T-Bird 1H
DeWitt County
PXD /
Enduring
EOG
gas/condensate
window
6
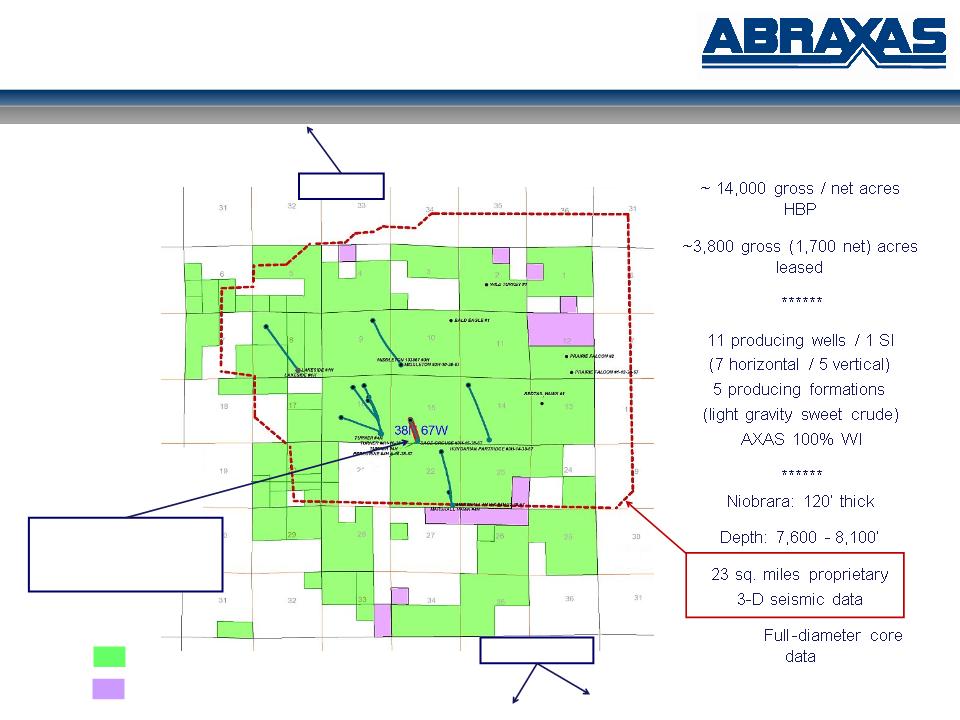
Niobrara Shale
AXAS:
Converse / Niobrara
Counties, Wyoming
Counties, Wyoming
Sage Grouse 3H
Niobrara Producer
CUM Oil: 25 MBO
EUR: 50 MBO
HBP
Expires 2012+
EOG
CHK / EOG
7
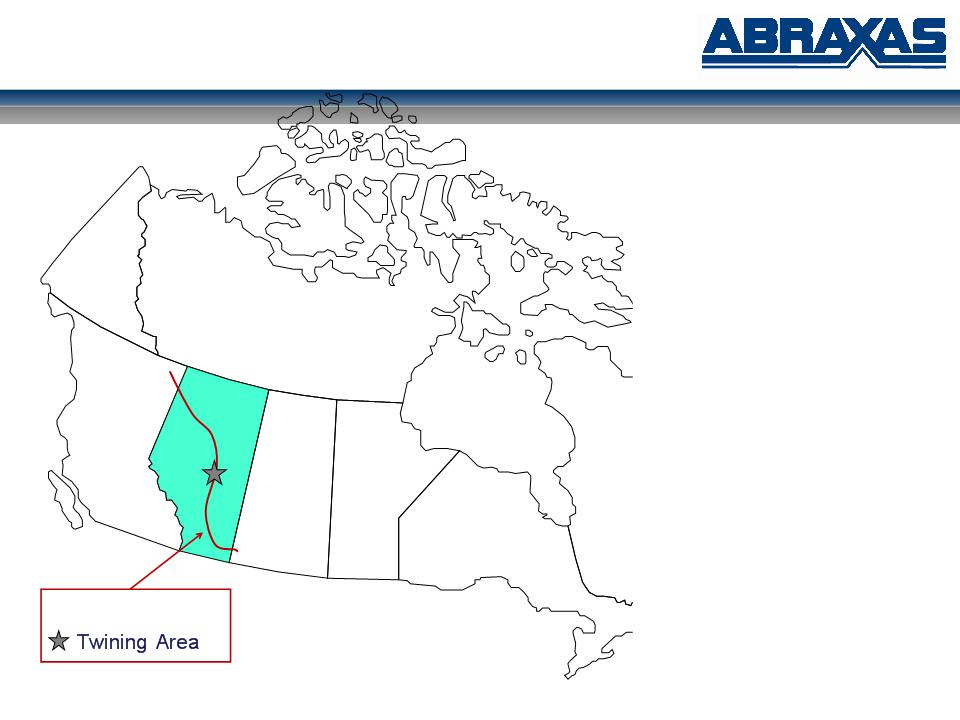
Canada - Pekisko
CANAXAS
******
Alberta - Pekisko fairway
******
Horizontal development of
conventional vertical fields
******
Drill 2 wells to earn
6,400 gross / net acres
CANAXAS 100% WI
1st - producing
2nd - producing
******
Vertical depth: 5,400’
Target lateral length:
4,000’
4,000’
Medium gravity crude
Pekisko Fairway
8
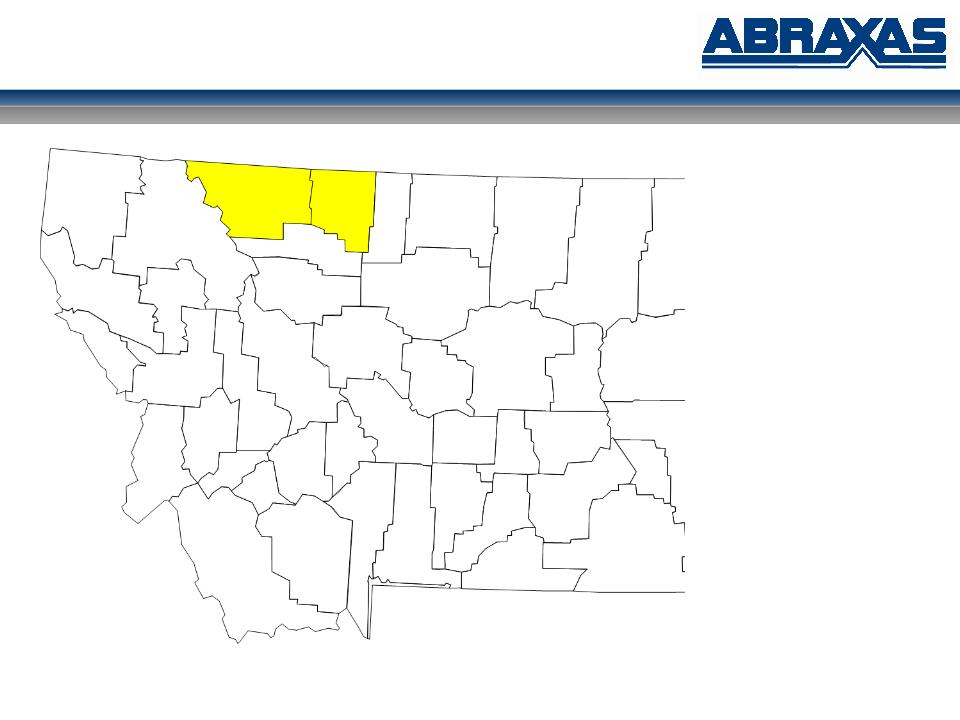
Southern Alberta Basin - Bakken
Toole & Glacier
Counties, MT
Counties, MT
****
> 10,000 net
acres leased
acres leased
Continue leasing:
geologically
specific areas
geologically
specific areas
9
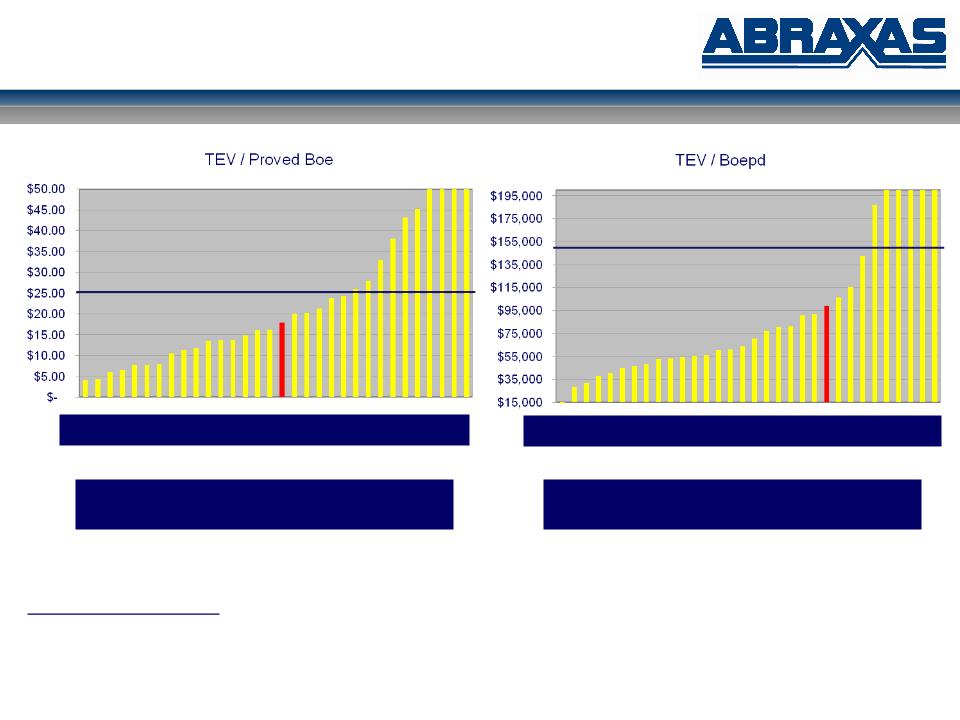
Peer Group Analysis
Source: Company filings with the SEC and market capitalization on November 19, 2010
E&P analysis includes market capitalization < $1B (AEZ, AREX, ATPG, AXAS, CFW, CPE, CRZO, CWEI, DBLE, DNE, DPTR, EPM, FXEN, GDP, GEOI, GMET, GMXR, GPOR, GPR,
GST, GSX, KOG, MCF, MHR, NGAS, NOG, PETD, PHX, PINN, PQ, RAME, REXX, SGY, VQ, WRES)
GST, GSX, KOG, MCF, MHR, NGAS, NOG, PETD, PHX, PINN, PQ, RAME, REXX, SGY, VQ, WRES)
Mean equates to an AXAS share price of:
$5.97
Mean equates to an AXAS share price of:
$6.88
25% undervalued compared to E&P in analysis
33% undervalued compared to E&P in analysis
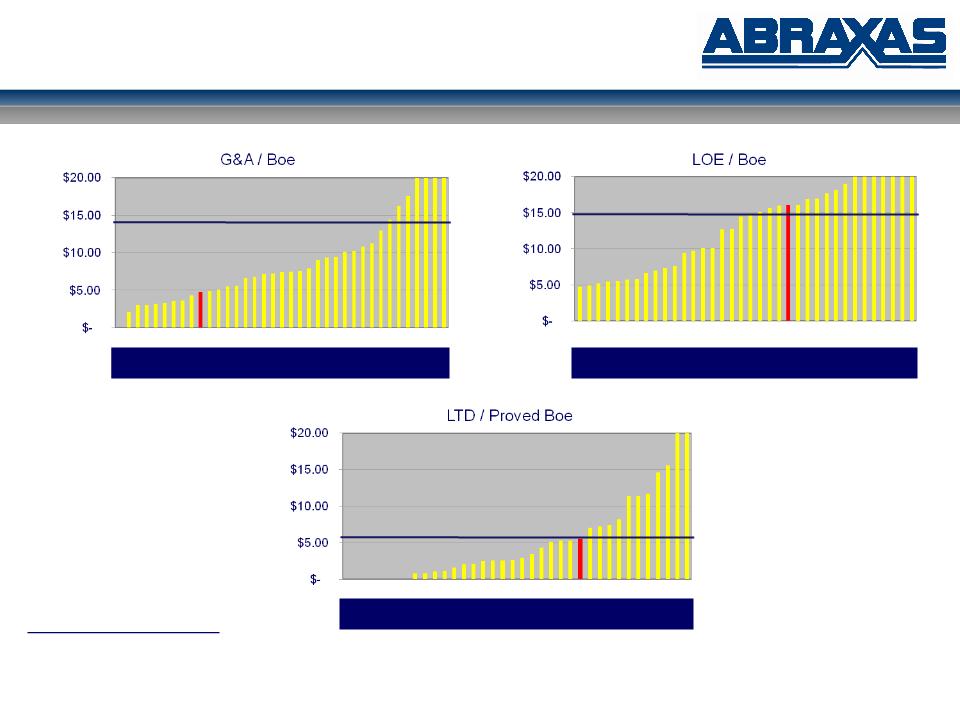
10
Peer Group Analysis
Source: Company filings with the SEC
E&P analysis includes market capitalization < $1B (AEZ, AREX, ATPG, AXAS, CFW, CPE, CRZO, CWEI, DBLE, DNE, DPTR, END, EPM, FXEN, GDP, GEOI, GMET, GMXR, GPOR,
GPR, GST, GSX, KOG, MCF, MHR, NGAS, NOG, PETD, PHX, PINN, PQ, RAME, REXX, SGY, VQ, WRES)
GPR, GST, GSX, KOG, MCF, MHR, NGAS, NOG, PETD, PHX, PINN, PQ, RAME, REXX, SGY, VQ, WRES)
67% under average of E&P in analysis
8% over average of E&P in analysis
In-line with average of E&P in analysis
11
Net Asset Value
Excludes identified and resource reserves in West Texas, Alberta Basin Bakken, Alberta, and South Texas (except Eagle Ford)
See details in Appendix
|
|
NAV / Share
|
|
Proved Reserves Only
|
$ 3.31
|
|
Proved PLUS Identified Reserves in
Bakken, Eagle Ford, Niobrara |
$ 13.51
|
|
Proved PLUS Identified PLUS Resource
Reserves in Bakken, Eagle Ford, Niobrara |
$ 31.35
|
Simplistic NAV Calculation:

12
AXAS Highlights
§ NASDAQ: AXAS
§ Fully diluted shares outstanding: ~76 million
§ ~50% institutional
§ ~10% insider
§ Current average trading volume: ~515,000 shares per day
§ Market capitalization: ~$300 million
§ Total long-term debt: ~$135 million
§ High quality assets
§ Unparalleled upside opportunities
§ Significant hedge position
§ 2011 CapEx: $40 Million

13
AXAS Hedges
|
|
2H 2010
|
2011
|
2012
|
2013
|
AVE. **
|
|
OIL - weighted average price
|
73.28
|
81.33
|
70.89
|
80.79
|
75.69
|
|
% OIL PDP *
|
79%
|
84%
|
84%
|
69%
|
|
|
|
|
|
|
|
|
|
GAS - weighted average price
|
5.73
|
6.52
|
6.77
|
6.84
|
6.69
|
|
% GAS PDP *
|
77%
|
82%
|
81%
|
66%
|
|
* As of December 31, 2009
** Volume Weighted Average of 2011 - 2013
NYMEX-based fixed price swaps:
14
2011 Project List - ROR
|
Location - Target
|
WI %
|
Net
D&C
($M)
|
Net
EUR * (MBoe)
|
ROR %
|
|
West Texas - Shallow Howe (Yates)
|
100%
|
$ 0.4
|
30.3
|
>1000%
|
|
South Texas - Portilla (Frio - 7400/8100)
|
100%
|
$ 0.9
|
64.7
|
646%
|
|
South Texas - Portilla (Frio - 7400)
|
100%
|
$ 0.7
|
34.6
|
247%
|
|
West Texas - Spires Ranch (Strawn)
|
100%
|
$ 1.6
|
86.4
|
145%
|
|
Alberta, Canada - Twining (Pekisko)
|
100%
|
$ 3.0
|
124.8
|
64%
|
|
West Texas - Beulah Coleman (Multi)
|
100%
|
$ 2.1
|
112.5
|
37%
|
|
Williston Basin - Bakken/Three Forks
|
~50%
|
$ 3.8
|
175.0
|
31%
|
CapEx: $40 Million
* Utilizing a 20:1 gas to oil ratio
15
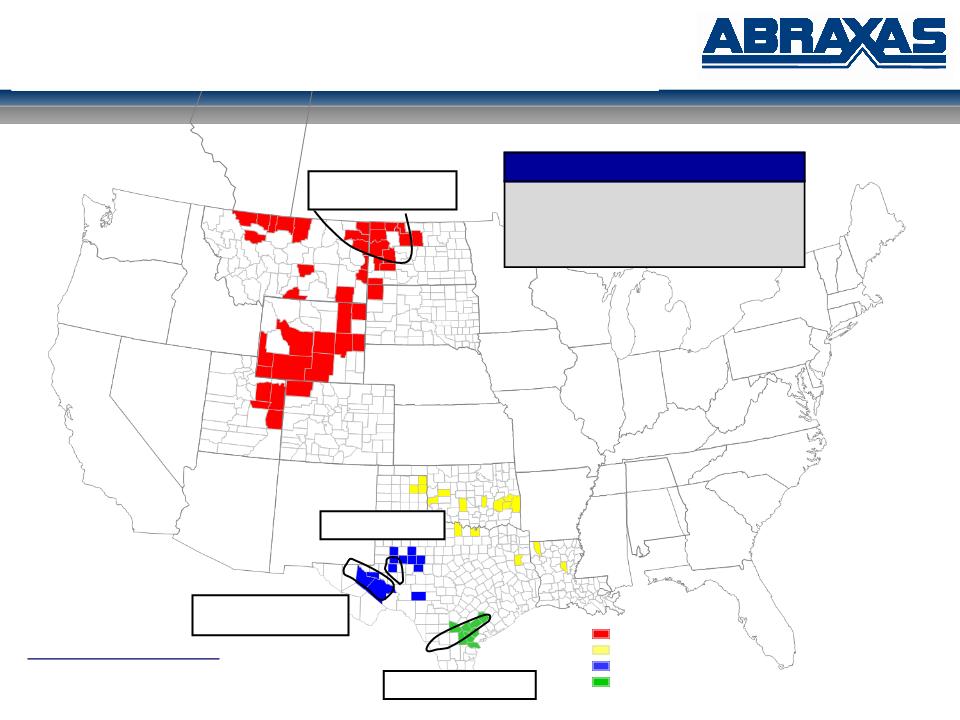
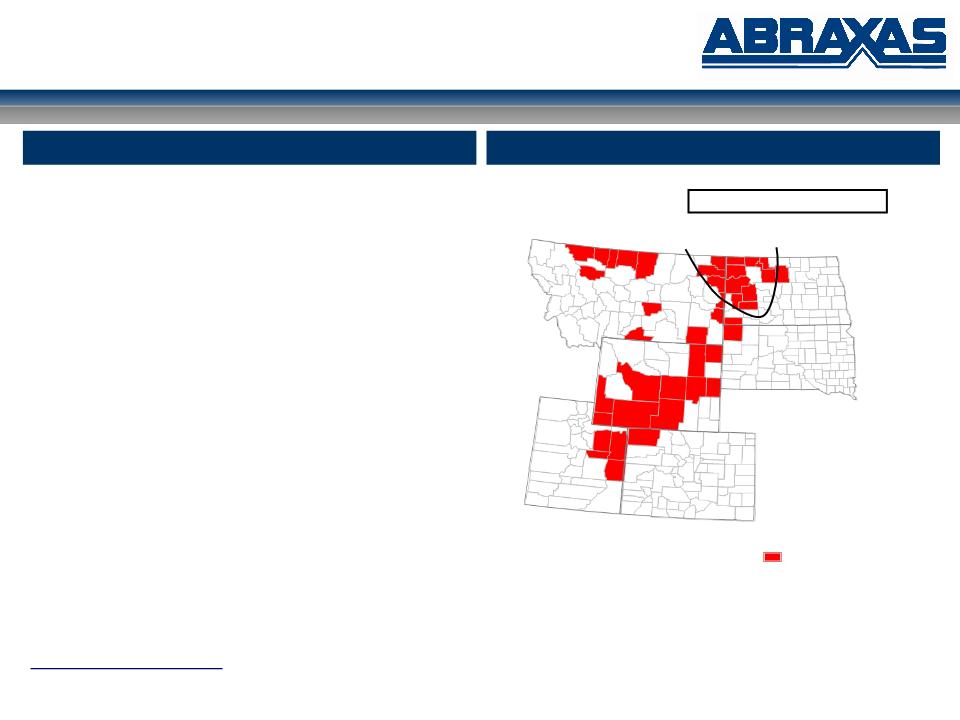
ND
SD
MT
WY
CO
UT
TX
OK
LA
Proved Reserves (MMBoe): 24.9
- Proved Developed: 56%
- Gas/Oil %: 65/35%
- Operated: 82%
Abraxas Petroleum Corporation
Net proved reserves as of December 31, 2009
Bakken / Three Forks
Play
Barnett / Woodford
Shale Play
Wolfberry Trend
Rocky Mountain
Mid-Continent
Permian Basin
Gulf Coast
Eagle Ford Shale Play
High Quality Assets
Alberta
16
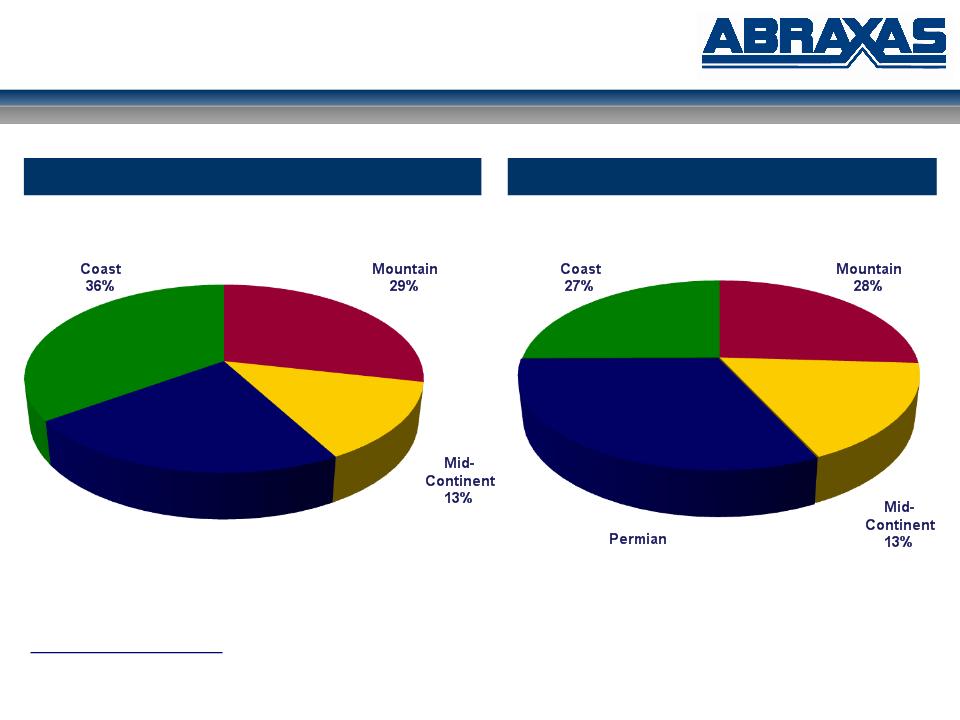
Reserve / Production Summary
Proved Reserves - 24.9 MMBoe
Production - 3,875 Boepd
Net proved reserves as of December 31, 2009
Daily net production for the quarter ended September 30, 2010
Rocky
Permian
Basin
22%
Gulf
Rocky
Basin
32%
Gulf
17
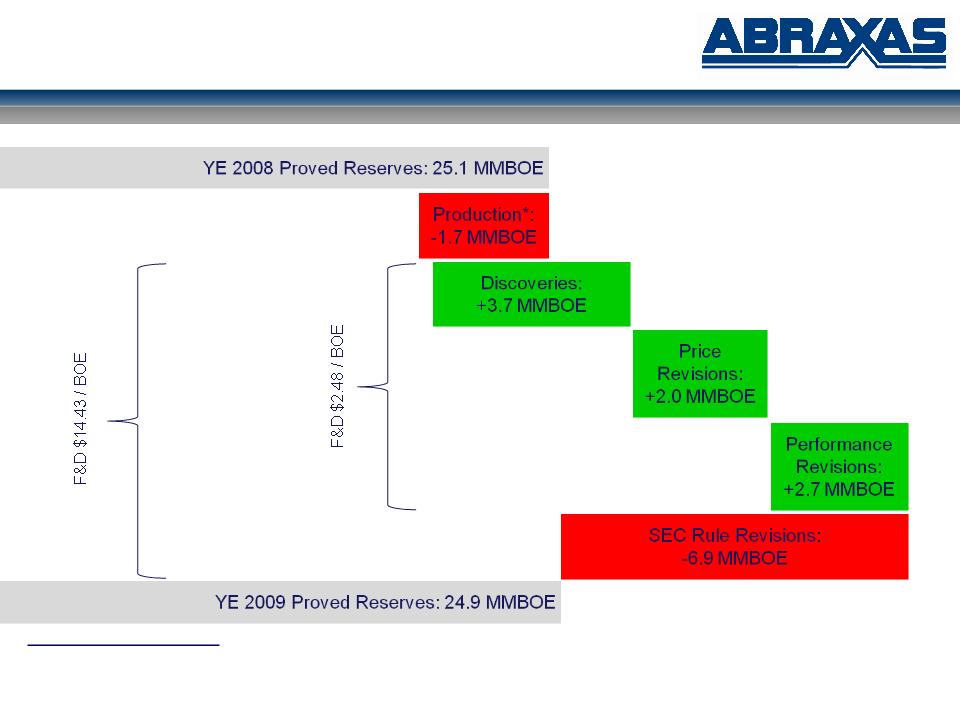
AXAS Reserves
* Includes 0.05 MMBOE of divestitures

18
Near-Term Drilling Catalysts
|
AXAS OPERATED:
|
OUTSIDE OPERATED:
|
|
Bakken/Three Forks, North Dakota
• 2 horizontal oil wells
• 1st well - producing
• 2nd well - drilling lateral
• AXAS ~60-70% WI
West Texas
• 2 oil wells
• 1st well (vertical) - w/o gas pipeline
• 2nd well (horizontal) - drilling lateral
• AXAS 100%
• 4 well oil development program (horizontal)
• 1H ’11: AXAS - 100%
|
Bakken/Three Forks, North Dakota
• Continental operated
• Drilling
• ECO-Pad ™
• 4 wells (2-Bakken, 2-TF)
• AXAS 4% WI
• Continental operated
• W/O Completion
• 1 well (Bakken)
• AXAS 1% WI
|
|
South Texas
• Eagle Ford
• 1st well (horizontal) - drilling lateral
• Blue Eagle JV 100% (AXAS 50%)
• Portilla
• 10 well infill oil development program
• 1H ’11: AXAS - 100%
|
|
|
Canada
• 2 horizontal oil wells
• 1st well - recovering fluid / producing
• 2nd well - recovering fluid / producing
• CANAXAS 100%
|
|

19
Business Plan
§ 2011 CapEx: $40 MM
§ oil development
§ Bakken - Prudence
§ Eagle Ford - Acceleration with JV
§ 2010 asset sales: ~$34 MM
§ non-core, predominately non-operated
§ pay down debt & accelerate CapEx
§ Target 50/50 oil/gas production mix
§ Target greater than 90% operated
§ NOL preservation
§ Increase investor interest
§ Increase analyst coverage
§ 4 new equity analyst since year-end ‘09

20
NASDAQ: AXAS

21
Appendix

22
(1) Abraxas estimates
(2) Carry in Blue Eagle JV
(3) 2 additional Bakken wells per 1,280 plus 3 Three Forks wells on half of 1,280’s
|
|
Net
Undeveloped Acres |
Well
Spacing / Acre |
Net
Locations |
Est. Well
Cost ($M) |
Per Well
Reserves (Net MBOE) (1)
|
Reserve
Potential (Net MBOE) |
Oil %
|
D&C Cost
($/BOE) |
|
|
Bakken
|
20,000
|
1,280
|
15.6
|
7,000
|
500
|
7,813
|
90%
|
14.00
|
|
|
Eagle Ford G/C
|
800
|
160
|
5.0
|
6,000
|
900
|
4,500
|
50%
|
—
|
(2)
|
|
Eagle Ford Oil
|
800
|
160
|
5.0
|
6,000
|
300
|
1,500
|
90%
|
—
|
(2)
|
|
Eagle Ford Gas
|
500
|
160
|
3.1
|
6,000
|
900
|
2,813
|
0%
|
6.67
|
|
|
Niobrara HBP
|
14,000
|
160
|
87.5
|
3,500
|
250
|
21,875
|
90%
|
14.00
|
|
|
Niobrara Leasehold
|
1,700
|
160
|
10.6
|
3,500
|
250
|
2,656
|
90%
|
14.00
|
|
Identified Upside (Probable?):
NAV - Appendix 1
|
|
Net
Undeveloped Acres |
Well
Spacing / Acre |
Net
Locations |
Est. Well
Cost ($M) |
Per Well
Reserves (Net MBOE) (1)
|
Reserve
Potential (Net MBOE) |
Oil %
|
D&C Cost
($/BOE) |
|
|
Bakken
|
20,000
|
(3)
|
54.6
|
7,000
|
500
|
27,300
|
90%
|
14.00
|
|
|
Eagle Ford G/C
|
800
|
80
|
5.0
|
6,000
|
900
|
4,500
|
50%
|
6.67
|
|
|
Eagle Ford Oil
|
800
|
80
|
5.0
|
6,000
|
300
|
1,500
|
90%
|
20.00
|
|
|
Eagle Ford Gas
|
500
|
80
|
3.1
|
6,000
|
900
|
2,813
|
0%
|
6.67
|
|
|
Niobrara HBP
|
14,000
|
80
|
87.5
|
3,500
|
250
|
21,875
|
90%
|
14.00
|
|
|
Niobrara Leasehold
|
1,700
|
80
|
10.6
|
3,500
|
250
|
2,656
|
90%
|
14.00
|
|
Resource Upside (Possible?):

23
NAV - Appendix 2
Excludes identified and resource reserves in West Texas, Alberta Basin Bakken, Alberta, and South Texas (except Eagle Ford)
|
Asssumptions:
|
|
|
Annual G&A Costs ($MM)
Average Reserve Life (06/10: 15.7 years)
Average D&C Costs ($/BOE) (Identified)
(Resource)
Average Lifting Costs ($/BOE)
Future Oil Price (Hedged thru 2013 ~$74)
Future Gas Price (Hedged thru 2013 ~$6.40)
Future Production Mix (2009 Gas 65% / Oil
35%) Blended BOE Price ($/BOE)
|
$7.0
10 yrs
$ 11.46
$ 13.26
$ 17.50
$ 75.00
$ 5.00
50% oil
$ 52.50
|
|
NAV Calculation:
|
Developed
|
Undeveloped
|
Total
Proved Reserves |
Identified
Reserves |
Total 2P
Reserves |
Resource
Reserves |
Total 3P
Reserves |
|
Revenue per BOE
Less: D&C Cost
Less: Lifting Cost
Operating Netback ($/BOE)
Estimated Reserves (MMBOE)
Potential Future Asset Value ($MM)
PV10 of Future Asset Value ($MM)
10 year Undiscounted G&A ($MM)
Current Bank Revolver ($MM)
|
$ 52.50
—
17.50
$ 35.00
14.70
|
$ 52.50
12.59
17.50
$ 22.41
11.50
|
$ 52.50
5.53
17.50
$ 29.47
26.20
772.22
457.86
(70.00)
(135.00)
|
$ 66.00
11.46
17.50
$ 37.04
41.16
|
$ 60.75
9.15
17.50
$ 34.10
67.36
2,296.73
1,237.23
(70.00)
(135.00)
|
$ 67.35
13.26
17.50
$ 36.59
60.64
|
$ 63.88
11.10
17.50
$ 35.28
128.00
4,515.43
2,599.85
(70.00)
(135.00)
|
|
Estimated Potential Asset Value ($MM)
|
|
|
$ 252.86
|
|
$ 1,032.23
|
|
$
2,394.85 |
|
Shares Outstanding (MM)
|
|
|
76.4
|
|
76.4
|
|
76.4
|
|
Estimated Net Asset Value per Share
|
|
|
$ 3.31
|
|
$ 13.51
|
|
$ 31.35
|
24
Rocky Mountain
Ø 7.2 MMBoe of proved reserves
Ø 63% proved developed
Ø 82% crude oil
Ø 1,063 Boepd of production
Ø 19.0 R/P ratio
Ø 900 gross (110 net) producing wells
Ø 66 PUD locations
Ø 90,362 net acres
Ø Primary producing basins include:
§ Williston Basin (MT and ND)
§ Powder River & Green River Basins (WY)
§ Unita Basin (UT)
Ø Bakken / Three Forks - HBP
Rocky Mountain
ND
SD
MT
WY
CO
UT
Bakken Play / Three Forks / Sanish
Area of Operations
Overview
Net proved reserves, well count and acreage as of December 31, 2009
Daily net production for the quarter ended September 30, 2010
25
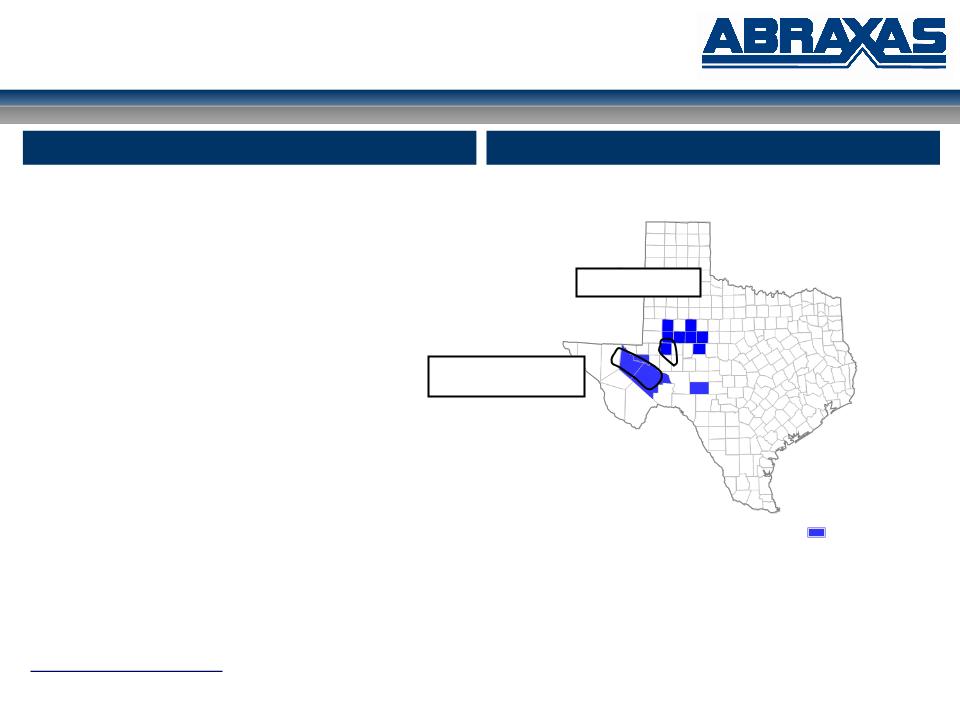
Permian Basin
Permian Basin
Ø 5.6 MMBoe of proved reserves
Ø 66% proved developed
Ø 70% natural gas
Ø 1,254 Boepd of production
Ø 11.9 R/P ratio
Ø 237 gross (158 net) producing wells
Ø 13 PUD locations
Ø 36,064 net acres
Ø Primary producing sub-basins:
§ Delaware Basin
§ Eastern Shelf
TX
Area of Operations
Overview
Barnett / Woodford
Shale Play
Wolfberry Trend
Net proved reserves, well count and acreage as of December 31, 2009
Daily net production for the quarter ended September 30, 2010
26
Gulf Coast
Gulf Coast
Ø 9.0 MMBoe of proved reserves
Ø 38% proved developed
Ø 91% natural gas
Ø 1,044 Boepd of production
Ø 24.5 R/P ratio
Ø 74 gross (48 net) producing wells
Ø 17 PUD locations
Ø 11,414 net acres
Ø Primary producing sub-basin:
§ Onshore Gulf Coast
TX
Area of Operations
Overview
Eagle Ford
Shale Play
Net proved reserves, well count and acreage as of December 31, 2009
Daily net production for the quarter ended September 30, 2010

27
NASDAQ: AXAS