Attached files
| file | filename |
|---|---|
| 8-K - USA TRUCK INC | form8k11162010.htm |
USA TRUCK

Every Load, Every Time….
Forward-Looking Statements
Forward-Looking Statements
This information and the statements made at this conference presentation may contain
forward-looking statements within the meaning of Section 27A of the Securities Act of
1933, as amended and Section 21E of the Securities Exchange Act of 1934, as amended.
These statements generally may be identified by their use of terms or phrases such as
“expects,” “estimates,” “anticipates,” “projects,” “believes,” “plans,” “intends,”
“may,” “will,” “should,” “could,” “potential,” “continue,” “future” and terms or
phrases of similar substance. Forward-looking statements are based upon the current
beliefs and expectations of our management and are inherently subject to risks and
uncertainties, some of which cannot be predicted or quantified, which could cause
future events and actual results to differ materially from those set forth in,
contemplated by, or underlying the forward-looking statements. Accordingly, actual
results may differ from those set forth in the forward-looking statements. Readers
should review and consider the factors that may affect future results and other
disclosures by the Company in its reports, Annual Report on Form 10-K and other
filings with the Securities and Exchange Commission. We disclaim any obligation to
update or revise any forward-looking statements to reflect actual results or changes in
the factors affecting the forward-looking information. In light of these risks and
uncertainties, the forward-looking events and circumstances discussed in this
conference presentation might not occur.
Operating Leverage
Operating Leverage
Revenue
per Mile
per Mile
$0.01
Operating
Margin
Margin
70 bps
Annualized
EPS
EPS
$0.15
=
=
We have a plan to improve our
Revenue per Mile
by $0.20
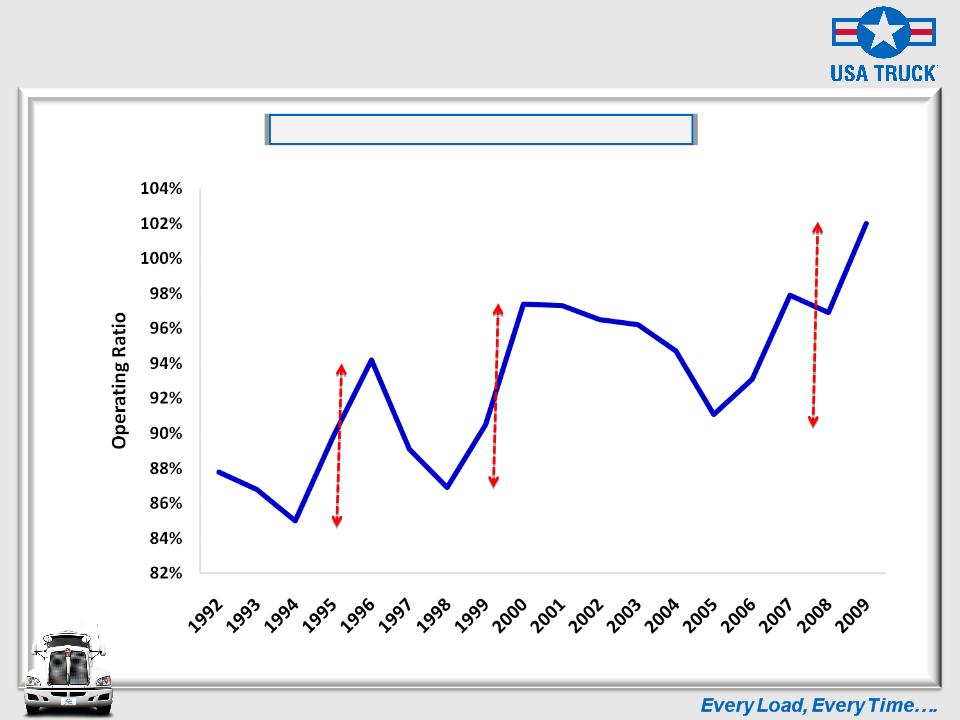
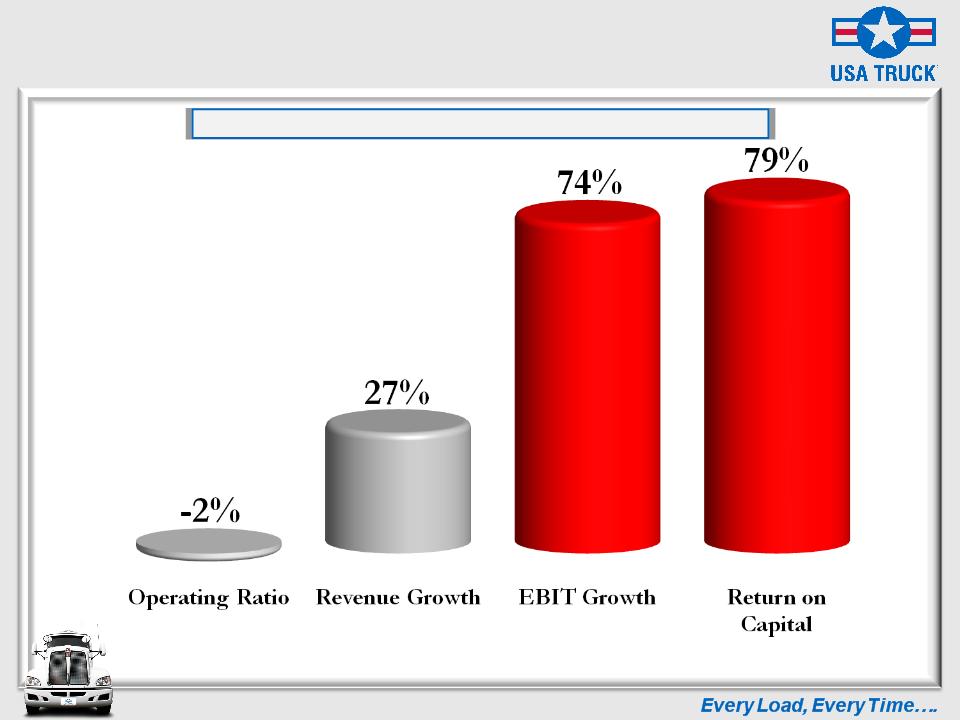
Deteriorating Performance
Deteriorating Performance
920 bps
1,050 bps
1,090 bps
Shallower Peaks and Deeper Troughs
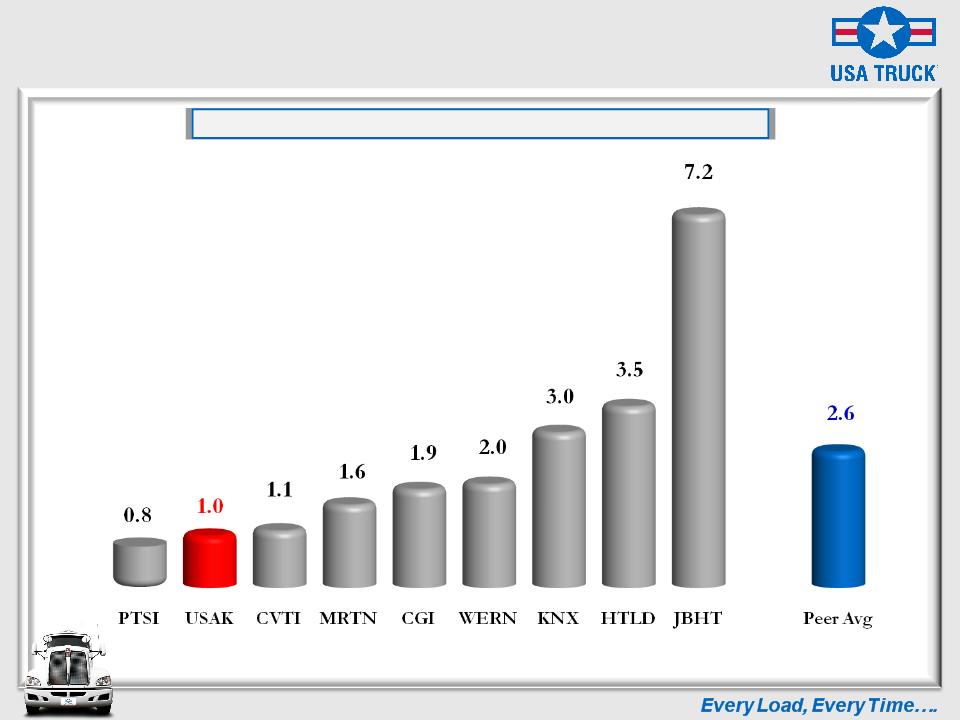
Discounted Valuation
Discounted Valuation
Truckload Peer Price-to-Book Ratios
As of August 30, 2010
Value-Creation Research
Value-Creation Research
Financial Performance Correlations to Stock Price
Source: Stephens, Inc., USA Truck, Inc. and SEC documents
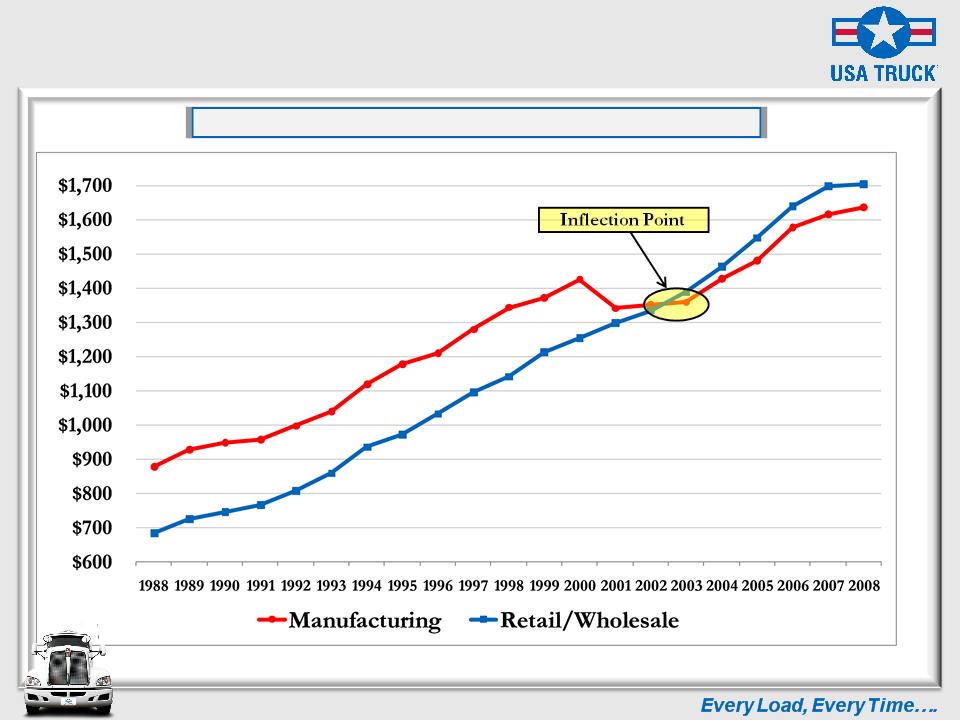
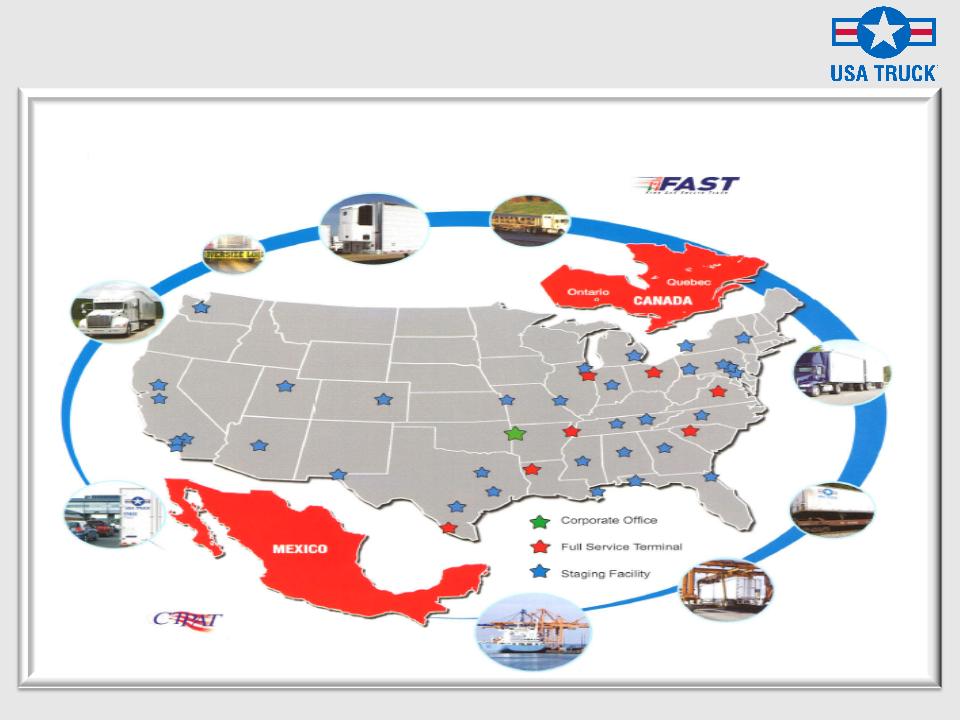
Industry and Market Research
Industry and Market Research
Structural Shift Underway in U.S. Supply Chain
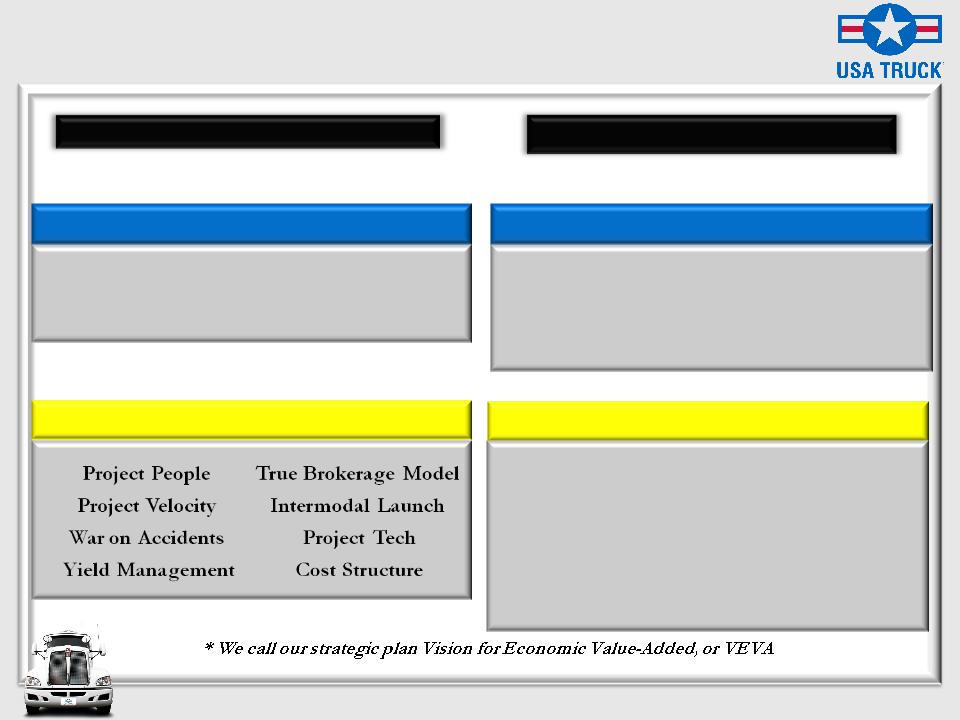
OBJECTIVES
Earn Cost of Capital
Greater Earnings Consistency
Position Model for Future Growth
OBJECTIVES
EBIT Growth CAGR >= 10%
Maintain Economic Value Added
OR
Return Excess Capital to Shareholders
HOW WE’LL DO IT
HOW WE’LL DO IT
Grow Intermodal, Brokerage, Dedicated and
General Freight Services
And / Or
Repurchase Shares
Distribute Dividends
PHASE I - Earn Cost of Capital
PHASE II - Earnings Growth
VEVA* Strategic Plan
VEVA* Strategic Plan
Every Load, Every Time….
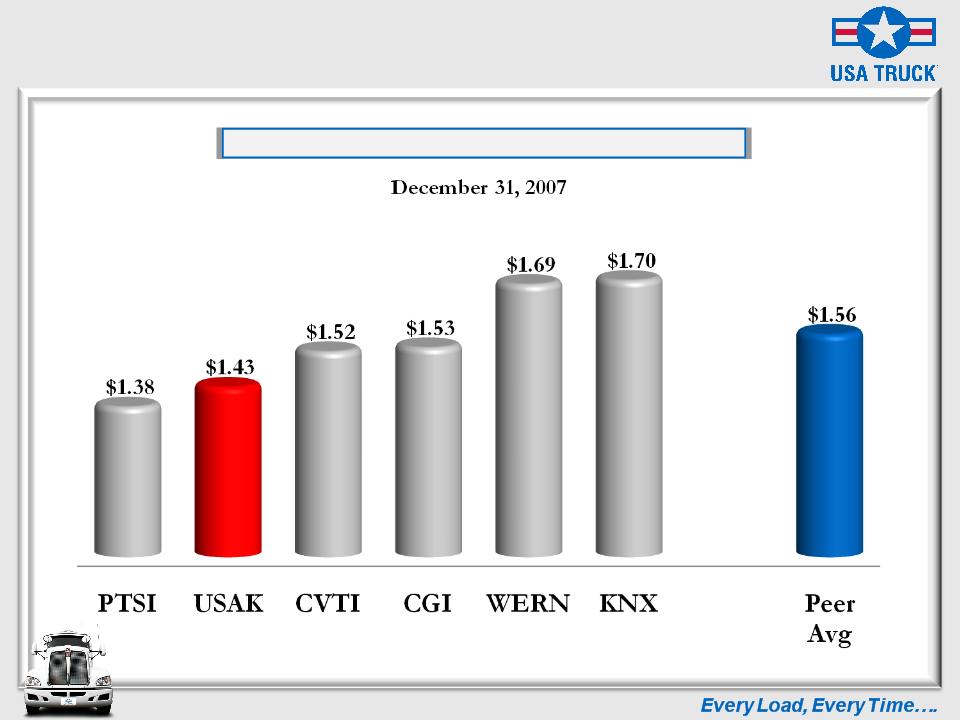
Opportunity in Pricing
Opportunity in Pricing
Revenue per Loaded Mile Comparison
Engineering a Freight Network
Engineering a Freight Network
The Spider Web is Born
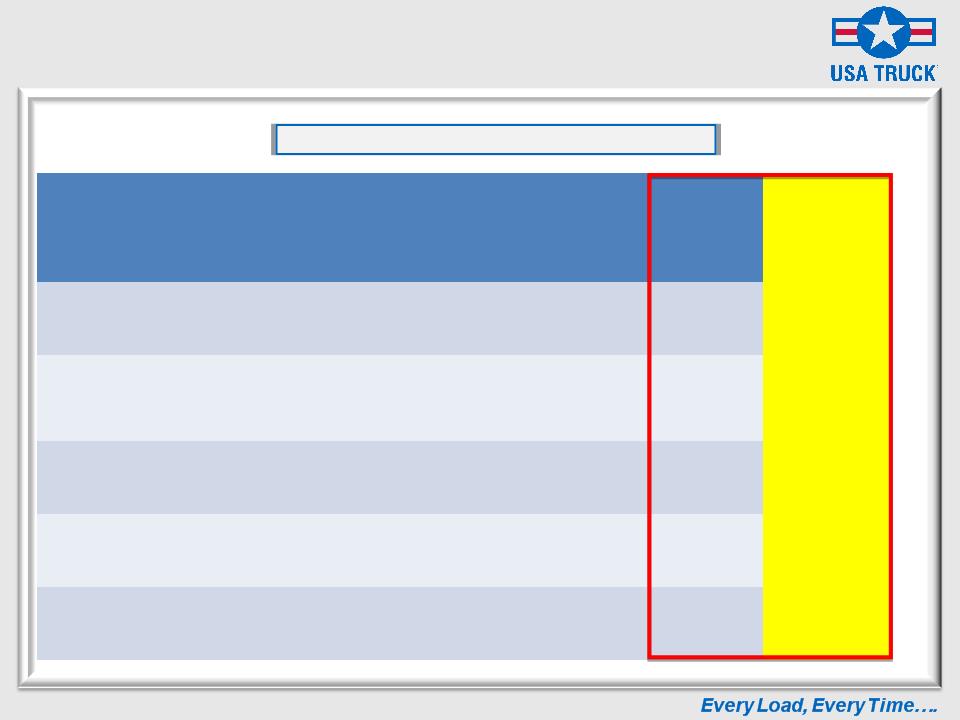
Measurable Progress
Measurable Progress
|
Metric
|
SW
Design
|
FYE
2007
|
3q
2009
|
3q
2010
|
|
Loaded Revenue per Mile
|
$1.70
|
$1.43
|
$1.46
|
$1.58
|
|
Portion of Lanes with < 5
Weekly Loads |
17%
|
90%
|
85%
|
83%
|
|
Compliance
|
> 80%
|
< 30%
|
39%
|
48%
|
|
Length of Haul
|
< 500
|
784
|
577
|
546
|
|
Velocity
|
> 4.0
|
2.5
|
3.0
|
3.3
|
A Giant Leap Forward
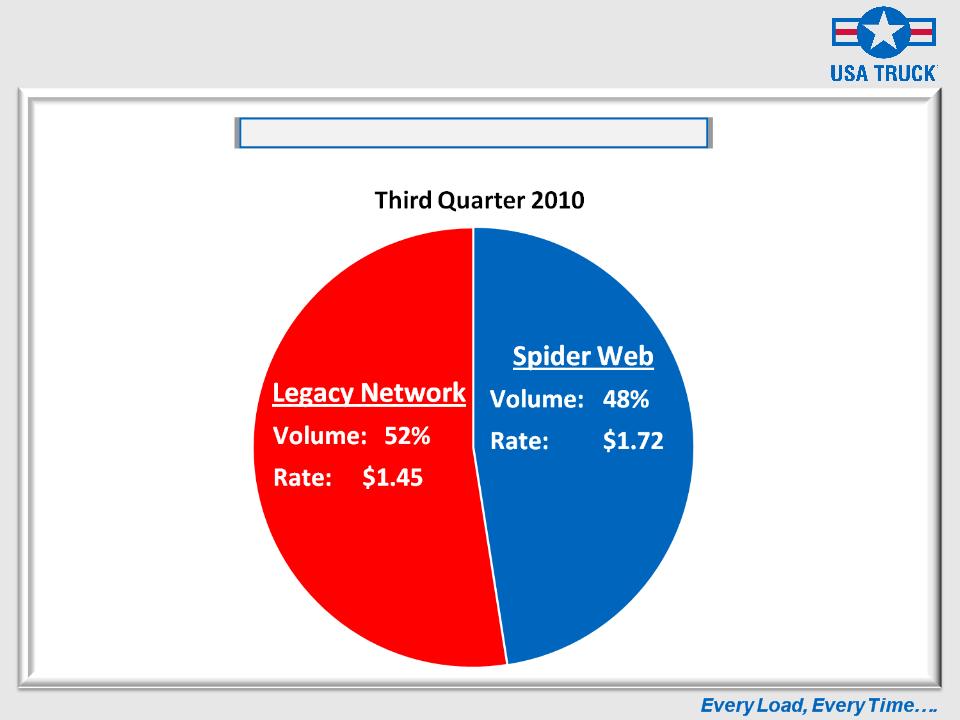
Inside the Numbers
Inside the Numbers
Spider Web Lanes Really Do Pay More!
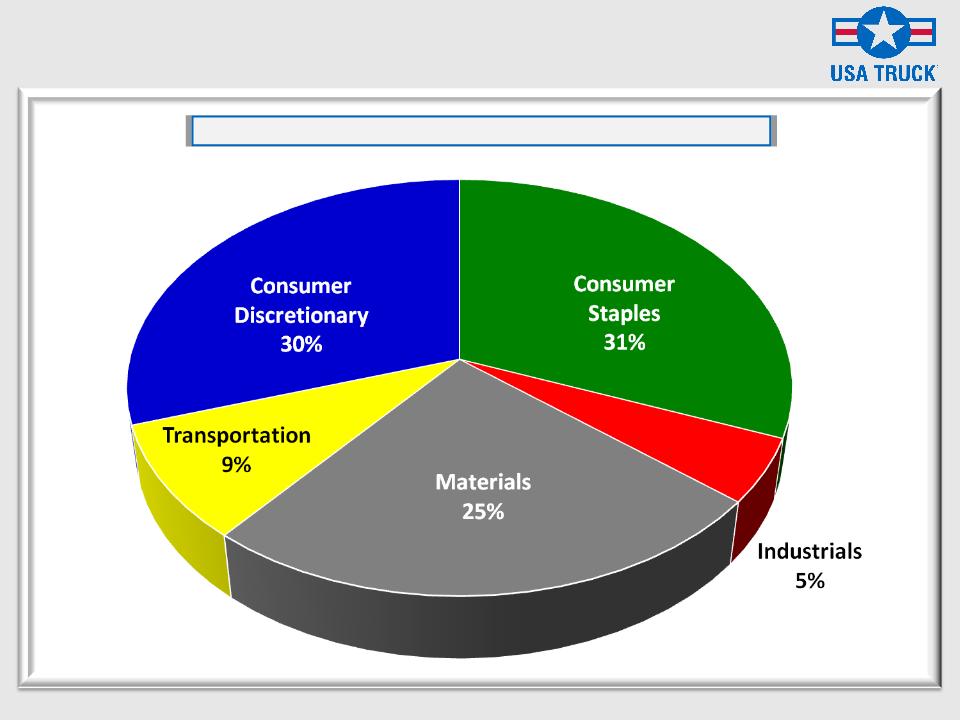
High Exposure to Cyclical Sectors
The Next Step
The Next Step
Every Load, Every Time….
A Growing “Big Boy” Model
A Growing “Big Boy” Model
Every Load, Every Time….
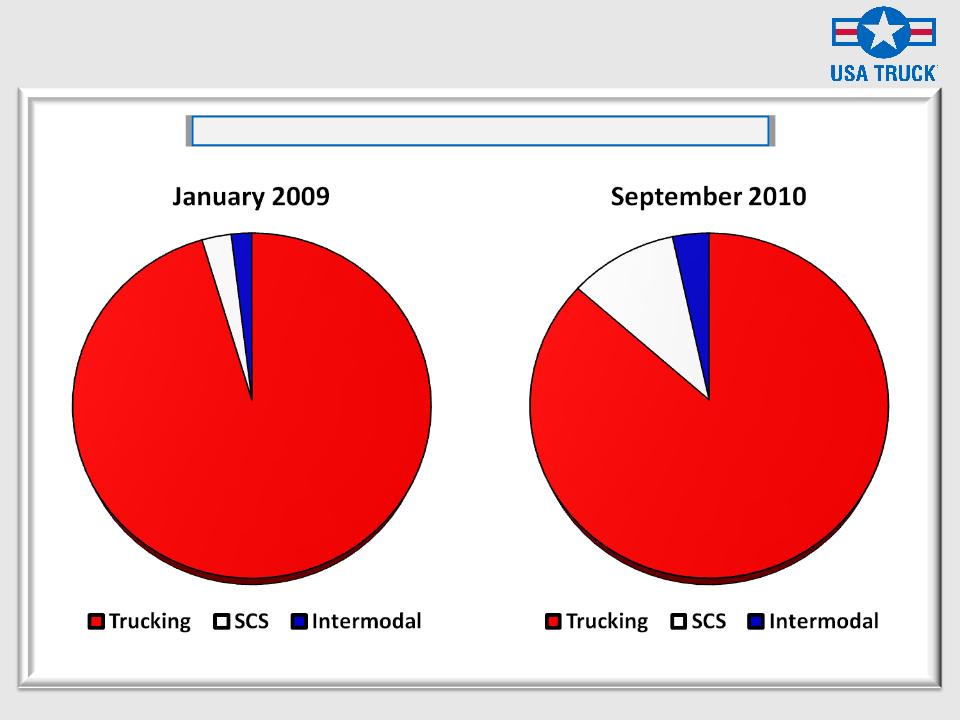
Service Offerings as a % of Total Revenue
Flexible Capacity Growing
Flexible Capacity Growing
Every Load, Every Time….
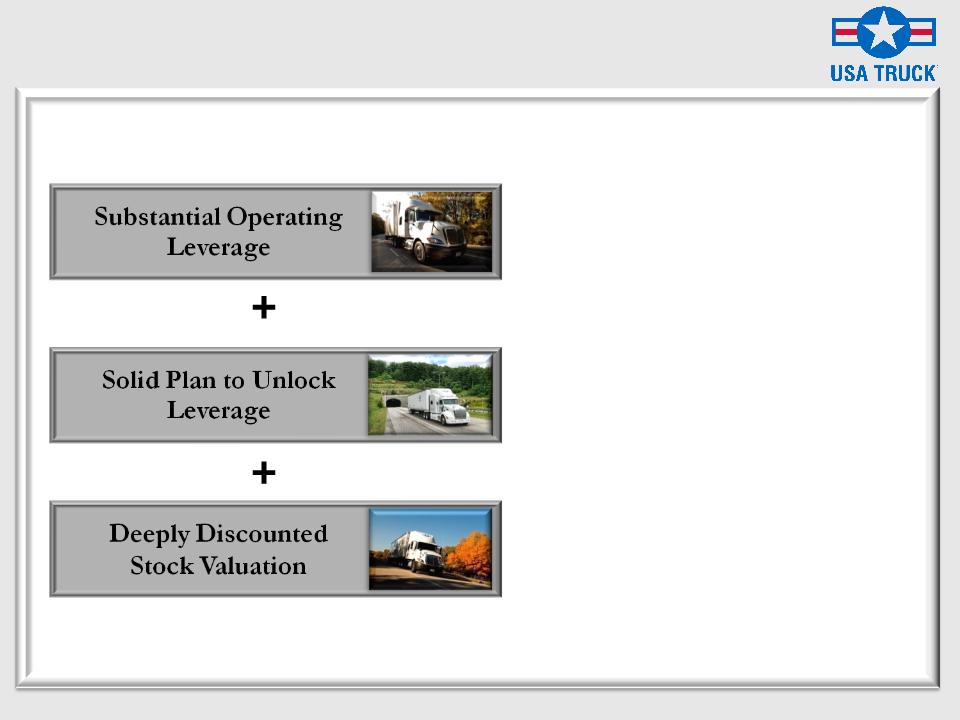
Why Invest In USA Truck?
Every Load, Every Time….
Revenue
per Mile
per Mile
$0.01
Operating
Margin
Margin
70 bps
Annualized
EPS
EPS
$0.15
=
=

USA TRUCK