Attached files
| file | filename |
|---|---|
| 8-K - FORM 8-K - Discover Financial Services | d8k.htm |
 Roger Hochschild
President and
Chief Operating Officer
November 16, 2010
Bank of America / Merrill Lynch
Banking and Financial Services Conference
Exhibit 99.1 |
 2
Notice
The
following
slides
are
part
of
a
presentation
by
Discover
Financial
Services
(the
"Company")
and
are
intended
to
be
viewed
as
part
of
that
presentation.
No
representation
is
made
that
the
information
in
these
slides
is
complete.
The
information
provided
herein
may
include
certain
non-GAAP
financial
measures.
The
reconciliations
of
such
measures
to
the
comparable
GAAP
figures
are
included
in
the
Company’s
Annual
Report
on
Form
10-K
for
the
year
ended
November
30,
2009
and
the
Company’s
Quarterly
Reports
on
Form
10-Q
for
the
quarters
ended
February
28,
2010,
May
31,
2010
and
August
31,
2010,
all
of
which
are on
file
with
the
SEC
and
available
on
the
Company’s
website
at
www.discoverfinancial.com.
Certain
reconciliations
are
also included
at
the
end
of
this
presentation.
The
presentation
contains
forward-looking
statements.
You
are
cautioned
not
to
place
undue
reliance
on
forward-looking
statements,
which
speak
only
as
of
the
date
on
which
they
are
made,
which
reflect
management’s
estimates,
projections,
expectations
or
beliefs
at
that
time
and
which
are
subject
to
risks
and
uncertainties
that
may
cause
actual
results
to
differ
materially.
For
a
discussion
of
certain
risks
and
uncertainties
that
may
affect
the
future
results
of
the
Company,
please
see
"Special
Note
Regarding
Forward-Looking
Statements,"
"Risk
Factors,"
"Business
–
Competition,"
"Business
–
Supervision
and
Regulation"
and
"Management’s
Discussion
and
Analysis
of
Financial
Condition
and
Results
of
Operations"
in
the
Company’s
Annual
Report
on
Form
10-K
for
the
year
ended
November
30,
2009
and
"Management’s
Discussion
and
Analysis
of
Financial
Condition
and
Results
of
Operations"
and
"Risk
Factors"
in
the
Company’s
Quarterly
Report
on
Form
10-Q
for
the
quarters
ended
February
28,
2010,
May
31,
2010
and
August
31,
2010,
which
are
on
file
with
the
SEC.
For
a
discussion
of
risks
associated
with
the
potential acquisition
of
The
Student
Loan
Corporation
discussed
herein,
please
see
Exhibit
No.
99.1
to
the
Company’s
Current
Report
on Form
8-K
dated
September
17,
2010,
which
is
on
file
with
the
SEC.
Certain
historical
financial
information
about
the
Company
that
we
have
included
in
this
presentation
has
been
derived
from
Morgan
Stanley’s
consolidated
financial
statements
and
does
not
necessarily
reflect
what
our
financial
condition,
results
of
operations
or
cash
flows
would
have
been
had
we
operated
as
a
separate,
stand-alone
company
during
the
periods
presented.
We
own
or
have
rights
to
use
the
trademarks,
trade
names
and
service
marks
that
we
use
in
conjunction
with
the
operation
of
our
business,
including,
but
not
limited
to:
Discover
®
,
PULSE
®
,
Cashback
Bonus
®
,
Discover
®
Network
and
Diners
Club
International
®
.
All
other
trademarks,
trade
names
and
service
marks
included
in
this
presentation
are
the
property
of
their
respective
owners. |
 3
Become the Leading Direct Banking and Payments Company
Note: Balances as of August 31, 2010; volume based on the trailing four
quarters ending 3Q10 •
$45Bn in receivables
•
Leading cash rewards program
•
1 in 4 U.S. households
•
$19Bn consumer deposits
•
$2.6Bn personal loans and
private student loans
Deposits and Other Lending
Deposits and Other Lending
U.S. Card Issuing
U.S. Card Issuing
•
$112Bn volume
•
4,400 issuers
•
$101Bn volume
•
30+ issuers
•
$27Bn volume
•
50 franchises
•
185 countries/territories |
 4
4
•
Achieve disciplined, profitable growth in Cards
•
Leverage Discover brand, service and rewards program
•
Broaden merchant acceptance to drive higher sales
•
Continue to grow direct-to-consumer banking business and expand other
attractive direct lending products
•
Increase global volume leveraging flexibility, multi-brand network alliances
and emerging payments technologies
•
Maintain focus on liquidity and strong capital base
Performance Priorities |
 5
Achieve Disciplined, Profitable Growth in Cards
Source
Company Filings
0%
2%
4%
6%
8%
10%
12%
1Q09
2Q09
3Q09
4Q09
1Q10
2Q10
3Q10
Top 5 Bank Issuers (Avg)
Discover
Card Net Charge-off Rate (%)
(1)
Market Share Growth (%)
Source
Company
Filings,
Nilson
and DFS Estimates
5%
6%
7%
8%
2007
2008
2009
3Q10
Receivables
Sales
Note(s)
1. Includes: American Express (U.S. Card), Bank of America (U.S. Card), Capital One (U.S.
Card), Citi (N.A. Branded Cards) and JPM (Card Services) |
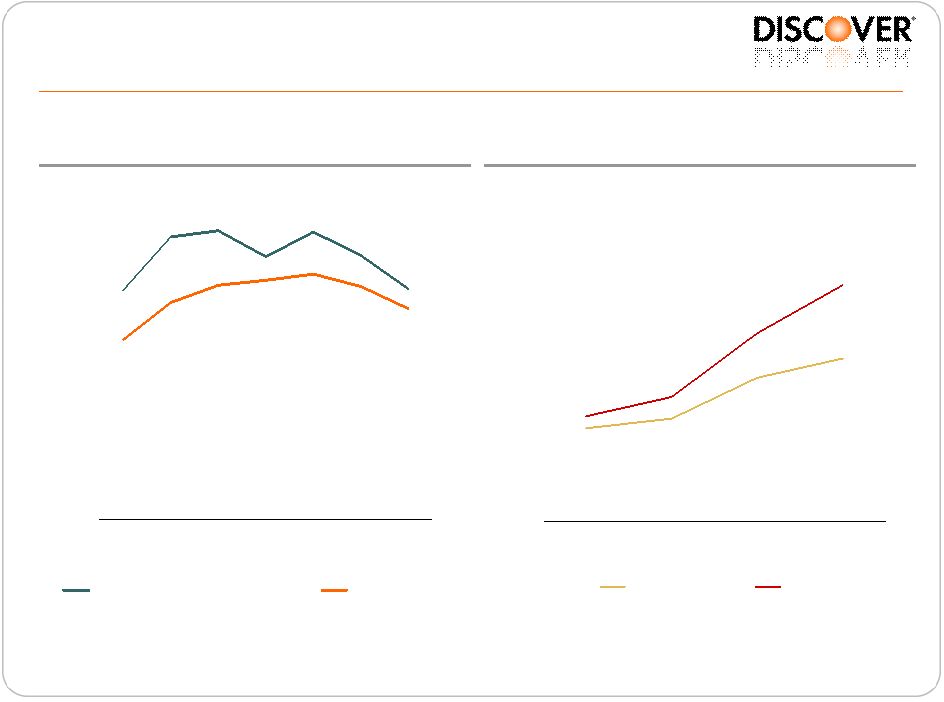
 6
Discover Primary Card User Trends
4%
5%
7%
8%
-.2%
3Q09
4Q09
1Q10
2Q10
3Q10
-6%
3%
9%
13%
10%
3Q09
4Q09
1Q10
2Q10
3Q10
Account Growth
Sales Growth
Note(s):
Primary
card
users
(PCU)
are
cardholders
who
use
the
card
15
times
or
more
per
month.
Account
figures
are
based
on
average
number
of
PCU
accounts
during
the
quarter.
All
figures
are
shown
year-over-year. |
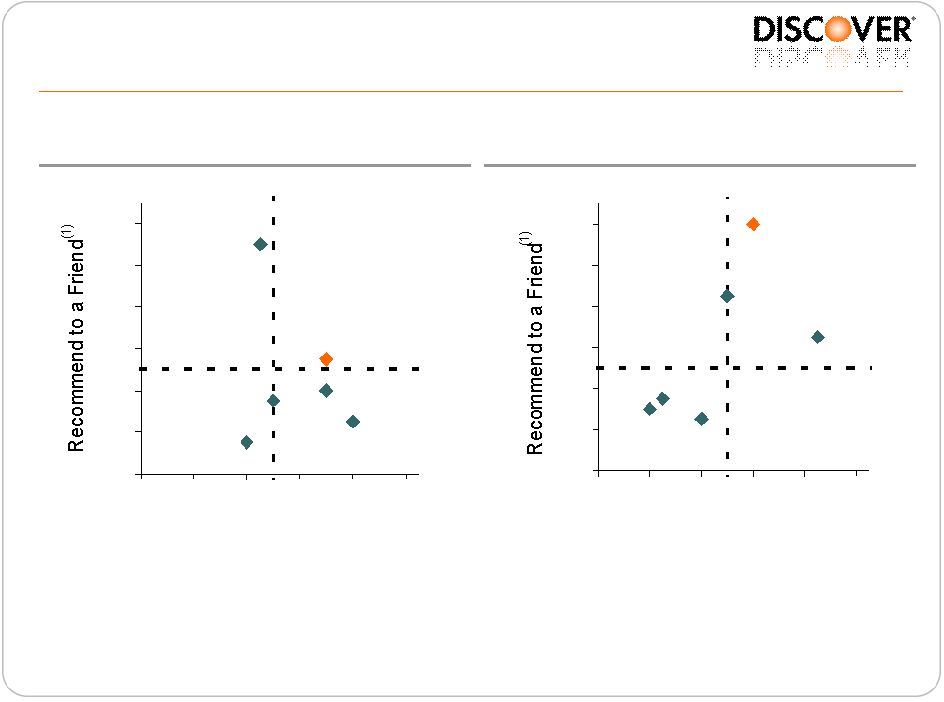 7
Leveraging Brand Progress
C
COF
DFS
JPM
BAC
AXP
65
69
73
77
81
85
89
27
31
35
39
43
47
Consideration
4Q08
Source
Millward Brown Brand & Ad Tracking Survey
C
COF
DFS
JPM
BAC
AXP
65
69
73
77
81
85
89
27
31
35
39
43
47
Consideration
3Q10
Note(s)
1. “Recommend to a Friend” among each respective brand’s primary cardmembers
2. “Consideration” defined as willingness of prospective customers among
general population to consider acquisition of each respective card (2)
(2) |
 8
Discover Expanding Brand Presence
•
Increased investment in brand visibility |
 9
Competitive Advantages
Cash Rewards Leadership Drives Loyalty
Cash
Rewards
Market
Share
(1)
Note(s)
1.
Household ownership of cash rewards cards; percentages add to more than 100% due to
household use of multiple brands Source
2009
TNS
Consumer
Card
Research
•
Highest household ownership of
cash reward cards
•
20+ years of cash rewards
experience and innovation
•
Focus on clarity and simplicity
•
Merchant funded rewards
43%
26%
18%
16%
8%
6%
DFS
JPM
AXP
C
BAC
COF |
 10
Driving Sales Growth
3%
7%
2006
2010
Active Merchant
Outlet Growth
(1)
U.S. Merchant Acceptance
•
Building awareness via cost-
efficient targeted marketing
•
Investing for future growth
•
Agreements signed with top 100
merchant acquirers
•
Implementation continues with
focus on “last mile”
Note(s)
1.
Year-over-year growth in net active merchant outlets
|
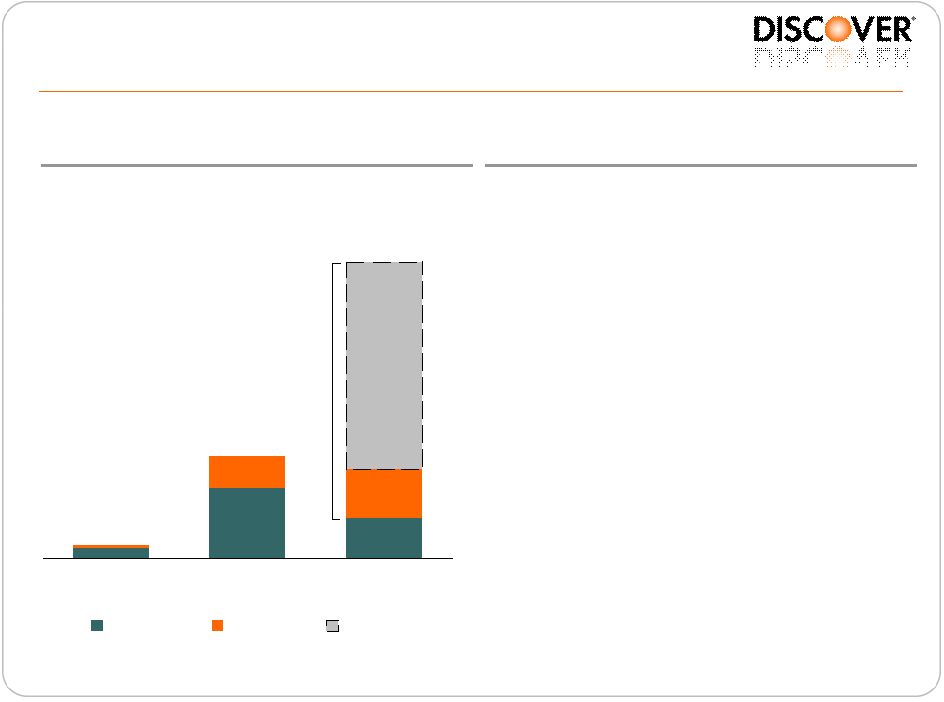 11
Update
Private Student Loan Growth
Note(s)
1.
Pro forma for the acquisition of SLC (expected to close before the calendar year
end) and the sale of $1.5Bn FFELP loans to the U.S. Department of Education in September
2010
Ending Receivables ($Bn)
$0.3
$1.9
2008
2009
8/31/10
Federal
Private
SLC
$5.5
(1)
Private
Student
Loans
•
Existing private student loans
–
On preferred lender list at ~800
schools
•
Underwriting approach
–
High co-signer rate
–
High avg. FICO
–
Only 4-year colleges and
graduate schools
•
Planned acquisition of The Student
Loan Corporation (“SLC”)
–
Top 3 originator of private
student loans
–
Over 70% of balances insured
against credit losses
–
Adds ~300k customers and
creates opportunity for cross-sell |
 12
Update
Personal Loan Growth
Personal Loans (Bn)
$1.7
$1.4
$1.0
2008
2009
8/31/10
•
Superior alternative for consolidating
debt
–
Avg
loan size ~$15k
–
YTD 2010 67% from cross-sell
–
Average life of ~4 years
including prepayments
•
Recent vintages expected to drive
ROA’s superior to card |
 13
Grow and Integrate our Networks
Discover cards accepted at DCI merchant locations:
-
Goal of 125 countries/territories enabled for acceptance by year-end 2010
-
Over 700,000 ATMs in 75+ countries and continuing expansion
Global POS Network
Global POS Network
Network Partners |
 14
Position to lead the industry in emerging payments:
•
Building the most flexible network
•
Partnering with entrepreneurial companies to rapidly bring innovation
to the marketplace
•
Continuing to invest in alternative payments and prepaid
•
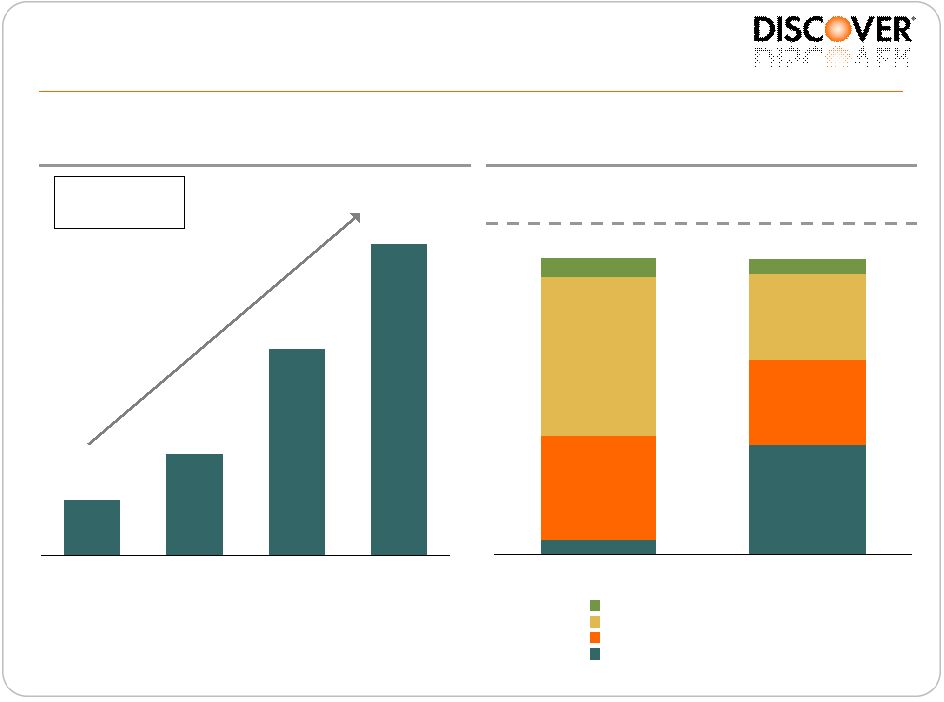
Embracing mobile commerce as the next big frontier
Priorities in Emerging Payments |
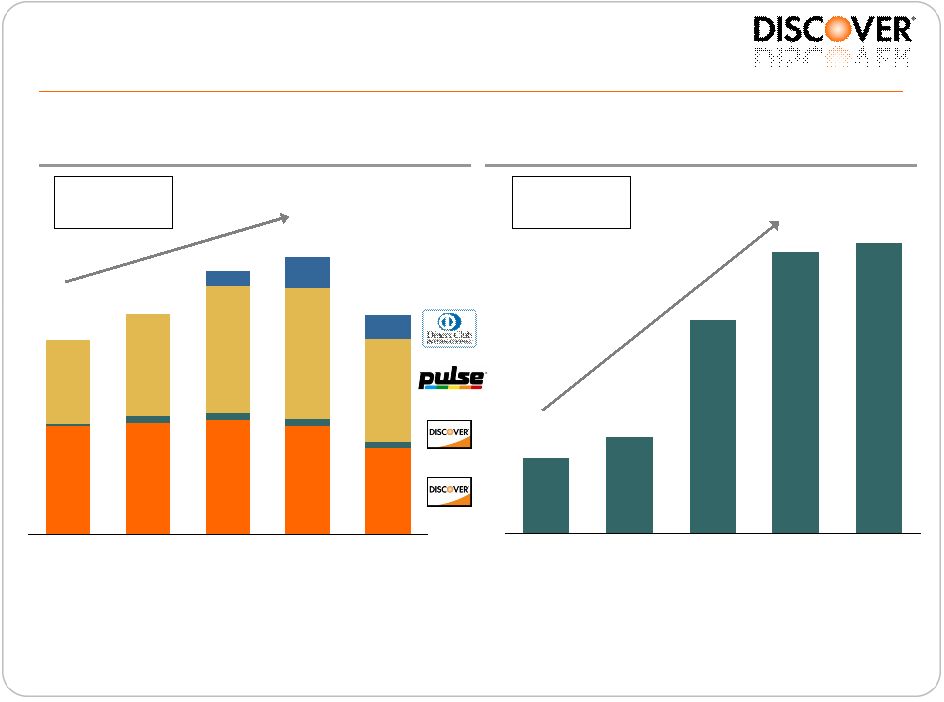 15
Strong Growth in Network Volume and Profits
$110
$107
$81
$37
$29
2006
2007
2008
2009
YTD
8/31/10
70
86
106
109
87
13
26
20
72
91
96
94
90
3
5
6
6
5
$163
$185
$221
$232
$183
2006
2007
2008
2009
YTD
8/31/10
Volume Growth by Business (Bn)
Strong Profit Growth (MM)
(TPI)
(Prop)
Note(s)
For fiscal years ending November 30
2006-2009
CAGR: 12%
YOY +6%
YOY +33%
2006-2009
CAGR: 55% |
 16
Funding and Liquidity
Liquidity and Funding Mix
35%
29%
54%
29%
37%
5%
5%
6%
Spin (6/30/07)
3Q10
Other
ABS / Conduits
Brokered Deposits
Direct-to-Consumer Deposits
100%
100%
Contingent
Liquidity
(2)
$9.4
$20.8
Direct-to-Consumer
Deposits
(1)
(Bn)
$19.1
$12.6
$6.2
$3.4
FYE 07
FYE 08
FYE 09
8/31/10
Note(s)
1.
Includes deposits originated through affinity relationships
2.
Includes cash, conduit capacity, bank credit facility and Fed discount window
access 2007-
YTD ’10
CAGR: 58% |
 17
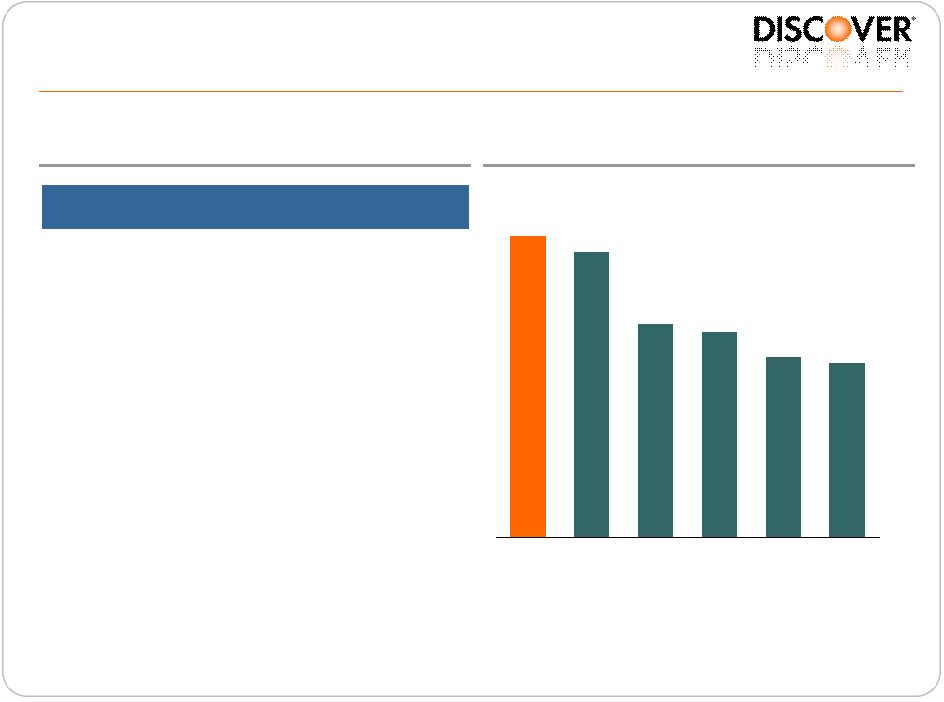
Basel
III
Estimates
(1)
Strong Capital
3Q10
TCE
/
TA
Ratio
(3)
9.4%
8.9%
6.6%
6.4%
5.6%
5.4%
DFS
AXP
C
COF
BAC
JPM
Source:
SNL
for
Competitors
Ratios
Proposed
Minimum Ratios
DFS
Consolidated
(2)
Tier 1 Common
7.0%
11.9%
Tier 1 RBC
8.5%
11.9%
Total RBC
10.5%
15.7%
Tier 1 Leverage
(3)
3.0%
7.5%
Note(s)
1.
Preliminary view based on 9/12/10 Basel Committee guidance, which is subject to change
2.
9/30/10 estimates; assumes that the portion of deferred tax assets (DTAs) realized as a result of
future profitability are capped at 10% of common equity 3.
Assets include 10% of the $166Bn undrawn credit lines
4.
Tangible common equity / tangible assets, as of 9/30/10; see appendix for Discover reconciliation
|
 18
Summary
•
Leading unsecured lender, well positioned to leverage ongoing
improvement in consumer credit and economic environment
–
Disciplined, profitable growth in credit card, building on brand,
rewards and merchant acceptance
–
Selective expansion of other consumer lending products
•
Increasing contribution from payments businesses through global
expansion and network alliances |
 Roger Hochschild
President and
Chief Operating Officer
November 16, 2010
Bank of America / Merrill Lynch
Banking and Financial Services Conference |
 20
Appendix
3Q10
Tangible Common Equity Ratio ($MM)
Total Common Equity ("TCE")
6,160
Less: Goodwill and Intangibles
(446)
Tangible Common Equity
5,714
Total Assets
61,355
Less: Goodwill and Intangibles
(446)
Tangible Assets ("TA")
60,909
TCE/TA Ratio
9.4% |