Attached files
Table of Contents
As filed with the Securities and Exchange Commission on November 15, 2010
Registration No. 333-168316
UNITED STATES
SECURITIES AND EXCHANGE COMMISSION
Washington, D.C. 20549
Amendment No. 2
to
FORM S-1
REGISTRATION STATEMENT
UNDER
THE SECURITIES ACT OF 1933
Cooper-Standard Holdings Inc.
(Exact name of registrant as specified in its charter)
| Delaware | 3714 | 20-1945088 | ||
| (State or other jurisdiction of incorporation or organization) |
(Primary Standard Industrial Classification Code Number) |
(I.R.S. Employer Identification No.) |
| 39550 Orchard Hill Place Drive Novi, MI 48375 (248) 596-5900 |
Timothy W. Hefferon, Esq. Vice President, General Counsel and Secretary Cooper-Standard Holdings Inc. 39550 Orchard Hill Place Drive Novi, MI 48375 (248) 596-5900 | |
| (Address, including zip code, and telephone number, including area code, of registrant’s principal executive offices) |
(Name, address, including zip code, and telephone number, including area code, of agent for service) |
Copy to:
Daniel J. Bursky, Esq.
Fried, Frank, Harris, Shriver & Jacobson LLP
One New York Plaza
New York, New York 10004
(212) 859-8000
Approximate date of commencement of proposed sale to public: From time to time after the effective date of this Registration Statement.
If any of the securities being registered on this Form are to be offered on a delayed or continuous basis pursuant to Rule 415 under the Securities Act of 1933, check the following box. x
If this Form is filed to register additional securities for an offering pursuant to Rule 462(b) under the Securities Act, check the following box and list the Securities Act registration statement number of the earlier effective registration statement for the same offering. ¨
If this Form is a post-effective amendment filed pursuant to Rule 462(c) under the Securities Act, check the following box and list the Securities Act registration statement number of the earlier effective registration statement for the same offering. ¨
If this Form is a post-effective amendment filed pursuant to Rule 462(d) under the Securities Act, check the following box and list the Securities Act registration statement number of the earlier effective registration statement for the same offering. ¨
Indicate by check mark whether the registrant is a large accelerated filer, an accelerated filer, a non-accelerated filer, or a smaller reporting company. See the definitions of “large accelerated filer,” “accelerated filer” and “smaller reporting company” in Rule 12b-2 of the Exchange Act. (Check one):
| Large accelerated filer ¨ | Accelerated filer ¨ | Non-accelerated filer x | Smaller reporting company ¨ | |||
| (Do not check if a smaller reporting company) |
CALCULATION OF REGISTRATION FEE
| Title of each class of securities to be registered |
Amount to be registered(1) |
Proposed maximum offering price per security |
Proposed maximum aggregate offering price |
Amount of registration fee | ||||
| Common stock, par value $0.001 per share |
11,181,673 | $29.80(2) | $333,213,855 | $23,758 | ||||
| 7% cumulative participating convertible preferred stock, par value $0.001 per share |
1,160,772(3) | $100.00(4) | $116,077,200 | $8,276 | ||||
| Common stock, par value $0.001 per share |
4,980,627 |
—(5) | — | — | ||||
| Warrants to purchase common stock, par value $0.001 per share |
1,693,827 | —(6) | — | — | ||||
| Common stock, par value $0.001 per share |
1,693,827 | $27.33(7) | $46,292,292 | $3,301 | ||||
| Total |
$35,335(8) | |||||||
Table of Contents
| (1) | Represents shares of common stock, shares of 7% cumulative participating convertible preferred stock, including shares of common stock issuable upon conversion, and warrants to purchase common stock, including shares of common stock underlying the warrants, being registered for resale that were privately placed to investors in connection with the registrant’s emergence from bankruptcy on May 27, 2010. In accordance with Rule 416 under the Securities Act, the shares of common stock offered hereby also include such indeterminate number of shares of common stock that may be issued with respect to stock splits, stock dividends or similar transactions. |
| (2) | Includes a bona fide estimate of shares of 7% cumulative participating convertible preferred stock to be issued as dividends paid in kind during the next two years. |
| (3) | Estimated solely for the purpose of determining the registration fee pursuant to Rule 457(c) under the Securities Act, based on the average of the high and low sales price of our common stock as of July 21, 2010 as reported on the Over-the-Counter Bulletin Board. |
| (4) | Estimated solely for purposes of calculating the registration fee pursuant to Rule 457 under the Securities Act. |
| (5) | Pursuant to Rule 457(i) under the Securities Act, no additional registration fee is required with respect to the shares of common stock issuable upon conversion of the preferred stock. |
| (6) | Pursuant to Rule 457(i), no additional registration fee is required with respect to the warrants as a fee is being paid for the registration of the shares of common stock underlying the warrants. |
| (7) | Estimated solely for the purpose of calculating the registration fee pursuant to Rule 457(g) under the Securities Act, based on an exercise price of $27.33 per share. |
| (8) | Previously paid. |
The Registrant hereby amends this Registration Statement on such date or dates as may be necessary to delay its effective date until the Registrant shall file a further amendment which specifically states that this Registration Statement shall thereafter become effective in accordance with Section 8(a) of the Securities Act of 1933, or until the Registration Statement shall become effective on such date as the Securities and Exchange Commission, acting pursuant to said Section 8(a), may determine.
Table of Contents
The information in this prospectus is not complete and may be changed. The selling security holders may not sell these securities until the registration statement filed with the Securities and Exchange Commission is effective. This prospectus is not an offer to sell these securities and it is not soliciting an offer to buy these securities in any state where the offer or sale is not permitted.
SUBJECT TO COMPLETION, DATED NOVEMBER 15, 2010
Prospectus
Cooper-Standard Holdings Inc.
17,210,676 Shares of Common Stock
1,010,345 Shares of 7% Cumulative Participating Convertible Preferred Stock
Warrants to Purchase 1,693,827 Shares of Common Stock
We emerged from Chapter 11 reorganization on May 27, 2010. As part of our plan of reorganization, we issued the securities listed below in a private placement to certain creditors in order to raise a portion of the funds necessary for our emergence from bankruptcy. Pursuant to our plan of reorganization, certain creditors that received these securities and their transferees, who are identified as selling security holders throughout this prospectus, are entitled to have these securities registered for resale.
This prospectus relates to the following securities that may be sold from time to time by the selling security holders identified in this prospectus:
| • | 11,181,673 shares of our common stock, par value $0.001 per share, which consists of 8,623,491 shares issued to certain creditors pursuant to a rights offering and 2,558,182 shares issued to certain creditors pursuant to a commitment agreement that provided for the backstop of the rights offering; |
| • | 1,010,345 shares of our 7% cumulative participating convertible preferred stock, par value $0.001 per share, issued to certain creditors pursuant to the commitment agreement that provided for the backstop of the rights offering (including 10,345 shares of 7% preferred stock issued as a dividend payment on our outstanding shares of 7% preferred stock); |
| • | 4,335,176 shares of our common stock issuable to holders of our 7% preferred stock upon conversion of their 7% preferred stock; |
| • | warrants to purchase 1,693,827 shares of our common stock issued to certain creditors pursuant to the commitment agreement that provided for the backstop of the rights offering; and |
| • | 1,693,827 shares of our common stock issuable to holders of our warrants upon exercise of their warrants. |
All of the securities covered by this prospectus are being sold by the selling security holders. We will not receive any proceeds from the sales of any of these securities other than proceeds from the exercise of warrants to purchase shares of our common stock, which will be used for general corporate purposes. It is anticipated that the selling security holders will sell these securities from time to time in one or more transactions, in negotiated transactions or otherwise, at prevailing market prices or at prices otherwise negotiated.
Our common stock and warrants are currently traded on the Over-the-Counter Bulletin Board, commonly known as the OTC Bulletin Board, under the symbols “COSH” and “COSHW,” respectively. On November 11, 2010, the last sale price of our common stock was $46.00 per share and the last sale price of our warrants was $22.00 per warrant. There is currently no established market for our preferred stock.
Investing in our securities involves substantial risks. You should carefully consider the matters discussed under the section entitled “Risk Factors” beginning on page 15 of this prospectus.
Neither the Securities and Exchange Commission nor any state securities commission has approved or disapproved of these securities or determined if this prospectus is truthful or complete. Any representation to the contrary is a criminal offense.
The date of this prospectus is , 2010
Table of Contents
| Page | ||||
| 1 | ||||
| 15 | ||||
| 29 | ||||
| RATIO OF EARNINGS TO COMBINED FIXED CHARGES AND PREFERRED STOCK |
31 | |||
| 32 | ||||
| 33 | ||||
| 33 | ||||
| MARKET FOR OUR COMMON STOCK AND WARRANTS AND RELATED STOCKHOLDER MATTERS |
33 | |||
| UNAUDITED PRO FORMA CONDENSED CONSOLIDATED FINANCIAL INFORMATION |
34 | |||
| 41 | ||||
| MANAGEMENT’S DISCUSSION AND ANALYSIS OF FINANCIAL CONDITION AND RESULTS OF OPERATIONS |
43 | |||
| 74 | ||||
| 75 | ||||
| 76 | ||||
| 79 | ||||
| 95 | ||||
| 128 | ||||
| 131 | ||||
| 138 | ||||
| 141 | ||||
| 148 | ||||
| 151 | ||||
| 158 | ||||
| 160 | ||||
| 160 | ||||
| 160 | ||||
| F-1 | ||||
You should rely only on the information contained in this prospectus and any applicable prospectus supplement or amendment. We have not authorized any person to provide you with different information. This prospectus is not an offer to sell, nor is it an offer to buy, these securities in any state where the offer or sale is not permitted. The information in this prospectus is complete and accurate as of the date on the front cover of this prospectus, but our business, financial condition or results of operations may have changed since that date.
i
Table of Contents
This summary highlights information about us that is contained elsewhere in this prospectus. This summary may not contain all of the information that may be important to you. You should read the entire prospectus carefully before making an investment decision, including the section entitled “Risk Factors” and our consolidated financial statements and related notes. Unless the context requires otherwise, references in this prospectus to “Cooper-Standard,” the “Company,” “we,” “us,” “our” or similar terms refer to Cooper-Standard Holdings Inc. and all of its consolidated subsidiaries.
Our Business
We are a leading manufacturer of body sealing, anti-vibration, or AVS, and fluid handling components, systems, subsystems and modules. Our products are primarily for use in passenger vehicles and light trucks that are manufactured by global automotive original equipment manufacturers, or OEMs, and replacement markets. We believe that we are the largest global producer of body sealing systems, the second largest global producer of the types of fluid handling products that we manufacture and one of the largest North American producers in the AVS business.
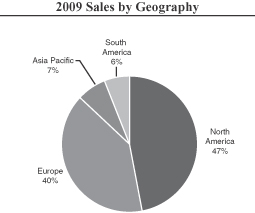
We design and manufacture our products in each major automotive region of the world in close proximity to our customers through a disciplined and consistent approach to engineering and production. We operate in 66 manufacturing locations and nine design, engineering and administrative locations around the world, including Australia, Belgium, Brazil, Canada, China, Czech Republic, France, Germany, India, Italy, Japan, Korea, Mexico, the Netherlands, Poland, Spain, the United Kingdom and the United States. For the year ended December 31, 2009, we generated approximately 47% of our sales in North America, 40% in Europe, 6% in South America and 7% in Asia/Pacific.
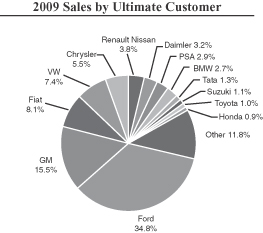
For the year ended December 31, 2009, approximately 80% of our sales were direct to OEMs, including Ford Motor Company, or Ford, “GM,” defined herein as General Motors Corporation combined with General Motors Company, and “Chrysler,” defined herein as Chrysler LLC combined with Chrysler Group LLC, or, collectively, the Detroit 3, Fiat, Volkswagen/Audi Group, Renault/Nissan, PSA Peugeot Citroën, Daimler, BMW, Toyota, Volvo, Jaguar/Land Rover and Honda. The remaining 20% of our sales for the year ended December 31, 2009 were primarily to Tier I and Tier II automotive suppliers and non-automotive customers. In 2009, our products were found in 17 of the 20 top-selling vehicle models in North America and in 19 of the 20 top-selling vehicle models in Europe.
The following chart illustrates our balance and diversity by providing a breakdown of our $1.9 billion in sales for the year ended December 31, 2009 by geography and customer.
|
|
1
Table of Contents
We conduct substantially all of our activities through our subsidiaries and sell our product lines through two reportable segments—North America and International. The International segment covers Europe, South America and Asia. For the year ended December 31, 2009, the five months ended May 31, 2010 and the four months ended September 30, 2010, we had sales of $1.9 billion, $1.0 billion and $0.8 billion and a net loss of $(356.1) million and net income of $636.3 million and $25.7 million, respectively. See “Business” for a more detailed description of our business. On a pro forma basis, for the year ended December 31, 2009 and on a combined pro forma basis for the nine months ended September 30, 2010, we had sales of $1.9 billion and $1.8 billion and a net loss of $(332.4) million and net income of $44.7 million, respectively. See “Business” for a more detailed description of our business.
Products
We supply a diverse range of products on a global basis to a broad group of customers across a wide range of vehicles. Our principal product lines are body and chassis products and fluid handling products. For the years ended December 31, 2008 and 2009, and the nine months ended September 30, 2010, body and chassis products accounted for 66%, 65% and 66%, respectively, of our sales, and fluid handling products accounted for 34%, 35% and 34%, respectively, of our sales. The top ten vehicle platforms we supply accounted for approximately 28% of our sales in 2008, 32% of our sales in 2009 and 34% of our sales in the nine months ended September 30, 2010. Our principal product lines are described below.
| Product Lines |
Solutions |
Products & Modules |
Market Position* | |||
| Body & Chassis: |
||||||
| Body Sealing |
Protect vehicle interiors from weather, dust and noise intrusion | Extruded rubber and thermoplastic sealing, weather strip assemblies and encapsulated glass products | #1 globally | |||
| Anti-Vibration |
Control and isolate noise and vibration in the vehicle to improve ride and handling | Engine and body mounts, dampers, isolators, springs, stamped or cast metal products and rubber products | #3 North America | |||
| Fluid Handling |
Control, sense, measure and deliver fluids and vapors throughout the vehicle | Pumps, tubes and hoses, connectors and valves (individually and in systems and subsystems) | #2 globally |
| * | Market positions are management’s estimates, which are based on reports prepared by industry consultants commissioned by us in 2008. See “Market and Industry Data.” |
Our Industry
The automotive industry is one of the world’s largest and most competitive. Consumer demand for new vehicles largely determines sales and production volumes of global OEMs, and component suppliers rely on high levels of vehicle sales and production to be successful.
The automotive supplier industry is generally characterized by high barriers to entry, significant start-up costs and long-standing customer relationships. The key criteria by which OEMs judge automotive suppliers include price, quality, service, performance, design and engineering capabilities, innovation, timely delivery and, more recently, financial stability. Over the last decade, those suppliers that have been able to achieve manufacturing
2
Table of Contents
scale, reduce structural costs, diversify their customer bases and establish a global manufacturing footprint have been successful.
The table below outlines vehicle production forecasts for years 2010 through 2014:
| 2010 | 2011 | 2012 | 2013 | 2014 | ||||||||||||||||
| (vehicle units in millions) | ||||||||||||||||||||
| Europe |
18.0 | 18.3 | 19.3 | 20.8 | 21.7 | |||||||||||||||
| North America |
11.8 | 12.2 | 13.3 | 14.4 | 15.2 | |||||||||||||||
| Asia |
33.4 | 34.9 | 38.1 | 41.1 | 43.0 | |||||||||||||||
| Source: | IHS Automotive (formerly CSM Worldwide) September 2010 Forecast |
Among the leading drivers of new vehicle demand is the availability of consumer credit to finance purchases. Beginning in late 2008, turmoil in the global credit markets and the recession in the United States and global economies led to a severe contraction in the availability of consumer credit. As a result, global vehicle sales volumes plummeted, led by severe declines in the mature North American and European markets. During 2009, North American light vehicle industry production declined by approximately 32% from 2008 levels to 8.6 million units, while European light vehicle industry production declined by approximately 20% from 2008 levels to 16.3 million units. The decline was less pronounced in Asia, where volumes were down only 1% from 2008 levels to 26.6 million units. This resilience was largely attributable to the continued expansion of the Chinese and Indian markets, both of which are expected to continue to increase as a share of the global automotive market in the coming years.
The severe decline in vehicle sales and production in 2009 led to major restructuring activity in the industry, particularly in North America. GM and Chrysler reorganized through chapter 11 bankruptcy proceedings and the Detroit 3 undertook other strategic actions, including the divestiture or discontinuance of non-core businesses and brands and the acceleration or broadening of operational and financial restructuring activities. A number of significant automotive suppliers, including us, restructured through chapter 11 bankruptcy proceedings or through other means.
Several significant trends and developments are now contributing to improvement in the automotive supplier industry. These include improved retail vehicle sales and production in North America in the fourth quarter of 2009 and first quarter of 2010, a more positive credit environment, the continued growth of new markets in Asia, particularly China, and increased emphasis on “green” and other innovative technologies.
Our Competitive Strengths
Innovative and high quality products
We believe we have distinguished ourselves in the automotive industry through our engineering and technological capabilities, as evidenced by our development of innovative solutions, including our ESP Thermoplastic Glassruns (body sealing), ride stabilizing hydromounts (AVS) and proprietary plastics-to-aluminum overmolding process (fluid handling). In addition, we believe we have a reputation for outstanding quality within the automotive industry, a factor that has been important to maintaining and expanding our successful relationships with our customers. We have earned numerous awards, including, among others, the DaimlerChrysler Global Supplier Award, GM Supplier of the Year, Ford’s Silver World Excellence Award and Toyota’s Cost Excellence Performance Award.
Operational excellence
We have a proven track record and disciplined approach to operational excellence, which has generated significant cost savings of approximately 4% of sales annually since 2004. We believe we have the ability to
3
Table of Contents
generate similar savings in the future due to the flexible nature of our manufacturing capabilities, our highly efficient operations and our ability to leverage economies of scale from the high volumes of products we produce for the world’s top-selling vehicle platforms. We have created a culture of continuous improvement and lean manufacturing in all aspects of our operations. Over the life cycle of each platform, we focus on streamlining manufacturing, increasing automation and reducing material and other costs in an effort to generate additional operational savings. We budget and track operational savings at the facility level, which management regularly reports and reviews.
Strong customer relations and program management
We believe that our customer relationships, program management capabilities, global presence, comprehensive product line, excellence in manufacturing, product innovation and quality assurance combine to provide us with significant competitive advantages. We have proven our ability to expand globally with customers, increase scale in a consolidating industry and be first-to-market with design and engineering innovations.
We have a high level of dedication to customer service, and for each major product launch we dedicate a team of sales representatives, engineers, quality specialists and senior management, who work together to ensure that the product launch is completed on time and consistent with rigorous quality standards. These characteristics have allowed us to remain a leading supplier to Ford and GM while steadily growing our business with European and Asian OEMs. Our capabilities are evidenced by our success in being awarded significant content on our customers’ top-selling platforms, including the Ford F-Series and GM’s GMT900 platform, which includes the Yukon, Tahoe, Sierra and Silverado vehicle models.
Global manufacturing footprint
We have established a global manufacturing footprint that allows us to serve our customers worldwide. Our global manufacturing operations are supported by 66 manufacturing locations and nine design, engineering and administrative locations around the world, including Australia, Belgium, Brazil, Canada, China, Czech Republic, France, Germany, India, Italy, Japan, Korea, Mexico, the Netherlands, Poland, Spain, the United Kingdom and the United States. Since 2004, we have increased our sales outside North America from 30% to 53%, largely reflecting our strategic focus on gaining exposure to high growth Asian markets and from key acquisitions in Europe. As part of our strategy, we operate several successful international joint ventures, which has allowed us to enter into new geographic markets, to acquire new customers and to develop new technologies. Our joint venture partners provide knowledge and insight into local markets and access to local suppliers of raw materials and components. We believe our global manufacturing footprint and proximity to customers provides us with a competitive advantage by allowing us to efficiently transport parts to local customers at a significantly lower cost as many of the parts are difficult to transport across long distances.
Incumbent position across diverse customer base
In 2009, our products were found in 17 of the 20 top-selling vehicle models in North America and in 19 of the 20 top-selling vehicle models in Europe. As the incumbent supplier to platforms, we have typically participated in the design of their successor platforms, and therefore, we believe we have been afforded a competitive advantage to win the upgrade and the ultimate replacement business. In addition, we believe that our presence on our largest customers’ highest-volume and most important platforms is a competitive advantage that allows us to further increase our market share, cross-sell our other product lines, fully leverage our lean initiatives, spread our fixed costs over higher volumes and increase our return on capital.
Experienced management team
Our senior management team has extensive experience in the automotive industry and collectively has over 130 years of experience in the industry. Our management team is focused on guiding us through the challenges facing the
4
Table of Contents
automotive industry and the changing economic environment through ongoing and continued cost reduction and restructuring initiatives and is intent on continuing to implement our business strategies. For more information on our executive officers, see “Management—Directors and Executive Officers.”
Conservative capital structure
Upon the date of our emergence from bankruptcy, May 27, 2010, or the emergence date, we significantly improved our leverage as compared to historical levels. As part of our plan of reorganization, we extinguished $1,126.7 million of prepetition debt, issued $450 million of 8 1/2% senior notes due 2018, or our senior notes, and entered into a $125 million senior secured asset-based revolving credit facility, or our senior ABL facility. At the emergence date, we had $479.3 million of outstanding indebtedness, consisting of our senior notes and $29.3 million in other debt of certain of our foreign subsidiaries. Our senior ABL facility is subject to borrowing base limitations, and we had approximately $34.3 million of letters of credit outstanding but not drawn under our senior ABL facility on the emergence date. For the year ended December 31, 2009, the five months ended May 31, 2010 and the four months ended September 30, 2010, we had a net loss of $(356.1) million and net income of $636.3 million and $25.7 million, respectively. On a pro forma basis, for the year ended December 31, 2009 and on a combined pro forma basis for the nine months ended September 30, 2010, we had a net loss of $(332.4) million and net income of $44.7 million, respectively. We believe our emergence date capital structure is a conservative and stable structure.
Our Business Strategy
Continue optimization of our business and cost structure
We seek to optimize our business and cost structure so that we are appropriately configured in the rapidly changing environment in the automotive industry, with an emphasis on reducing our overall cost structure and making our manufacturing operations more efficient. Our primary areas of focus are:
| • | Identifying and implementing lean manufacturing initiatives. Our lean manufacturing initiatives focus on optimizing manufacturing by eliminating waste, controlling cost and enhancing productivity. Lean manufacturing initiatives have been implemented at each of our manufacturing and design facilities and continue to be an important element in our disciplined approach to operational excellence. |
| • | Relocating operations to lower-cost countries. We are supplementing our Western European operations with Central and Eastern European facilities where there are lower operating costs and to more closely match our customers’ footprints for more efficient transport of parts. In addition, we have expanded our operations in China, India and Mexico. |
| • | Consolidating facilities to reduce our cost structure. Our optimization efforts are designed to streamline our global operations and include taking advantage of opportunities to reduce our overall cost structure by consolidating and closing facilities. For example, in the second half of 2009, we closed two manufacturing facilities, one located in Ohio and another located in Germany, and in March 2010, we announced the closure of our manufacturing facility in Spain. We will continue to take a disciplined approach to evaluating opportunities that would improve our efficiency, profitability and cost structure. |
| • | Maintaining flexibility in all areas of our operations. Our operational capital needs are generally lower than many in our industry and a major portion of our manufacturing machinery is movable from job-to-job, providing us flexibility in adapting to market changes and serving customers worldwide. |
Further developing technologies
We will draw on our technical expertise to provide customers with innovative solutions. Our engineers combine product design with a broad understanding of material options for enhanced vehicle performance. We believe our
5
Table of Contents
reputation for successful innovation in product design and material usage is the reason our customers consult us early in the development and design process of their next generation vehicles.
Recent innovations that highlight our ability to combine materials and product design expertise can be found in the following products:
| • | Safe Seal™. Safe Seal™ is a body sealing product featuring sensors built into the seal capable of reversing power windows, doors and partitions to prevent injury. |
| • | Our new generation Hydro Body Mount. Our new generation Hydro Body Mount features patented Inertia-track design, combining plastic, metal and rubber to provide superior damping in the driver compartment for improved ride. |
| • | Direct Injection Fuel Rail. Direct Injection Fuel Rails draw upon our innovative welding processes and understanding of metal dynamics to create high pressure capability for highly advanced direct injection engines, improving fuel economy and performance. |
| • | Stratlink. Utilizing our internal material engineering capabilities, we have developed a rubber compound that performs equally with externally sourced compounds, which will significantly reduce cost. |
| • | PlastiCool. PlastiCool is a low cost, low weight, high temperature alternative to metal and rubber hose currently used in transmission cooling that offers a more robust joint design, improving quality and potentially reducing warranty costs. Additionally, because the material is smaller than current alternatives, it allows for greater design flexibility. |
Continued emphasis on fuel efficient, global and high volume vehicles
We believe that by focusing on fuel efficient, global and high volume vehicles, we will be able to solidify and expand our global leadership position.
| • | Fuel efficient. With the recent shift in customer preferences toward light weight, fuel efficient vehicles, we intend to target small car, hybrid and alternative powertrains and increase the content we provide to these platforms. We believe that furthering our position in the small car and hybrid market and alternative powertrains will allow us to increase market share, create greater economies of scale and provide more opportunities to partner with customers. |
| • | Global. Our global presence makes us one of the select few manufacturers of products in our product line areas who can take advantage of the many business opportunities that are becoming available worldwide as a result of the OEMs’ expanding emphasis on global platforms. Examples of successful global platforms we supply are the redesigned Ford Fiesta and GM’s Buick LaCrosse. |
China, India and South America will continue to be regions of emphasis as their light vehicle market is projected to grow substantially as their economies continue to develop. In China, we are developing a substantial manufacturing and marketing presence to serve local OEMs, and we intend to follow our customers as they target other high growth developing markets.
| • | High volume. While smaller cars and crossover vehicles have grown in popularity, certain large car and truck platforms continue to be in demand and remain important to our business. For example, the Ford F-150 and GM’s GMT 900 platform (the Silverado, Sierra, Tahoe and Yukon nameplates) continue to be popular models for which we supply a broad range of our product offerings, including body sealing systems, anti-vibration systems and fuel, brake, emissions and thermal management components. |
Through our extensive product portfolio, innovative solutions and broad global capabilities, we expect to continue winning new business across all major regions and automakers.
6
Table of Contents
Developing systems solutions and other value-added products
We believe that significant opportunities exist to grow by providing complete subsystems, modules and assemblies. As a leader in design, engineering and technical capabilities, we are able to focus on improving products, developing new technologies and implementing more efficient processes in each of our product lines. Our body sealing products are visible to vehicle passengers and can enhance the vehicle’s aesthetic appeal, in addition to creating a barrier to wind, precipitation, dust and noise. Our AVS products are an important contributor to vehicle quality, significantly improving ride and handling. Our fluid handling modules and subsystems are designed to increase functionality and decrease costs to the OEM, which can be the deciding factor in winning new business.
Selectively pursuing complementary acquisitions and alliances
We intend to continue to selectively pursue complementary acquisitions and joint ventures to enhance our customer base, geographic penetration, scale and technology. Consolidation is an industry trend and is encouraged by the OEMs’ desire for fewer supplier relationships. We believe we have a strong platform for growth through acquisitions based on our past integration successes, experienced management team, global presence and operational excellence. In addition, we believe joint ventures allow us to penetrate new markets with less relative risk and capital investment. We currently operate through several successful joint ventures, including those with Nishikawa Rubber Company, Zhejiang Saiyang Seal Products Co., Ltd., Guyoung Technology Co. Ltd., Hubei Jingda Precision Steel Tube Industry Co., Ltd., Shanghai Automotive Industry Corporation and Toyoda Gosei Co., Ltd.
Developing business in non-automotive markets
While the automotive industry will continue to be our core business, we supply other industries with products using our expertise and material compounding capabilities. For example, we supply parts to customers in the technical rubber business and develop and produce synthetic rubber products for a variety of industry applications, including aircraft flooring, commercial flooring, insulating sheets for power stations, non-slip step coverings, rubber for appliances and construction applications. In our technical rubber business we fabricate products from a wide variety of elastomer compounds and can custom fit many applications.
Risk Factors
Investing in our equity securities involves substantial risk, and our ability to successfully operate our business is subject to numerous risks. Any of the factors set forth under “Risk Factors” may limit our ability to successfully execute our business strategy. You should carefully consider all of the information set forth in this prospectus and, in particular, the specific factors set forth under “Risk Factors” in deciding whether to invest in our equity securities. Among these important risks are the following:
| • | Because of our new post-bankruptcy capital structure and implementation of “fresh-start” accounting, our financial condition or results of operations will not be comparable to the financial condition or results of operations reflected in our historical financial statements. |
| • | We may not be able to generate sufficient cash to service all of our indebtedness and meet the dividend obligations of our preferred stock, and we may be forced to take other actions to satisfy our obligations under our indebtedness and preferred stock, which may not be successful. Because our ability to make scheduled payments on our debt and meet the dividend obligations of our preferred stock depends on our financial condition and operating performance, we are subject to prevailing economic and competitive conditions and to certain financial, business and other factors beyond our control. |
7
Table of Contents
| • | The financial condition of our customers, particularly the Detroit 3, may adversely affect our results of operations and financial condition. Chrysler, Ford and GM have engaged in unprecedented restructuring, which included Chrysler and GM reorganizing under bankruptcy laws, and while portions of Chrysler and GM have successfully emerged from bankruptcy proceedings, it is still uncertain what portion of their respective sales will return and whether they can be viable at a lower level of sales. |
| • | A prolonged or further material contraction in automotive sales and production volumes could materially adversely affect our liquidity, the viability of our supply base and the financial conditions of our customers. Our customers have been severely affected by the turmoil in the global credit markets and the economic recession. Our supply base has also been adversely affected by the current industry environment. Our financial condition, operating results and cash flows could be further affected by a material contraction in the automotive industry, which would impact our ability to meet our obligations. |
| • | Disruptions in the financial markets are adversely impacting the availability and cost of credit to us, which could continue to negatively affect our business. In addition, if our customers and suppliers are not able to obtain required capital, their businesses would be negatively impacted, which could negatively impact our business, whether through loss of sales or an inability to meet our commitments. |
| • | We could be materially adversely affected if we are unable to continue to compete successfully in the highly competitive automotive parts industry. We face numerous competitors in each of the product lines we produce and increased competition from suppliers producing in lower-cost countries. |
| • | We are subject to other risks associated with our non-U.S. operations, including: exchange controls and currency restrictions; currency fluctuations and devaluations; changes in local economic conditions; changes in laws and regulations, including the imposition of embargos; exposure to possible expropriation or other government actions; and unsettled political conditions and possible terrorist attacks. These and other factors may have a material adverse effect on out international operations or on our business, results of operations and financial condition. |
Our Reorganization
On August 3, 2009, we along with our U.S. subsidiaries, or the debtors, filed voluntary petitions for chapter 11 bankruptcy protection in the United States Bankruptcy Court for the District of Delaware. On August 4, 2009, our Canadian subsidiary, Cooper-Standard Automotive Canada Limited, or CSA Canada, sought relief under the Companies’ Creditors Arrangement Act in the Ontario Superior Court of Justice in Toronto, Ontario, Canada. The debtors and CSA Canada emerged from their respective insolvency proceedings on May 27, 2010, with approximately $480 million of funded debt, representing a reduction of over $650 million from prepetition levels.
As part of our emergence from chapter 11, we raised $450 million through the issuance of our senior notes and entered into our $125 million senior ABL facility with certain agent and lending banks. In addition, we raised $355 million through the issuance of (i) $100 million of our 7% cumulative participating convertible preferred stock, or our 7% preferred stock, to certain creditors pursuant to a commitment agreement that provided for the backstop of our rights offering, or the Backstop Parties, and (ii) $255 million of our common stock to the Backstop Parties and holders of our prepetition 8 3/8% senior subordinated notes due 2014, or our prepetition senior subordinated notes, pursuant to our rights offering. The Backstop Parties also received warrants to purchase 7% of our common stock (assuming the conversion of our 7% preferred stock) for their commitment to backstop the rights offering.
In connection with our emergence from chapter 11, amounts outstanding under our $175 million debtor-in- possession financing facility and $639.6 million of claims under our prepetition credit facility were paid in full in cash. Holders of our prepetition 7% senior notes due 2012, or our prepetition senior notes, were also paid in full
8
Table of Contents
in cash, except that the Backstop Parties received a distribution of our common stock in lieu of the cash payment for certain of their prepetition senior note claims. Holders of our prepetition senior subordinated notes were issued 8% of our outstanding common stock and warrants to purchase, in the aggregate, 3% of our outstanding common stock (in each case, assuming the conversion of our 7% preferred stock). In addition, our obligations under both our prepetition senior notes and our prepetition senior subordinated notes were cancelled. See “Description of Certain Indebtedness” for a more detailed description of our senior notes and senior ABL facility, “Description of Capital Stock” for a more detailed description of our equity securities and “Our Reorganization” for a more detailed description of our reorganization.
Accounting Impact of Emergence from Chapter 11
In accordance with the provisions of Financial Accounting Standards Board, or FASB, Accounting Standards Codification, or ASC, 852, “Reorganizations,” we adopted “fresh-start” accounting upon our emergence from bankruptcy and became a new entity for financial reporting purposes as of June 1, 2010. Accordingly, the consolidated financial statements for the reporting entity subsequent to emergence from bankruptcy, or the Successor, are not comparable to the consolidated financial statements for the reporting entity prior to emergence from bankruptcy, or the Predecessor. For a discussion of “fresh-start” accounting, see note 3 to our unaudited interim financial statements as of September 30, 2010.
Corporate History
Cooper-Standard Holdings Inc. was formed and capitalized in 2004 as a Delaware corporation and began operating on December 23, 2004, when it acquired the automotive segment of Cooper Tire & Rubber Company, or the 2004 acquisition. Cooper-Standard Holdings Inc. operates the business primarily through its principal operating subsidiary, Cooper-Standard Automotive Inc. Our principal executive office is located at 39550 Orchard Hill Place Drive, Novi, MI 48375. Our telephone number is (248) 596-5900. Our website address is www.cooperstandard.com. The information available on or through our website is not part of this prospectus.
Market and Industry Data
Market data and other statistical information, including market share, ranking and similar information, used throughout this prospectus is based on data available from third party market research firms, other third party sources and our good faith estimates based on internal surveys and market intelligence. For a more detailed description of the market and industry data used in this prospectus, including a discussion of the risks and uncertainties inherent in such data, see “Risk Factors,” “Forward-Looking Statements” and “Market and Industry Data.”
Trademarks and Tradenames
We own or have rights to trademarks or trade names that we use in conjunction with the operation of our business. In addition, Stratlink™, Safe Seal™, PosiBond™, and PosiLock™, our name, logo and website name and address are our service marks or trademarks. Each trademark, trade name or service mark of any other company appearing in this prospectus belongs to its holder.
9
Table of Contents
The Offering
Common Stock:
| Offered by the selling security holders |
Up to 17,210,676 shares of our common stock consisting of: |
| • | 11,181,673 shares of our outstanding common stock; |
| • | 4,335,176 shares of our common stock issuable to holders of our 7% preferred stock upon conversion of their preferred stock; and |
| • | 1,693,827 shares of our common stock issuable to holders of our warrants upon exercise of their warrants. |
| Outstanding prior to and after to the offering(1) |
18,376,112. |
| Outstanding prior to and after the offering, diluted(2) |
26,101,583. |
7% Preferred Stock:
| Offered by the selling security holders |
Up to 1,010,345 shares of our 7% preferred stock. |
| Outstanding prior to and after the offering(3) |
1,052,446. |
Warrants:
| Offered by the selling security holders |
Warrants to purchase up to 1,693,827 shares of our common stock. We use the term warrant to refer to the right to purchase one share of our common stock. |
| Outstanding prior to and after the offering(4) |
2,419,753. |
| Use of Proceeds |
We will not receive any of the proceeds from the sale of the securities by the selling security holders. We may receive proceeds upon the exercise of warrants if any warrant holder pays the exercise price in cash rather than exercising on a cashless basis. If we receive any proceeds from the issuance of shares of our common stock upon the exercise of warrants, such proceeds will be used for working capital and general corporate purposes. See “Use of Proceeds.” |
OTC Bulletin Board Symbol:
| Common stock |
COSH. |
| Warrants |
COSHW. |
| 7% Preferred Stock |
There is currently no established market for our 7% preferred stock. |
| Risk Factors |
Investing in our securities involves a high degree of risk. You should carefully read and consider the information set forth under the heading “Risk Factors” beginning on page 15 of this prospectus and all other information in this prospectus before investing in our securities. |
| (1) | Reflects the total number of outstanding shares of our common stock as of November 11, 2010 without giving effect to shares of our common stock that may be issued upon the conversion of outstanding shares of our 7% preferred stock or upon the exercise of outstanding warrants or options to purchase shares of our common stock. |
| (2) | Reflects the total number of outstanding shares of our common stock as of November 11, 2010, plus 4,515,823 shares issuable upon the conversion of our 7% preferred stock, 2,419,753 shares issuable upon the exercise of our warrants and 787,895 shares of our common stock that may be issued to certain of our officers and key employees and directors upon the exercise of options. |
| (3) | Based upon the total number of outstanding shares of our 7% preferred stock as of November 11, 2010, including 42,101 shares of restricted 7% preferred stock issued to certain of our officers and key employees. |
| (4) | Based upon the total number of outstanding warrants as of November 11, 2010. |
10
Table of Contents
Summary Historical and Pro Forma Financial Data
The following tables set forth our summary consolidated historical financial data and unaudited pro forma condensed consolidated financial information for the periods ended and as of the dates set forth below. The summary consolidated historical financial data as of December 31, 2008 and 2009 and for the years ended December 31, 2007, 2008 and 2009 have been derived from our audited consolidated financial statements and the notes thereto, which are included elsewhere in this prospectus. Ernst & Young LLP’s report on the consolidated financial statements for the year ended December 31, 2009, which appears elsewhere herein, includes an explanatory paragraph which describes an uncertainty about Cooper-Standard Holding, Inc.’s ability to continue as a going concern. The data should be read in conjunction with the consolidated financial statements, related notes, and other financial information included herein. The financial information as of December 31, 2007 was derived from our 2007 audited consolidated financial statements, which are not included in this prospectus. The summary historical financial data as of September 30, 2010 and for the nine months ended September 30, 2009, the five months ended May 31, 2010 and the four months ended September 30, 2010 have been derived from our unaudited consolidated financial statements and the notes thereto, which are included elsewhere in this prospectus.
We have prepared the unaudited summary consolidated financial data as of and for the nine months ended September 30, 2009, the five months ended May 31, 2010 and the four months ended September 30, 2010 on a basis consistent with our audited consolidated financial statements for the year ended December 31, 2009, and this information includes all adjustments (consisting of only normal recurring adjustments unless otherwise disclosed therein) that management considers necessary for a fair presentation of our financial position and results of operations for the periods indicated. Historical results are not necessarily indicative of future performance. Operating results for the five months ended May 31, 2010 and the four months ended September 30, 2010 are not necessarily indicative of results that may be expected for the full fiscal year.
The summary unaudited pro forma condensed consolidated financial data set forth below has been derived by applying the pro forma adjustments described under “Unaudited Pro Forma Condensed Consolidated Financial Information” to our historical consolidated statement of operations for the year ended December 31, 2009 and the combined historical five months ended May 31, 2010 and four months ended September 30, 2010, respectively. The summary unaudited pro forma condensed consolidated statement of operations data has been prepared to give effect to the Pro Forma Adjustments, as further described under “Unaudited Pro Forma Condensed Consolidated Financial Information,” as if they had occurred on January 1, 2009.
The summary unaudited pro forma condensed consolidated financial data presented for the year ended December 31, 2009 are based on the historical consolidated financial statements and the summary unaudited pro forma condensed consolidated financial data presented for the nine months ended September 30, 2010 was derived from the unaudited consolidated financial statements and each has been prepared to give effect to the following:
| • | the effectiveness of the debtors’ Second Amended Joint Chapter 11 Plan, or our plan of reorganization, including the issuance of our senior notes and the rights offering, collectively referred to as Reorganization Adjustments in “Unaudited Pro Forma Condensed Consolidated Financial Information”; and |
| • | the adjustments required under “fresh-start” accounting for the entities that emerged from the bankruptcy cases, classified as Fresh-Start Adjustments in “Unaudited Pro Forma Condensed Consolidated Financial Information.” |
We adopted “fresh-start” accounting upon our emergence from Chapter 11 bankruptcy proceedings and became a new entity for financial reporting purposes as of June 1, 2010. Accordingly, the consolidated financial statements for the reporting entity subsequent to emergence from Chapter 11 bankruptcy proceedings, or the Successor, are not comparable to the consolidated financial statements for the reporting entity prior to emergence from Chapter 11 bankruptcy proceedings, or the Predecessor. For a discussion of “fresh-start” accounting, see note 3 to our unaudited interim financial statements as of September 30, 2010.
11
Table of Contents
The following summary historical and unaudited pro forma condensed consolidated financial data is qualified by reference to, and should be read in conjunction with, our historical consolidated financial statements and the notes to those statements included elsewhere in this prospectus and the information under “Unaudited Pro Forma Condensed Consolidated Financial Information,” “Capitalization” and “Management’s Discussion and Analysis of Financial Condition and Results of Operations.”
The summary unaudited pro forma condensed consolidated financial information set forth below is presented for illustrative purposes only and is not necessarily indicative of the results of operations or financial position that would have actually been reported had the transactions and other matters reflected in the Pro Forma Adjustments occurred on January 1, 2009, nor is it indicative of our future results of operations or financial position. In addition, our historical financial statements will not be comparable to our financial statements following our emergence from bankruptcy due to the effects of the consummation of our plan of reorganization as well as adjustments for “fresh-start” accounting. In addition, the amount of new stockholders’ equity in the unaudited pro forma condensed consolidated balance sheet is not an estimate of the market value of our common stock or 7% preferred stock as of the emergence date or at any other time. We make no representations as to the market value, if any, of our common stock and 7% preferred stock.
| Historical | Pro Forma | |||||||||||||||||||||||||||||||||||
| Predecessor | Successor | |||||||||||||||||||||||||||||||||||
| Year Ended December 31, | Nine Months Ended September 30, 2009 |
Five Months Ended May 31, 2010 |
Four Months Ended September 30, 2010 |
Year Ended December 31, 2009 |
Nine Months Ended September 30, 2010 |
|||||||||||||||||||||||||||||||
| 2007 | 2008 | 2009 | ||||||||||||||||||||||||||||||||||
| (in millions) | ||||||||||||||||||||||||||||||||||||
| Statement of operations: |
||||||||||||||||||||||||||||||||||||
| Sales |
$ | 2,511.2 | $ | 2,594.6 | $ | 1,945.3 | $ | 1,367.6 | $ | 1,009.1 | $ | 801.3 | $ | 1,945.3 | $ | 1,810.4 | ||||||||||||||||||||
| Cost of products sold |
2,114.1 | 2,260.1 | 1,679.0 | 1,192.5 | 832.2 | 665.4 | 1,691.9 | 1,492.3 | ||||||||||||||||||||||||||||
| Gross profit |
397.1 | 334.5 | 266.3 | 175.1 | 176.9 | 135.9 | 253.4 | 318.1 | ||||||||||||||||||||||||||||
| Selling, administration & engineering expenses |
222.1 | 231.7 | 199.5 | 146.2 | 92.1 | 91.6 | 199.7 | 187.3 | ||||||||||||||||||||||||||||
| Amortization of intangibles |
31.9 | 31.0 | 15.0 | 14.8 | 0.3 | 5.1 | 15.1 | 11.4 | ||||||||||||||||||||||||||||
| Impairment charges |
146.4 | 33.4 | 363.5 | 362.7 | — | — | 363.5 | — | ||||||||||||||||||||||||||||
| Restructuring |
26.4 | 38.3 | 32.4 | 32.9 | 5.9 | 1.2 | 32.4 | 7.1 | ||||||||||||||||||||||||||||
| Operating profit (loss) |
(29.7 | ) | 0.1 | (344.1 | ) | (381.5 | ) | 78.6 | 38.0 | (357.3 | ) | 112.3 | ||||||||||||||||||||||||
| Interest expense, net of interest income |
(89.5 | ) | (92.9 | ) | (64.3 | ) | (53.6 | ) | (44.5 | ) | (14.2 | ) | (45.4 | ) | (33.4 | ) | ||||||||||||||||||||
| Equity earnings (losses) |
2.2 | 0.9 | 4.0 | 1.7 | 3.6 | 2.5 | 3.2 | 5.8 | ||||||||||||||||||||||||||||
| Reorganization items, net |
— | — | (17.4 | ) | (5.6 | ) | 660.0 | — | — | — | ||||||||||||||||||||||||||
| Other income (expense) |
(0.5 | ) | (1.4 | ) | 9.9 | 13.7 | (21.2 | ) | 5.0 | 12.3 | (16.2 | ) | ||||||||||||||||||||||||
| Income (loss) before income taxes |
(117.5 | ) | (93.3 | ) | (411.9 | ) | (425.3 | ) | 676.5 | 31.3 | (387.2 | ) | 68.5 | |||||||||||||||||||||||
| Provision for income tax expense (benefit) |
32.9 | 29.3 | (55.7 | ) | (31.3 | ) | 39.9 | 5.4 | (54.7 | ) | 23.3 | |||||||||||||||||||||||||
| Consolidated net income (loss) |
(150.4 | ) | (122.6 | ) | (356.2 | ) | (394.0 | ) | 636.6 | 25.9 | (332.5 | ) | 45.2 | |||||||||||||||||||||||
| Add: Net loss (income) attributable to noncontrolling interests(1) |
(0.6 | ) | 1.1 | 0.1 | 0.5 | (0.3 | ) | (0.2 | ) | 0.1 | (0.5 | ) | ||||||||||||||||||||||||
| Net income (loss) attributable to Cooper-Standard Holdings Inc. |
$ | (151.0 | ) | $ | (121.5 | ) | $ | (356.1 | ) | $ | (393.5 | ) | $ | 636.3 | $ | 25.7 | $ | (332.4 | ) | $ | 44.7 | |||||||||||||||
| Balance sheet data (at end of period): |
||||||||||||||||||||||||||||||||||||
| Cash and cash equivalents |
$ | 40.9 | $ | 111.5 | $ | 380.3 | $ | 253.7 | $ | 232.3 | ||||||||||||||||||||||||||
| Net working capital(2) |
249.8 | 154.5 | 240.8 | 286.9 | 230.9 | |||||||||||||||||||||||||||||||
| Total assets |
2,162.3 | 1,818.3 | 1,737.4 | 1,651.2 | 1,862.5 | |||||||||||||||||||||||||||||||
| Total non-current liabilities |
1,351.6 | 1,346.9 | 263.9 | 275.1 | 771.9 | |||||||||||||||||||||||||||||||
| Total debt(3) |
1,140.2 | 1,144.1 | 204.3 | 154.0 | 477.0 | |||||||||||||||||||||||||||||||
| Liabilities subject to compromise |
— | — | 1,261.9 | 1,262.3 | — | |||||||||||||||||||||||||||||||
| Preferred stock |
— | — | — | — | 129.9 | |||||||||||||||||||||||||||||||
| Equity (deficit) |
276.8 | 19.7 | (306.5 | ) | (341.4 | ) | 544.8 | |||||||||||||||||||||||||||||
12
Table of Contents
| Historical | Pro Forma | |||||||||||||||||||||||||||||||||||
| Predecessor | Successor | |||||||||||||||||||||||||||||||||||
| Year Ended December 31, |
Nine Months Ended September 30, 2009 |
Five Months Ended May 31, 2010 |
Four Months Ended September 30, 2010 |
Year Ended December 31, 2009 |
Nine Months Ended September 30, 2010 |
|||||||||||||||||||||||||||||||
| 2007 | 2008 | 2009 | ||||||||||||||||||||||||||||||||||
| (in millions) | ||||||||||||||||||||||||||||||||||||
| Statement of cash flows data: |
||||||||||||||||||||||||||||||||||||
| Net cash provided (used) by: |
||||||||||||||||||||||||||||||||||||
| Operating activities |
$ | 185.4 | $ | 136.5 | $ | 130.0 | $ | 30.2 | $ | (75.4 | ) | $ | 80.3 | |||||||||||||||||||||||
| Investment activities |
(260.0 | ) | (73.9 | ) | (45.5 | ) | (25.2 | ) | (19.1 | ) | (23.4 | ) | ||||||||||||||||||||||||
| Financing activities |
55.0 | 14.1 | 166.1 | 118.9 | (112.6 | ) | 0.3 | |||||||||||||||||||||||||||||
| Capital expenditures |
107.3 | 92.1 | 46.1 | 25.5 | 22.9 | 23.5 | ||||||||||||||||||||||||||||||
| Other financial data (unaudited): |
||||||||||||||||||||||||||||||||||||
| EBITDA(4) |
$ | 107.5 | $ | 140.8 | $ | (233.6 | ) | $ | (283.1 | ) | $ | 756.4 | $ | 82.3 | ||||||||||||||||||||||
| Adjusted EBITDA(4) |
285.7 | 210.2 | 176.5 | 105.7 | 120.0 | 94.8 | ||||||||||||||||||||||||||||||
| Ratio of earnings to combined fixed charges and preferred stock dividends |
— | — | — | — | 14.9x | 2.3x | — | 2.3x | ||||||||||||||||||||||||||||
| (1) | Certain prior period amounts have been reclassified from other income to net loss (income) attributable to noncontrolling interests due to recent accounting pronouncements. |
| (2) | Net working capital is defined as current assets (excluding cash and cash equivalents) less current liabilities (excluding debt payable within one year). |
| (3) | Includes $175.0 million and $0.0 million of borrowings under our debtor-in-possession credit agreement, dated December 18, 2009, or our DIP credit agreement, $0.8 million and $0.4 million in capital leases and $28.5 million and $22.6 million of other third party debt as of December 31, 2009 and September 30, 2010, respectively. |
| (4) | In evaluating our business, management considers EBITDA and Adjusted EBITDA as key indicators of our operating performance. In addition, our management uses EBITDA and Adjusted EBITDA: |
| • | because similar measures are utilized in the calculation of the financial covenants and ratios contained in our financing arrangements; |
| • | in developing our internal budgets and forecasts; |
| • | as a significant factor in evaluating our management for compensation purposes, see “Management—Compensation Discussion and Analysis”; |
| • | in evaluating potential acquisitions; |
| • | in comparing our current operating results with corresponding historical periods and with the operational performance of other companies in our industry; and |
| • | in presentations to the members of our board of directors to enable our board of directors to have the same measurement basis of operating performance as is used by management in their assessments of performance and in forecasting and budgeting for our company. |
In addition, we believe EBITDA and Adjusted EBITDA and similar measures are widely used by investors, securities analysts and other interested parties in evaluating our performance. We define Adjusted EBITDA as net income (loss) plus provision for income tax expense (benefit), interest expense, net of interest income, depreciation and amortization, or EBITDA, as adjusted for items that management does not consider to be reflective of our core operating performance. These adjustments include restructuring costs, impairment charges, non-cash fair value adjustments, acquisition related costs, professional fees and expenses associated with our reorganization, non-cash stock based compensation and non-cash gains and losses from certain foreign currency transactions and translation.
We calculate EBITDA and Adjusted EBITDA by adjusting net income (loss) to eliminate the impact of a number of items we do not consider indicative of our ongoing operating performance. You are encouraged to evaluate each adjustment and the reasons we consider it appropriate for supplemental analysis. However, EBITDA and Adjusted EBITDA are not financial measurements recognized under U.S. GAAP, and when analyzing our operating performance, investors should use EBITDA and Adjusted EBITDA in addition to, and not as an alternative for, net income (loss), operating income, or any other performance measure derived in accordance with U.S. GAAP, or as an alternative to cash flow from operating activities as a measure of our liquidity. EBITDA and Adjusted EBITDA have limitations as analytical tools, and they should not be considered in isolation or as substitutes for analysis of our results of operations as reported under U.S. GAAP. These limitations include:
| • | they do not reflect our cash expenditures or future requirements for capital expenditures or contractual commitments; |
| • | they do not reflect changes in, or cash requirements for, our working capital needs; |
| • | they do not reflect interest expense or cash requirements necessary to service interest or principal payments under our senior notes and senior ABL facility; |
| • | they do not reflect certain tax payments that may represent a reduction in cash available to us; |
| • | although depreciation and amortization are non-cash charges, the assets being depreciated or amortized may have to be replaced in the future, and EBITDA and Adjusted EBITDA do not reflect cash requirements for such replacements; and |
13
Table of Contents
| • | other companies, including companies in our industry, may calculate these measures differently and, as the number of differences in the way companies calculate these measures increases, the degree of their usefulness as a comparative measure correspondingly decreases. |
In addition, in evaluating Adjusted EBITDA, it should be noted that in the future we may incur expenses similar to the adjustments in the below presentation. Our presentation of Adjusted EBITDA should not be construed as an inference that our future results will be unaffected by unusual or non-recurring items.
The following table provides a reconciliation of EBITDA and Adjusted EBITDA to net income (loss), which is the most directly comparable financial measure presented in accordance with U.S. GAAP:
| Historical | ||||||||||||||||||||||||
| Year Ended December 31, | Nine Months Ended September 30, |
Five Months Ended May 31, |
Four Months Ended September 30, |
|||||||||||||||||||||
| 2007 | 2008 | 2009 | 2009 | 2010 | 2010 | |||||||||||||||||||
| (in millions) | ||||||||||||||||||||||||
| Net income (loss) attributable to Cooper-Standard Holdings Inc. |
$ | (151.0 | ) | $ | (121.5 | ) | $ | (356.1 | ) | $ | (393.5 | ) | $ | 636.3 | $ | 25.8 | ||||||||
| Plus: |
||||||||||||||||||||||||
| Provision for income tax expense (benefit) |
32.9 | 29.3 | (55.7 | ) | (31.3 | ) | 39.9 | 5.4 | ||||||||||||||||
| Interest expense, net of interest income |
89.6 | 92.9 | 64.3 | 53.6 | 44.5 | 14.2 | ||||||||||||||||||
| Depreciation and amortization |
136.0 | 140.1 | 113.9 | 88.1 | 35.7 | 36.9 | ||||||||||||||||||
| EBITDA |
$ | 107.5 | $ | 140.8 | $ | (233.6 | ) | $ | (283.1 | ) | $ | 756.4 | $ | 82.3 | ||||||||||
| Restructuring |
26.4 | 30.6 | 32.4 | 32.9 | 5.9 | 1.2 | ||||||||||||||||||
| Foreign exchange losses (gains) |
(0.1 | ) | 0.1 | (4.2 | ) | (10.8 | ) | 17.2 | (0.1 | ) | ||||||||||||||
| Net gain on bond repurchase(a) |
— | (1.7 | ) | (9.1 | ) | (9.1 | ) | — | — | |||||||||||||||
| Inventory write-up(b) |
2.5 | — | — | — | — | 8.1 | ||||||||||||||||||
| Impairment(c) |
146.4 | 36.0 | 363.5 | 362.7 | — | — | ||||||||||||||||||
| Reorganization costs(d) |
— | — | 25.1 | 5.6 | (660.0 | ) | — | |||||||||||||||||
| Transition and integration costs(e) |
1.5 | 0.5 | — | — | — | — | ||||||||||||||||||
| Stock compensation expense(f) |
1.5 | 1.2 | 1.4 | — | 0.2 | 3.6 | ||||||||||||||||||
| Other |
— | 2.7 | 1.0 | 7.5 | 0.3 | (0.3 | ) | |||||||||||||||||
| Adjusted EBITDA |
$ | 285.7 | $ | 210.2 | $ | 176.5 | $ | 105.7 | $ | 120.0 | $ | 94.8 | ||||||||||||
| (a) | Net gain on purchases of our prepetition senior subordinated notes. |
| (b) | Write-ups of inventory to fair value. |
| (c) | For the year ended December 31, 2007, impairment included charges related to goodwill of $142.9 million and certain intangibles of $3.5 million. For the year ended December 31, 2008, impairment included charges related to goodwill of $23.1 million, certain intangibles of $3.9 million, fixed assets of $6.4 million and our investment in Guyoung Technology Co. Ltd., or Guyoung, of $2.7 million. For the year ended December 31, 2009, impairment included charges related to goodwill of $157.2 million, certain intangibles of $202.4 million and fixed assets of $3.9 million. |
| (d) | Reorganization and bankruptcy-related expenses, including the effect of the Fresh-Start Adjustments and professional fees incurred before filing for bankruptcy in 2009. |
| (e) | Transition and integration costs related to the acquisition of nine Metzeler Automotive Profile Systems sealing systems operations in Germany, Italy, Poland, Belarus and Belgium and a joint venture interest in China, or, collectively, MAPS, and the El Jarudo fuel rail manufacturing business of Automotive Components Holdings, LLC, or El Jarudo, in 2007 and a MAPS related acquisition of a joint venture interest in India, or MAP India, in 2008. |
| (f) | Compensation expense related to stock options and stock units issued to management. |
14
Table of Contents
Before investing in the securities offered hereby, you should carefully consider the following risks and all of the other information contained in this prospectus. The risks described below are not the only risks we face. Additional risks and uncertainties not presently known to us or that we currently deem immaterial also may adversely affect us and your investment. If any of the risks or uncertainties occur, our business, financial condition or results of operations could be materially adversely affected.
Risks Related to Our Business
We are highly dependent on the automotive industry. A prolonged or further material contraction in automotive sales and production volumes could materially adversely affect our liquidity, the viability of our supply base and the financial conditions of our customers, all of which could have a material adverse affect on our business, results of operations and financial condition.
The great majority of our customers are OEMs and their suppliers. In 2009, the automotive industry was severely affected by the turmoil in the global credit markets and the economic recession. These conditions had a dramatic impact on consumer vehicle demand in 2009. During 2009, North American light vehicle industry production declined by approximately 32% from 2008 levels to 8.6 million units. European light vehicle industry production declined by approximately 20% from 2008 levels to 16.3 million units.
Automotive sales and production are highly cyclical and depend, among other things, on general economic conditions and consumer spending and preferences (which can be affected by a number of issues, including fuel costs, employment levels and the availability of consumer financing). As the volume of automotive production fluctuates, the demand for our products also fluctuates. Declines in automotive sales and production in the second half of 2008 and into 2009 lead to our focused efforts, which are ongoing, to restructure our business and take other actions in order to reduce costs. There is no assurance that our actions to date will be sustainable over the long term or will be sufficient if there is further decline. In addition, if lower levels of sales and production are forecasted, non-cash impairment charges could result as the value of certain long-lived assets is reduced. As a result, our financial condition and results of operations could be materially adversely affected by further declines in vehicle production. Production levels in Europe and North America, most notably, affect us given our concentration of sales in those regions, which accounted for 40% and 47%, respectively, of our 2009 sales.
Our supply base has also been adversely affected by the current industry environment. Lower global automotive production, turmoil in the credit markets and extreme volatility over the past several years in raw material, energy and commodity costs have resulted in financial distress within our supply base and an increase in the risk of supply disruption. In addition, several automotive suppliers have filed for bankruptcy protection or have ceased operations. While we have developed and implemented strategies to mitigate these factors, these strategies have offset only a portion of the adverse impact. The continuation or worsening of these industry conditions could adversely affect our financial condition, operating results and cash flows, thereby making it more difficult for us to make payments under our indebtedness and our 7% preferred stock.
In addition, if our suppliers were to reduce normal trade credit terms, our liquidity could be adversely impacted. Likewise, our liquidity could be adversely impacted if our customers were to extend their normal payment terms, whether or not permitted under our contracts. If either of these situations occurs, we may need to rely on other sources of funding to bridge the additional gap between the time we pay our suppliers and the time we receive corresponding payments from our customers.
As a result of the above factors, further material contraction in automotive sales and production could have a material adverse effect on our results of operations and liquidity. In addition, our suppliers would also be subject to many of the same consequences, which could adversely impact their results of operations and liquidity. If a supplier’s viability was to become impaired, it could impact the supplier’s ability to perform as we expect and consequently our ability to meet our own commitments.
15
Table of Contents
The financial conditions of our customers, particularly the Detroit 3, may adversely affect our results of operations and financial condition.
Significantly lower global production levels, tightened liquidity and increased costs of capital have combined to cause severe financial distress among many of our customers and have forced those companies to implement various forms of restructuring actions. In some cases, these actions have involved significant capacity reductions, the discontinuation of entire vehicle brands or even reorganization under bankruptcy laws. Discontinuation of a brand can result in not only a loss of sales associated with any systems or components we supplied but also customer disputes regarding capital we expended to support production of such systems or components for the discontinued brand, and such disputes could potentially be resolved adversely to us.
In North America, Chrysler, Ford and GM have been engaged in unprecedented restructuring, which included, in the case of Chrysler and GM, reorganization under bankruptcy laws and subsequent asset sales. While portions of Chrysler and GM have successfully emerged from bankruptcy proceedings in the United States, it is still uncertain what portion of their respective sales will return and whether they can be viable at a lower level of sales.
We may not be able to generate sufficient cash to service all of our indebtedness and meet the dividend obligations of our 7% preferred stock, and we may be forced to take other actions to satisfy our obligations under our indebtedness and 7% preferred stock, which may not be successful.
Our ability to make scheduled payments on our debt and meet the dividend obligations of our 7% preferred stock or to refinance these obligations depends on our financial condition and operating performance, which is subject to prevailing economic and competitive conditions and to certain financial, business and other factors beyond our control. We cannot assure you that we will maintain a level of cash flows from operating activities sufficient to permit us to pay the principal, premium, if any, and interest on our indebtedness, and dividend obligations on our 7% preferred stock. For a description of our obligations to pay dividends on our 7% preferred stock, see “Description of Capital Stock—Preferred Stock.”
If our cash flows and capital resources are insufficient to fund our debt service obligations and our dividend obligations on our 7% preferred stock, we may be forced to reduce or delay investments and capital expenditures, or to sell assets, seek additional capital or restructure or refinance our indebtedness or our 7% preferred stock. These alternative measures may not be successful and may not permit us to meet our scheduled debt service obligations or our dividend obligations on our 7% preferred stock. If our operating results and available cash are insufficient to meet our debt service obligations or our dividend obligations on our 7% preferred stock, we could face substantial liquidity problems and might be required to dispose of material assets or operations to meet our debt service, dividend and other obligations. We may not be able to consummate those dispositions or to obtain the proceeds that we could realize from them, and these proceeds may not be adequate to meet any debt service and dividend obligations then due. Additionally, terms of our indebtedness may limit the use of the proceeds from any disposition; as a result, we may not be allowed to use proceeds from such dispositions to satisfy all current debt service and dividend obligations.
Disruptions in the financial markets are adversely impacting the availability and cost of credit, which could continue to negatively affect our business.
Disruptions in the financial markets, including the bankruptcy, insolvency or restructuring of certain financial institutions, and the general lack of liquidity continue to adversely impact the availability and cost of incremental credit for many companies, including us, and may adversely affect the availability of credit already arranged. These disruptions are also adversely affecting the U.S. and world economy, further negatively impacting consumer spending patterns in the automotive industry. In addition, as our customers and suppliers respond to rapidly changing consumer preferences, they may require access to additional capital. If required capital is not obtained or its cost is prohibitively high, their businesses would be negatively impacted, which could result in further restructuring or even reorganization under bankruptcy laws. Any such negative impact, in turn, could negatively affect our business, either through loss of sales to any of our customers so affected or through inability to meet our commitments (or inability to meet them without excess expense) because of our suppliers’ inability to perform.
16
Table of Contents
We could be adversely affected by any shortage of supplies.
In the event of a rapid increase in production demands, either we or our customers or other suppliers may experience supply shortages of raw materials or components. This could be caused by a number of factors, including a lack of production line capacity or manpower or working capital constraints. In order to manage and reduce the cost of purchased goods and services, we and others within our industry have been rationalizing and consolidating our supply base. In addition, due to the turbulence in the automotive industry, several suppliers have initiated bankruptcy proceedings or ceased operations. As a result, there is greater dependence on fewer sources of supply for certain components and materials, which could increase the possibility of a supply shortage of any particular component. If any of our customers experience a material supply shortage, either directly or as a result of a supply shortage at another supplier, that customer may halt or limit the purchase of our products. Similarly, if we or one of our own suppliers experience a supply shortage, we may become unable to produce the affected products if we cannot procure the components from another source. Such production interruptions could impede a ramp-up in vehicle production and could have a material adverse effect on our business, results of operations and financial condition.
Escalating pricing pressures from our customers may adversely affect our business.
Pricing pressure in the automotive supply industry has been substantial and is likely to continue. Virtually all vehicle manufacturers seek price reductions in both the initial bidding process and during the term of the contract. Price reductions have impacted our sales and profit margins and are expected to do so in the future. If we are not able to offset continued price reductions through improved operating efficiencies and reduced expenditures, those price reductions may have a material adverse effect on our results of operations.
We may be at risk of not being able to meet significant increases in demand.
If demand increases significantly from what has been a historical low for production over the last two years, we may have difficulty meeting such demand, particularly if such increases in demand occur rapidly. This difficulty may include not having sufficient manpower or relying on suppliers who may not be able to respond quickly to a changed environment when demand significantly increases. Our inability to meet significant increases in demand could require us to delay delivery dates and could result in customers cancelling their orders, requesting discounts or ceasing to do business with us. In addition, as demand and volumes increase, we will need to purchase more inventory, which will increase our working capital needs. If our working capital needs exceed our cash flows from operations, we will be required to use our cash balances and available borrowings, as well as potential sources of additional capital, which may not be available on satisfactory terms and in adequate amounts, if at all, to satisfy those needs.
Increasing costs for, or reduced availability of, manufactured components and raw materials may adversely affect our profitability.
The principal raw materials we purchase include fabricated metal-based components, synthetic rubber, carbon black and natural rubber. Raw materials comprise the largest component of our costs, representing approximately 45% of our total costs in 2009. A significant increase in the price of these items could materially increase our operating costs and materially and adversely affect our profit margins because it is generally difficult to pass through these increased costs to our customers. Raw material costs remain volatile and could have an adverse impact on our profitability in the foreseeable future.
Because we purchase various types of raw materials and manufactured components, we may be materially and adversely affected by the failure of our suppliers of those materials to perform as expected. This non-performance may consist of delivery delays or failures caused by production issues or delivery of non-conforming products. The risk of non-performance may also result from the insolvency or bankruptcy of one or more of our suppliers. Our suppliers’ ability to supply products to us is also subject to a number of risks to such suppliers, including availability
17
Table of Contents
of raw materials, such as steel and natural rubber, destruction of their facilities or work stoppages. In addition, our failure to promptly pay, or order sufficient quantities of inventory from, our suppliers may increase the cost of products we purchase or may lead to suppliers refusing to sell products to us at all. Our efforts to protect against and to minimize these risks may not always be effective.
We consider the production capacities and financial condition of suppliers in our selection process and expect that they will meet our delivery requirements. However, there can be no assurance that strong demand, capacity limitations, shortages of raw materials or other problems will not result in any shortages or delays in the supply of components to us.
We could be materially adversely affected if we are unable to continue to compete successfully in the highly competitive automotive parts industry.
The automotive parts industry is highly competitive. We face numerous competitors in each of the product lines we serve. In general, there are three or more significant competitors and numerous smaller competitors for most of the products we offer. We also face increased competition for certain of our products from suppliers producing in lower-cost countries such as Korea and China, especially for certain lower-technology noise, vibration and harshness control products that have physical characteristics that make long-distance shipping more feasible and economical. We may not be able to continue to compete favorably, and increased competition in our markets may have a material adverse effect on our business.
We are subject to other risks associated with our non-U.S. operations.
We have significant manufacturing operations outside the United States, including joint ventures and other alliances. Our operations are located in 18 countries, and we export to several other countries. In 2009, approximately 73% of our sales were attributable to products manufactured outside the United States. Risks are inherent in international operations, including:
| • | exchange controls and currency restrictions; |
| • | currency fluctuations and devaluations; |
| • | changes in local economic conditions; |
| • | changes in laws and regulations, including the imposition of embargos; |
| • | exposure to possible expropriation or other government actions; and |
| • | unsettled political conditions and possible terrorist attacks. |
These and other factors may have a material adverse effect on our international operations or on our business, results of operations and financial condition. For example, we are faced with potential difficulties in staffing and managing local operations, and we have to design local solutions to manage credit risks of local customers and distributors. Also, the cost and complexity of streamlining operations in certain European countries is greater than would be the case in the United States, due primarily to labor laws in those countries that can make reducing employment levels more time-consuming and expensive than in the United States. Our flexibility in our foreign operations can also be somewhat limited by agreements we have entered into with our foreign joint venture partners.
Our overall success as a global business depends, in part, upon our ability to succeed in differing economic, social and political conditions. We may not continue to succeed in developing and implementing policies and strategies that are effective in each location where we do business, and failure to do so could harm our business, results of operations and financial condition.
18
Table of Contents
Our sales outside the United States expose us to currency risks. During times of a strengthening U.S. dollar, at a constant level of business, our reported international sales and earnings will be reduced because the local currency will translate into fewer U.S. dollars. In addition to currency translation risks, we incur a currency transaction risk whenever one of our operating subsidiaries enters into either a purchase or a sales transaction using a different currency from the currency in which it receives revenues. Given the volatility of exchange rates, we may not be able to manage our currency transaction and translation risks effectively, or volatility in currency exchange rates may have a material adverse effect on our financial condition or results of operations.
Our lean manufacturing and other cost savings plans may not be effective.
Our operations strategy includes cutting costs by reducing production errors, inventory levels, operator motion, overproduction and waiting while fostering the increased flow of material, information and communication. The cost savings that we anticipate from these initiatives may not be achieved on schedule or at the level anticipated by management. If we are unable to realize these anticipated savings, our operating results and financial condition may be materially adversely affected. Moreover, the implementation of cost saving plans and facilities integration may disrupt our operations and performance.
Our business could be materially adversely affected if we lost any of our largest customers.
In 2009, sales to our three largest customers, Ford, GM and Fiat, on a worldwide basis represented approximately 58% of our sales. Although business with each customer is typically split among numerous contracts, if we lost a major customer or that customer significantly reduced its purchases of our products, there could be a material adverse affect on our business, results of operations and financial condition.
We may incur material losses and costs as a result of product liability and warranty and recall claims that may be brought against us.
We may be exposed to product liability and warranty claims in the event that our products actually or allegedly fail to perform as expected or the use of our products results, or is alleged to result, in bodily injury and/or property damage. Accordingly, we could experience material warranty or product liability losses in the future and incur significant costs to defend against these claims. In addition, if any of our products are, or are alleged to be, defective, we may be required to participate in a recall of that product if the defect or the alleged defect relates to automotive safety. Our costs associated with providing product warranties could be material. Product liability, warranty and recall costs may have a material adverse effect on our business, results of operations and financial condition.
Work stoppages or similar difficulties could disrupt our operations.
As of September 30, 2010, approximately 32% of our employees were represented by unions, approximately 13% of which were located in the United States. It is possible that our workforce will become more unionized in the future. A work stoppage at one or more of our plants may have a material adverse effect on our business. Unionization activities could also increase our costs, which could have a material adverse effect on our profitability. We may be subject to work stoppages and may be affected by other labor disputes. Additionally, a work stoppage at one or more of our customers or our customers’ suppliers could materially adversely affect our operations if an alternative source of supply were not readily available. Work stoppages by employees of our customers also could result in reduced demand for our products and could have a material adverse effect on our business.
Our success depends in part on our development of improved products, and our efforts may fail to meet the needs of customers on a timely or cost-effective basis.
Our continued success depends on our ability to maintain advanced technological capabilities, machinery and knowledge necessary to adapt to changing market demands as well as to develop and commercialize innovative products. We may be unable to develop new products as successfully as in the past or to keep pace with technological developments by our competitors and the industry generally. In addition, we may develop specific
19
Table of Contents
technologies and capabilities in anticipation of customers’ demands for new innovations and technologies. If such demand does not materialize, we may be unable to recover the costs incurred in such programs. If we are unable to recover these costs or if any such programs do not progress as expected, our business, financial condition and results of operations could be materially adversely affected.
Our ability to operate our company effectively could be impaired if we fail to attract and retain key personnel.
Our ability to operate our business and implement our strategies depends, in part, on the efforts of our key employees. The severe down-turn in the automotive industry may add additional pressure on our ability to retain key employees. In addition, our future success will depend on, among other factors, our ability to attract and retain other qualified personnel. The loss of the services of any of our key employees or the failure to attract or retain other qualified personnel could have a material adverse effect on our business, financial condition and results of operations.
Our intellectual property portfolio is subject to legal challenges and considerable uncertainty.
We have developed and actively pursue the development of proprietary technology in the automotive industry and rely on intellectual property laws and a number of patents in many jurisdictions to protect such technology. There can be no assurances that the protections we have available for our proprietary technology in the United States and other countries will be available to us in many places we sell our products. Therefore, we may be unable to prevent third parties from using our intellectual property without authorization. If we had to litigate to protect these rights, any proceedings could be costly, and we may not prevail. We also face increasing exposure to the claims of others for infringement of intellectual property rights. We may have material intellectual property claims asserted against us in the future and could incur significant costs or losses related to such claims. In addition, any infringement or misappropriation of our technology that we cannot control could have a material negative impact on our business and results of operations.
Our pension plans are currently underfunded and we may have to make cash payments to the plans, reducing the cash available for our business.
We sponsor various pension plans worldwide that are underfunded and will require cash payments. Additionally, if the performance of the assets in our pension plans does not meet our expectations, or if other actuarial assumptions are modified, our required contributions may be higher than we expect. If our cash flow from operations is insufficient to fund our worldwide pension liability, we may be forced to reduce or delay capital expenditures, seek additional capital or seek to restructure or refinance our indebtedness or sell assets.
As of December 31, 2009, our $270.8 million projected benefit obligation, or PBO, for U.S. pension benefit obligations exceeded the fair value of the relevant plans’ assets, which totaled $186.6 million, by $84.2 million. Additionally, the international employees’ plans’ PBO exceeded plan assets by approximately $77.6 million as of December 31, 2009. The PBO for other postretirement benefits, or OPEB, was $69.4 million as of December 31, 2009. Our estimated funding requirement for pensions and OPEB during 2010 is approximately $18.4 million. Net periodic pension costs for U.S. and international plans, including pension benefits and OPEB, were $18.9 million and $14.4 million for the years ended December 31, 2008 and 2009, respectively. For more information, see notes 11 and 12 to our audited consolidated financial statements.
We are subject to a broad range of environmental, health and safety laws and regulations, which could adversely affect our business and results of operations.
We are subject to a broad range of federal, state and local environmental and occupational safety and health laws and regulations in the United States and other countries, including those governing: emissions to air; discharges to water; noise and odor emissions; the generation, handling, storage, transportation, treatment and disposal of waste
20
Table of Contents
materials; the cleanup of contaminated properties; and human health and safety. We may incur substantial costs associated with hazardous substance contamination or exposure, including cleanup costs, fines and civil or criminal sanctions, third party property or natural resource damage, personal injury claims or costs to upgrade or replace existing equipment as a result of violations of or liabilities under environmental laws or the failure to maintain or comply with environmental permits required at our locations. In addition, many of our current and former facilities are located on properties with long histories of industrial or commercial operations and some of these properties have been subject to certain environmental investigations and remediation activities. We maintain environmental reserves for certain of these sites, which we believe are adequate. Because some environmental laws (such as the Comprehensive Environmental Response, Compensation and Liability Act and analogous state laws) can impose liability retroactively and regardless of fault on potentially responsible parties for the entire cost of cleanup at currently or formerly owned and operated facilities, as well as sites at which such parties disposed or arranged for disposal of hazardous waste, we could become liable for investigating or remediating contamination at our current or former properties or other properties (including offsite waste disposal locations). We may not always be in complete compliance with all applicable requirements of environmental law or regulation, and we may receive notices of violation or become subject to enforcement actions or incur material costs or liabilities in connection with such requirements. In addition, new environmental requirements or changes to interpretations of existing requirements, or in their enforcement, could have a material adverse effect on our business, results of operations and financial condition. For example, while we are not large emitters of greenhouse gases, laws, regulations and certain regional initiatives under consideration by the U.S. Congress, the U.S. Environmental Protection Agency and various states, and in effect in certain foreign jurisdictions, could result in increased operating costs to control and monitor such emissions. We have made and will continue to make expenditures to comply with environmental requirements. While our costs to defend and settle claims arising under environmental laws in the past have not been material, such costs may be material in the future.
If our acquisition strategy is not successful, we may not achieve our growth and profit objectives.
We may selectively pursue complementary acquisitions in the future as part of our growth strategy. While we will evaluate business opportunities on a regular basis, we may not be successful in identifying any attractive acquisitions. We may not have, or be able to raise on acceptable terms, sufficient financial resources to make acquisitions. Our ability to make investments may also be limited by the terms of our existing or future financing arrangements. In addition, any acquisitions we make will be subject to all of the risks inherent in an acquisition strategy, including integrating financial and operational reporting systems, establishing satisfactory budgetary and other financial controls, funding increased capital needs and overhead expenses, obtaining management personnel required for expanded operations and funding cash flow shortages that may occur if anticipated sales are not realized or are delayed, whether by general economic or market conditions or unforeseen internal difficulties.
Because of our adoption of “fresh-start” accounting and the effects of the transactions contemplated by our plan of reorganization, financial information subsequent to May 31, 2010, will not be comparable to financial information prior to May 31, 2010.
Upon our emergence from Chapter 11 bankruptcy proceedings, we adopted “fresh-start” accounting in accordance with the provisions of ASC 852, pursuant to which our reorganization value was allocated to our assets in conformity with the procedures specified by ASC 805, “Business Combinations.” The excess of reorganization value over the fair value of tangible and identifiable intangible assets was recorded as goodwill, which is subject to periodic evaluation for impairment. Liabilities, other than deferred taxes, were recorded at the present value of amounts expected to be paid. In addition, under “fresh-start” accounting, common stock, retained deficit and accumulated other comprehensive loss were eliminated. Our consolidated financial statements also reflect all of the transactions contemplated by our plan of reorganization. Accordingly, our consolidated financial statements subsequent to May 31, 2010, will not be comparable in many respects to our consolidated financial statements prior to May 31, 2010. The lack of comparable historical financial information may discourage investors from purchasing our capital stock.
21
Table of Contents
Our historical financial statements state that uncertainties related to our emergence from bankruptcy raise substantial doubt about our ability to continue as a going concern.
The financial statements included in this prospectus state that uncertainties related to our emergence from bankruptcy raise substantial doubt about our ability to continue as a going concern. Although we believe that as of our emergence from bankruptcy the basis for the uncertainties relating to our ability to continue as a going concern no longer exist, we cannot assure you that a similar disclosure will not be included in our future financial statements.
Regardless of the foregoing, our historical financial statements have been prepared in accordance with U.S. GAAP applicable to a going concern, which assumes that we will be able to meet our obligations and continue our operations over a reasonable length of time. Realization values may be substantially different from carrying values as shown, and these financial statements do not give effect to adjustments that would be necessary to the carrying values and classification of assets and liabilities should we be unable to continue as a going concern.
Our emergence from bankruptcy will reduce or eliminate our U.S. net operating losses and other tax attributes and limit our ability to offset future U.S. taxable income with tax losses and credits incurred prior to our emergence from bankruptcy.
The discharge of a debt obligation by a taxpayer in a bankruptcy proceeding for an amount less than its adjusted issue price (as defined for tax purposes) generally creates cancellation of indebtedness income, or COD income, that is excludable from a taxpayer’s taxable income. However certain tax attributes otherwise available and of value to a debtor will be reduced to the extent of the excludable COD income. Additionally, Internal Revenue Code Sections 382 and 383 provide an annual limitation with respect to the ability of a corporation to utilize its tax attributes, as well as certain built-in-losses, against future U.S. taxable income in the event of a change in ownership. As a result of our emergence from bankruptcy we have had significant excludable COD income that will reduce or eliminate our U.S. net operating losses and other tax attributes and we have had an ownership change and a resulting limitation under Internal Revenue Code Sections 382 and 383.
Impairment charges relating to our goodwill and long-lived assets could adversely affect our results of operations.
We regularly monitor our goodwill and long-lived assets for impairment indicators. In conducting our goodwill impairment testing, we compare the fair value of each of our reporting units to the related net book value. In conducting our impairment analysis of long-lived assets, we compare the undiscounted cash flows expected to be generated from the long-lived assets to the related net book values. Changes in economic or operating conditions impacting our estimates and assumptions could result in the impairment of our goodwill or long-lived assets. In the event that we determine that our goodwill or long-lived assets are impaired, we may be required to record a significant charge to earnings, which could adversely affect our results of operations.
We cannot be certain that our emergence from bankruptcy will not adversely affect our operations going forward.
Although we emerged from bankruptcy on May 27, 2010, we cannot assure you that having been subject to bankruptcy protection will not adversely affect our operations going forward, including our ability to negotiate favorable terms from suppliers, hedging counterparties and others and to attract and retain customers. The failure to obtain such favorable terms and retain customers could materially adversely affect our financial performance.
22
Table of Contents
Risks Related to Our Equity Securities
Our common stock and warrants are currently quoted on the OTC Bulletin Board, which may limit the liquidity and price of our common stock and warrants more than if these securities were quoted or listed on a national securities exchange. In addition, an active trading market for our 7% preferred stock does not exist and may not develop.
Our common stock and warrants are currently quoted on the OTC Bulletin Board, an inter-dealer automated quotation system. To date, there has been a limited trading market for our common stock and warrants on the OTC Bulletin Board. Daily trading volume in shares of our common stock has averaged approximately 30,267 shares since our common stock has been quoted on the OTC Bulletin Board and daily trading volume in our warrants has averaged approximately 1,824 warrants since our warrants have been quoted on the OTC Bulletin Board. Although our common stock and warrants are quoted on the OTC Bulletin Board, only a limited trading market has developed for the purchase and sale of these securities and a more liquid market may not develop. We cannot predict how liquid the market for our common stock and warrants might become. In addition, there are risks associated with trading securities quoted on the OTC Bulletin Board compared to securities traded on a national securities exchange, including limited availability of order information and market data, liquidity risks and communications risks. In addition, an active trading market for our 7% preferred stock does not exist and may not develop. Our 7% preferred stock is not quoted on the OTC Bulletin Board and is not listed on any securities exchange. Since our 7% preferred stock has no stated maturity date, investors seeking liquidity will be limited to selling their shares of 7% preferred stock in the secondary market or converting their shares of 7% preferred stock into shares of our common stock and subsequently seeking to sell those shares of common stock.
We cannot assure you that an active trading market for our 7% preferred stock will develop or, even if one develops, we cannot assure you that it will last. As a result of the limited trading market for our common stock and warrants and the absence of any market for our 7% preferred stock, the trading price of our common stock, warrants and 7% preferred stock could be materially adversely affected and holders’ ability to transfer these securities will be limited. For the foregoing reasons, the purchase of our securities must be considered a long-term investment acceptable only for prospective investors who are willing and can afford to accept and bear the substantial risk of the investment for an indefinite period of time. In addition, an investor in our securities may not be able to liquidate his or her investment, and our securities may not be acceptable as collateral for a loan.
The price of our common stock has been and may continue to be volatile, and such volatility could adversely affect our business and cause our stockholders to suffer significant losses.
There is a limited trading market for our common stock, and its price may be volatile in the indefinite future. Since trading of our common stock began being quoted on the OTC Bulletin Board on May 25, 2010, the high and low sale prices of our common stock through November 11, 2010 were $49.55 and 27.45, respectively. The price at which our common stock will trade may be volatile due to various factors, many of which are beyond our control, including the following:
| • | changes in our industry or the auto industry generally; |
| • | increased competition and competitive pricing pressures; |
| • | our ability to execute our business plan; |
| • | regulatory or political developments; |
| • | litigation and government investigations; |
| • | changes or proposed changes in governmental regulations affecting our business; |
| • | our ability to obtain working capital or project financing; |
| • | additions or departures of key personnel; |
| • | market conditions in the broader stock market in general; |
23
Table of Contents
| • | limited “public float” in the hands of a small number of persons, whose sales or lack of sales could result in positive or negative pricing pressure on the market price for our common stock; |
| • | actual or anticipated fluctuations in our financial condition or annual or quarterly results of operations; |
| • | changes in investors’ and financial analysts’ perception of the business risks and conditions of our business; |
| • | changes in, or our failure to meet, earnings estimates and other performance expectations of investors or financial analysts; |
| • | unfavorable commentary or downgrades of our common stock by equity research analysts, or the announcement of any changes to our credit rating; |
| • | changes in the market valuations of companies in our industry viewed as similar to us; |
| • | depth of trading activity in our common stock; |
| • | future sales of our common stock; |
| • | the granting or exercise of employee stock options or other equity awards; |
| • | general market and economic conditions; and |
| • | realization of any of the risks described elsewhere in this prospectus under “Risk Factors.” |
In addition, the equity markets have from time to time experienced significant price and volume fluctuations that are unrelated to the operating performance of particular companies. These broad market fluctuations may result in a material decline in the market price of our common stock and holders may not be able to sell their shares at prices they deem acceptable.
We have no present intention to pay dividends on our common stock and, even if we change that policy, we may be unable to pay dividends on our common stock.
We have not paid any dividends to date on our common stock and we do not currently anticipate paying any dividends on our common stock in the foreseeable future. We currently intend to retain future earnings, if any, to finance operations and invest in our business. Any declaration and payment of future dividends to holders of our common stock will be at the discretion of our board of directors and will depend on many factors, including our financial condition, earnings, capital requirements, level of indebtedness, statutory and contractual restrictions applying to the payment of dividends and other considerations that our board of directors deems relevant. In addition, the covenants of the credit agreement governing our senior ABL facility and the indenture governing our senior notes limit our ability to pay dividends on our common stock and limit the ability of our subsidiaries to pay dividends to us. Furthermore, we are permitted under our senior ABL facility and the indenture governing our notes senior to incur additional indebtedness, which in turn may severely restrict or prohibit the payment of dividends. Our future dividend policy will also depend on the limitations of financing instruments and arrangements to which we may become a party.
If we change that policy and commence paying dividends, we will not be obligated to continue paying those dividends and our stockholders will not be guaranteed, or have contractual or other rights, to receive dividends. If we commence paying dividends in the future, our board of directors may decide, in its discretion, at any time, to decrease the amount of dividends, otherwise modify or repeal the dividend policy or discontinue entirely the payment of dividends. Furthermore, Cooper-Standard Holdings Inc. is a holding company with no significant operations or material assets other than the equity interests it holds in its subsidiaries through which Cooper-Standard Holdings Inc. conducts all of its business operations. As a result, its ability to pay dividends is dependent on the generation of cash flow by its subsidiaries and their ability to make such cash available, by dividend or otherwise. Under the Delaware General Corporate Law, as amended, or the DGCL, our board of directors may not authorize the payment of a dividend unless it is either paid out of our surplus, as calculated in accordance with the DGCL, or if we do not have a surplus, it is paid out of our net profits for the fiscal year in which the dividend is declared and/or the preceding fiscal year.
24
Table of Contents
Sales of large amounts of our common stock or the perception that sales could occur may depress our stock price.
In connection with our emergence from bankruptcy, we issued 11,181,673 shares of common stock, 1,000,000 shares of 7% preferred stock and 1,693,827 warrants to purchase shares of our common stock, which constitute “restricted securities” under Rule 144 of the Securities Act and the resale of which is covered by this registration statement. As of November 11, 2010, we had 18,376,112 shares of common stock outstanding, without giving effect to the shares issuable upon the conversion of our 7% preferred stock or issuable upon the exercise of our warrants. At the time of our emergence from bankruptcy, we granted the selling security holders rights pursuant to our plan of reorganization to cause us to file one or more shelf registration statements under the Securities Act covering resales of these securities held by them, including the shares of common stock underlying the 7% preferred stock and the warrants. This registration statement is being filed pursuant to the rights provided in our plan of reorganization. In addition, we granted the security holders that backstopped our rights offering certain registration rights, including demand registration, shelf registration and piggyback registration rights, with respect to the common stock, 7% preferred stock and warrants held by them. All of these securities may also be sold under Rule 144 under the Securities Act, depending on their holding period and subject to significant restrictions in the case of securities held by persons deemed to be our affiliates.
Sales of large blocks of shares of our common stock, whether as resales, upon the conversion of our 7% preferred stock or upon the exercise of our warrants, in the public market could lower our stock price and impair our ability to raise funds in future stock offerings.
We may in the future seek to raise funds through equity offerings, which could have a dilutive effect on our common stock.
In the future we may determine to raise capital through offerings of our common stock, securities convertible into our common stock or rights to acquire these securities or our common stock. In any case, the result would ultimately be dilutive to our common stock by increasing the number of shares outstanding. We cannot predict the effect this dilution may have on the price of our common stock.
In the event of our bankruptcy, liquidation or winding-up, our 7% preferred stock will rank senior to our common stock but junior to all of our liabilities and our subsidiaries’ liabilities.
In the event of our bankruptcy, liquidation or winding-up, our assets will be available to pay obligations on our 7% preferred stock only after all of our liabilities have been paid, but prior to any payments are made with respect to our common stock. In addition, our 7% preferred stock effectively ranks junior to all existing and future liabilities of our subsidiaries. The rights of holders of our 7% preferred stock to participate in the assets of our subsidiaries upon any liquidation or reorganization of any subsidiary will rank junior to the prior claims of that subsidiary’s creditors. In the event of our bankruptcy, liquidation or winding-up, there may not be sufficient assets remaining after paying our liabilities and our subsidiaries’ liabilities to pay amounts due on any or all of our 7% preferred stock then outstanding.
Additionally, unlike indebtedness where principal and interest customarily are payable on specified due dates, (1) dividends on our 7% preferred stock are payable only if and when declared by our board of directors or a duly authorized committee of the board, and (2) as a Delaware corporation, we are restricted to making dividend and redemption payments on our 7% preferred stock only out of legally available assets. Further, our 7% preferred stock places no restrictions on our business or operations or on our ability to incur indebtedness or engage in any transactions, except that the consent of the holders representing at least two-thirds of our outstanding 7% preferred stock is required to amend our certificate of incorporation (including the certificate of designations of the 7% preferred stock) in a manner that adversely affects the preferences, rights or powers of our 7% preferred stock or to issue additional shares of 7% preferred stock, other than shares issued as dividends paid “in-kind” or any other equity security that ranks senior to or on a parity with our 7% preferred stock. In addition, the affirmative vote of each holder of our 7% preferred stock is required for the additional issuance of shares of 7% preferred stock if such additional shares are not offered to the holders of our 7% preferred stock on the same terms on a pro rata basis.
25
Table of Contents
The market price of our 7% preferred stock and warrants will be directly affected by the market price of our common stock, which may be volatile.
To the extent that a secondary market for our 7% preferred stock or warrants develops, we believe that the market price of our 7% preferred stock and warrants will be significantly affected by the market price of our common stock. We cannot predict how the shares of our common stock will trade in the future. This may result in greater volatility in the market price of our 7% preferred stock and warrants than would be expected for non-convertible or -exercisable securities.
There may be future sales or other dilution of our common stock, including from the conversion of our 7% preferred stock, the exercise of our warrants and options and the vesting of our restricted stock, which may materially adversely affect the market price of our common stock, our 7% preferred stock or our warrants and negatively impact a holders’ investments.
We are not restricted from issuing additional common stock, including any securities that are convertible into or exercisable for, or that represent the right to receive, common stock or any substantially similar securities. In addition, quarterly dividends payable on our 7% preferred stock may be paid “in-kind,” at the Company’s option, in additional shares of 7% preferred stock. Furthermore, we may issue additional preferred stock that ranks senior to, or on a parity with, our 7% preferred stock with the applicable consent of holders of two-thirds of our 7% preferred stock. The market price of our common stock, our 7% preferred stock or our warrants could decline as a result of sales of a large number of shares of common stock, 7% preferred stock, warrants or similar securities in the market in the future or the perception that such sales could occur. For example, if we issue preferred stock in the future that has a preference over our common stock with respect to the payment of dividends or upon our liquidation, dissolution or winding-up, or if we issue preferred stock with voting rights that dilute the voting power of our common stock, the rights of holders of our common stock or the market price of our common stock could be adversely affected.
Each share of our 7% preferred stock is convertible into, and each warrant is exercisable for, at the option of the holder, shares of our common stock. The conversion or exercise of some or all of our 7% preferred stock or warrants, as applicable, will dilute the ownership interest of our existing stockholders. Any sales in the public market of our common stock issuable upon such conversion or exercise could adversely affect prevailing market prices of the outstanding shares of our common stock or 7% preferred stock or warrants. In addition, the existence of our 7% preferred stock and warrants may encourage short selling or arbitrage trading activity by market participants because the conversion of our 7% preferred stock or exercise of our warrants could depress the price of our common stock. As noted above, a decline in the market price of our common stock may negatively impact the market price for our 7% preferred stock and warrants.
Furthermore, initial grants of restricted common stock, restricted 7% preferred stock and options were made to our officers and key employees under our Management Incentive Plan.
Together with these grants, there are currently outstanding 1,052,446 shares of our 7% preferred stock that are currently convertible into 4,515,823 shares of our common stock and warrants to purchase 2,419,753 shares of our common stock. Upon the vesting of restricted shares, the conversion of our 7% preferred stock or the exercise of warrants and options, these securities would have a dilutive effect on our outstanding shares of common stock.
Until the conversion of our 7% preferred stock or the exercise of our warrants, holders of these securities do not have identical rights as holders of our common stock, but they will be subject to all changes made with respect to our common stock.
Before converting shares of our 7% preferred stock, holders of our 7% preferred stock are not entitled to any rights with respect to our common stock (other than voting rights and rights to receive dividends or other distributions on our common stock), but they are subject to all changes affecting our common stock. In addition,
26
Table of Contents
holders of warrants are not entitled to any rights with respect to our common stock (including, without limitation, voting rights and rights to receive any dividends or other distributions on our common stock), but they also will be subject to all changes affecting our common stock. See “Description of Capital Stock—Preferred Stock—Voting” and “Description of Capital Stock—Warrants.” Even though holders of our 7% preferred stock vote on an as-converted basis with holders of our common stock, they will only be entitled to exercise all of the rights of a holder of our common stock upon conversion of their 7% preferred stock and only as to matters for which the record date occurs on or after the applicable conversion date and to the extent permitted by law, although they will be subject to any changes in the powers, preferences or special rights of our common stock that may occur as a result of any stockholder action taken before the applicable conversion date. Similarly, holders of our warrants will have rights with respect to our common stock only if they receive our common stock upon exercise of the warrants and only as of the date when such holder becomes a record owner of the shares of our common stock upon such exercise. For example, with respect to warrants, if an amendment is proposed to our certificate of incorporation or bylaws requiring stockholder approval and the record date for determining the stockholders of record entitled to vote on the amendment occurs prior to the date a warrant holder is deemed to be the owner of the shares of our common stock due upon exercise of the warrants, the exercising warrant holder will not be entitled to vote on the amendment, although such holder will nevertheless be subject to any changes in the powers, preferences or special rights of our common stock.
Our 7% preferred stock is perpetual in nature.
Shares of our 7% preferred stock represent a perpetual interest in us and, unlike indebtedness, will not give rise to a claim for payment of a principal amount at a particular date. Other than in connection with a “change of control” or a “cash transaction” (as defined in the certificate of designations for our 7% preferred stock), holders of our 7% preferred stock will not have the right to call for the redemption of our 7% preferred stock. See “Description of Capital Stock—Preferred Stock—Redemption rights upon certain transactions.” Therefore, holders should be aware that they may be required to bear the financial risks of an investment in our 7% preferred stock for an indefinite period of time, unless such holders convert, at their option, their shares of 7% preferred stock into common stock.
The conversion rate of our 7% preferred stock and the exercise price of our warrants may not be adjusted for all dilutive events.
The number of shares of our common stock that holders are entitled to receive upon conversion of a share of 7% preferred stock and the exercise price of our warrants are subject to adjustment for certain events, including, but not limited to, the issuance of stock dividends on our common stock, the issuance of certain rights with respect to our common stock, subdivisions and combinations of our common stock, certain issuer tender or exchange offers and certain reorganization events. Such conversion rate or exercise price will not be adjusted, however, for other events, such as a third-party tender or exchange offer, that may adversely affect the market price of our 7% preferred stock or warrants. In addition, if any of these other events adversely affects the market price of our common stock, it may also adversely affect the market price of our 7% preferred stock and warrants. In addition, we are not restricted from offering common stock in the future or engaging in other transactions that may dilute our common stock and we may issue additional shares of 7% preferred stock and pay dividends on our 7% preferred stock “in-kind” with additional shares of 7% preferred stock, which may dilute our common stock.
A change in control with respect to us may not trigger certain rights for the purpose of our 7% preferred stock.
The certificate of designations of our 7% preferred stock contains no covenants or other provisions to afford protection to holders in the event of a change of control with respect to us, except upon the occurrence of transactions that constitute a “change of control” or a “cash transaction” as those terms are defined in the certificate of designations of our 7% preferred stock. However, the terms “change of control” and “cash transaction” are limited and may not include every change of control event that might cause the market price of our common stock or our 7% preferred stock to decline. As a result, the rights of holders of our 7% preferred
27
Table of Contents
stock upon the occurrence of a “change of control” or a “cash transaction” may not preserve the value of our 7% preferred stock in the event of certain change of control transactions with respect to us. Any change of control transaction with respect to us may also negatively affect the liquidity, value or volatility of our common stock and thereby negatively impact the value of our 7% preferred stock. Additionally, the provisions of our 7% preferred stock related to change of control transactions may have the effect of discouraging third parties from pursuing certain transactions with us, which may otherwise be in the best interest of our stockholders.
We may not have the funds necessary to redeem our 7% preferred stock following a change in control or a cash transaction.
Holders of our 7% preferred stock have the right to require us to redeem the shares of our 7% preferred stock held by them for cash upon the occurrence of a “change in control” or a “cash transaction” as those terms are defined in the certificate of designations of our 7% preferred stock. We may not have sufficient funds to redeem our 7% preferred stock at such time and may not have the ability to arrange necessary financing on acceptable terms or at all. In addition, our ability to purchase our 7% preferred stock may be limited by law or the terms of other agreements outstanding at such time. Moreover, a failure to repurchase our 7% preferred stock may also constitute an event of default under our existing or future debt agreements, and could result in the acceleration of the maturity of any existing or future outstanding indebtedness under such agreements, which would further restrict our ability to make such payments.
The adjustment to the exercise price for warrants exercised in connection with an anti-dilutive adjustment event may not adequately compensate you for any lost value of your warrants as a result of such transaction.
If a specified corporate event or transaction constituting a dilutive event occurs, under certain circumstances we will decrease the exercise price for warrants exercised in connection with such dilutive adjustment event. The decrease in the exercise price will be determined based on the date on which the dilutive event occurs or becomes effective and the price paid per share of our common stock in such dilutive event. The adjustment to the exercise price for warrants exercised in connection with a dilutive event may not adequately compensate you for any lost value of your warrants as a result of such dilutive event.
Under certain circumstances, holders may have to pay U.S. federal income tax as a result of a deemed distribution with respect to our 7% preferred stock, common stock or warrants—even if holders do not receive a corresponding distribution of cash—such as, for example, if we adjust, or fail to adjust, the conversion rate of our 7% preferred stock or the exercise price of the warrants in certain circumstances.
Holders of our 7% preferred stock, common stock and warrants may be treated as having received a constructive distribution in certain circumstances, for example if we make certain adjustments to (or certain failures to make adjustments to) the conversion rate or other terms of our 7% preferred stock or the exercise price of the warrants and such adjustment (or failure to make an adjustment) has the effect of increasing the proportionate interest of certain holders in our earnings and profits or assets. Such a distribution could be treated as a taxable dividend or capital gain for U.S. federal income tax purposes even though holders do not receive any cash with respect to such constructive distribution. In addition, non-U.S. holders (as defined in “Certain U.S. Federal Income Tax Considerations”) may be subject to U.S. federal withholding tax on any such constructive distribution on our 7% preferred stock, common stock and warrants. You are advised to consult your independent tax advisor and to read the section titled “Certain U.S. Federal Income Tax Considerations” regarding the possibility and tax treatment of any deemed distributions for U.S. federal income tax purposes.
28
Table of Contents
In addition to historical information, certain statements contained in this prospectus are forward-looking statements within the meaning of federal securities laws, and we intend that such forward-looking statements be subject to the safe-harbor created thereby. These forward-looking statements include statements concerning our plans, objectives, goals, strategies, future events, future revenue or performance, capital expenditures, financing needs, plans or intentions relating to acquisitions, business trends, the impact of “fresh-start” accounting, the impact of our bankruptcy on our future performance and other information that is not historical information. When used in this prospectus, the words “estimates,” “expects,” “anticipates,” “projects,” “plans,” “intends,” “believes,” “forecasts,” or future or conditional verbs, such as “will,” “should,” “could,” or “may,” and variations of such words or similar expressions are intended to identify forward-looking statements. All forward-looking statements, including, without limitation, management’s examination of historical operating trends and data, are based upon our current expectations and various assumptions. Our expectations, beliefs and projections are expressed in good faith and we believe there is a reasonable basis for them. However, no assurances can be made that these expectations, beliefs and projections will be achieved. Forward-looking statements are not guarantees of future performance and are subject to significant risks and uncertainties that may cause actual results or achievements to be materially different from the future results or achievements expressed or implied by the forward-looking statements.
There are a number of risks and uncertainties that could cause our actual results to differ materially from the forward-looking statements contained in this prospectus. Important factors that could cause our actual results to differ materially from the forward-looking statements we make in this prospectus are described in “Risk Factors.” Such risks and uncertainties and other important factors include, but are not limited to:
| • | our dependence on the automotive industry and the possibility of further material contractions in automotive sales and production; |
| • | our ability to generate sufficient cash to service our indebtedness and meet dividend obligations on our 7% preferred stock; |
| • | disruptions in the financial markets and the availability of and cost of credit; |
| • | viability of our supply base; |
| • | escalating pricing pressures; |
| • | our ability to meet a significant increase in demand; |
| • | availability and cost of raw materials; |
| • | our ability to compete in the highly competitive automotive parts industry; |
| • | our significant non-U.S. operations; |
| • | our dependence on certain major customers; |
| • | labor conditions; |
| • | our ability to meet our customers’ needs for new and improved products in a timely manner; |
| • | our ability to attract and retain key personnel; |
| • | our legal rights to our intellectual property portfolio; |
| • | our underfunded pension plans; |
| • | environmental and other regulation; |
| • | the possibility that our acquisition strategy will not be successful; |
| • | the lack of comparability of our financial condition and results of operations following our emergence from bankruptcy to those reflected in our historical financial statements; |
29
Table of Contents
| • | whether our future financial statements will contain disclosure about our ability to continue as a going concern; |
| • | the possibility of future impairment charges to our goodwill and long-lived assets; and |
| • | uncertainty as to the effect of our emergence from bankruptcy on our operations going forward. |
There may be other factors that may cause our actual results to differ materially from the forward-looking statements. All forward-looking statements attributable to us or persons acting on our behalf apply only as of the date of this prospectus and other reports we file with the Securities and Exchange Commission, or the SEC, and are expressly qualified in their entirety by the cautionary statements included herein and therein. We undertake no obligation to update or revise forward-looking statements to reflect events or circumstances that arise after the date made or to reflect the occurrence of unanticipated events.
30
Table of Contents
RATIO OF EARNINGS TO COMBINED FIXED CHARGES AND PREFERRED STOCK DIVIDENDS
The following table presents our ratio of earnings to combined fixed charges and preferred stock dividends for the periods indicated.
For purposes of this table, earnings consist of pre-tax income (loss) from continuing operations before adjustments for minority interest in consolidated subsidiary, plus fixed charges. Fixed charges consist of interest on all debt, amortization of debt expenses incurred on issuance and an estimate of the interest within rental expense.
| Historical | Pro Forma | |||||||||||||||||||||||||||||||||||||||||||
| Predecessor(1) | Successor(1) | |||||||||||||||||||||||||||||||||||||||||||
| Year Ended December 31, | Nine Months Ended September 30, |
Five Months Ended May 31, |
Four Months Ended September 30, |
Year Ended December 31, |
Nine Months Ended September 30, |
|||||||||||||||||||||||||||||||||||||||
| 2005 | 2006 | 2007 | 2008 | 2009 | 2009 | 2010 | 2010 | 2009 | 2010 | |||||||||||||||||||||||||||||||||||
| Ratio of earnings to combined fixed charges and preferred stock dividends(2) |
1.1x | — | — | — | — | — | 14.9x | 2.3x | — | 2.3x | ||||||||||||||||||||||||||||||||||
| (1) | We adopted “fresh-start” accounting upon our emergence from bankruptcy and became a new entity for financial reporting purposes as of June 1, 2010. Accordingly, the consolidated financial statements for the Successor are not comparable to the consolidated financial statements for the Predecessor. For a discussion of “fresh-start” accounting, see note 3 to our unaudited interim financial statements as of September 30, 2010. |
| (2) | Earnings were insufficient to cover fixed charges by $15.0 million, $119.7 million, $94.2 million and $415.9 million for the years ended December 31, 2006, 2007, 2008 and 2009, respectively and $427.0 million for the nine months ended September 30, 2009. On a pro forma basis, earnings were insufficient to cover fixed charges by $397.4 million for the year ended December 31, 2009. |
31
Table of Contents
The following table sets forth our capitalization as of September 30, 2010. This table should be read with our consolidated financial statements and the related notes thereto and “Management’s Discussion and Analysis of Financial Condition and Results of Operations” included elsewhere in this prospectus.
| As of September 30, 2010 | ||||
| (unaudited) | ||||
| (in millions) | ||||
| Debt, including current maturities: |
||||
| Current maturities of long term debt |
19.2 | |||
| Senior notes |
450.0 | |||
| Other long term debt(1) |
7.8 | |||
| Total debt, including current maturities |
477.0 | |||
| Noncontrolling interest |
2.4 | |||
| Preferred stock |
129.9 | |||
| Total equity (deficit) |
542.4 | |||
| Total capitalization |
$ | 1,151.7 | ||
| (1) | Includes foreign subsidiary debt and capitalized lease obligations. |
32
Table of Contents
We have not paid any dividends to date on our common stock and we do not currently anticipate paying any dividends on our common stock in the foreseeable future. We currently intend to retain future earnings, if any, to finance operations and invest in our business. Any declaration and payment of future dividends to holders of our common stock will be at the discretion of our board of directors and will depend on many factors, including our financial condition, earnings, capital requirements, level of indebtedness, statutory and contractual restrictions applying to the payment of dividends and other considerations that our board of directors deems relevant. In addition, the covenants of the credit agreement governing our senior ABL facility and the indenture governing our senior notes limit our ability to pay dividends on our common stock and limit the ability of our subsidiaries to pay dividends to us. Our future dividend policy will also depend on the limitations of financing instruments and arrangements to which we may become a party. See “Description of Capital Stock—Preferred Stock” and “Description of Certain Indebtedness—Senior ABL Facility.”
We will not receive any of the proceeds from the sale of the securities by the selling security holders. We may receive proceeds upon the exercise of warrants if any warrant holder pays the exercise price in cash rather than exercising on a cashless basis. Based on the initial exercise price of $27.33 per share for each warrant, if all of the warrants offered for resale under this prospectus are exercised for cash, we would receive proceeds of $46,292,292 from the issuance of shares of our common stock upon exercise of the warrants. If we receive any proceeds from the issuance of shares of our common stock upon exercise of warrants, such proceeds will be used for working capital and general corporate purposes.
MARKET FOR OUR COMMON STOCK AND WARRANTS
AND RELATED STOCKHOLDER MATTERS
Our common stock has been quoted on the OTC Bulletin Board since May 25, 2010 under the symbol “COSH” and our warrants have been quoted on the OTC Bulletin Board since June 4, 2010 under the symbol “COSHW.” No prior established public trading market existed for our common stock or warrants prior to these dates.
There currently is a limited trading market for our common stock and warrants. The following chart lists the high and low sale prices for shares of our common stock and warrants for the calendar quarter indicated through October 29, 2010. These prices are between dealers and do not include retail markups, markdowns or other fees and commissions and may not represent actual transactions.
| Common Stock | Warrants | |||||||||||||||
| Quarter Ended |
High | Low | High | Low | ||||||||||||
| June 30, 2010 |
$ | 35.75 | $ | 31.50 | $ | 17.00 | $ | 14.00 | ||||||||
| September 30, 2010 |
$ | 37.00 | $ | 27.45 | $ | 20.00 | $ | 13.00 | ||||||||
| December 31, 2010 (through November 11, 2010) |
$ | 49.55 | $ | 36.00 | $ | 22.80 | $ | 15.00 | ||||||||
The closing price of our common stock on the OTC Bulletin Board on November 11, 2010 was $46.00 per share and the closing price of our warrants on the OTC Bulletin Board on November 11, 2010 was $22.00 per warrant.
As of November 11, 2010, we had approximately 110 holders of record of our common stock, based on information provided by our transfer agent.
As of the date hereof, an aggregate of 7,544,691 shares of our common stock may be purchased upon the exercise of outstanding options, issued upon the exercise of our outstanding warrants and issued upon the conversion of our outstanding shares of 7% preferred stock.
33
Table of Contents
UNAUDITED PRO FORMA CONDENSED CONSOLIDATED FINANCIAL INFORMATION
Our unaudited pro forma condensed consolidated statement of operations is presented for the year ended December 31, 2009 and for the nine months ended September 30, 2010 and apply our accounting policies to the periods presented. As used herein, Predecessor refers to Cooper-Standard Holdings Inc. and all of our consolidated subsidiaries prior to the emergence date and Successor refers to Cooper-Standard Holdings Inc. and all of our consolidated subsidiaries on and after the emergence date. We prepared the December 31, 2009 unaudited pro forma condensed consolidated financial information by applying adjustments to our historical audited consolidated financial statements included elsewhere in this prospectus. We prepared our September 30, 2010 unaudited pro forma condensed consolidated financial information by applying adjustments to our historical unaudited consolidated financial statements included elsewhere in this prospectus. The unaudited pro forma condensed financial information gives effect to our plan of reorganization and “fresh-start” accounting as if the emergence date had occurred on January 1, 2009 for the unaudited pro forma condensed consolidated statement of operations for the year ended December 31, 2009 and the nine months ended September 30, 2010. The unaudited pro forma condensed consolidated financial information should be read in conjunction with “Use of Proceeds,” “Capitalization,” “Selected Historical Consolidated Financial Data,” “Management’s Discussion and Analysis of Financial Condition and Results of Operations,” our audited consolidated financial statements and related notes as of and for the year ended December 31, 2009 and our unaudited consolidated financial statements and related notes as of September 30, 2010, for the five months ended May 31, 2010 and the four months ended September 30, 2010, which are included elsewhere in this prospectus.
The unaudited pro forma condensed consolidated financial information is presented for informational purposes only. The unaudited pro forma condensed consolidated financial information is not necessarily indicative of what our financial position or results of operations would have been if the effectiveness of our plan of reorganization had actually occurred on January 1, 2009, and is not necessarily indicative of our future financial position or results of operations. In addition, our historical financial statements will not be comparable to our financial statements following our emergence from bankruptcy due to the effects of the consummation of our plan of reorganization as well as adjustments for “fresh-start” accounting.
The following unaudited pro forma condensed consolidated financial information adjusts historical information for the effects of:
| • | our plan of reorganization, which includes the Reorganization Adjustments; and |
| • | the estimated adjustments required under “fresh-start” accounting for the entities that emerged from the bankruptcy cases (classified as Fresh-Start Adjustments in the unaudited pro forma condensed consolidated financial information). |
Reorganization Adjustments
The unaudited pro forma condensed consolidated financial information gives effect to the following Reorganization Adjustments, our plan of reorganization and the implementation of the transactions contemplated by our plan of reorganization. These adjustments give effect to the terms of our plan of reorganization and certain underlying assumptions, which include, but are not limited to, the below.
| • | The issuance of our senior notes, which resulted in cash proceeds of $450.0 million. |
| • | The issuance of 17.5 million shares of our common stock, including 8.6 million shares offered to holders of our prepetition senior subordinated notes in connection with the rights offering, 2.6 million shares to the Backstop Parties pursuant to the commitment agreement, dated March 19, 2010, or the equity commitment agreement, and 6.3 million shares to certain holders of our prepetition senior notes and prepetition senior subordinated notes. We also issued shares of our 7% preferred stock convertible into 4.3 million shares of |
34
Table of Contents
| our common stock pursuant to the equity commitment agreement. We received cash proceeds of $355 million in connection with the rights offering and equity commitment agreement and also received the full and complete satisfaction, settlement and release of allowed prepetition senior note claims and allowed prepetition senior subordinated note claims for such shares. In addition, we also issued warrants to purchase 2.4 million shares of our common stock. |
| • | The repayment of $124.6 million of liabilities under our DIP credit agreement. On the emergence date, each holder of an allowed DIP claim received, in full and complete satisfaction, settlement and release of and in exchange for such allowed claim against the debtors, an amount in cash equal to the allowed amount of such claim. |
| • | The repayment of the $634.7 million outstanding under the credit agreement entered into in connection with the 2004 acquisition, or, including subsequent amendments thereto, our prepetition credit agreement. |
| • | The repayment of the $104.1 million outstanding of our prepetition senior notes in cash. |
| • | A decrease in interest expense, including the amortization of debt issuance costs, resulting from a lower level of debt. |
Fresh-Start Adjustments
The unaudited pro forma condensed consolidated financial information also gives effect to the following Fresh-Start Adjustments relating to the preliminary application of “fresh-start” accounting pursuant to U.S. GAAP. Under “fresh-start” accounting, reorganization value represents the fair value of the entity before considering debt and approximates the amount a willing buyer would pay for the assets of the entity immediately after the reorganization. The Pro Forma Adjustments are based on an assumed reorganization value of $1,025 million for (i) differences in assumed working capital as of the emergence date and actual working capital as reported at the balance sheet date and (ii) the inclusion of a deferred tax liability at nominal value.
As such, the following unaudited pro forma condensed consolidated financial information is not intended to represent our actual post-emergence financial condition and statement of operations, and any differences could be material.
35
Table of Contents
UNAUDITED PRO FORMA CONDENSED CONSOLIDATED STATEMENT OF OPERATIONS
For the nine months ended September 30, 2010
(dollars in millions except per share data)
| Historical | Reorganization and Fresh-Start Pro Forma Adjustments |
Pro Forma | ||||||||||||||
| Predecessor | Successor | Nine Months Ended September 30, 2010 |
||||||||||||||
| Five Months Ended May 31, 2010 |
Four Months Ended September 30, 2010 |
|||||||||||||||
| Sales |
$ | 1,009.1 | $ | 801.3 | $ | — | $ | 1,810.4 | ||||||||
| Cost of products sold |
832.2 | 665.4 | (5.3 | )(a) | 1,492.3 | |||||||||||
| Gross profit |
176.9 | 135.9 | 5.3 | 318.1 | ||||||||||||
| Selling, administration & engineering expenses |
92.1 | 91.6 | 3.6 | (b) | 187.3 | |||||||||||
| Amortization of intangibles |
0.3 | 5.1 | 6.0 | (c) | 11.4 | |||||||||||
| Restructuring |
5.9 | 1.2 | — | 7.1 | ||||||||||||
| Operating profit |
78.6 | 38.0 | (4.3 | ) | 112.3 | |||||||||||
| Interest expense, net of interest income |
(44.5 | ) | (14.2 | ) | 25.3 | (d) | (33.4 | ) | ||||||||
| Equity earnings |
3.6 | 2.5 | (0.3 | )(e) | 5.8 | |||||||||||
| Reorganization items and fresh-start adjustments, net |
660.0 | — | (660.0 | )(f) | — | |||||||||||
| Other expense |
(21.2 | ) | 5.0 | — | (16.2 | ) | ||||||||||
| Income before income taxes |
676.5 | 31.3 | (639.3 | ) | 68.5 | |||||||||||
| Provision for income tax benefit |
39.9 | 5.4 | (22.0 | )(g) | 23.3 | |||||||||||
| Net income (loss) |
636.6 | 25.9 | (617.3 | ) | 45.2 | |||||||||||
| Less: Net income attributed to noncontrolling interest |
(0.3 | ) | (0.2 | ) | — | (0.5 | ) | |||||||||
| Net income attributable to Cooper-Standard Holdings Inc. |
$ | 636.3 | $ | 25.7 | $ | (617.3 | ) | $ | 44.7 | |||||||
| Basic net income per share attributable to common stockholders of Cooper-Standard Holdings Inc. |
$ | 1.76 | (h) | |||||||||||||
| Diluted net income per share attributable to common stockholders of Cooper-Standard Holdings Inc. |
$ | 1.69 | (h) | |||||||||||||
See accompanying notes to the unaudited pro forma condensed consolidated financial statements.
36
Table of Contents
UNAUDITED PRO FORMA CONDENSED CONSOLIDATED STATEMENT OF OPERATIONS
For the year ended December 31, 2009
(dollars in millions except per share data)
| Historical | Reorganization and Fresh-Start Pro Forma Adjustments |
Pro Forma | ||||||||||
| Sales |
$ | 1,945.3 | $ | — | $ | 1,945.3 | ||||||
| Cost of products sold |
1,679.0 | 12.9 | (a) | 1,691.9 | ||||||||
| Gross profit |
266.3 | (12.9 | ) | 253.4 | ||||||||
| Selling, administration & engineering expenses |
199.5 | 0.2 | (b) | 199.7 | ||||||||
| Amortization of intangibles |
15.0 | 0.1 | (c) | 15.1 | ||||||||
| Impairment charges |
363.5 | — | (i) | 363.5 | ||||||||
| Restructuring |
32.4 | — | 32.4 | |||||||||
| Operating loss |
(344.1 | ) | (13.2 | ) | (357.3 | ) | ||||||
| Interest expense, net of interest income |
(64.3 | ) | 18.9 | (d) | (45.4 | ) | ||||||
| Equity earnings |
4.0 | (0.8 | )(e) | 3.2 | ||||||||
| Reorganization items, net |
(17.4 | ) | 17.4 | (f) | — | |||||||
| Other income |
9.9 | 2.4 | (j) | 12.3 | ||||||||
| Loss before income taxes |
(411.9 | ) | 24.7 | (387.2 | ) | |||||||
| Provision for income tax benefit |
(55.7 | ) | 1.0 | (g) | (54.7 | ) | ||||||
| Net loss |
(356.2 | ) | 23.7 | (332.5 | ) | |||||||
| Less: Net loss attributed to noncontrolling interest |
0.1 | — | 0.1 | |||||||||
| Net loss attributable to Cooper-Standard Holdings Inc. |
$ | (356.1 | ) | $ | 23.7 | $ | (332.4 | ) | ||||
| Basic net loss per share attributable to common stockholders of Cooper-Standard Holdings Inc. |
$ | (19.41 | )(h) | |||||||||
| Diluted net loss per share attributable to common stockholders of Cooper-Standard Holdings Inc. |
$ | (19.41 | )(h) | |||||||||
See accompanying notes to the unaudited pro forma condensed consolidated financial statements.
37
Table of Contents
NOTES TO THE UNAUDITED PRO FORMA CONDENSED CONSOLIDATED FINANCIAL STATEMENTS
(dollars in millions except per share and share data)
1. Basis of Presentation
The unaudited pro forma condensed consolidated statements of operations of the Successor are presented for the year ended December 31, 2009 and the nine months ended September 30, 2010 and apply the Predecessor’s accounting policies to the periods presented. We prepared the following unaudited pro forma condensed consolidated financial information by applying adjustments to our historical consolidated financial statements. These adjustments give effect to our plan of reorganization and “fresh-start” accounting guidance pursuant to U.S. GAAP, reflecting the Successor’s post-emergence balance sheet as if the emergence date had occurred on January 1, 2009 for the periods presented for the unaudited pro forma condensed consolidated statements of operations.
2. Notes to Unaudited Pro Forma Condensed Consolidated Statement of Operations
Reorganization and fresh-start pro forma adjustments
(a) Reflects the following adjustments to cost of products sold:
| Year Ended December 31, 2009 |
Nine Months Ended September 30, 2010 |
|||||||
| Adjust inventory to fair value |
$ | 7.6 | $ | (8.1 | )(1) | |||
| Adjust depreciation expense based on preliminary application of “fresh-start” accounting |
7.4 | 3.1 | ||||||
| Eliminate net hedging losses pursuant to settlement of hedges upon emergence date |
(1.6 | ) | — | |||||
| Amortization of fair value of unfavorable leases |
(0.5 | ) | (0.3 | ) | ||||
| $ | 12.9 | $ | (5.3 | ) | ||||
| (1) | Adjustment reflects the reversal of inventory fair value adjustment recorded in the month of June 2010. |
(b) Reflects adjustments to selling, administration and engineering expenses for the following items:
| Year Ended December 31, 2009 |
Nine Months Ended September 30, 2010 |
|||||||
| Eliminate bankruptcy related professional fees incurred in 2009 before bankruptcy filing |
$ | (7.7 | ) | $ | (0.4 | ) | ||
| Eliminate stock compensation expense related to Predecessor equity |
(1.4 | ) | (0.2 | ) | ||||
| Record stock compensation expense related to Successor equity |
9.9 | 4.4 | ||||||
| Amortization of fair value of unfavorable leases |
(0.6 | ) | (0.2 | ) | ||||
| $ | 0.2 | $ | 3.6 | |||||
38
Table of Contents
NOTES TO THE UNAUDITED PRO FORMA CONDENSED
CONSOLIDATED FINANCIAL STATEMENTS—(Continued)
(dollars in millions except per share and share data)
(c) Reflects adjustments to increase the amortization of intangibles based on an application of fresh-start accounting, which results in total pro forma amortization of intangibles for the periods presented as follows:
| Year Ended December 31, 2009 |
Nine Months Ended September 30, 2010 |
|||||||
| Customer contracts and relationships |
$ | 13.5 | $ | 10.2 | ||||
| Technology |
1.5 | 1.1 | ||||||
| Other |
0.1 | 0.1 | ||||||
| $ | 15.1 | $ | 11.4 | |||||
(d) Adjustments reflect the elimination of interest expense and amortization of debt issuance costs on prepetition and debtor-in-possession indebtedness and the addition of the interest expense and amortization of debt issuance costs on our senior notes and our senior ABL facility:
| Year Ended December 31, 2009 |
Nine Months Ended September 30, 2010 |
|||||||
| Eliminate Predecessor interest expense and amortization of debt issuance costs |
$ | (64.3 | ) | $ | (44.5 | ) | ||
| Add new interest on the following debt: |
||||||||
| Interest on our senior notes and our senior ABL facility (including letter of credit charges) |
40.5 | 16.7 | ||||||
| Amortization of debt issuance costs |
3.0 | 1.2 | ||||||
| Interest on other debt |
1.9 | 1.3 | ||||||
| Net reduction in interest expense |
$ | (18.9 | ) | $ | (25.3 | ) | ||
A 0.125% increase or decrease in the effective interest rate used above would increase or decrease the pro forma interest expense by $0.6 million and $0.5 million for the year ended December 31, 2009 and the nine months ended September 30, 2010, respectively.
(e) Reflects amortization for the fair value adjustment on the equity investment related to joint ventures.
(f) Reflects the elimination of reorganization items incurred after filing for bankruptcy in 2009.
(g) Reflects the change in estimated total income tax provision through Reorganization and Pro Forma Adjustments using expected country specific effective income tax rates. No income tax provision adjustment was made on the portion of the pre-tax adjustments attributable to operations with anticipated valuation allowances.
39
Table of Contents
NOTES TO THE UNAUDITED PRO FORMA CONDENSED
CONSOLIDATED FINANCIAL STATEMENTS—(Continued)
(dollars in millions except per share and share data)
(h) The information used to compute, and the calculation of, basic and diluted earnings per share, after giving effect to our new equity capital structure, is set forth below:
| Year Ended December 31, 2009 |
Nine Months Ended September 30, 2010 |
|||||||
| Income (loss) attributable to common stockholders of Cooper-Standard Holdings, Inc. |
$ | (332.4 | ) | 44.7 | ||||
| Less dividends declared or accumulated on 7% preferred stock |
(7.0 | ) | (5.8 | ) | ||||
| Less undistributed earnings allocated to participating securities |
— | (7.7 | ) | |||||
| Income (loss) available to common stockholders of Cooper-Standard |
$ | (339.4 | ) | $ | 31.2 | |||
| Average shares outstanding-basic |
17,489,693 | 17,749,738 | ||||||
| Effect of dilutive securities: |
||||||||
| Options |
— | 11,014 | ||||||
| Common restricted stock |
— | 220,439 | ||||||
| Preferred restricted stock |
— | 52,890 | ||||||
| Warrants |
— | 437,680 | ||||||
| Average shares outstanding-diluted |
17,489,693 | 18,471,761 | ||||||
In 2009, basic and diluted average shares outstanding were the same because the effect of potential shares of common stock was antidilutive. In addition, in 2009, no undistributed loss was allocated to participating securities based on the contractual obligations of the securities. For 2010, diluted net income per share attributable to Cooper-Standard Holdings Inc. was computed using the treasury stock method as the two class method was anti-dilutive.
(i) Although fresh-start accounting will result in an adjustment to the historical cost basis of our assets, no adjustments have been made to the goodwill impairment charge of $157.2 million, the impairment charge of $202.4 million related to certain intangible assets and the impairment charge of $3.9 million related to certain fixed assets.
(j) Reflects the elimination of losses on interest rate swaps recorded in 2009 to reflect the settlement of these instruments upon our emergence from bankruptcy.
40
Table of Contents
SELECTED HISTORICAL CONSOLIDATED FINANCIAL DATA
The following table sets forth our selected consolidated financial data, consisting of statement of operations, balance sheet, statement of cash flows and other financial data, for each of the periods indicated. The following selected consolidated financial data has been derived from our audited consolidated financial statements as of December 31, 2008 and 2009 and for the years ended December 31, 2007, 2008 and 2009, which are included elsewhere in this prospectus, and from our audited consolidated financial statements as of December 31, 2005, 2006 and 2007 and for the years ended December 31, 2005 and 2006, which are not included in this prospectus, all of which have been audited by Ernst & Young LLP, independent registered public accountants. Ernst & Young LLP’s report on the consolidated financial statements for the year ended December 31, 2009, which appears elsewhere herein, includes an explanatory paragraph which describes an uncertainty about our ability to continue as a going concern. The data should be read in conjunction with the consolidated financial statements, related notes and other financial information included herein. The following selected consolidated financial data as of September 30, 2009 and 2010 and for the nine months ended September 30, 2009, the five months ended May 31, 2010 and the four months ended September 30, 2010 has been derived from our unaudited consolidated financial statements included elsewhere in this prospectus.
We adopted “fresh-start” accounting upon our emergence from bankruptcy and became a new entity for financial reporting purposes as of June 1, 2010. Accordingly, the consolidated financial statements for the Successor are not comparable to the consolidated financial statements for the Predecessor. For a discussion of “fresh-start” accounting, see note 3 to our unaudited interim financial statements as of September 30, 2010.
We have prepared the unaudited selected consolidated financial data as of and for the nine months ended September 30, 2009, the five months ended May 31, 2010 and the four months ended September 30, 2010 on a basis consistent with our audited consolidated financial statements for the year ended December 31, 2009, and this information includes all adjustments (consisting of only normal recurring adjustments unless otherwise disclosed therein) that management considers necessary for a fair presentation of our financial position and results of operations for the periods indicated. Historical results are not necessarily indicative of future performance. Operating results for the four months ended September 30, 2010 are not necessarily indicative of results that may be expected for the full fiscal year.
The following selected consolidated financial data is qualified by reference to, and should be read in conjunction with, our consolidated financial statements and the notes to those statements included elsewhere in this prospectus and the information under “Capitalization” and “Management’s Discussion and Analysis of Financial Condition and Results of Operations.”
41
Table of Contents
| Predecessor | Successor | |||||||||||||||||||||||||||||||
| Year Ended December 31, | Nine Months Ended September 30, |
Five Months Ended May 31, |
Four Months Ended September 30, |
|||||||||||||||||||||||||||||
| 2005 | 2006 | 2007 | 2008 | 2009 | 2009 | 2010 | 2010 | |||||||||||||||||||||||||
| Statement of operations: |
||||||||||||||||||||||||||||||||
| Sales |
$ | 1,827.4 | $ | 2,164.3 | $ | 2,511.2 | $ | 2,594.6 | $ | 1,945.3 | $ | 1,367.6 | $ | 1,009.1 | $ | 801.3 | ||||||||||||||||
| Cost of products sold |
1,550.2 | 1,832.1 | 2,114.1 | 2,260.1 | 1,679.0 | 1,192.5 | 832.2 | 665.4 | ||||||||||||||||||||||||
| Gross profit |
277.2 | 332.2 | 397.1 | 334.5 | 266.3 | 175.1 | 176.9 | 135.9 | ||||||||||||||||||||||||
| Selling, administration & engineering expenses |
169.7 | 199.8 | 222.1 | 231.7 | 199.5 | 146.2 | 92.1 | 91.6 | ||||||||||||||||||||||||
| Amortization of intangibles |
28.2 | 31.0 | 31.9 | 31.0 | 15.0 | 14.8 | 0.3 | 5.1 | ||||||||||||||||||||||||
| Impairment charges |
— | 13.2 | 146.4 | 33.4 | 363.5 | 362.7 | — | — | ||||||||||||||||||||||||
| Restructuring |
3.0 | 23.9 | 26.4 | 38.3 | 32.4 | 32.9 | 5.9 | 1.2 | ||||||||||||||||||||||||
| Operating profit (loss) |
76.3 | 64.3 | (29.7 | ) | 0.1 | (344.1 | ) | (381.5 | ) | 78.6 | 38.0 | |||||||||||||||||||||
| Interest expense, net of interest income |
(66.6 | ) | (87.2 | ) | (89.5 | ) | (92.9 | ) | (64.3 | ) | (53.6 | ) | (44.5 | ) | (14.2 | ) | ||||||||||||||||
| Equity earnings (losses) |
2.8 | 0.2 | 2.2 | 0.9 | 4.0 | 1.7 | 3.6 | 2.5 | ||||||||||||||||||||||||
| Reorganization items, net |
— | — | — | — | (17.4 | ) | (5.6 | ) | 660.0 | — | ||||||||||||||||||||||
| Other income (expense) |
(0.1 | ) | 7.9 | (0.5 | ) | (1.4 | ) | 9.9 | 13.7 | (21.2 | ) | 5.0 | ||||||||||||||||||||
| Income (loss) before income taxes |
12.4 | (14.8 | ) | (117.5 | ) | (93.3 | ) | (411.9 | ) | (425.3 | ) | 676.5 | 31.3 | |||||||||||||||||||
| Provision for income taxes (benefit) |
2.4 | (7.3 | ) | 32.9 | 29.3 | (55.7 | ) | (31.3 | ) | 39.9 | 5.4 | |||||||||||||||||||||
| Consolidated net income (loss) |
10.0 | (7.5 | ) | (150.4 | ) | (122.6 | ) | (356.2 | ) | (394.0 | ) | 636.6 | 25.9 | |||||||||||||||||||
| Add: Net loss (income) attributable to noncontrolling interests(1) |
(1.2 | ) | (0.9 | ) | (0.6 | ) | 1.1 | 0.1 | 0.5 | (0.3 | ) | (0.2 | ) | |||||||||||||||||||
| Net income (loss) attributable to Cooper-Standard Holdings Inc. |
$ | 8.8 | $ | (8.4 | ) | $ | (151.0 | ) | $ | (121.5 | ) | $ | (356.1 | ) | $ | (393.5 | ) | $ | 636.3 | $ | 25.7 | |||||||||||
| Balance sheet data (at end of period): |
||||||||||||||||||||||||||||||||
| Cash and cash equivalents |
$ | 62.2 | $ | 56.3 | $ | 40.9 | $ | 111.5 | $ | 380.3 | $ | 253.7 | $ | 232.3 | ||||||||||||||||||
| Net working capital(2) |
162.9 | 212.1 | 249.8 | 154.5 | 240.8 | 286.9 | 230.9 | |||||||||||||||||||||||||
| Total assets |
1,734.2 | 1,911.4 | 2,162.3 | 1,818.3 | 1,737.4 | 1,651.2 | 1,862.5 | |||||||||||||||||||||||||
| Total non-current liabilities |
1,112.8 | 1,256.1 | 1,351.6 | 1,346.9 | 263.9 | 275.1 | 771.9 | |||||||||||||||||||||||||
| Total debt(3) |
902.5 | 1,055.5 | 1,140.2 | 1,144.1 | 204.3 | 154.0 | 477.0 | |||||||||||||||||||||||||
| Liabilities subject to compromise |
— | — | — | — | 1,261.9 | 1,262.3 | — | |||||||||||||||||||||||||
| Preferred Stock |
— | — | — | — | — | — | 129.9 | |||||||||||||||||||||||||
| Equity (deficit) |
$ | 317.3 | $ | 324.0 | $ | 276.8 | $ | 19.7 | $ | (306.5 | ) | $ | (341.4 | ) | $ | 544.8 | ||||||||||||||||
| Statement of cash flows data: |
||||||||||||||||||||||||||||||||
| Net cash provided (used) by: |
||||||||||||||||||||||||||||||||
| Operating activities |
$ | 113.0 | $ | 135.9 | $ | 185.4 | $ | 136.5 | $ | 130.0 | $ | 30.2 | $ | (75.4 | ) | $ | 80.3 | |||||||||||||||
| Investment activities |
(133.0 | ) | (281.8 | ) | (260.0 | ) | (73.9 | ) | (45.5 | ) | (25.2 | ) | (19.1 | ) | (23.4 | ) | ||||||||||||||||
| Financing activities |
(7.2 | ) | 147.6 | 55.0 | 14.1 | 166.1 | 118.9 | (112.6 | ) | 0.3 | ||||||||||||||||||||||
| Capital expenditures |
$ | 54.5 | $ | 82.9 | $ | 107.3 | $ | 92.1 | $ | 46.1 | $ | 25.5 | $ | 22.9 | $ | 23.5 | ||||||||||||||||
| Other financial data (unaudited): |
||||||||||||||||||||||||||||||||
| Ratio of earnings to combined fixed charges and preferred stock dividends |
1.1 | x | — | — | — | — | |
— |
|
|
14.9 |
x |
2.3 | x | ||||||||||||||||||
| (1) | Due to the implementation of ASC Topic 810, “Consolidation,” certain prior period amounts have been reclassified to conform to the current period financial statement presentation. |
| (2) | Net working capital is defined as current assets (excluding cash and cash equivalents) less current liabilities (excluding debt payable within one year). |
| (3) | Includes $175.0 million and $0.0 of borrowings under our DIP credit agreement, $0.8 million and $0.4 million in capital leases and $28.5 million and $22.6 million of other third-party debt as of December 31, 2009 and September 30, 2010, respectively. |
42
Table of Contents
MANAGEMENT’S DISCUSSION AND ANALYSIS OF FINANCIAL CONDITION AND
RESULTS OF OPERATIONS
This management’s discussion and analysis of financial condition and results of operations is intended to assist in understanding and assessing the trends and significant changes in our results of operations and financial condition. Our historical results may not indicate, and should not be relied upon as an indication of, our future performance. Our forward-looking statements reflect our current views about future events, are based on assumptions and are subject to known and unknown risks and uncertainties that could cause actual results to differ materially from those contemplated by these statements. See “Forward-Looking Statements” for a discussion of risks associated with reliance on forward-looking statements. Factors that may cause differences between actual results and those contemplated by forward-looking statements include, but are not limited to, those discussed below and elsewhere in this prospectus, particularly in “Risk Factors.” Management’s discussion and analysis of financial condition and results of operations should be read in conjunction with our condensed consolidated financial statements and our consolidated financial statements and the notes thereto included elsewhere in this prospectus.
Basis of Presentation
The financial information of the Company included in this prospectus represents our consolidated financial position as of December 31, 2008 and 2009, and for the nine-month period ended September 30, 2010, and our consolidated results of operations and cash flows for the years ended December 31, 2007, 2008 and 2009, and for the five month period ended May 31, 2010 and the four-month period ended September 30, 2010, and reflects the application of purchase accounting.
Company Overview
We design, manufacture and sell body sealing, fluid handling components, systems, subsystems and modules and Anti-Vibration Systems, or AVS, for use in passenger vehicles and light trucks manufactured by global automotive original equipment manufacturers, or OEMs. In 2009, approximately 80% of our sales consisted of original equipment sold directly to OEMs for installation on new vehicles. The remaining 20% of our sales were primarily to Tier I and Tier II suppliers and non-automotive customers. Accordingly, sales of our products are directly affected by the annual vehicle production of OEMs and, in particular, the production levels of the vehicles for which we provide specific parts. Most of our products are custom designed and engineered for a specific vehicle platform. Our sales and product development personnel frequently work directly with the OEMs’ engineering departments in the design and development of our various products.
Although each OEM may emphasize different requirements as the primary criteria for judging its suppliers, we believe success as an automotive supplier generally requires outstanding performance with respect to price, quality, service, performance, design and engineering capabilities, innovation and timely delivery. Importantly, we believe our continued commitment to investment in our design and engineering capability, including enhanced computerized software design capabilities, is important to our future success, and many of our present initiatives are designed to enhance these capabilities. In addition, in order to remain competitive we must also consistently achieve and sustain cost savings. In an effort to continuously reduce our cost structure, we seek to identify and implement “lean” initiatives, which focus on optimizing manufacturing by eliminating waste, controlling cost and enhancing productivity, and we evaluate opportunities to consolidate facilities and to relocate certain operations to lower cost countries. We believe we will continue to be successful in our efforts to improve our design and engineering capability and manufacturing processes while achieving cost savings, including through our lean initiatives.
Our OEM sales are principally generated from purchase orders issued by OEMs and as a result we have no order backlog. Once selected by an OEM to supply products for a particular platform, we typically supply those products for the life of the platform, which is normally six to eight years, although there is no guarantee that this will occur. In addition, when we are the incumbent supplier to a given platform, we believe we have a competitive advantage in winning the redesign or replacement platform.
43
Table of Contents
We provide parts to virtually every major global OEM for use on a multitude of different platforms. However, we generate a significant portion of our sales from Ford Motor Company, or Ford, “GM,” defined herein as General Motors Corporation combined with General Motors Company, and “Chrysler,” defined herein as Chrysler LLC combined with Chrysler Group LLC, or, collectively, the Detroit 3. For the year ended December 31, 2009, our sales of product on platforms produced by Ford, GM and Chrysler comprised approximately 34.8%, 15.5% and 5.5% of our sales, respectively, or 55.8% in the aggregate of our sales. Consequently, any significant reduction of our sales to, or the loss of any one of, the Detroit 3 or any significant reduction in the market shares of the Detroit 3 could have a material adverse effect on our financial results.
In the year ended December 31, 2009, approximately 47% of sales were generated in North America while approximately 53% of our sales were generated outside of North America. Because of our significant international operations, we are subject to the risks associated with doing business in other countries. Historically, our operations in Canada and Western Europe have not presented materially different risks or problems from those we have encountered in the United States, although the cost and complexity of streamlining operations in certain European countries is greater than would be the case in the United States. This is due primarily to labor laws in those countries that can make reducing employment levels more time-consuming and expensive than in the United States. We believe the risks of conducting business in less developed markets, including Brazil, China, Czech Republic, India, Korea, Mexico and Poland are sometimes greater than in the U.S., Canadian and Western European markets. This is due to the potential for currency volatility, high interest, inflation rates and the general political and economic instability that are associated with these markets.
Our Reorganization
On August 3, 2009, we along with our U.S. subsidiaries, or the debtors, filed voluntary petitions for chapter 11 bankruptcy protection in the United States Bankruptcy Court for the District of Delaware, or the Bankruptcy Court. On August 4, 2009, our Canadian subsidiary, Cooper-Standard Automotive Canada Limited, or CSA Canada, sought relief under the Companies’ Creditors Arrangement Act in the Ontario Superior Court of Justice in Toronto, Ontario, Canada, or the Canadian Court. The debtors and CSA Canada emerged from their respective insolvency proceedings on May 27, 2010, or the effective date, with approximately $480 million of funded debt, representing a reduction of over $650 million from prepetition levels.
As part of our emergence from chapter 11, we raised $450 million through the issuance of our senior notes and entered into our $125 million senior ABL facility with certain agent and lending banks. In addition, we raised $355 million through the issuance of (i) $100 million of our 7% cumulative participating convertible preferred stock, or our 7% preferred stock, to certain creditors pursuant to a commitment agreement that provided for the backstop of our rights offering, or the Backstop Parties, and (ii) $255 million of our common stock to the Backstop Parties and holders of our prepetition 8 3/8% senior subordinated notes due 2014, or our prepetition senior subordinated notes, pursuant to our rights offering. The Backstop Parties also received warrants to purchase 7% of our common stock (assuming the conversion of our 7% preferred stock) for their commitment to backstop the rights offering.
In connection with our emergence from chapter 11, amounts outstanding under our $175 million debtor-in-possession financing facility and $639.6 million of claims under our prepetition credit facility were paid in full in cash. Holders of our prepetition 7% senior notes due 2012, or our prepetition senior notes, were also paid in full in cash, except that the Backstop Parties received a distribution of our common stock in lieu of the cash payment for certain of their prepetition senior note claims. Holders of our prepetition senior subordinated notes were issued 8% of our outstanding common stock and warrants to purchase, in the aggregate, 3% of our outstanding common stock (in each case, assuming the conversion of our 7% preferred stock). In addition, our obligations under both our prepetition senior notes and our prepetition senior subordinated notes were cancelled. See “—Liquidity and Capital Resources—After Emergence from Bankruptcy Proceedings” and “Description of Certain Indebtedness” for a more detailed description of our senior notes and senior ABL facility, “Description of Capital Stock” for a more detailed description of our equity securities and “Our Reorganization” for a more detailed description of our reorganization.
44
Table of Contents
In connection with our emergence from bankruptcy, we implemented “fresh-start” accounting. As required by “fresh-start” accounting, assets and liabilities were recorded at fair value, based on values determined in connection with the implementation of our plan of reorganization. Accordingly, the consolidated financial statements for the reporting entity subsequent to emergence from bankruptcy, or the Successor, are not comparable to the consolidated financial statements for the reporting entity prior to emergence from bankruptcy, or the Predecessor. For a discussion of “fresh-start” accounting, see note 3 to our unaudited interim financial statements as of September 30, 2010.
Business Environment and Outlook
Our business is directly affected by the automotive build rates in North America and Europe. It is also becoming increasingly impacted by build rates in Brazil and Asia Pacific. New vehicle demand is driven by macro-economic and other factors, such as interest rates, manufacturer and dealer sales incentives, fuel prices, consumer confidence, employment levels, income growth trends, government incentives such as “cash for clunkers” and tax incentives. The severe global financial crisis that started in the second half of 2008 reduced vehicle demand overall with the low point occurring in 2009 with 8.6 million units in North America and 16.3 million units in Europe. IHS Automotive’s (formerly CSM Worldwide) September 2010 expected annualized light vehicle production volumes for 2010 are 11.8 million units in North America, while Europe’s volumes are expected to be 18.0 million units.
According to IHS Automotive, actual North American light vehicle production volumes for the three months ended September 30, 2010 were 3.0 million compared to 2.4 million for the three months ended September 30, 2009, an increase of approximately 25.3%, and European light vehicle production volumes for the three months ended September 30, 2010 were 4.0 million compared to 4.1 million for the three months ended September 30, 2009, a decrease of approximately 2.7%. According to IHS Automotive, actual North American light vehicle production volumes for the nine months ended September 30, 2010 were 8.9 million compared to 5.8 million for the nine months ended September 30, 2009, an increase of approximately 53.4%, and European light vehicle production volumes for the nine months ended September 30, 2010 were 13.7 million compared to 11.8 million for the nine months ended September 30, 2009, an increase of approximately 16.3%. According to IHS Automotive, North America and Europe light vehicle production volumes in the fourth quarter of 2010 is estimated at 2.8 million and 4.3 million units, respectively, which is a 0.1 million unit increase for North America and a 0.2 million unit decrease for Europe.
Competition in the automotive supplier industry is intense and has increased in recent years as OEMs have demonstrated a preference for stronger relationships with fewer suppliers. There are typically three or more significant competitors and numerous smaller competitors for most of the products we produce. Globalization and the importance to service customers around the world will continue to shape the success of suppliers going forward.
OEMs have shifted some research and development, design and testing responsibility to suppliers, while at the same time shortening new product cycle times. To remain competitive, suppliers must have state-of-the-art engineering and design capabilities and must be able to continuously improve their engineering, design and manufacturing processes to effectively service the customer. Suppliers are increasingly expected to collaborate on, or assume the product design and development of, key automotive components and to provide innovative solutions to meet evolving technologies aimed at improved emissions and fuel economy.
Pricing pressure has continued as competition for market share has reduced the overall profitability of the industry and resulted in continued pressure on suppliers for price concessions. Consolidations and market share shifts among vehicle manufacturers continues to put additional pressures on the supply chain. These pricing and market pressures, along with the reduced production volumes, will continue to drive our focus on reducing our overall cost structure through lean initiatives, capital redeployment, restructuring and other cost management processes.
45
Table of Contents
Results of Operations for the Three and Nine Month Periods Ended September 30, 2010
Results of Operations
(in thousands, except per share data)
| Predecessor | Successor | |||||||||||||
| Three Months Ended September 30, 2009 |
Three Months Ended September 30, 2010 |
|||||||||||||
| Sales |
$ | 517,842 | $ | 585,650 | ||||||||||
| Cost of products sold |
435,775 | 483,559 | ||||||||||||
| Gross profit |
82,067 | 102,091 | ||||||||||||
| Selling, administration & engineering expenses |
52,658 | 68,584 | ||||||||||||
| Amortization of intangibles |
194 | 3,842 | ||||||||||||
| Restructuring |
4,378 | 818 | ||||||||||||
| Operating profit |
24,837 | 28,847 | ||||||||||||
| Interest expense, net of interest income |
(11,914 | ) | (10,664 | ) | ||||||||||
| Equity earnings |
1,228 | 1,815 | ||||||||||||
| Reorganization items, net |
(5,642 | ) | — | |||||||||||
| Other income, net |
5,930 | 5,454 | ||||||||||||
| Income before income taxes |
14,439 | 25,452 | ||||||||||||
| Provision for income tax expense |
3,773 | 4,443 | ||||||||||||
| Consolidated net income |
10,666 | 21,009 | ||||||||||||
| Add: Net (income) loss attributed to noncontrolling interests |
181 | (176 | ) | |||||||||||
| Net income attributable to Cooper-Standard Holdings Inc. |
$ | 10,847 | $ | 20,833 | ||||||||||
| Net income available to Cooper-Standard Holdings Inc. common stockholders |
N/A | $ | 15,116 | |||||||||||
| Basic net income per share attributable to Cooper-Standard Holdings Inc. |
N/A | $ | 0.86 | |||||||||||
| Diluted net income per share attributable to Cooper-Standard Holdings Inc. |
N/A | $ | 0.83 | |||||||||||
| Predecessor | Successor | |||||||||||||
| Nine Months Ended September 30, 2009 |
Five Months
Ended May 31, 2010 |
Four Months Ended September 30, 2010 |
||||||||||||
| Sales |
$ | 1,367,656 | $ | 1,009,128 | $ | 801,292 | ||||||||
| Cost of products sold |
1,192,470 | 832,201 | 665,434 | |||||||||||
| Gross profit |
175,186 | 176,927 | 135,858 | |||||||||||
| Selling, administration & engineering expenses |
146,233 | 92,166 | 91,629 | |||||||||||
| Amortization of intangibles |
14,783 | 319 | 5,106 | |||||||||||
| Impairment charges |
362,699 | — | — | |||||||||||
| Restructuring |
32,871 | 5,893 | 1,200 | |||||||||||
| Operating profit (loss) |
(381,400 | ) | 78,549 | 37,923 | ||||||||||
| Interest expense, net of interest income |
(53,632 | ) | (44,505 | ) | (14,195 | ) | ||||||||
| Equity earnings |
1,701 | 3,613 | 2,549 | |||||||||||
| Reorganization items and fresh-start accounting adjustments, net |
(5,642 | ) | 660,048 | — | ||||||||||
| Other income (expense), net |
13,679 | (21,156 | ) | 5,024 | ||||||||||
| Income (loss) before income taxes |
(425,294 | ) | 676,549 | 31,301 | ||||||||||
| Provision (benefit) for income tax expense |
(31,339 | ) | 39,940 | 5,352 | ||||||||||
| Consolidated net income (loss) |
(393,955 | ) | 636,609 | 25,949 | ||||||||||
| Add: Net (income) loss attributed to noncontrolling interests |
496 | (322 | ) | (186 | ) | |||||||||
| Net income (loss) attributable to Cooper-Standard Holdings Inc. |
$ | (393,459 | ) | $ | 636,287 | $ | 25,763 | |||||||
| Net income available to Cooper-Standard Holdings Inc. common stockholders |
N/A | N/A | $ | 18,328 | ||||||||||
| Basic net income per share attributable to Cooper-Standard Holdings Inc. |
N/A | N/A | $ | 1.05 | ||||||||||
| Diluted net income per share attributable to Cooper-Standard Holdings Inc. |
N/A | N/A | $ | 1.00 | ||||||||||
46
Table of Contents
Three months ended September 30, 2010 compared with three months ended September 30, 2009
Sales. Our sales increased to $585.7 million in the third quarter of 2010 from $517.8 million in the third quarter of 2009, an increase of $67.9 million, or 13.1%. The improvement is a result of a significant increase in volumes primarily in North America and Asia Pacific partially offset by a decline in certain regions of Europe. The increased volume was partially offset by foreign currency exchange, which had a net unfavorable impact on sales of $10.5 million.
Gross profit. Gross profit increased $20.0 million from $82.1 million in the third quarter of 2009 to $102.1 million in the third quarter of 2010. As a percentage of sales, gross profit increased to 17.4% of sales in the third quarter of 2010 as compared to 15.8% of sales in the third quarter of 2009. The improved gross profit and gross profit margin is a result of the increase in volumes in most of the regions and our lean savings, partially offset by the restoration of certain employee pay and benefits and slightly higher raw material costs.
Selling, administration and engineering. Selling, administration and engineering expenses increased $15.9 million to $68.6 million in the third quarter of 2010 compared to $52.7 million in the third quarter of 2009, primarily due to the restoration of certain employee pay and benefits.
Restructuring. Restructuring charges decreased $3.6 million to $0.8 million in the third quarter of 2010 compared to $4.4 million in the third quarter of 2009, primarily due to timing of restructuring initiatives in 2010.
Interest expense, net. Interest expense of $10.7 million for the three months ended September 30, 2010 is primarily interest on our senior notes. Interest expense of $11.9 million for the three months ended September 30, 2009 includes interest on some of our prepetition debt obligations and debtor-in-possession financing, which were no longer outstanding upon our emergence from bankruptcy. During 2009, we ceased recording interest expense on certain prepetition debt obligations.
Other income. Other income of $5.5 million in the third quarter of 2010 compared to $5.9 million in the same period in 2009 was primarily attributable to foreign currency gains.
Provision for income tax expense (benefit). For the three months ended September 30, 2010, we recorded income tax provision of $4.4 million on earnings before income taxes of $25.5 million. This compares to an income tax provision of $3.8 million on income before income taxes of $14.4 million for the same period of 2009. Income tax rate for the three months ended September 30, 2010 differs from statutory rates due to the impact of deferred taxes recorded on income taxes on foreign earnings, the inability to record a tax benefit for pre-tax losses in the United States and certain foreign jurisdictions to the extent not offset by other categories of income, tax credits, income tax incentives, withholding taxes and other permanent items. Further, our current and future provision for income taxes will be significantly impacted by the recognition of valuation allowances in certain countries, particularly the United States. We intend to maintain these allowances until it is more likely than not that the deferred tax assets will be realized. Accordingly, income taxes are impacted by the U.S. valuation allowance and the mix of earnings among jurisdictions.
Four months ended September 30, 2010, five months ended May 31, 2010 and nine months ended September 30, 2009
Due to our adoption of fresh-start reporting on May 31, 2010, the Condensed Consolidated Statements of Operations included in our unaudited interim financial statements as of September 30, 2010 include the year-to-date results of operations for the five months ended May 31, 2010 of the Predecessor and the four months ended September 30, 2010 of the Successor.
For the period ended May 31, 2010, we recognized a gain of approximately $660.0 million for reorganization items as a result of the bankruptcy proceedings and the effects of fresh-start accounting. This gain reflects the cancellation of our prepetition equity, debt and certain of our other obligations, partially offset by the recognition of certain of our new equity and debt obligations, as well as professional fees incurred as a direct result of the bankruptcy proceedings.
47
Table of Contents
In addition, we recognized charges of approximately $9.9 million in the four months ended September 30, 2010 as a result of the bankruptcy proceedings and the adoption of fresh-start accounting. The majority of these charges related to the inventory fair value adjustment of approximately $8.1 million, which was recognized in cost of sales in the four months ended September 30, 2010 as the inventory was sold.
Sales. Sales for the four months ended September 30, 2010 were $801.3 million. Sales were favorably impacted by a significant increase in volume, partially offset by unfavorable foreign exchange of $18.0 million. Sales were $1,009.1 million for the five months ended May 31, 2010. Sales were favorably impacted by a significant increase in volume and favorable foreign exchange of $52.5 million. Sales for the nine months ended September 30, 2009 were $1,367.7 million.
Gross profit. Gross profit for the four months ended September 30, 2010 and the five months ended May 31, 2010 were $135.9 million and $176.9 million, respectively. Gross profit as a percentage of sales was 17.0% for the four months ended September 30, 2010 and 17.5% for the five months ended May 31, 2010. Gross profit and gross profit margin for these two periods were favorably impacted by a significant increase in volumes in most regions and our lean savings, partially offset by the restoration of certain employee pay and benefits and slightly higher raw material costs. The four months ended September 30, 2010 was also impacted by the liquidation of the fair value adjustment to inventory of $8.1 million, which was recognized in cost of sales as the inventory was sold. Gross profit and gross profit as a percentage of sales for the nine months ended September 30, 2009 were $175.2 million and 12.8%, respectively.
Selling, administration and engineering. Selling, administration and engineering expenses for the four months ended September 30, 2010 were $91.6 million and $92.2 million for the five months ended May 31, 2010. Both periods were primarily impacted by the restoration of certain employee pay and benefits. Selling, administration and engineering expenses were $146.2 million for the nine months ended September 30, 2009.
Impairment charges. In the second quarter of 2009, we recorded a goodwill impairment charge of $157.2 million. In addition, impairment charges of $202.5 million related to certain intangible assets and impairment charges of $3.0 million related to certain fixed assets were recorded. During the second quarter of 2009, several events occurred that indicated potential impairment of our goodwill. Such events included: a) the chapter 11 bankruptcy of two of our main customers, Chrysler LLC and General Motors, and unplanned plant shut-downs; b) continued product volume risk and negative product mix changes; c) our commencement of negotiations with our sponsors, senior secured lenders, and bondholders to recapitalize our long term debt and equity; d) our recognition as the second quarter progressed that there was an increasing likelihood that we would breach our financial covenants under our prepetition credit agreement; and e) our decision to defer our June 15, 2009 interest payment on our prepetition notes pending the outcome of our quarterly financial results, an analysis of whether we would meet our financial covenants for the past quarter and negotiations with our various constituencies. As a result of the combination of the above factors, we significantly reduced our second quarter projections.
Restructuring. Restructuring charges were $1.2 million for the four months ended September 30, 2010, $5.9 million for the five months ended May 31, 2010, primarily representing the continuation of previously announced actions, and $32.9 million for the nine months ended September 30, 2009. The nine months ended September 30, 2009 was affected by the final phase of the discontinuation of our global product line operating divisions that was initiated in the first quarter of 2009. Restructuring charges of $21.3 million of this phase were recognized for the nine months ended September 30, 2009.
Interest expense, net. Interest expense for the four months ended September 30, 2010 consisted primarily of interest on our senior notes. Interest expense for the five months ended May 31, 2010 includes $28.0 million of interest from the period August 3, 2009 through May 27, 2010 and interest on the DIP facility. The interest on the prepetition debt obligations was recorded when our plan of reorganization was approved by the claimholders. Interest expense for the nine months ended September 30, 2009 includes interest on all of our prepetition debt obligations and debtor-in-possession financing.
48
Table of Contents
Reorganization items and fresh-start accounting adjustments, net. In the five months ended May 31, 2010, we recognized a gain of $520.1 million for reorganization items as a result of the bankruptcy proceedings. This gain reflects the cancellation of our prepetition equity, debt and certain of our other obligations, partially offset by the recognition of certain of our new equity and debt obligations, as well as professional fees incurred as a direct result of the bankruptcy proceedings. In addition, we recognized a gain of $139.9 million related to the valuation of our net assets upon emergence from Chapter 11 bankruptcy proceedings pursuant to the provisions of fresh-start accounting.
Other income (expense). Other income for the four months ended September 30, 2010 was $5.0 million, which consisted primarily of foreign currency gains. Other expense of $21.2 million for the five months ended May 31, 2010, consisted primarily of foreign currency losses. For the nine months ended September 30, 2009, other income consisted of a gain of $9.1 million on the repurchase of debt, $7.8 million of foreign currency gains and $3.3 million of losses on interest rate swaps and sale of receivables.
Provision for income tax expense (benefit). For the five months ended May 31, 2010 and the four months ended September 30, 2010, we recorded income tax provisions of $39.9 million and $5.4 million on earnings before income taxes of $676.6 million and $31.3 million, respectively. This compares to an income tax benefit of $(31.3) million on losses before income taxes of $(425.3) million for the nine months ended September 30, 2009. Income tax expense for the five months ended May 31, 2010 and the four months ended September 30, 2010 differ from statutory rates due to the impact of deferred taxes recorded on fresh-start adjustments, income taxes on foreign earnings, the inability to record a tax benefit for pre-tax losses in the United States and certain foreign jurisdictions to the extent not offset by other categories of income, tax credits, income tax incentives, withholding taxes and other permanent items. Further, our current and future provision for income taxes will be significantly impacted by the recognition of valuation allowances in certain countries, particularly the United States. We intend to maintain these allowances until it is more likely than not that the deferred tax assets will be realized. Accordingly, income taxes are impacted by the U.S. valuation allowance and the mix of earnings among jurisdictions.
Results of Operations for the Year Ended December 31, 2009
| For the Year Ended December 31, | ||||||||||||
| 2007 | 2008 | 2009 | ||||||||||
| (in thousands) | ||||||||||||
| Sales |
$ | 2,511,153 | $ | 2,594,577 | $ | 1,945,259 | ||||||
| Cost of products sold |
2,114,039 | 2,260,063 | 1,678,953 | |||||||||
| Gross profit |
397,114 | 334,514 | 266,306 | |||||||||
| Selling, administration & engineering expenses |
222,134 | 231,709 | 199,552 | |||||||||
| Amortization of intangibles |
31,850 | 30,996 | 14,976 | |||||||||
| Impairment charges |
146,366 | 33,369 | 363,496 | |||||||||
| Restructuring |
26,386 | 38,300 | 32,411 | |||||||||
| Operating profit (loss) |
(29,622 | ) | 140 | (344,129 | ) | |||||||
| Interest expense, net of interest income |
(89,577 | ) | (92,894 | ) | (64,333 | ) | ||||||
| Equity earnings |
2,207 | 897 | 4,036 | |||||||||
| Reorganization items, net |
— | — | (17,367 | ) | ||||||||
| Other income (expense), net |
(468 | ) | (1,368 | ) | 9,919 | |||||||
| Loss before income taxes |
(117,460 | ) | (93,225 | ) | (411,874 | ) | ||||||
| Provision (benefit) for income tax expense |
32,946 | 29,295 | (55,686 | ) | ||||||||
| Consolidated net loss |
(150,406 | ) | (122,520 | ) | (356,188 | ) | ||||||
| Add: Net (income) loss attributed to noncontrolling interests |
(587 | ) | 1,069 | 126 | ||||||||
| Net loss attributable to Cooper-Standard Holdings Inc. |
$ | (150,993 | ) | $ | (121,451 | ) | $ | (356,062 | ) | |||
49
Table of Contents
Year ended December 31, 2009 compared to year ended December 31, 2008
Sales. Our sales decreased from $2,594.6 million in 2008 to $1,945.3 million in 2009, a decrease of $649.3 million, or 25.0%. The decrease resulted primarily from lower unit sales volume in both our North America (primarily the United States and Canada) and International (primarily Europe) segments. In addition, foreign currency exchange had a net unfavorable impact on sales of $110.8 million due to the relative strength of the dollar against other currencies (most notably the euro). Customer price concessions also contributed to our decrease in sales.
Gross profit. Gross profit decreased $68.2 million from $334.5 million in 2008 to $266.3 million in 2009. As a percentage of sales, gross profit increased to 13.7% of sales in 2009 as compared to 12.9% of sales in 2008. The decrease in gross profit resulted primarily from reduced North America and Europe volume and unfavorable product mix. The increase in gross profit margin is primarily the result of the favorable impact of management actions and various cost saving initiatives, partially offset by the lower volume.
Selling, administration and engineering. Selling, administration and engineering expenses decreased $32.2 million to $199.6 million for the year ended December 31, 2009 compared to $231.7 million for the year ended December 31, 2008. This decrease is due primarily to the favorable impact of various cost saving initiatives and management actions.
Operating profit (loss). Operating loss in 2009 was $344.1 million compared to an operating profit of $0.1 million in 2008. This decrease is primarily due to the impairment charges of $363.5 million in 2009 compared to $33.4 million in 2008, reduced volumes and unfavorable foreign exchange, partially offset by the favorable impact of management actions and various cost saving initiatives.
Impairment charges. In 2009, we recorded a goodwill impairment charge of $157.2 million and impairment charges of $202.4 million related to certain intangible assets and $3.8 million related to certain fixed assets within our North America and International segments. During the second quarter of 2009, several events occurred that indicated potential impairment of our goodwill, other intangible assets and certain fixed assets. Such events included: (a) the chapter 11 bankruptcy of both Chrysler and GM and unplanned plant shut-downs by both Chrysler and GM; (b) continued product volume risk and negative product mix changes; (c) the commencement of negotiations with our pre-reorganization affiliate shareholders, senior secured lenders and bondholders to recapitalize our long term debt and equity; (d) our recognition as the second quarter progressed that there was an increasing likelihood that we would breach our financial covenants under the prepetition credit agreement; (e) our decision to defer the June 15, 2009 interest payment on our prepetition senior notes and our prepetition senior subordinated notes pending the outcome of our quarterly financial results; (f) an analysis of whether we would meet our financial covenants for the past quarter; and (g) negotiations with our various constituencies. As a result of the combination of the above factors, we significantly reduced our second quarter projections.
In 2008, we recorded a goodwill impairment charge of $23.1 million in our International segment. This charge resulted from the weakening global economy, the global decline in vehicle production volumes and changes in product mix. Also, in 2008 we recorded intangible impairment charges of $3.9 million related to certain technology in our North America segment. Based on a discounted cash flow analysis it was determined that the historical cost of these intangible assets exceeded their fair value and impairment charges were recorded. Also, in 2008 we recorded fixed asset impairment charges of $6.4 million in our North America and International segments.
Interest expense, net. The decrease in interest expense of $28.6 million in 2009 resulted primarily from the cessation of recording interest expense on our debt obligations that are in default, decreased interest rates and decreased term loan balances.
Other income (expense). Other income was $9.9 million in 2009 as a result of foreign currency gains of $4.5 million and gains on debt repurchases of $9.1 million, partially offset by the loss on the sale of receivables of
50
Table of Contents
$1.2 million and losses on interest rate swaps of $2.4 million. Other expense of $1.4 million in 2008 was primarily a result of foreign currency losses of $0.9 million and a loss on the sale of receivables of $2.2 million, partially offset by gains on debt repurchases of $1.7 million.
Provision for income tax expense (benefit). Income taxes in 2008 included an expense of $29.3 million for an effective tax rate of 31.4% as compared to an income tax benefit of $55.7 million for an effective tax benefit rate of 13.5% in 2009. The effective tax benefit rate in 2009 differs from the statutory tax rate primarily as a result of the nondeductible nature of the goodwill impairment charge, the valuation allowances recorded on tax losses and credits generated in the United States and certain foreign jurisdictions, the benefit related to the settlement of a bi-lateral advanced pricing agreement, the distribution of income between the United States and foreign sources and other non-recurring discrete items.
Year ended December 31, 2008 compared to year ended December 31, 2007
Sales. Our sales increased from $2,511.2 million in 2007 to $2,594.6 million in 2008, an increase of $83.4 million, or 3.3%. The increase resulted primarily from the full twelve months impact of the acquisitions of nine Metzeler Automotive Profile Systems sealing systems operations in Germany, Italy, Poland, Belarus and Belgium and a joint venture interest in China, or collectively, MAPS, and a related acquisition of a joint venture interest in India, or MAP India, and the El Jarudo fuel rail manufacturing business of Automotive Components Holdings, LLC, or El Jarudo, and favorable foreign exchange rates of $70.6 million, partially offset by lower volume. In our North America segment, our sales decreased by $282.0 million primarily due to lower unit sales volume, partially offset by $6.0 million of favorable foreign currency translation. In our International segment, sales increased by $365.4 million primarily due to a combination of factors including the acquisition of MAPS and MAP India, a $64.6 million favorable impact from foreign currency translation and higher unit sales volumes, partially offset by customer price concessions.
Gross profit. Gross profit decreased $62.6 million from $397.1 million in 2007 to $334.5 million in 2008. As a percentage of sales, gross profit decreased to 12.9% of sales in 2008 as compared to 15.8% of sales in 2007. This decrease resulted primarily from reduced North America volume and unfavorable product mix.
Operating profit (loss). Operating profit in 2008 was $0.1 million compared to an operating loss reported in 2007 of $29.6 million. This increase is primarily due to the impairment charges of $146.4 million in 2007 compared to $33.4 million in 2008, partially offset by reduced volumes, increased material costs and unfavorable foreign exchange.
Impairment charges. In 2008, we recorded a goodwill impairment charge of $23.1 million in our International segment. This charge resulted from the weakening global economy, the global decline in vehicle production volumes and changes in product mix. Also, in 2008 we recorded intangible impairment charges of $3.9 million related to certain technology in our North America segment. Based on a discounted cash flow analysis it was determined that the historical cost of these intangible assets exceeded their fair value and impairment charges were recorded. Also, in 2008 we recorded fixed asset impairment charges of $6.4 million in our North America and International segments.
In 2007 we recorded a goodwill impairment charge of $142.9 million and a $3.5 million charge related to the impairment of certain intangible assets within our North America segment. These charges resulted from projected declines in anticipated production volumes and a change in the production mix for certain key platforms in North America since our 2004 acquisition as well as the impact of increases in material costs and customer price concessions in North America.
Interest expense, net. Interest expense increased by $3.3 million in 2008 primarily due to increased indebtedness resulting from the acquisition of MAPS and increased short-term borrowings.
51
Table of Contents
Other expense. Other expense of $1.4 million in 2008 was primarily a result of foreign currency losses of $0.9 million and a loss on the sale of receivables of $2.2 million, partially offset by gains on debt repurchases of $1.7 million. Other expense of $0.5 million in 2007 was primarily a result of foreign currency losses.
Provision for income tax expense (benefit). Income taxes in 2007 included an expense of $32.9 million for an effective tax rate of 28.0% as compared to income tax expense of $29.3 million for an effective tax rate of 31.4% in 2008. The effective tax rate in 2008 differs from the statutory tax rate primarily as a result of the nondeductible nature of the goodwill impairment charge, the valuation allowances recorded on tax losses and credits generated in the United States and certain foreign jurisdictions, the write-off of deferred tax assets in the United Kingdom, the distribution of income between the United States and foreign sources and other non-recurring discrete items. The effective tax rate in 2007 differs from the statutory tax rate primarily as a result of the nondeductible nature of the goodwill impairment charge, the valuation allowances recorded on tax losses and credits generated in the United States, the tax rate changes enacted during 2007 in the Czech Republic, Canada, Germany, Spain and the United Kingdom resulting in additional expense related to the impact of deferred taxes recorded in those jurisdictions, the distribution of income between the United States and foreign sources and other non-recurring discrete items.
Segment Operating Results
Through March 31, 2009, we reported our operating results in three business segments: Body & Chassis Systems, Fluid Systems and Asia Pacific. The Body & Chassis segment consisted mainly of body sealing products and components that protect vehicle interiors from weather, dust, and noise intrusion as well as systems and components that control and isolate noise vibration in a vehicle to improve ride and handling. The Fluid Systems segment consisted primarily of subsystems and components that direct, control, measure, and transport fluids and vapors throughout a vehicle. The Asia Pacific segment consisted of both Body & Chassis Systems and Fluid Systems operations in that region with the exception of our interest in a joint venture in China which was acquired as part of the MAPS acquisition, and the MAP India joint venture. These joint ventures were included in the Body & Chassis Systems segment, which was in line with the internal management structure at the time.
On March 26, 2009, we announced the implementation of a plan involving the discontinuation of its global Body & Chassis Systems and Fluid Systems segments and the establishment of a new operating structure organized on the basis of geographic regions. Under the plan, our operating structure as well as our reporting segments changed. As a result, we revised our segment disclosures beginning with the second quarter of 2009 from three reportable segments to the following two reportable segments, North America and International (comprising all of our operations outside of North America). Prior periods have been recast to conform to the current period presentation.
52
Table of Contents
We evaluate segment performance based on segment profit before tax. The following table details information on our business segments:
| Predecessor | Successor | |||||||||||||||
| Three Months Ended September 30, 2009 |
Three Months Ended September 30, 2010 |
|||||||||||||||
| (in thousands) | ||||||||||||||||
| Sales |
||||||||||||||||
| North America |
$ | 251,700 | $ | 316,585 | ||||||||||||
| International |
266,142 | 269,065 | ||||||||||||||
| $ | 517,842 | $ | 585,650 | |||||||||||||
| Segment profit (loss) |
||||||||||||||||
| North America |
$ | 20,036 | $ | 29,122 | ||||||||||||
| International |
(5,597 | ) | (3,670 | ) | ||||||||||||
| $ | 14,439 | $ | 25,452 | |||||||||||||
| Predecessor | Successor | |||||||||||||||
| Nine Months Ended September 30, 2009 |
Five Months
Ended May 31, 2010 |
Four Months Ended September 30, 2010 |
||||||||||||||
| Sales |
||||||||||||||||
| North America |
$ | 632,234 | $ | 508,738 | $ | 432,981 | ||||||||||
| International |
735,422 | 500,390 | 368,311 | |||||||||||||
| $ | 1,367,656 | $ | 1,009,128 | $ | 801,292 | |||||||||||
| Segment profit (loss) |
||||||||||||||||
| North America |
$ | (259,702 | ) | $ | 590,121 | $ | 37,255 | |||||||||
| International |
(165,592 | ) | 86,428 | (5,954 | ) | |||||||||||
| $ | (425,294 | ) | $ | 676,549 | $ | 31,301 | ||||||||||
Three months ended September 30, 2010 compared with three months ended September 30, 2009
North America. Sales increased $64.9 million, or 25.8%, primarily due to stronger sales production volume and favorable foreign exchange of $4.1 million. Segment profit for the third quarter of 2010 increased by $9.1 million compared to the third quarter of 2009. Segment profit also increased due to volume and the favorable impact of our lean savings, partially offset by the restoration of certain employee pay and benefits and slightly higher raw material costs.
International. Sales increased $2.9 million, or 1.1%, primarily due to an increase in sales volume offset by unfavorable foreign exchange of $14.6 million. Segment loss for the third quarter of 2010 improved by $1.9 million compared to the third quarter of 2009. Segment loss also improved due to the increase in volumes and the favorable impact of our lean savings. Segment loss was negatively impacted by the restoration of certain employee pay and benefits and slightly higher raw material costs.
Four months ended September 30, 2010, five months ended May 31, 2010 and nine months ended September 30, 2009
North America. Sales for the four months ended September 30, 2010 were $433.0 million. Sales were favorably impacted by a significant increase in volume and favorable foreign exchange of $6.3 million. Sales for the five months ended May 31, 2010 were $508.7 million. Sales were favorably impacted by a significant increase in volume and favorable foreign exchange of $19.3 million. Sales for the nine months ended September 30, 2009 were $632.2 million. Segment profit for the four months ended September 30, 2010 was $37.3 million, which
53
Table of Contents
was favorably impacted by the improved volumes and our lean savings, partially offset by the restoration of certain employee pay and benefits and slightly higher raw material costs. Segment profit for the five months ended May 31, 2010 was $590.1 million. As a result of the reorganization and fresh-start accounting adjustments, a gain of $565.1 million was recognized in the North America segment. Segment profit also increased due to improved volumes and the favorable impact of our lean savings, partially offset by the restoration of certain employee pay and benefits, slightly higher raw material costs and recognition of interest on certain prepetition debt obligations for the period of August 3, 2009 through May 27, 2010, which was recorded when our plan of reorganization was approved by the claimholders. Segment loss for the nine months ended September 30, 2009 was $259.7 million, which included impairment charges of $242.2 million for goodwill, intangibles and fixed assets.
International. Sales for the four months ended September 30, 2010 were $368.3 million. Sales were favorably impacted by a significant increase in volume partially offset by unfavorable foreign exchange of $24.3 million. Sales for the five months ended May 31, 2010 were $500.4 million. Sales were favorably impacted by a significant increase in volume and favorable foreign exchange of $33.2 million. Sales for the nine months ended September 30, 2009 were $735.4 million. Segment loss for the four months ended September 30, 2010 was $6.0 million, which was negatively impacted by higher raw material costs, restoration of certain employee pay and benefits and unfavorable foreign exchange partially offset by the improved volumes and our lean savings. Segment profit for the five months ended May 31, 2010 was $86.4 million. As a result of the reorganization and fresh-start accounting adjustments, a gain of $94.9 million was recognized in the International segment. Segment profit also increased due to improved volumes and the favorable impact of our lean savings, partially offset by the restoration of certain employee pay and benefits and slightly higher raw material costs. Segment loss for the nine months ended September 30, 2009 was $165.6 million, which included impairment charges of $120.5 million for goodwill, intangibles and fixed assets.
Segment Results of Operations for the Year Ended December 31, 2009
During 2007, we began reporting our operating results in the following three business segments: Body & Chassis Systems, Fluid Systems and Asia Pacific. The Body & Chassis Systems segment consisted mainly of body sealing products and components that protect vehicle interiors from weather, dust and noise intrusion as well as systems and components that control and isolate noise vibration in a vehicle to improve ride and handling. The Fluid Systems segment consisted primarily of subsystems and components that direct, control, measure and transport fluids and vapors throughout a vehicle. The Asia Pacific segment consisted of both Body & Chassis Systems and Fluid Systems operations in that region with the exception of our interest in a joint venture in China, which was acquired as part of the MAPS acquisition, and the MAP India joint venture. These joint ventures were included in the Body & Chassis Systems segment, which was in line with the internal management structure at the time. We continued to report our operating results in three business segments for all of 2008 and the first quarter of 2009.
On March 26, 2009, we announced the implementation of a plan involving the discontinuation of our Body & Chassis Systems and Fluid Systems segments and the establishment of a new operating structure organized on the basis of geographic regions. Under the plan, our operating structure as well as our reporting segments changed. As a result, we revised our segment disclosure beginning with the second quarter of 2009 from three reportable segments to the following two reportable segments, North America and International (comprising all of our operations outside of North America). Prior periods presented in this prospectus have been recast to conform to the current period presentation.
54
Table of Contents
The following table presents sales and segment loss for each of our reportable segments for the years ended December 31, 2007, 2008 and 2009:
| For the Year Ended December 31, | ||||||||||||
| 2007 | 2008 | 2009 | ||||||||||
| (in thousands) | ||||||||||||
| Sales |
||||||||||||
| North America |
$ | 1,526,458 | $ | 1,244,423 | $ | 910,306 | ||||||
| International |
984,695 | 1,350,154 | 1,034,953 | |||||||||
| $ | 2,511,153 | $ | 2,594,577 | $ | 1,945,259 | |||||||
| Segment loss |
||||||||||||
| North America |
$ | (86,723 | ) | $ | (36,662 | ) | $ | (246,015 | ) | |||
| International |
(30,737 | ) | (56,563 | ) | (165,859 | ) | ||||||
| $ | (117,460 | ) | $ | (93,225 | ) | $ | (411,874 | ) | ||||
Year ended December 31, 2009 compared to year ended December 31, 2008
North America. Sales decreased $334.1 million, or 26.8%, primarily due to lower sales volume of $302.4 million and unfavorable foreign exchange of $23.4 million. Segment loss increased by $209.4 million primarily due to the increased impairment charges of goodwill, intangibles and fixed assets of $234.9 million, lower sales volume and unfavorable foreign exchange, partially offset by the favorable impact of management actions and various cost saving initiatives.
International. Sales decreased $315.2 million, or 23.3%, primarily due to lower sales volume of $225.6 million and unfavorable foreign exchange $87.4 million. Segment loss increased by $109.3 million primarily due to the increased impairment charges of goodwill, intangibles and fixed assets of $95.2 million, lower sales volume and unfavorable foreign exchange, partially offset by the favorable impact of management actions and various cost saving initiatives.
Year ended December 31, 2008 compared to year ended December 31, 2007
North America. Sales decreased $282.0 million, or 18.5%, primarily due to lower sales volume, partially offset by favorable foreign exchange of $6.0 million. Segment loss decreased by $50.1 million as the result of a decrease of $138.5 million in impairment charges, offset by lower sales volumes and higher raw material costs in 2008.
International. Sales increased $365.5 million, or 37.1%, primarily due to the MAPS and MAP India acquisitions, favorable foreign exchange of $64.6 million, partially offset by lower sales volume. Segment loss increased by $25.8 million as the result of lower sales volume, unfavorable foreign exchange, impairment charges of $25.5 million and higher raw material costs, partially offset by the acquisitions.
Off-Balance Sheet Arrangements
As a part of our working capital management, we sell certain foreign receivables through third party financial institutions without recourse. The amount sold varies each month based on the amount of our underlying receivables and cash flow needs.
As of December 31, 2009 and September 30, 2010, we had $39.7 million and $39.0 million, respectively of receivables outstanding under receivables transfer agreements entered into by various foreign locations. For the four months ended September 30, 2010 and five months ended May 31, 2010, total accounts receivables factored was $31.5 million and $40.6 million, respectively. We incurred losses on the sale of the receivables of $0.9 million in 2009, $0.0 million for the three months ended September 30, 2010, $0.4 million for the five months ended May 31, 2010 and $0.3 million for the four months ended September 30, 2010, which are recorded in other
55
Table of Contents
income (expense) in our consolidated statements of operations. We are continuing to service receivables for one of the locations. These are permitted transactions under our credit agreement. We are also pursuing similar arrangements in various locations.
In addition, during the second quarter of 2009, we elected to participate in the Auto Supplier Support Program sponsored by the U.S. Treasury Department. The Auto Supplier Support Program is designed to provide eligible suppliers with access to government-backed protection on those Chrysler and GM U.S. dollar receivables that are accepted into the program. In applying for the program, we selected the program option that provides government-backed protection on collection of the receivables and expedited payment terms, for which a charge of 3% of the accepted receivables is applicable. We have been designated by both Chrysler and GM as an eligible supplier. During the year ended December 31, 2009, we received payments of $8.9 million and incurred charges of $0.3 million which was recorded in other income (expense) in our consolidated statements of operations.
As of December 31, 2009 and September 30, 2010, we had no other material off-balance sheet arrangements.
At December 31, 2008, we had $43.5 million of receivables outstanding under receivable transfer agreements entered into by various foreign locations. We incurred losses on the sale of the receivables for the year ended December 31, 2008 of $2.2 million, which was recorded in other income (expense) in our consolidated statements of operations.
Liquidity and Capital Resources—Prior to Emergence from Bankruptcy Proceedings
Short and long-term liquidity considerations and risks
During the pendency of the chapter 11 cases and the Canadian proceedings, our primary sources of liquidity were cash flows from operations and borrowings made under our DIP credit agreement. In addition to the cash requirements necessary to fund ongoing operations, we incurred significant professional fees and other costs in connection with the chapter 11 cases and the Canadian proceedings.
Cash flows
The following table summarizes our operating, investing and financing activities for the years ended December 31, 2007, 2008 and 2009, the nine months ended September 30, 2009, the five months ended May 31, 2010 and the four months ended September 30, 2010.
| Predecessor | Successor | |||||||||||||||||||||||
| For the Year Ended December 31, |
For the Nine Months Ended September 30, |
For the Five Months Ended May 31, |
For the Four Months Ended September 30, |
|||||||||||||||||||||
| 2007 | 2008 | 2009 | 2009 | 2010 | 2010 | |||||||||||||||||||
| (in millions) | ||||||||||||||||||||||||
| Net cash provided (used) by: |
||||||||||||||||||||||||
| Operating activities |
$ | 185.4 | $ | 136.5 | $ | 130.0 | $ | 30.2 | $ | (75.4 | ) | $ | 80.3 | |||||||||||
| Investing activities |
(260.0 | ) | (73.9 | ) | (45.5 | ) | (25.2 | ) | (19.1 | ) | (23.4 | ) | ||||||||||||
| Financing activities |
$ | 55.0 | $ | 14.1 | $ | 166.1 | $ | 118.9 | $ | (112.6 | ) | $ | 0.3 | |||||||||||
Operating activities
Cash flows provided by operations were $80.3 million for the four months ended September 30, 2010, which includes $17.0 million of cash provided by changes in operating assets and liabilities. Cash flows used in operations were $75.4 million for the five months ended May 31, 2010, which were a result of an increase in our working capital requirements due to the significant increase in volumes and $37.2 million of interest payments on our prepetition debt obligations and DIP facility. Cash flows provided by operations were $30.2 million for the nine months ended September 30, 2009, which included $28.8 million of changes in operating assets and liabilities.
Cash flow provided by operations was $130.0 million in 2009, which included $25.9 million of changes in operating assets and liabilities. Cash flow provided by operations was $136.5 million in 2008, which included $59.3 million of changes in operating assets and liabilities. Cash flow provided by operations was $185.4 million in 2007.
56
Table of Contents
Investing activities
Cash used in investing activities was $23.4 million for the four months ended September 30, 2010, which consisted primarily of $23.5 million of capital spending. Cash used in investing activities was $19.1 million for the five months ended May 31, 2010, which consisted of $22.9 million of capital spending offset by proceeds from the sale of assets and other of $3.9 million. Cash used in investing activities was $25.2 million for the nine months ended September 30, 2009, which was primarily capital spending. We anticipate that we will spend approximately $50.0 million to $60.0 million on capital expenditures for the Successor period in 2010.
Cash used in investing activities was $45.5 million in 2009, which primarily consisted of $46.1 million of capital spending. This compared to $73.9 million in 2008, which primarily consisted of $92.1 million of capital spending, partially offset by gross proceeds of $8.6 million from a sale-leaseback transaction and $4.8 million of proceeds from the sale of fixed assets. Cash used in investing activities was $260.0 million in 2007.
We anticipate that we will spend approximately $75.0 million to $85.0 million on capital expenditures in 2010.
Financing activities
Net cash provided by financing activities totaled $0.3 million for the four months ended September 30, 2010, which consisted primarily of an increase in short term debt, partially offset by dividends paid and payments on long-term debt. Net cash used in financing activities totaled $112.6 million for the five months ended May 31, 2010, which primarily resulted from activities related to our emergence from bankruptcy. Payments for settlement on our prepetition debt, DIP facility, debt issuance costs and backstop fees totaled $914.6 million. These payments were offset by cash proceeds from the rights offering conducted pursuant to our plan of reorganization of $355.0 million and our senior notes offering of $450.0 million. Net cash provided by financing activities totaled $118.9 million for the nine months ended September 30, 2009, which consisted primarily of $108.0 million of debtor-in-possession financing, net of debt issuance cost and increased short term debt partially offset by normal debt payments and repurchase of bonds.
Net cash provided by financing activities totaled $166.1 million in 2009, which consisted primarily of debtor-in-possession financing net of debt issuance costs of $154.4 million, a net increase of short-term debt, partially offset by normal debt payments and repurchases of $10.0 million aggregate principal amount of our outstanding prepetition senior notes and our prepetition senior subordinated notes for $0.7 million. Net cash provided by financing activities totaled $14.1 million in 2008, which consisted primarily of a net increase of short-term debt, partially offset by normal debt payments and repurchases of $7.2 million aggregate principal amount of our outstanding prepetition senior notes and prepetition senior subordinated notes for $5.3 million. Net cash provided by financing activities was $55.0 million in 2007.
Financing
Prepetition debt obligations. As of August 3, 2009, the date of the filing of the chapter 11 cases by the debtors, we had approximately $1.2 billion of outstanding indebtedness on a consolidated basis, of which $86.4 million consisted of draws on a senior secured revolving credit facility, $527.0 million consisted of five senior secured term loan facilities, $513.4 million consisted of our prepetition senior notes and our prepetition senior subordinated notes and $50.8 million consisted of debt on account of other credit facilities, capital leases for affiliates, swaps, and other miscellaneous obligations. As a result of the filing of the chapter 11 cases, the loan commitments of the lenders under the prepetition credit agreement were terminated (including the availability under the revolving credit facility, including with respect to standby letters of credit) and all principal and accrued and unpaid interest outstanding under the prepetition credit agreement, our prepetition senior notes and our prepetition senior subordinated notes accelerated and became due and payable, subject to an automatic stay of any action to collect, assert or recover a claim against us as a result of the commencement of the chapter 11 proceedings and applicable bankruptcy law. Effective August 3, 2009, we ceased recording interest expense on outstanding prepetition debt instruments classified as liabilities subject to compromise.
57
Table of Contents
Prepetition senior credit agreement. In connection with Cooper-Standard Holdings Inc.’s acquisition of the automotive segment of Cooper Tire & Rubber Company in 2004, or the 2004 acquisition, the Company, CSA U.S. and CSA Canada entered into a credit agreement with various lending institutions, Deutsche Bank Trust Company Americas, as administrative agent, Lehman Commercial Paper Inc., as syndication agent, and Goldman Sachs Credit Partners, L.P., UBS Securities LLC and The Bank of Nova Scotia, as co-documentation agents, or, with subsequent amendments thereto, the prepetition credit agreement, which provided for revolving credit facilities and term loan facilities. Our revolving credit facilities provided for loans in a total principal amount of up to $125.0 million with a maturity of December 2010. The term loan facilities included a Term Loan A facility of the Canadian dollar equivalent of $51.3 million with a maturity of December 2010, a Term Loan B facility of $115.0 million with a maturity of December 2011 and a Term Loan C facility of $185.0 million with a maturity of December 2011. These term loans were used to fund the 2004 acquisition. To finance, in part, the acquisition of fifteen fluid handling systems operations in North America, Europe and China from ITT Industries, Inc. and the MAPS acquisition, we also established and borrowed under two new term loan tranches, with an aggregate of $190 million borrowed in U.S. dollars and €64.725 million borrowed in euros. As of August 3, 2009, the date of the commencement of the chapter 11 proceedings, approximately $613.4 million of principal and accrued and unpaid interest was outstanding under the prepetition credit agreement, of which $86.4 million consisted of draws on the revolving credit facilities and $527.0 million consisted of five term loan facilities.
As a result of the filing of the chapter 11 cases, the loan commitments of the lenders under the prepetition credit agreement were terminated and all principal and accrued and unpaid interest outstanding under the prepetition credit agreement accelerated and became due and payable, subject to an automatic stay under applicable bankruptcy law.
Upon our emergence from bankruptcy, the prepetition credit agreement was cancelled and terminated, including all agreements relating thereto, except to the extent to allow the debtors, reorganized debtors or the administrative agent, as applicable, to make distributions pursuant to our plan of reorganization on account of claims related to such prepetition credit agreement and to perform certain other administrative duties thereunder.
Prepetition senior notes and prepetition senior subordinated notes. In connection with the 2004 acquisition, CSA U.S. issued $200 million aggregate principal amount of our prepetition senior notes, and $350 million aggregate principal amount of our prepetition senior subordinated notes. As a result of the filing of the chapter 11 cases, all principal and accrued and unpaid interest outstanding under our prepetition senior notes and our prepetition senior subordinated notes accelerated and became due and payable, subject to an automatic stay under applicable bankruptcy law.
Upon our emergence from bankruptcy, our prepetition senior notes and our prepetition senior subordinated notes were cancelled and the indentures governing such obligations were terminated, except to the extent to allow the debtors, reorganized debtors or the relevant trustee, as applicable, to make distributions pursuant to our plan of reorganization on account of claims related to such notes and perform certain other administrative duties or exercise certain protective rights thereunder.
DIP financing. In connection with the commencement of the chapter 11 cases and the Canadian proceedings, we and certain of our subsidiaries entered into a Debtor-In-Possession Credit Agreement, dated August 5, 2009, or our initial DIP credit agreement, with various lenders party thereto. On December 2, 2009, Metzeler Automotive Profile Systems GmbH, a German limited liability company, became an additional borrower under our initial DIP credit agreement. Under our initial DIP credit agreement, we borrowed an aggregate of $175 million principal amount of superpriority senior secured term loans in order to finance our operating, working capital and other general corporate needs (including the payment of fees and expenses in accordance with the orders of the Bankruptcy Court and the Canadian Court authorizing such borrowings).
In order to refinance our initial DIP credit agreement on terms more favorable to us, we and certain of our subsidiaries entered into our DIP credit agreement on December 18, 2009 with various lenders party thereto, which provided for superpriority senior secured term loans in an aggregate principal amount of up to $175 million, subject to certain conditions, and an uncommitted $25 million incremental facility.
58
Table of Contents
Following the entry of a final order by the Bankruptcy Court approving our DIP credit agreement, on December 29, 2009, we borrowed $175 million under our DIP credit agreement. All of the proceeds of the borrowings under our DIP credit agreement, together with our cash on hand, were used to repay all borrowings and amounts outstanding under our initial DIP credit agreement, and to pay related fees and expenses. We prepaid $25 million of the borrowings under our DIP credit agreement on each of January 29, 2010, March 26, 2010 and April 20, 2010. In addition, we repaid $0.2 million on March 31, 2010. The remaining balance was repaid upon our emergence from bankruptcy, at which time our DIP credit agreement was cancelled and terminated, including all agreements related thereto.
Liquidity and Capital Resources—After Emergence from Bankruptcy Proceedings
As part of our plan of reorganization, we issued $450 million of our senior notes and entered into our $125 million senior ABL facility. Proceeds from our senior notes offering, together with proceeds of the rights offering and cash on hand, was used to pay claims under the prepetition credit agreement, our DIP credit agreement and the portion of the prepetition senior notes payable in cash, in full, together with related fees and expenses. Upon our emergence from bankruptcy, we had $479.3 million of outstanding indebtedness, consisting of $450 million of our senior notes and $29.3 million in other debt of certain of our foreign subsidiaries. We intend to fund our ongoing capital and working capital requirements through a combination of cash flows from operations and borrowings under our senior ABL facility. We anticipate that funds generated by operations and funds available under our senior ABL facility will be sufficient to meet working capital requirements for the next 12 months. For a description of our senior notes and our senior ABL facility, see “Description of Certain Indebtedness.”
Based on our current and anticipated levels of operations and the condition in our markets and industry, we believe that our cash on hand, cash flow from operations and availability under our senior ABL facility will enable us to meet our working capital, capital expenditures, debt service and other funding requirements for the foreseeable future. However, our ability to fund our working capital needs, debt payments and other obligations, and to comply with the financial covenants, including borrowing base limitations, under our senior ABL facility, depends on our future operating performance and cash flow and many factors outside of our control, including the costs of raw materials, the state of the overall automotive industry and financial and economic conditions and other factors, including those described under “Risk Factors” herein. Any future acquisitions, joint ventures or other similar transactions will likely require additional capital and there can be no assurance that any such capital will be available to us on acceptable terms, if at all.
Senior ABL facility
On the date of our emergence from bankruptcy, the Company, CSA U.S., or the U.S. Borrower, CSA Canada, or the Canadian Borrower and, together with the U.S. Borrower, the Borrowers, and certain subsidiaries of the U.S. Borrower entered into a senior secured asset-based revolving credit facility, or our senior ABL facility, with certain lenders, Bank of America, N.A., as agent, or the Agent, for such lenders, Deutsche Bank Trust Company Americas, as syndication agent, and Banc of America Securities LLC, Deutsche Bank Securities Inc., UBS Securities LLC and Barclays Capital, as joint lead arrangers and bookrunners. A summary of our senior ABL facility is set forth below. Also see “Description of Certain Indebtedness—Senior ABL Facility” for more information on our senior ABL facility. This description and the description in “Description of Certain Indebtedness—Senior ABL facility” are qualified in their entirety by reference to the credit agreement governing our senior ABL facility, which is included as an exhibit to the registration statement of which this prospectus is a part.
General. Our senior ABL facility provides for an aggregate revolving loan availability of up to $125 million, subject to borrowing base availability, including a $45 million letter of credit sub-facility and a $20 million swing line sub-facility. Our senior ABL facility also provides for an uncommitted $25 million incremental loan facility, for a potential total senior ABL facility of $150 million (if requested by the Borrowers and the lenders agree to fund such increase). No consent of any lender (other than those participating in the increase) is required to effect any such increase.
59
Table of Contents
Maturity. Any borrowings under our senior ABL facility will mature, and the commitments of the lenders under our senior ABL facility will terminate, on May 27, 2014.
Borrowing base. Loan (and letter of credit) availability under our senior ABL facility is subject to a borrowing base, which at any time is limited to the lesser of: (A) the maximum facility amount (subject to certain adjustments) and (B) (i) up to 85% of eligible accounts receivable; plus (ii) up to the lesser of 70% of eligible inventory or 85% of the appraised net orderly liquidation value of eligible inventory; minus reserves established by the Agent. The accounts receivable portion of the borrowing base is subject to certain formulaic limitations (including concentration limits). The inventory portion of the borrowing base is limited to eligible inventory, as determined by an independent appraisal. The borrowing base is also subject to certain reserves, which are established by the Agent (which may include changes to the advance rates indicated above). Loan availability under our senior ABL facility is apportioned, as follows: $100 million to the U.S. Borrower and $25 million to the Canadian Borrower.
Guarantees; security. The obligations of the U.S. Borrower under our senior ABL facility and cash management arrangements and interest rate, foreign currency or commodity swaps entered into by us, in each case with the lenders and their affiliates, or, collectively, additional ABL secured obligations, are guaranteed on a senior secured basis by us and all of our U.S. subsidiaries (other than CS Automotive LLC), and the obligations of the Canadian Borrower under our senior ABL facility and additional ABL secured obligations of the Canadian Borrower and its Canadian subsidiaries are guaranteed on a senior secured basis by us, all of the Canadian subsidiaries of the Canadian Borrower and all of our U.S. subsidiaries. The U.S. Borrower guarantees the additional ABL secured obligations of its subsidiaries and the Canadian Borrower guarantees the additional ABL secured obligations of its Canadian subsidiaries. The obligations under our senior ABL facility and related guarantees are secured by a first priority lien on all of each Borrower’s and each guarantor’s existing and future personal property consisting of accounts receivable, payment intangibles, inventory, documents, instruments, chattel paper and investment property, certain money, deposit accounts and securities accounts and certain related assets and proceeds of the foregoing.
Interest. Borrowings under our senior ABL facility bear interest at a rate equal to, at the Borrowers’ option:
| • | in the case of borrowings by the U.S. Borrower, LIBOR or the base rate plus, in each case, an applicable margin; or |
| • | in the case of borrowings by the Canadian Borrower, BA rate, Canadian prime rate or Canadian base rate plus, in each case, an applicable margin. |
The initial applicable margin is 3.5% with respect to the LIBOR or BA-based borrowings and 2.5% with respect to base rate, Canadian prime rate and Canadian base rate borrowings. The applicable margin is subject, in each case, to quarterly performance pricing adjustments commencing six months after the closing date.
Covenants; events of default. Our senior ABL facility includes affirmative and negative covenants that will impose substantial restrictions on our financial and business operations, including its ability to incur and secure debt, make investments, sell assets, pay dividends or make acquisitions. Our senior ABL facility also includes a requirement to maintain a monthly fixed charge coverage ratio of no less than 1.1 to 1.0 when availability under our senior ABL facility is less than specified levels. Our senior ABL facility also contains various events of default that are customary for comparable facilities.
Our current revenue forecast for 2010 is determined from specific platform volume projections consistent with a North American and European light vehicle production estimate of 11.8 million units and 18.0 million units, respectively. Adverse changes to the vehicle production levels could have a negative impact on our future sales, liquidity, results of operations and ability to comply with our debt covenants under our senior ABL facility or any future financing arrangements we enter into. We took significant actions during the second half of 2008 and first quarter of 2009 to reduce our cost base and improve profitability. While we believe the vehicle production and other assumptions within our forecast are reasonable, we have also considered the possibility of even weaker
60
Table of Contents
demand. In addition to the potential impact of changes on our sales, our current operating performance and future compliance with the covenants under our senior ABL facility or any future financing arrangements we enter into are dependent upon a number of other external and internal factors, such as changes in raw material costs, changes in foreign currency rates, our ability to execute our cost savings initiatives, our ability to implement and achieve the savings expected by the changes in our operating structure and other factors beyond our control.
Senior notes due 2018
On May 11, 2010, CSA Escrow Corporation, or the escrow issuer, an indirect wholly-owned non-debtor subsidiary of CSA U.S. closed an offering of $450 million aggregate principal amount of our senior notes. Our senior notes were issued in a private placement exempt from registration under the Securities Act of 1933, as amended. A summary of our senior notes is set forth below. Also see “Description of Certain Indebtedness—Senior Notes due 2018” for more information on our senior notes. This description and the description in “Description of Certain Indebtedness—Senior Notes due 2018” are qualified in their entirety by reference to the indenture governing our senior notes, which is included as an exhibit to the registration statement of which this prospectus is a part.
General. Our senior notes were issued pursuant to an indenture dated May 11, 2010 by and between the escrow issuer and the trustee thereunder. Upon satisfaction of the escrow release conditions described above, the escrow issuer was merged with and into CSA U.S., with CSA U.S. as the surviving entity, and upon the consummation of the merger, CSA U.S. assumed all of the obligations of the escrow issuer under our senior notes and the indenture and the guarantees by the guarantors became effective, or the assumption. For purposes of this description, references to the “issuer” prior to the assumption refer to the escrow issuer and after the assumption refer to CSA U.S.
Guarantees. Our senior notes are guaranteed, jointly and severally, on a senior unsecured basis, by us and all of CSA U.S.’ wholly-owned domestic restricted subsidiaries, together with the escrow issuer, the obligors. If CSA U.S. or any of its domestic restricted subsidiaries acquires or creates another wholly-owned domestic restricted subsidiary that guarantees certain debt of CSA U.S. or a guarantor, such newly acquired or created subsidiary will also guarantee our senior notes.
Ranking. Our senior notes and guarantees constitute senior debt of the obligors. They (1) rank equally in right of payment with all of the obligors’ existing and future senior debt, (2) rank senior in right of payment to all of the obligors’ existing and future subordinated debt, (3) are effectively subordinated in right of payment to all of the obligors’ existing and future secured indebtedness and secured obligations to the extent of the value of the collateral securing such indebtedness and obligations and (4) are structurally subordinated to all existing and future indebtedness and other liabilities of the issuer’s non-guarantor subsidiaries (other than indebtedness and liabilities owed to the issuer or one of its guarantor subsidiaries).
Optional redemption. The issuer has the right to redeem our senior notes at the redemption prices set forth below:
| • | on and after May 1, 2014, all or a portion of our senior notes may be redeemed at a redemption price of 104.250% of the principal amount thereof if redeemed during the twelve-month period beginning on May 1, 2014, 102.125% of the principal amount thereof if redeemed during the twelve-month period beginning on May 1, 2015, and 100% of the principal amount thereof if redeemed on or after May 1, 2016, plus any accrued an unpaid interest to the redemption date; |
| • | prior to May 1, 2013, up to 35% of our senior notes issued under the indenture may be redeemed with the proceeds from certain equity offerings at a redemption price of 108.50% of the principal amount thereof, plus any accrued and unpaid interest to the redemption date; and |
| • | prior to May 1, 2014, all or a portion of our senior notes may be redeemed at a price equal to 100% of the principal amount thereof plus a make-whole premium. |
61
Table of Contents
Change of control. If a change of control occurs, unless CSA U.S. has exercised its right to redeem all of our outstanding senior notes through an optional redemption, each noteholder shall have the right to require that CSA U.S. repurchase such noteholder’s senior notes at a purchase price in cash equal to 101% of the principal amount on the date of purchase plus accrued and unpaid interest, if any, to the date of purchase, subject to the right of the noteholders of record on the relevant record date to receive interest due on the relevant interest payment date.
Covenants. The indenture limits, among other things, the ability of CSA U.S and its restricted subsidiaries to pay dividends or distributions, repurchase equity, prepay subordinated debt or make certain investments, incur additional debt or issue certain disqualified stock and preferred stock, incur liens, merge or consolidate with another company or sell all or substantially all of its assets, enter into transactions with affiliates and allow to exist certain restrictions on the ability of the subsidiary guarantors to pay dividends or make other payments to CSA U.S., in each case, subject to exclusions and other customary exceptions. In addition, certain of these covenants will not be applicable during any period of time when our senior notes have an investment grade rating. The indenture also contains customary events of default.
EBITDA and Adjusted EBITDA
In evaluating our business, management considers EBITDA and Adjusted EBITDA as key indicators of our operating performance. Our management also uses EBITDA and Adjusted EBITDA:
| • | because similar measures are utilized in the calculation of the financial covenants and ratios contained in our financing arrangements; |
| • | in developing our internal budgets and forecasts; |
| • | as a significant factor in evaluating our management for compensation purposes, see “Management— Compensation Discussion and Analysis”; |
| • | in evaluating potential acquisitions; |
| • | in comparing our current operating results with corresponding historical periods and with the operational performance of other companies in our industry; and |
| • | in presentations to the members of our board of directors to enable our board to have the same measurement basis of operating performance as is used by management in their assessments of performance and in forecasting and budgeting for our company. |
In addition, we believe EBITDA and Adjusted EBITDA and similar measures are widely used by investors, securities analysts and other interested parties in evaluating our performance. We define Adjusted EBITDA as net income (loss) plus provision for income tax expense (benefit), interest expense, net of interest income, depreciation and amortization or EBITDA, as adjusted for items that management does not consider to be reflective of our core operating performance. These adjustments include restructuring costs, impairment charges, non-cash fair value adjustments, acquisition related costs, professional fees and expenses associated with our reorganization, non-cash stock based compensation and non-cash gains and losses from certain foreign currency transactions and translation.
We calculate EBITDA and Adjusted EBITDA by adjusting net income (loss) to eliminate the impact of a number of items we do not consider indicative of our ongoing operating performance. You are encouraged to evaluate each adjustment and the reasons we consider it appropriate for supplemental analysis. However, EBITDA and Adjusted EBITDA are not financial measurements recognized under U.S. generally accepted accounting principles, or U.S. GAAP, and when analyzing our operating performance, investors should use EBITDA and Adjusted EBITDA in addition to, and not as an alternative for, net income (loss), operating income, or any other performance measure derived in accordance with U.S. GAAP, or as an alternative to cash flow from operating activities as a measure of our liquidity. EBITDA and Adjusted EBITDA have limitations as analytical tools, and
62
Table of Contents
they should not be considered in isolation or as substitutes for analysis of our results of operations as reported under U.S. GAAP. These limitations include:
| • | they do not reflect our cash expenditures or future requirements for capital expenditures or contractual commitments; |
| • | they do not reflect changes in, or cash requirements for, our working capital needs; |
| • | they do not reflect interest expense or cash requirements necessary to service interest or principal payments under our senior notes and senior ABL facility; |
| • | they do not reflect certain tax payments that may represent a reduction in cash available to us; |
| • | although depreciation and amortization are non-cash charges, the assets being depreciated or amortized may have to be replaced in the future, and EBITDA and Adjusted EBITDA do not reflect cash requirements for such replacements; and |
| • | other companies, including companies in our industry, may calculate these measures differently and, as the number of differences in the way companies calculate these measures increases, the degree of their usefulness as a comparative measure correspondingly decreases. |
In addition, in evaluating Adjusted EBITDA, it should be noted that in the future we may incur expenses similar to the adjustments in the below presentation. Our presentation of Adjusted EBITDA should not be construed as an inference that our future results will be unaffected by unusual or non-recurring items.
The following table provides a reconciliation of EBITDA and Adjusted EBITDA to net income (loss), which is the most directly comparable financial measure presented in accordance with U.S. GAAP:
| Historical | ||||||||||||||||||||||||
| Year Ended December 31, | Nine Months
Ended September 30, |
Five Months Ended May 31, |
Four Months Ended September 30, |
|||||||||||||||||||||
| 2007 | 2008 | 2009 | 2009 | 2010 | 2010 | |||||||||||||||||||
| (in millions) | ||||||||||||||||||||||||
| Net income (loss) attributable to Cooper-Standard Holdings Inc. |
$ | (151.0 | ) | $ | (121.5 | ) | $ | (356.1 | ) | $ | (393.5 | ) | $ | 636.3 | $ | 25.8 | ||||||||
| Plus: |
||||||||||||||||||||||||
| Provision for income tax expense (benefit) |
32.9 | 29.3 | (55.7 | ) | (31.3 | ) | 39.9 | 5.4 | ||||||||||||||||
| Interest expense, net of interest income |
89.6 | 92.9 | 64.3 | 53.6 | 44.5 | 14.2 | ||||||||||||||||||
| Depreciation and amortization |
136.0 | 140.1 | 113.9 | 88.1 |
|
35.7 |
|
|
36.9 |
| ||||||||||||||
| EBITDA |
$ | 107.5 | $ | 140.8 | $ | (233.6 | ) | $ | (283.1 | ) | $ | 756.4 | $ | 82.3 | ||||||||||
| Restructuring |
26.4 | 30.6 | 32.4 | 32.9 | 5.9 | 1.2 | ||||||||||||||||||
| Foreign exchange losses (gains) |
(0.1 | ) | 0.1 | (4.2 | ) | (10.8 | ) | 17.2 | (0.1 | ) | ||||||||||||||
| Net gain on bond repurchase(a) |
— | (1.7 | ) | (9.1 | ) | (9.1 | ) | — | — | |||||||||||||||
| Inventory write-up(b) |
2.5 | — | — | — | — | 8.1 | ||||||||||||||||||
| Impairment(c) |
146.4 | 36.0 | 363.5 | 362.7 | — | — | ||||||||||||||||||
| Reorganization costs(d) |
— | — | 25.1 | 5.6 | (660.0 | ) | — | |||||||||||||||||
| Transition and integration costs(e) |
1.5 | 0.5 | — | — | — | — | ||||||||||||||||||
| Stock compensation expense(f) |
1.5 | 1.2 | 1.4 | — | 0.2 | 3.6 | ||||||||||||||||||
| Other |
— | 2.7 | 1.0 | 7.5 | 0.3 | (0.3 | ) | |||||||||||||||||
| Adjusted EBITDA |
$ | 285.7 | $ | 210.2 | $ | 176.5 | $ | 105.7 | $ | 120.0 | $ | 94.8 | ||||||||||||
63
Table of Contents
| (a) | Net gain on purchases of our prepetition senior subordinated notes. |
| (b) | Write-ups of inventory to fair value. |
| (c) | For the year ended December 31, 2007, impairment included charges related to goodwill of $142.9 million and certain intangibles of $3.5 million. For the year ended December 31, 2008, impairment included charges related to goodwill of $23.1 million, certain intangibles of $3.9 million, fixed assets of $6.4 million and our investment in Guyoung of $2.7 million. For the year ended December 31, 2009, impairment included charges related to goodwill of $157.2 million, certain intangibles of $202.4 million and fixed assets of $3.9 million. |
| (d) | Reorganization and bankruptcy-related expenses, including the effect of the Fresh-Start Adjustments and professional fees incurred before our bankruptcy filing in 2009. |
| (e) | Transition and integration costs related to the acquisition of MAPS and El Jarudo in 2007 and MAP India in 2008. |
| (f) | Compensation expense related to stock options and stock units issued to management. |
Working Capital
Historically, we have not generally experienced difficulties in collecting our accounts receivable, but the dynamics associated with the recent economic downturn have impacted both the amount of our receivables and the stressed ability for our customers to pay within normal terms. Certain government sponsored programs may ease these constraints, but pressure on accounts receivable will continue until vehicle sales and production volumes stabilize. As of September 30, 2010, we had net cash of $232.3 million.
Contractual Obligations
Our contractual cash obligations consist of legal commitments requiring us to make fixed or determinable cash payments, regardless of the contractual requirements of the vendor to provide future goods or services. Except as disclosed, the below tables do not include information on our recurring purchase of materials for use in production, as our raw materials purchase contracts typically do not meet this definition because they do not require fixed or minimum quantities.
In addition to our contractual obligations and commitments set forth in the table below, we have employment arrangements with certain key executives that provide for continuity of management. These arrangements include payments of multiples of annual salary, certain incentives and continuation of benefits upon the occurrence of specified events in a manner that is believed to be consistent with comparable companies.
We also have minimum funding requirements with respect to our pension obligations. We expect to make cash contributions of approximately $14.8 million to our domestic and foreign pension plan asset portfolios in 2010. Our minimum funding requirements after 2010 will depend on several factors, including the investment performance of our retirement plans and prevailing interest rates. Our funding obligations may also be affected by changes in applicable legal requirements. We also have payments due with respect to our postretirement benefit obligations. We do not prefund our postretirement benefit obligations. Rather, payments are made as costs are incurred by covered retirees. We expect other postretirement benefit net payments to be approximately $3.6 million in 2010.
In addition, excluded from the contractual obligation table are open purchase orders at September 30, 2010 for raw materials and supplies used in the normal course of business, supply contracts with customers, distribution agreements, joint venture agreements and other contracts without express funding requirements.
64
Table of Contents
The following table summarizes the total amounts due as of September 30, 2010, under all debt agreements, commitments and other contractual obligations.
| Payment due by period | ||||||||||||||||||||
| Contractual Obligations |
Total | Less than 1 year |
1-3 Years | 3-5 years | More than 5 Years |
|||||||||||||||
| (dollars in millions) | ||||||||||||||||||||
| Debt obligations |
$ | 450.0 | $ | — | $ | — | $ | — | $ | 450.0 | ||||||||||
| Interest on debt obligations(1) |
305.1 | 37.3 | 76.5 | 76.5 | 114.8 | |||||||||||||||
| Operating lease obligations |
65.1 | 12.7 | 19.1 | 13.3 | 20.0 | |||||||||||||||
| Other obligations(2) |
46.9 | 39.8 | 5.4 | 0.9 | 0.8 | |||||||||||||||
| Total |
$ | 867.1 | $ | 89.8 | $ | 101.0 | $ | 90.7 | $ | 585.6 | ||||||||||
| (1) | Interest on debt obligations only includes the interest on our senior notes. The actual amounts of interest expense will ultimately depend on the amount of borrowings and letters of credit outstanding under our senior ABL facility and the interest rates in effect thereunder during each period. |
| (2) | Noncancellable purchase order commitments for capital expenditures, other borrowings and capital lease obligations. |
Raw Materials and Manufactured Components
The principal raw materials for our business include fabricated metal-based components, oil based components, synthetic rubber, carbon black and natural rubber. We manage the procurement of our raw materials to assure supply and to obtain the most favorable pricing. For natural rubber, procurement is managed by buying in advance of production requirements and by buying in the spot market. For other principal materials, procurement arrangements include short-term supply agreements that may contain formula-based pricing based on commodity indices. These arrangements provide quantities needed to satisfy normal manufacturing demands. We believe we have adequate sources for the supply of raw materials and components for our products with suppliers located around the world. We often use offshore suppliers for machined components, metal stampings, castings and other labor-intensive, economically freighted products.
Extreme fluctuations in material pricing have occurred in recent years adding challenges in forecasting. The inability to recover higher than anticipated prices from our customers may impact profitability.
Seasonal Trends
Sales to automotive customers are lowest during the months prior to model changeovers and during assembly plant shutdowns. These typically result in lower sales volumes during July, August and December. However, economic conditions can change normal seasonality trends causing lower demand throughout the year. The impact of model changeovers and plant shutdowns is considerably less in years of lower demand overall.
Restructuring
We continually evaluate alternatives in an effort to align our business with the changing needs of our customers and lower our operating cost. This may include the realignment of our existing manufacturing capacity, facility closures or similar actions. See the notes to our unaudited interim financial statements as of September 30, 2010 for discussion of restructuring activities during the nine months ended September 30, 2010.
65
Table of Contents
We implemented several restructuring initiatives in prior years in connection with the closure of facilities in North America, Europe and Asia. We initiated all of these initiatives prior to December 31, 2007 and continued to execute the closures through the end of 2009. The majority of the costs associated with the closures were incurred shortly after the original implementation. However, we continue to incur costs related principally to the liquidation of the respective facilities. The following table summarizes the 2008 and 2009 activity related to these initiatives:
| Employee Separation Costs |
Other Exit Costs |
Asset Impairments |
Total | |||||||||||||
| (in thousands) | ||||||||||||||||
| Balance at January 1, 2008 |
$ | 8,723 | $ | 4,752 | $ | — | $ | 13,475 | ||||||||
| Expense incurred |
2,209 | 4,780 | 4,687 | 11,676 | ||||||||||||
| Cash payments |
(8,822 | ) | (8,792 | ) | 165 | (17,449 | ) | |||||||||
| Utilization of reserve |
— | — | (4,852 | ) | (4,852 | ) | ||||||||||
| Balance at December 31, 2008 |
$ | 2,110 | $ | 740 | $ | — | $ | 2,850 | ||||||||
| Expense incurred |
(517 | ) | 3,298 | 1,089 | 3,870 | |||||||||||
| Cash payments |
(1,593 | ) | (3,800 | ) | — | (5,393 | ) | |||||||||
| Utilization of reserve |
— | — | (1,089 | ) | (1,089 | ) | ||||||||||
| Balance at December 31, 2009 |
$ | — | $ | 238 | $ | — | $ | 238 | ||||||||
2008 initiatives
In July 2008, we implemented a restructuring action and announced the closure of two manufacturing facilities, one located in Australia and the other in Germany. Both closures are a result of changes in market demands and volume reductions and were substantially completed in 2009. The estimated total cost of this initiative is approximately $21.1 million. The following table summarizes the activity for this initiative during the years ended December 31, 2008 and December 31, 2009:
| Employee Separation Costs |
Other Exit Costs |
Asset Impairments |
Total | |||||||||||||
| (in thousands) | ||||||||||||||||
| Balance at January 1, 2008 |
$ | — | $ | — | $ | — | $ | — | ||||||||
| Expense incurred |
14,455 | 149 | 3,282 | 17,886 | ||||||||||||
| Cash payments |
(995 | ) | (149 | ) | — | (1,144 | ) | |||||||||
| Utilization of reserve |
— | — | (3,282 | ) | (3,282 | ) | ||||||||||
| Balance at December 31, 2008 |
$ | 13,460 | $ | — | $ | — | $ | 13,460 | ||||||||
| Expense incurred |
562 | 2,557 | 118 | 3,237 | ||||||||||||
| Cash payments |
(12,579 | ) | (2,322 | ) | — | (14,901 | ) | |||||||||
| Utilization of reserve |
— | — | (118 | ) | (118 | ) | ||||||||||
| Balance at December 31, 2009 |
$ | 1,443 | $ | 235 | $ | — | $ | 1,678 | ||||||||
As a result of this initiative, a pension plan curtailment gain of $0.8 million was recognized as a reduction to restructuring expense during the fourth quarter of 2009.
In 2008, we initiated the closing of a European facility and the idling of a Canadian facility. During the year ended December 31, 2009, we recorded other exit costs of $0.5 million and asset impairments of $0.1 million in connection with this initiative.
Reorganization-Product Line Operating Group Discontinuation Initiative. During 2008, we commenced the initial phase of a reorganization ultimately involving the discontinuation of our global product line operating divisions, formerly called the Body & Chassis Systems division (which included the body sealing and AVS product lines) and
66
Table of Contents
the Fluid Systems division, and the establishment of a new operating structure organized on the basis of geographic regions. The estimated cost of this initial phase is approximately $7.8 million. The following table summarizes the activity for this initiative during the years ended December 31, 2008 and December 31, 2009:
| Employee Separation Costs |
Other Exit Costs |
Asset Impairments |
Total | |||||||||||||
| (in thousands) | ||||||||||||||||
| Balance at January 1, 2008 |
$ | — | $ | — | $ | — | $ | — | ||||||||
| Expense incurred |
7,670 | — | — | 7,670 | ||||||||||||
| Cash payments |
(3,741 | ) | — | — | (3,741 | ) | ||||||||||
| Utilization of reserve |
— | — | — | — | ||||||||||||
| Balance at December 31, 2008 |
$ | 3,929 | $ | — | $ | — | $ | 3,929 | ||||||||
| Expense incurred |
134 | — | — | 134 | ||||||||||||
| Cash payments |
(3,405 | ) | — | — | (3,405 | ) | ||||||||||
| Balance at December 31, 2009 |
$ | 658 | $ | — | $ | — | $ | 658 | ||||||||
2009 initiatives
In the first quarter of 2009, we initiated the final phase of the reorganization of our operating structure, formally discontinuing our product line operating divisions and putting into place the new operating divisions based on geographic regions. The estimated total cost of this initiative is $18.7 million. The following table summarizes the activity for this initiative during the year ended December 31, 2009:
| Employee Separation Costs |
Other Exit Costs |
Asset Impairments |
Total | |||||||||||||
| (in thousands) | ||||||||||||||||
| Balance at January 1, 2009 |
$ | — | $ | — | $ | — | $ | — | ||||||||
| Expense incurred |
18,570 | 86 | — | 18,656 | ||||||||||||
| Cash payments |
(11,457 | ) | (86 | ) | — | (11,543 | ) | |||||||||
| Balance at December 31, 2009 |
$ | 7,113 | $ | — | $ | — | $ | 7,113 | ||||||||
As a result of this initiative, a curtailment gain related to other postretirement benefits of $3.4 million was recognized as a reduction to restructuring expense during the fourth quarter of 2009.
We also initiated several other initiatives during 2009. These initiatives relate to the reorganization or closure of operating facilities in South America, Europe and Asia Pacific. The estimated total cost associated with these actions amount to $19.3 million. The following table summarizes the activity for these initiatives during the year ended December 31, 2009:
| Employee Separation Costs |
Other Exit Costs |
Asset Impairments |
Total | |||||||||||||
| (in thousands) | ||||||||||||||||
| Balance at January 1, 2009 |
$ | — | $ | — | $ | — | $ | — | ||||||||
| Expense incurred |
9,864 | 368 | — | 10,232 | ||||||||||||
| Cash payments |
(5,649 | ) | (312 | ) | — | (5,961 | ) | |||||||||
| Utilization of reserve |
— | — | — | — | ||||||||||||
| Balance at December 31, 2009 |
$ | 4,215 | $ | 56 | $ | — | $ | 4,271 | ||||||||
We expect the reorganization of our operating structure and the other 2009 initiatives to be substantially completed by the end of 2010.
67
Table of Contents
Critical Accounting Policies and Estimates
Our accounting policies are more fully described in note 2 to our audited annual financial statements. Application of these accounting principles requires management to make estimates and assumptions that affect the reported amounts of assets and liabilities, the disclosure of contingent assets and liabilities and the reported amounts of revenues and expenses during the reporting period. Management bases its estimates and judgments on historical experience and on other factors that are believed to be reasonable under the circumstances, the results of which form the basis for making judgments about the carrying value of assets and liabilities that are not readily apparent from other sources. Actual results may differ from these estimates under different assumptions or conditions. We believe that of our significant accounting policies, the following may involve a higher degree of judgment or estimation than other accounting policies.
Adoption of fresh-start accounting
Fresh-start accounting results in a new basis of accounting and reflects the allocation of our estimated fair value to our underlying assets and liabilities. Our estimates of fair value are inherently subject to significant uncertainties and contingencies beyond our reasonable control. Accordingly, there can be no assurance that the estimates, assumptions, valuations, appraisals and financial projections will be realized, and actual results could vary materially.
Our reorganization value was allocated to our assets in conformity with the procedures specified by ASC 805, “Business Combinations.” The excess of reorganization value over the fair value of tangible and identifiable intangible assets was recorded as goodwill. Liabilities existing as of the effective date, other than deferred taxes, were recorded at the present value of amounts expected to be paid using appropriate risk adjusted interest rates. Deferred taxes were determined in conformity with applicable income tax accounting standards. Predecessor accumulated depreciation, accumulated amortization, retained deficit, common stock and accumulated other comprehensive loss were eliminated.
For further information on fresh-start accounting, see note 3 to our unaudited interim financial statements as of September 30, 2010.
Reorganization
As a result of filing for chapter 11 bankruptcy, we adopted ASC 852 on August 3, 2009. ASC 852, is applicable to companies in chapter 11 of the Bankruptcy Code and generally does not change the manner in which financial statements are prepared. However, among other disclosures, it does require that the financial statements for periods subsequent to the filing of the chapter 11 petition distinguish transactions and events that are directly associated with the reorganization from the ongoing operations of the business. Revenues, expenses, realized gains and losses and provisions for losses that can be directly associated with the reorganization and restructuring of the business must be reported separately as reorganization items in the statements of operations. The balance sheet must distinguish prepetition liabilities subject to compromise from both those prepetition liabilities that are not subject to compromise and from post-petition liabilities. Liabilities that may be affected by a plan of reorganization must be reported at the amounts expected to be allowed, even if they may be settled for lesser amounts. In addition, reorganization items must be disclosed separately in the statement of cash flows. We have segregated those items as outlined above for all reporting periods subsequent to such date.
Pre-production costs related to long-term supply arrangements
Costs for molds, dies and other tools owned by us to produce products under long-term supply arrangements are recorded at cost in property, plant and equipment and amortized over the lesser of three years or the term of the related supply agreement. The amount capitalized was $10.9 million and $9.3 million at December 31, 2008 and 2009, respectively. Costs incurred during the engineering and design phase of customer-owned tooling projects
68
Table of Contents
are expensed as incurred unless a contractual arrangement for reimbursement by the customer exists. Reimbursable tooling costs included in other assets was $3.8 million and $2.6 million at December 31, 2008 and 2009, respectively. Development costs for tools owned by the customer that meet the requirements of ASC Topic 340, “Other Assets and Deferred Costs,” are recorded in accounts receivable in the accompanying combined balance sheets if considered a receivable in the next twelve months. At December 31, 2008 and 2009, $77.8 million and $65.4 million, respectively, were included in accounts receivable for customer-owned tooling of which $32.8 million and $40.5 million, respectively, was not yet invoiced to the customer.
Goodwill
Goodwill is not amortized but is tested annually for impairment. We evaluate each reporting unit’s fair value versus its carrying value annually or more frequently if events or changes in circumstances indicate that the carrying value may exceed the fair value of the reporting unit. Estimated fair values are based on the cash flows projected in the reporting units’ strategic plans and long-range planning forecasts discounted at a risk-adjusted rate of return. We assess the reasonableness of these estimated fair values using market based multiples of comparable companies. If the carrying value exceeds the fair value, an impairment loss is measured and recognized. Goodwill fair value measurements are classified within Level 3 of the fair value hierarchy, which are generally determined using unobservable inputs.
During the second quarter of 2009, several events occurred that indicated potential impairment of our goodwill. Such events included: (a) the chapter 11 bankruptcy of both Chrysler and GM and unplanned plant shut-downs by both GM and Chrysler; (b) continued product volume risk and negative product mix changes; (c) the commencement of negotiations with our pre-reorganization affiliate shareholders, senior secured lenders, and bondholders to recapitalize our long term debt and equity; (d) our recognition as the second quarter progressed that there was an increasing likelihood that we would breach our financial covenants under the prepetition credit agreement; and (e) our decision to defer the June 15, 2009 interest payment on our prepetition senior notes and our prepetition senior subordinated notes pending the outcome of our quarterly financial results, an analysis of whether we would meet our financial covenants for the past quarter and negotiations with our various constituencies. As a result of the combination of the above factors, we significantly reduced our second quarter projections.
Other significant assumptions used in the discounted cash flow model include discount rate, terminal value growth rate, future capital expenditures and changes in future working capital requirements. These assumptions were not modified significantly as part of the interim goodwill impairment assessment. The significant decrease in the financial projections resulted in an enterprise value significantly lower than the amount computed in connection with the prior year annual impairment assessment. This significant decrease in enterprise value results in the carrying value of assets at all of our reporting units being greater than the related reporting units’ fair value. As a result, we recorded goodwill impairment charges of $93.6 million in our North America reporting unit, $39.6 million in our Europe reporting unit, $22.6 million in our South America reporting unit and $1.4 million in our Asia Pacific reporting unit during the second quarter of 2009. Changes in the factors noted above could impact the valuation of our remaining goodwill and other intangibles.
While we believe our estimates of fair value are reasonable based upon current information and assumptions about future results, changes in our businesses, the markets for our products, the economic environment and numerous other factors could significantly alter our fair value estimates and result in future impairment of recorded goodwill in the North American reporting unit. An adjustment to the financial projections or other assumptions used to value the North American reporting unit would have had a direct impact on the amount of goodwill impairment recognized during the second quarter and the amount of goodwill remaining on the December 31, 2009 balance sheet.
69
Table of Contents
Long-lived assets
We monitor our long-lived assets for impairment indicators on an ongoing basis in accordance with ASC Topic 360, “Property, Plant, and Equipment.” If impairment indicators exist, we perform the required analysis by comparing the undiscounted cash flows expected to be generated from the long-lived assets to the related net book values. If the net book value exceeds the undiscounted cash flows, an impairment loss is measured and recognized. An impairment loss is measured as the difference between the net book value and the fair value of the long-lived assets. Fair value is estimated based upon either discounted cash flow analyses or estimated salvage values. Cash flows are estimated using internal budgets based on recent sales data, independent automotive production volume estimates and customer commitments, as well as assumptions related to discount rates. Change in economic or operating conditions impacting these estimates and assumptions could result in the impairment of long-lived assets.
As a result of our testing performed in accordance with ASC 360 we recorded asset and definite lived intangible asset impairment charges of $3.8 million and $202.4 million, respectively. Of the $3.8 million of asset impairment charges, $1.1 million was recorded in our North America segment and $2.7 million was recorded in our International segment. Of the $202.4 million of definite lived intangible asset impairment charges, $148.1 million was recorded in our North America segment and $54.3 million was recorded in our International segment.
Restructuring-related reserves
Specific accruals have been recorded in connection with restructuring our businesses, as well as the integration of acquired businesses. These accruals include estimates principally related to employee separation costs, the closure and/or consolidation of facilities, contractual obligations and the valuation of certain assets. Actual amounts recognized could differ from the original estimates. Restructuring-related reserves are reviewed on a quarterly basis and changes to plans are appropriately recognized when identified. Changes to plans associated with the restructuring of existing businesses are generally recognized as employee separation and plant phaseout costs in the period the change occurs. For additional discussion, please refer to note 6 to our audited annual financial statements.
Revenue recognition and sales commitments
We generally enter into agreements with our customers to produce products at the beginning of a vehicle’s life. Although such agreements do not generally provide for minimum quantities, once we enter into such agreements, fulfillment of our customers’ purchasing requirements can be our obligation for an extended period or the entire production life of the vehicle. These agreements generally may be terminated by our customer at any time. Historically, terminations of these agreements have been minimal. In certain limited instances, we may be committed under existing agreements to supply products to our customers at selling prices which are not sufficient to cover the direct cost to produce such products. In such situations, we recognize losses as they are incurred.
We receive blanket purchase orders from many of our customers on an annual basis. Generally, such purchase orders and related documents set forth the annual terms, including pricing, related to a particular vehicle model. Such purchase orders generally do not specify quantities. We recognize revenue based on the pricing terms included in our annual purchase orders as our products are shipped to our customers. As part of certain agreements, we are asked to provide our customers with annual cost reductions. We accrue for such amounts as a reduction of revenue as our products are shipped to our customers. In addition, we generally have ongoing adjustments to our pricing arrangements with our customers based on the related content and cost of our products. Such pricing accruals are adjusted as they are settled with our customers.
Amounts billed to customers related to shipping and handling are included in sales in our consolidated statements of operations. Shipping and handling costs are included in cost of sales in our consolidated statements of operations.
70
Table of Contents
Income taxes
In determining the provision for income taxes for financial statement purposes, we make estimates and judgments which affect our evaluation of the carrying value of our deferred tax assets as well as our calculation of certain tax liabilities. In accordance with ASC Topic 740, “Accounting for Income Taxes,” we evaluate the carrying value of our deferred tax assets on a quarterly basis. In completing this evaluation, we consider all available positive and negative evidence. Such evidence includes historical operating results, the existence of cumulative losses in the most recent fiscal years, expectations for future pretax operating income, the time period over which our temporary differences will reverse and the implementation of feasible and prudent tax planning strategies. Deferred tax assets are reduced by a valuation allowance if, based on the weight of this evidence, it is more likely than not that all or a portion of the recorded deferred tax assets will not be realized in future periods.
During 2009, due to our recent operating performance in the United States and current industry conditions, we continued to assess, based upon all available evidence, that it was more likely than not that we would not realize our U.S. deferred tax assets. During 2009, our U.S. valuation allowance increased by $33.1 million, primarily related to operating losses incurred in the United States during 2009, offset by reductions in tax attributes resulting from the settlement of the U.S. and Canadian Advanced Pricing Agreement.
At December 31, 2009, deferred tax assets for net operating loss and tax credit carry-forwards of $193.8 million were reduced by a valuation allowance of $146.7 million. These deferred tax assets relate principally to net operating loss carry-forwards in the U.S and our subsidiaries in Australia, Brazil, China, France, Germany, Italy and Spain. They also relate to Special Economic Zone Credits in Poland, U.S foreign tax credits, research and development tax credits, state net operating losses and state tax credits. Some of these can be utilized indefinitely, while others expire from 2010 through 2029. We intend to maintain these allowances until it is more likely than not that the deferred tax assets will be realized. Effective January 1, 2009, with the adoption of ASC Topic 805 the benefit of the reversal of the valuation allowances on pre-acquisition contingencies will be included as a component of income tax expense. Adjustments in post-acquisition valuation allowances will be offset to future tax provision.
In addition, the calculation of our tax benefits and liabilities includes uncertainties in the application of complex tax regulations in a multitude of jurisdictions across our global operations. We recognize tax benefits and liabilities based on our estimate of whether, and the extent to which, additional taxes will be due. We adjust these liabilities based on changing facts and circumstances; however, due to the complexity of some of these uncertainties and the impact of any tax audits, the ultimate resolutions may be materially different from our estimated liabilities. For further information related to income taxes, see note 13 to our audited annual financial statements.
Pensions and postretirement benefits other than pensions
Included in our results of operations are significant pension and postretirement benefit costs, which are measured using actuarial valuations. Inherent in these valuations are key assumptions, including assumptions about discount rates and expected returns on plan assets. These assumptions are updated at the beginning of each fiscal year. We are required to consider current market conditions, including changes in interest rates, in making these assumptions. Changes in pension and postretirement benefit costs may occur in the future due to changes in these assumptions. Our net pension and postretirement benefit costs were approximately $14.9 million and $(0.5) million, respectively, during 2009.
To develop the discount rate for each plan, the expected cash flows underlying the plan’s benefit obligations were discounted using the December 31, 2009 Citigroup Pension Discount Curve to determine a single equivalent rate. To develop our expected return on plan assets, we considered historical long-term asset return experience, the expected investment portfolio mix of plan assets and an estimate of long-term investment returns. To develop our expected portfolio mix of plan assets, we considered the duration of the plan liabilities and gave
71
Table of Contents
more weight to equity positions, including both public and private equity investments, than to fixed-income securities. Holding all other assumptions constant, a 1% increase or decrease in the discount rate would have decreased or increased the fiscal 2010 net pension expense by approximately $3.1 million and $2.7 million, respectively. Likewise, a 1% increase or decrease in the expected return on plan assets would have decreased or increased the fiscal 2010 net pension cost by approximately $2.3 million. Decreasing or increasing the discount rate by 1% would have increased or decreased the projected benefit obligations by approximately $54.4 million and $44.6 million, respectively. Aggregate pension net periodic benefit cost is forecasted to be approximately $12.5 million in 2010.
The rate of increase in medical costs assumed for the next five years was held constant with prior years to reflect both actual experience and projected expectations. The health care cost trend rate assumption has a significant effect on the amounts reported. Only certain employees hired are eligible to participate in our subsidized postretirement plan. A 1% change in the assumed health care cost trend rate would have increased or decreased the fiscal 2010 service and interest cost components by $0.3 million and $0.2 million, respectively, and the projected benefit obligations would have increased or decreased by $2.6 million and $2.2 million, respectively. Aggregate other postretirement net periodic benefit cost is forecasted to be approximately $2.3 million in 2010.
The general funding policy is to contribute amounts deductible for U.S. federal income tax purposes or amounts required by local statute.
Derivative financial instruments
We utilize derivative financial instruments to reduce foreign currency exchange, interest rate and commodity price risks. We have established policies and procedures for risk assessment including the assessment of counterparty credit risk and the approval, reporting and monitoring of derivative financial instrument activities. On the date the derivative is established, we designate the derivative as either a fair value hedge, a cash flow hedge or a net investment hedge in accordance with our established policy. We do not enter into financial instruments for trading or speculative purposes.
By using derivative instruments to hedge exposures to changes in commodity prices and interest rates, we are exposed to credit risk. Credit risk is the failure of the counterparty to perform under the terms of the derivative contract. When the fair value of a derivative contract is positive, the counterparty owes us, which creates credit risk for us. When the fair value of a derivative contract is negative, we owe the counterparty and we do not possess credit risk. To mitigate credit risk, it is our policy to execute such instruments with creditworthy banks and not enter into derivatives for speculative purposes.
Use of estimates
The preparation of our consolidated financial statements in conformity with the accounting principles generally accepted in the United States requires management to make estimates and assumptions that affect the reported amounts of assets and liabilities as of the date of our consolidated financial statements and the reported amounts of revenues and expenses during the reporting period. During 2009, there were no material changes in the methods or policies used to establish estimates and assumptions. Generally, matters subject to estimation and judgment include amounts related to accounts receivable realization, inventory obsolescence, asset impairments, useful lives of intangible and fixed assets, unsettled pricing discussions with customers and suppliers, restructuring accruals, deferred tax asset valuation allowances and income taxes, pension and other post retirement benefit plan assumptions, accruals related to litigation, warranty and environmental remediation costs and self-insurance accruals. Actual results may differ from estimates provided.
72
Table of Contents
Fair value measurements
We measure certain assets and liabilities at fair value on a non-recurring basis using unobservable inputs (Level 3 input based on the U.S. GAAP fair value hierarchy). For further information on these fair value measurements, see “—Goodwill,” “—Long-lived assets,” “—Restructuring-related reserves,” and “—Derivative financial instruments” above.
Recent Accounting Pronouncements
See note 1 to our unaudited interim financial statements as of September 30, 2010 and note 2 to our audited annual financial statements.
Quantitative and Qualitative Disclosures About Market Risk
We are exposed to fluctuations in interest rates, currency exchange rates and commodity prices. Prior to filing for bankruptcy we had entered into derivative financial instruments to monitor our exposure to these risks, but as a result of the bankruptcy filing all but one of these instruments were dedesignated. We actively monitor our exposure to risk from changes in foreign currency exchange rates and interest rates through the use of derivative financial instruments in accordance with management’s guidelines. We do not enter into derivative instruments for trading purposes. See “Critical Accounting Policies and Estimates—Derivative financial instruments” and note 21 to our audited annual financial statements.
As of September 30, 2010, we had $6.0 million of variable rate debt. A 1% increase in the average interest rate would increase future interest expense by approximately $0.1 million per year.
At September 30, 2010 we had one interest rate swap contract outstanding with $6.8 million of notional amount pertaining to EURO denominated debt fixed at 4.14%.
Other Considerations
As a result of our emergence from bankruptcy on May 27, 2010, Barclays Bank Plc and Barclays Capital Inc. (collectively, “Barclays”) received or purchased shares of our common stock and preferred stock and warrants to purchase shares of our common stock in an aggregate amount that resulted in Barclays obtaining beneficial ownership of greater than 10% of our common stock. Barclays subsequently reduced its holdings in our securities and, as a result, as of October 8, 2010, is no longer the beneficial owner of greater than 10% of our common stock. See “Principal Stockholders.”
Ernst & Young LLP, our registered independent public accountants, informed our audit committee that it had and continues to have extensive borrowing and other business relationships with Barclays and that such relationships during the period within which Barclays’ beneficial ownership exceeded 10% of our common stock were not permitted under the auditor independence rules. In addition, the extent of the relationships makes it impractical for Ernst & Young to exit such relationships in a short period of time.
Ernst & Young considered whether the relationships noted above impacted its objectivity and ability to exercise impartial judgment with regard to its engagement as our auditors and have concluded that there has been no impairment of Ernst & Young’s objectivity and ability to exercise impartial judgment. After taking into consideration the facts and circumstances of the above matter and Ernst & Young’s determination, our audit committee also concluded that Ernst & Young’s objectivity and ability to exercise impartial judgment has not been impaired.
73
Table of Contents
On August 3, 2009, the debtors filed voluntary petitions for relief under chapter 11 of title 11 of the United States Code, or the Bankruptcy Code, in the United States Bankruptcy Court for the District of Delaware, or the Bankruptcy Court. On August 4, 2009, CSA Canada commenced proceedings seeking relief from its creditors under Canada’s Companies’ Creditors Arrangement Act in the Ontario Superior Court of Justice (Commercial List) in Toronto, Canada, or the Canadian Court. Our subsidiaries and operations outside the United States and Canada were not included in the chapter 11 cases or the Canadian proceedings (other than CSA Canada) and continued to operate in the ordinary course of business.
On March 26, 2010, we filed our plan of reorganization and the corresponding first amended disclosure statement for our plan of reorganization with the Bankruptcy Court. On May 12, 2010, the Bankruptcy Court entered an order confirming our plan of reorganization. The Canadian Court sanctioned CSA Canada’s plan of compromise or arrangement on April 16, 2010.
On May 27, 2010, or the effective date, we consummated the reorganization contemplated by our plan of reorganization and emerged from chapter 11.
Following the effective date, our capital structure consisted of the following:
| • | Senior ABL facility. A senior secured asset-based revolving credit facility in the aggregate principal amount of $125 million, which contains an uncommitted $25 million “accordion” facility that will be available at our request if the lenders at the time consent. |
| • | 8½% senior notes due 2018. $450 million of senior unsecured notes that bear interest at 8½% per annum and mature on May 1, 2018. |
| • | Common stock, 7% preferred stock and warrants. Equity securities comprised of (i) 17,489,693 shares of our common stock, (ii) 1,000,000 shares of our 7% preferred stock, which are initially convertible into 4,290,788 shares of our common stock, and (iii) 2,419,753 warrants to purchase up to an aggregate of 2,419,753 shares of our common stock. |
In addition, on the effective date, we issued to certain officers and key employees (i) 757,896 shares of our common stock as restricted stock, plus an additional 104,075 shares of our common stock as restricted stock that may be reduced subject to realized dilution on the warrants, (ii) 41,666 shares of 7% preferred stock as restricted 7% preferred stock and (iii) 702,509 options to purchase shares of common stock, plus an additional 78,057 options to purchase shares of our common stock that may be reduced subject to realized dilution on the warrants. On the day after the effective date, we issued to certain of our directors and Oak Hill Advisors L.P. and its affiliates, 26,448 shares of our common stock as restricted stock and 58,386 options to purchase shares of our common stock. We also reserved up to 780,566 shares of our common stock for future issuance to our management.
On the effective date, our prepetition equity, debt and certain other obligations were cancelled, terminated and repaid, as applicable, as follows:
| • | Our prepetition common stock was cancelled, and no distributions were made to former shareholders. |
| • | All outstanding obligations under our prepetition senior notes and prepetition senior subordinated notes were cancelled and the indentures governing these obligations were terminated. |
| • | Our prepetition credit agreement and our DIP credit agreement were paid in full. |
74
Table of Contents
Some market data and other statistical information used throughout this prospectus is based on data available from IHS Automotive and J.D. Power-LMC, each independent market research firms. Other data is based on our good faith estimates, which are derived from our review of internal surveys, as well as third party sources. Although we believe all of these third party sources are reliable, we have not independently verified the information and cannot guarantee its accuracy and completeness. To the extent that we have been unable to obtain information from third party sources, we have expressed our belief on the basis of our own internal analyses and estimates of our and our competitors’ products and capabilities. Certain market share, ranking and similar information set forth in this prospectus is based on management’s estimates, which are primarily based on reports prepared by industry consultants commissioned by us. Market share information is subject to change, however, and cannot always be verified with complete certainty due to limits on the availability and reliability of raw data, the voluntary nature of the data-gathering process and other limitations and uncertainties inherent in any statistical survey of market share. While we are not aware of any misstatements regarding any market share, ranking and similar information presented herein, the global automotive industry involves risks and uncertainties and industry data is subject to change based on various factors. See “Forward-Looking Statements” and “Risk Factors.” In addition, customer preferences can and do change and the definition of the relevant market is a matter of judgment and analysis. As a result, you should be aware that market share, ranking and other similar information set forth in this prospectus, and estimates and beliefs based on such data, may not be reliable.
75
Table of Contents
The automotive industry is one of the world’s largest and most competitive. Consumer demand for new vehicles largely determines sales and production volumes of global OEMs, and component suppliers rely on high levels of vehicle sales and production to be successful.
The automotive supplier industry is generally characterized by high barriers to entry, significant start-up costs and long-standing customer relationships. The key criteria by which OEMs judge automotive suppliers include price, quality, service, performance, design and engineering capabilities, innovation, timely delivery and, more recently, financial stability. Over the last decade, those suppliers that have been able to achieve manufacturing scale, reduce structural costs, diversify their customer bases and establish a global manufacturing footprint have been successful.
The table below outlines vehicle production forecasts for years 2010 through 2014:
| 2010 | 2011 | 2012 | 2013 | 2014 | ||||||||||||||||
| (vehicle units in millions) | ||||||||||||||||||||
| Europe |
18.0 | 18.3 | 19.3 | 20.8 | 21.8 | |||||||||||||||
| North America |
11.8 | 12.2 | 13.3 | 14.4 | 15.2 | |||||||||||||||
| Asia |
33.4 | 34.9 | 38.1 | 41.1 | 43.0 | |||||||||||||||
Source: IHS Automotive September 2010 Forecast
Among the leading drivers of new vehicle demand is the availability of consumer credit to finance purchases. Beginning in late 2008, turmoil in the global credit markets and the recession in the United States and global economies led to a severe contraction in the availability of consumer credit. As a result, global vehicle sales volumes plummeted, led by severe declines in the mature North American and European markets. During 2009, North American light vehicle industry production declined by approximately 32% from 2008 levels to 8.6 million units, while European light vehicle industry production declined by approximately 20% from 2008 levels to 16.3 million units. The decline was less pronounced in Asia, where volumes were down only 1% from 2008 levels to 26.6 million units. This resilience was largely attributable to the continued expansion of the Chinese and Indian markets, both of which are expected to continue to increase as a share of the global automotive market in the coming years.
The severe decline in vehicle sales and production in 2009 led to major restructuring activity in the industry, particularly in North America. GM and Chrysler reorganized through chapter 11 bankruptcy proceedings and the Detroit 3 undertook other strategic actions, including the divestiture or discontinuance of non-core businesses and brands and the acceleration or broadening of operational and financial restructuring activities. A number of significant automotive suppliers, including us, restructured through chapter 11 bankruptcy proceedings or through other means.
Several significant trends and developments are now contributing to improvement in the automotive supplier industry. These include improved retail vehicle sales and production in North America in the fourth quarter of 2009 and first quarter of 2010, a more positive credit environment, the continued growth of new markets in Asia, particularly China, and increased emphasis on “green” and other innovative technologies.
Positive North American Sales Trends
U.S. light vehicle sales declined significantly in 2008 and through the first two fiscal quarters of 2009. In 2000, 17.4 million light vehicles were sold in the U.S. In 2004, that number remained at a similar level at 16.9 million units, and in 2007, declined only slightly to 16.1 million units. However, as a result of the unprecedented global economic crisis, these levels declined precipitously with a 5.7 million unit decline, the largest drop off in any two year period in U.S. automotive history, bringing sales to post-World War II levels with 10.4 million units sold in
76
Table of Contents
2009. Based on monthly seasonally adjusted annual rate, or SAAR, it appears that sales bottomed in September 2009. Since then, monthly SAAR has continued to climb, reversing the trend from the second half of 2008. OEMs have reported positive sales numbers in each of the first two months of 2010, which further supports a turnaround.
In addition to a rebounding economy and greater availability of credit boosting light vehicle sales, the industry is also expected to be buoyed by pent-up demand as consumer confidence regains momentum, the return of leasing options and a pipeline of new products with a focus on fuel efficiency, safety and the latest electronics. Furthermore, in 2009, for the first time since 1945, more vehicles were scrapped than vehicles were sold and over 4.0 million vehicles have been shed from the total U.S. fleet, creating additional demand for replacement vehicles.
Global Light Vehicle Production Projected to Increase
In the face of declining sales figures, automotive OEMs slashed production and idled plants in 2009, resulting in an over 43.0% drop in production as compared to 2007 in North America and an approximate 25.0% drop in Europe. With sales projections rebounding, OEMs need to replenish inventory, and this in turn bodes well for the supplier base. Over the next four years, light vehicle production is expected to increase at a 14.3% compound annual growth rate in North America, 9.4% in the Asia/Pacific region, and 5.1% in Europe. While the production levels reached in 2013 are expected to be lower than pre-crisis levels in North America and Europe, OEMs and suppliers that restructured their cost base to achieve profitability in lower-volume environments are poised to reap significant rewards. Additionally, the global nature of the light vehicle rebound means that OEMs and suppliers with global operations are well positioned to maximize the coming opportunity.
Consumer Preferences Shifting to Small Cars
In 1985, light trucks accounted for only 28% of total U.S. sales volume. However, due to rising gas prices and increased awareness of environmental issues, consumer sentiment has shifted in recent years in favor of cars, specifically smaller B and C segment vehicles. While demand for Ford F-150 and GMT 900 trucks remains strong, as of January 2010 light trucks accounted for only 48% of total sales volume, an inversion of the pre-crisis forecasts.
Electrification/Efficiency
Consumer appeal, stemming from the high prices of conventional fuel and greater awareness of environmental issues, and government regulation are increasing the demand for hybrid electric, or HEVs, and electric vehicles, or EVs. These vehicles offer improved gas mileage and reduced carbon emissions, and may ultimately provide a vehicle alternative that eliminates the need for conventional gasoline engines. Industry experts project that by 2020, almost half of U.S. vehicles will require some form of battery technology to meet new Corporate Average Fuel Economy regulatory standards. The U.S. Government recently announced new national standards to cut emissions and increase gas mileage, mandating that U.S. passenger vehicles and light trucks must average 35.5 miles per gallon by 2016. In addition, governments continue to implement economic incentives related to fuel efficiency. For example, in February 2009, the U.S. government enacted the American Recovery and Reinvestment Act which, among other things, provides for a tax credit of between $2,500 and $7,500 for the purchase of plug-in electric vehicles depending on the battery capacity, and the Department of Energy announced a $300 million grant program to provide funding for cost-shared projects that expand the use of alternate fueled vehicles and advanced technology vehicles, including the installation of after-market equipment necessary to support them.
Similar industry dynamics are creating a demand for new battery technology applications in the heavy-duty transportation market, particularly in buses, trucks and other industrial vehicles. The higher fuel consumption rate of these large vehicles makes the potential fuel cost savings derived from the use of batteries even greater.
77
Table of Contents
Several government authorities and corporations are evaluating battery technologies for their large fleets of heavy-duty vehicles. For example, the City of London has announced plans to convert its fleet of buses to HEVs, with a goal that by 2012 all new buses entering the fleet will be HEVs.
Industry Sub Sector Overview
Body & chassis systems
Body sealing. Body sealing products protect the interior of a vehicle from weather and road noise or secure glass within the auto framework. Sealing products are generally manufactured with EPDM and thermoplastic elastomers and are found primarily on and around the door, windows, hood and trunk of the automobile. The size of the global body sealing system market is greater than $6 billion. The market is highly competitive and has become more consolidated as suppliers have grown in scale and expanded globally. Trends benefiting sealing suppliers include continued migration toward use of plastic components in weather-sealing applications, as well as increasing penetration of modular sealing systems. Key competitors in this market include Hutchinson (a subsidiary of Total SA), Henniges, SaarGummi and Toyoda Gosei Co. Ltd. Management believes that we are the largest supplier globally of automotive body sealing products.
Anti-Vibration. Anti-Vibration Systems, including engine and body mounts, dampers, isolators and springs, are designed to control and isolate noise and vibration and improve ride and handling. The global AVS market is approximately $8 billion and continues to expand due to consumer demand for quieter and smoother-riding vehicles. Within the AVS market, firms compete on design, engineering, product quality and price. Despite increasing globalization of manufacturing, barriers to entry remain significant as OEMs require significant engineering and technical expertise for AVS products. Key competitors in this market are Contitech, Paulstra (a subsidiary of Total SA) and Trelleborg.
Fluid systems. Automotive fluid products include systems, subsystems and components that direct, control and transport fluids and vapors throughout an automobile. Because of the numerous areas and broad applications within the vehicle that require fluid systems, this market remains fragmented. The aggregate global fluids markets in which we compete are estimated by management to represent annual sales of approximately $7 billion. The primary trend in the overall fluid systems market is the movement toward systems integration as OEMs increasingly desire suppliers that have the engineering and technical capabilities to design and manufacture complete modules and systems. Other factors contributing to growth in demand for fluid handling products include increasing emissions standards, diesel engine adaptation and automotive HVAC penetration. Key competitors in this market include Hutchinson, TI Automotive and Martinrea. Management believes that we are the second largest supplier globally of automotive fluid handling products.
78
Table of Contents
Our Business
We are a leading manufacturer of body sealing, AVS and fluid handling components, systems, subsystems and modules. Our products are primarily for use in passenger vehicles and light trucks that are manufactured by global automotive original equipment manufacturers and replacement markets.
We design and manufacture our products in each major automotive region of the world in close proximity to our customers through a disciplined and consistent approach to engineering and production. We operate in 66 manufacturing locations and nine design, engineering and administrative locations around the world, including Australia, Belgium, Brazil, Canada, China, Czech Republic, France, Germany, India, Italy, Japan, Korea, Mexico, the Netherlands, Poland, Spain, the United Kingdom and the United States. For the year ended December 31, 2009, we generated approximately 47% of our sales in North America, 40% in Europe, 6% in South America and 7% in Asia/Pacific.
For the year ended December 31, 2009, approximately 80% of our sales were direct to OEMs, including Ford, GM and Chrysler, Fiat, Volkswagen/Audi Group, Renault/Nissan, PSA Peugeot Citroën, Daimler, BMW, Toyota, Volvo, Jaguar/Land Rover and Honda. The remaining 20% of our sales for the year ended December 31, 2009 were primarily to Tier I and Tier II automotive suppliers and non-automotive customers. As of December 31, 2009, our products were found in 17 of the 20 top-selling vehicle models in North America and in 19 of the 20 top-selling vehicle models in Europe.
The following chart illustrates our balance and diversity by providing a breakdown of our $1.9 billion in sales for the year ended December 31, 2009 by geography and customer.
|
|
|
We conduct substantially all of our activities through our subsidiaries and sell our product lines through two reportable segments—North America and International. The International segment covers Europe, South America and Asia. For the year ended December 31, 2009, the five months ended May 31, 2010 and the four months ended September 30, 2010, we had sales of $1.9 billion, $1.0 billion and $0.8 billion and a net loss of $(356.1) million and net income of $636.3 million and $25.7 million, respectively. On a pro forma basis, for the year ended December 31, 2009 and on a combined pro forma basis for the nine months ended September 30, 2010, we had sales of $1.9 billion and $1.8 billion and a net loss of $(332.4) million and net income of $44.7 million, respectively. See “Business” for a more detailed description of our business.
79
Table of Contents
Our Competitive Strengths
Innovative and high quality products
We believe we have distinguished ourselves in the automotive industry through our engineering and technological capabilities, as evidenced by our development of innovative solutions, including our ESP Thermoplastic Glassruns (body sealing), ride stabilizing hydromounts (AVS) and proprietary plastics-to-aluminum overmolding process (fluid handling). In addition, we believe we have a reputation for outstanding quality within the automotive industry, a factor that has been important to maintaining and expanding our successful relationships with our customers. We have earned numerous awards, including, among others, the DaimlerChrysler Global Supplier Award, GM Supplier of the Year, Ford’s Silver World Excellence Award and Toyota’s Cost Excellence Performance Award.
Operational excellence
We have a proven track record and disciplined approach to operational excellence, which has generated significant cost savings of approximately 4% of sales annually since 2004. We believe we have the ability to generate similar savings in the future due to the flexible nature of our manufacturing capabilities, our highly efficient operations and our ability to leverage economies of scale from the high volumes of products we produce for the world’s top-selling vehicle platforms. We have created a culture of continuous improvement and lean manufacturing in all aspects of our operations. Over the life cycle of each platform, we focus on streamlining manufacturing, increasing automation and reducing material and other costs in an effort to generate additional operational savings. We budget and track operational savings at the facility level, which management regularly reports and reviews.
Strong customer relations and program management
We believe that our customer relationships, program management capabilities, global presence, comprehensive product line, excellence in manufacturing, product innovation and quality assurance combine to provide us with significant competitive advantages. We have proven our ability to expand globally with customers, increase scale in a consolidating industry and be first-to-market with design and engineering innovations.
We have a high level of dedication to customer service, and for each major product launch we dedicate a team of sales representatives, engineers, quality specialists and senior management, who work together to ensure that the product launch is completed on time and consistent with rigorous quality standards. These characteristics have allowed us to remain a leading supplier to Ford and GM while steadily growing our business with European and Asian OEMs. Our capabilities are evidenced by our success in being awarded significant content on our customers’ top-selling platforms, including the Ford F-Series and GM’s GMT900 platform, which includes the Yukon, Tahoe, Sierra and Silverado vehicle models.
Global manufacturing footprint
We have established a global manufacturing footprint that allows us to serve our customers worldwide. Our global manufacturing operations are supported by 66 manufacturing locations and nine design, engineering and administrative locations around the world, including Australia, Belgium, Brazil, Canada, China, Czech Republic, France, Germany, India, Italy, Japan, Korea, Mexico, the Netherlands, Poland, Spain, the United Kingdom and the United States. Since 2004, we have increased our sales outside North America from 30% to 53%, largely reflecting our strategic focus on gaining exposure to high growth Asian markets and from key acquisitions in Europe. As part of our strategy, we operate several successful international joint ventures, which has allowed us to enter into new geographic markets, to acquire new customers and to develop new technologies. Our joint venture partners provide knowledge and insight into local markets and access to local suppliers of raw materials and components. We believe our global manufacturing footprint and proximity to customers provides us with a competitive advantage by allowing us to efficiently transport parts to local customers at a significantly lower cost as many of the parts are difficult to transport across long distances.
80
Table of Contents
Incumbent position across diverse customer base
In 2009, our products were found in 17 of the 20 top-selling vehicle models in North America and in 19 of the 20 top-selling vehicle models in Europe. As the incumbent supplier to platforms, we have typically participated in the design of their successor platforms, and therefore, we believe we have been afforded a competitive advantage to win the upgrade and the ultimate replacement business. In addition, we believe that our presence on our largest customers’ highest-volume and most important platforms is a competitive advantage that allows us to further increase our market share, cross-sell our other product lines, fully leverage our lean initiatives, spread our fixed costs over higher volumes and increase our return on capital.
Experienced management team
Our senior management team has extensive experience in the automotive industry and collectively has over 130 years of experience in the industry. Our management team is focused on guiding us through the challenges facing the automotive industry and the changing economic environment through ongoing and continued cost reduction and restructuring initiatives and is intent on continuing to implement our business strategies. For more information on our executive officers, see “Management—Directors and Executive Officers.”
Conservative capital structure
Upon the emergence date, we significantly improved our leverage as compared to historical levels. As part of our plan of reorganization, we extinguished $1,126.7 million of prepetition debt, issued $450 million of our senior notes, and entered into our $125 million senior ABL facility. At the emergence date, we had $479.3 million of outstanding indebtedness, consisting of our senior notes and $29.3 million in other debt of certain of our foreign subsidiaries. Our senior ABL facility is subject to borrowing base limitations, and we had approximately $34.3 million of letters of credit outstanding but not drawn under our senior ABL facility on the emergence date. For the year ended December 31, 2009, the five months ended May 31, 2010 and the four months ended September 30, 2010, we had a net loss of $(356.1) million and net income of $636.3 million and $25.7 million, respectively. On a pro forma basis, for the year ended December 31, 2009 and on a combined pro forma basis for the nine months ended September 30, 2010, we had a net loss of $(332.4) million and net income of $44.7 million, respectively. We believe our emergence date capital structure is a conservative and stable structure.
Our Business Strategy
Continue optimization of our business and cost structure
We seek to optimize our business and cost structure so that we are appropriately configured in the rapidly changing environment in the automotive industry, with an emphasis on reducing our overall cost structure and making our manufacturing operations more efficient. Our primary areas of focus are:
| • | Identifying and implementing lean manufacturing initiatives. Our lean manufacturing initiatives focus on optimizing manufacturing by eliminating waste, controlling cost and enhancing productivity. Lean manufacturing initiatives have been implemented at each of our manufacturing and design facilities and continue to be an important element in our disciplined approach to operational excellence. |
| • | Relocating operations to lower-cost countries. We are supplementing our Western European operations with Central and Eastern European facilities where there are lower operating costs and to more closely match our customers’ footprints for more efficient transport of parts. In addition, we have expanded our operations in China, India and Mexico. |
| • | Consolidating facilities to reduce our cost structure. Our optimization efforts are designed to streamline our global operations and include taking advantage of opportunities to reduce our overall cost structure by consolidating and closing facilities. For example, in the second half of 2009, we closed two manufacturing facilities, one located in Ohio and another located in Germany, and in March 2010, we announced the closure of our manufacturing facility in Spain. We will continue to take a disciplined approach to evaluating opportunities that would improve our efficiency, profitability and cost structure. |
81
Table of Contents
| • | Maintaining flexibility in all areas of our operations. Our operational capital needs are generally lower than many in our industry and a major portion of our manufacturing machinery is movable from job-to-job, providing us flexibility in adapting to market changes and serving customers worldwide. |
Further developing technologies
We will draw on our technical expertise to provide customers with innovative solutions. Our engineers combine product design with a broad understanding of material options for enhanced vehicle performance. We believe our reputation for successful innovation in product design and material usage is the reason our customers consult us early in the development and design process of their next generation vehicles.
Recent innovations that highlight our ability to combine materials and product design expertise can be found in the following products:
| • | Safe Seal™. Safe Seal™ is a body sealing product featuring sensors built into the seal capable of reversing power windows, doors and partitions to prevent injury. |
| • | Our new generation Hydro Body Mount. Our new generation Hydro Body Mount features patented Inertia-track design, combining plastic, metal and rubber to provide superior damping in the driver compartment for improved ride. |
| • | Direct Injection Fuel Rail. Direct Injection Fuel Rails draw upon our innovative welding processes and understanding of metal dynamics to create high pressure capability for highly advanced direct injection engines, improving fuel economy and performance. |
| • | Stratlink. Utilizing our internal material engineering capabilities, we have developed a rubber compound that performs equally with externally sourced compounds, which will significantly reduce cost. |
| • | PlastiCool. PlastiCool is a low cost, low weight, high temperature alternative to metal and rubber hose currently used in transmission cooling that offers a more robust joint design, improving quality and potentially reducing warranty costs. Additionally, because the material is smaller than current alternatives, it allows for greater design flexibility. |
Continued emphasis on fuel efficient, global and high volume vehicles
We believe that by focusing on fuel efficient, global and high volume vehicles, we will be able to solidify and expand our global leadership position.
| • | Fuel efficient. With the recent shift in customer preferences toward light weight, fuel efficient vehicles, we intend to target small car, hybrid and alternative powertrains and increase the content we provide to these platforms. We believe that furthering our position in the small car and hybrid market and alternative powertrains will allow us to increase market share, create greater economies of scale and provide more opportunities to partner with customers. |
| • | Global. Our global presence makes us one of the select few manufacturers of products in our product line areas who can take advantage of the many business opportunities that are becoming available worldwide as a result of the OEMs’ expanding emphasis on global platforms. Examples of successful global platforms we supply are the redesigned Ford Fiesta and GM’s Buick LaCrosse. |
China, India and South America will continue to be regions of emphasis as their light vehicle market is projected to grow substantially as their economies continue to develop. In China, we are developing a substantial manufacturing and marketing presence to serve local OEMs, and we intend to follow our customers as they target other high growth developing markets.
| • | High volume. While smaller cars and crossover vehicles have grown in popularity, certain large car and truck platforms continue to be in demand and remain important to our business. For example, the Ford F-150 and GM’s GMT 900 platform (the Silverado, Sierra, Tahoe and Yukon nameplates) continue to be popular models for which we supply a broad range of our product offerings, including body sealing systems, anti-vibration systems and fuel, brake, emissions and thermal management components. |
82
Table of Contents
Through our extensive product portfolio, innovative solutions and broad global capabilities, we expect to continue winning new business across all major regions and automakers.
Developing systems solutions and other value-added products
We believe that significant opportunities exist to grow by providing complete subsystems, modules and assemblies. As a leader in design, engineering and technical capabilities, we are able to focus on improving products, developing new technologies and implementing more efficient processes in each of our product lines. Our body sealing products are visible to vehicle passengers and can enhance the vehicle’s aesthetic appeal, in addition to creating a barrier to wind, precipitation, dust and noise. Our AVS products are an important contributor to vehicle quality, significantly improving ride and handling. Our fluid handling modules and subsystems are designed to increase functionality and decrease costs to the OEM, which can be the deciding factor in winning new business.
Selectively pursuing complementary acquisitions and alliances
We intend to continue to selectively pursue complementary acquisitions and joint ventures to enhance our customer base, geographic penetration, scale and technology. Consolidation is an industry trend and is encouraged by the OEMs’ desire for fewer supplier relationships. We believe we have a strong platform for growth through acquisitions based on our past integration successes, experienced management team, global presence and operational excellence. In addition, we believe joint ventures allow us to penetrate new markets with less relative risk and capital investment. We currently operate through several successful joint ventures, including those with Nishikawa Rubber Company, Zhejiang Saiyang Seal Products Co., Ltd., Guyoung Technology Co. Ltd., Hubei Jingda Precision Steel Tube Industry Co., Ltd., or Jingda, Shanghai Automotive Industry Corporation, or SAIC, and Toyoda Gosei Co., Ltd., or Toyoda Gosei.
Developing business in non-automotive markets
While the automotive industry will continue to be our core business, we supply other industries with products using our expertise and material compounding capabilities. For example, we supply parts to customers in the technical rubber business and develop and produce synthetic rubber products for a variety of industry applications, including aircraft flooring, commercial flooring, insulating sheets for power stations, non-slip step coverings, rubber for appliances and construction applications. In our technical rubber business we fabricate products from a wide variety of elastomer compounds and can custom fit many applications.
Corporate History and Business Developments
Cooper-Standard Holdings Inc. was formed and capitalized in 2004 as a Delaware corporation and began operating on December 23, 2004, when it acquired the automotive segment of Cooper Tire & Rubber Company, or the 2004 acquisition. Cooper-Standard Holdings Inc. operates the business primarily through its principal operating subsidiary, Cooper-Standard Automotive Inc.
In February 2006, we acquired fifteen fluid handling systems operations in North America, Europe and China, or, collectively, FHS, from ITT Industries, Inc. In August 2007, we acquired MAPS from Automotive Sealing Systems S.A. We completed a related acquisition of MAP India in December 2007. In addition to the FHS and MAPS acquisitions, we acquired a hose manufacturing operation in Mexico from the Gates Corporation and a fuel rail operation in Mexico from Automotive Component Holdings, LLC, in 2005 and 2007, respectively. For additional information on our acquisitions, see note 5 to our audited annual financial statements.
From the time of the 2004 acquisition until March 2009, we operated our businesses through global operating divisions organized on a product-line basis. In March 2009, in response to a severe decline in worldwide automotive production that began in the second half of 2008, we announced the implementation of a
83
Table of Contents
comprehensive plan involving the discontinuation of our global product line operating divisions, formerly called the Body & Chassis Systems division and the Fluid Systems division, and the establishment of an operating structure organized on the basis of geographic regions. We now operate from two divisions, North America and International (covering Europe, South America and Asia). The new operating structure has allowed us to maintain our full portfolio of global products and provide unified customer contact points, while better managing our operating costs and resources. This plan resulted in a reduction in our worldwide salaried workforce by approximately 20%.
As part of the plan, our reporting segments changed to reflect the new operating structure. Segment information concerning sales to external customers, intersegment sales, segment profit, depreciation and amortization expense, capital expenditures and segment total assets for the last three fiscal years and the three and nine month periods ended September 30, 2010, respectively, is set forth in note 20 to our audited annual financial statements and note 16 to our unaudited consolidated financial statements, respectively, and “Management’s Discussion and Analysis of Financial Condition and Results of Operations—Segment Results of Operations for the Year Ended December 31, 2009 ” and “Management’s Discussion and Analysis of Financial Condition and Results of Operations—Segment Results of Operations for the Three and Nine Month Periods Ended September 30, 2010.”
In addition to the measures associated with the reorganization of our operating units, we have implemented a number of restructuring initiatives in recent years, including the closure of facilities in North America, Europe and Asia. For information on these restructuring initiatives, see note 6 to our audited annual financial statements and “Management’s Discussion and Analysis of Financial Condition and Results of Operations—Restructuring.”
Products
We supply a diverse range of products on a global basis to a broad group of customers across a wide range of vehicles. Our principal product lines are body and chassis products and fluid handling products. For the years ended December 31, 2008 and 2009, and the nine months ended September 30, 2010, body and chassis products accounted for 66%, 65% and 66%, respectively, of our sales, and fluid handling products accounted for 34%, 35% and 34%, respectively, of our sales. The top ten vehicle platforms we supply accounted for approximately 28% of our sales in 2008, 32% of our sales in 2009 and 34% of our sales for the nine months ended September 30, 2010. Our principal product lines are described below.
| Product Lines |
Solutions |
Products & Modules |
Market Position* | |||||
| Body & Chassis: |
||||||||
| Body Sealing |
Protect vehicle interiors from weather, dust and noise intrusion | Extruded rubber and thermoplastic sealing, weather strip assemblies and encapsulated glass products | #1 globally | |||||
| Anti-Vibration |
Control and isolate noise and vibration in the vehicle to improve ride and handling | Engine and body mounts, dampers, isolators, springs, stamped or cast metal products and rubber products | #3 North America | |||||
| Fluid Handling |
Control, sense, measure and deliver fluids and vapors throughout the vehicle | Pumps, tubes and hoses, connectors and valves (individually and in systems and subsystems) | #2 globally | |||||
| * | Market positions are management’s estimates, which are based on reports prepared by industry consultants commissioned by us in 2008. See “Market and Industry Data.” |
84
Table of Contents
Body & chassis products
We are a leading global supplier of automotive body sealing and AVS products. Body sealing products protect vehicle interiors from weather, dust and noise intrusion. AVS products isolate and reduce noise and vibration to improve ride and handling. Body sealing and AVS products lead to a better driving experience for all occupants. For the years ended December 31, 2008 and 2009 and the nine months ended September 30, 2010, we generated approximately 66%, 65% and 66%, respectively, of total corporate revenue from the sale of body and chassis products (before corporate eliminations).
Body sealing
Based on third party analysis, we are the leading global supplier of body sealing products to the automotive industry. We are known throughout the industry to be a leader in providing innovative design and manufacturing solutions for complex automotive designs.
Our body sealing products are comprised of ethylene propylene diene M-class rubber, or EPDM-synthetic rubber, and thermoplastic elastomers, or TPE. The typical production process involves mixing of rubber compounds, extrusion (supported with metal and woven wire carriers or unsupported), cutting, notching, forming, injection molding and assembly.
85
Table of Contents
Below is a description of our primary sealing products:
| Product Category |
Description | |
| Dynamic seals |
Designed and used for areas of the vehicle in which a gap exists between the vehicle body and movable closures. The seals function to isolate cockpit occupants and engine components from exterior climate conditions such as wind noise and water, providing the occupants with an improved vehicle experience.
Door seals: Sectional seal design that fits the door structure and body cabin to seal rain dust, and noise from the occupants of vehicles.
Body seals: Secondary seal used to provide further noise and aesthetic coverage of welt flanges on the vehicle body.
Hood seals: Located on body flanges in the engine compartment protecting against water and dust penetration while also reducing engine and road noise in the vehicle cabin during high speed travel.
Trunk lid and lift gate seals: Located on body flanges in the truck or lift gate compartment offering protection against water and dust penetration.
Lower door seals/rocker seals: Offers protection in the “rocker” area against water and dust penetration. Reduces loud road noise entering the cabin during high speed driving.
Sunroof seals: Creates a narrow sealing space and minimize resistance for the sunroof. | |
| Static seals |
Designed for stationary areas of the vehicle body. The seals function to isolate cockpit occupants and engine components from exterior climate conditions such as wind noise and water for improved vehicle experience.
Belt line seal: Provides protection against water, dust and noise for driver and passenger door moveable glass. | |
| Glass run assembly: Enables the movable door glass and door to form one surface, improving glass movement and sealing the vehicle cabin from the exterior environment.
Quarter window trim/glass encapsulation: Integral pillar moldings and decorative plastic or metal corner trims seal fixed quarter side glass windows.
Appliqués: Also referred to as greenhouse moldings, these seals act as an aesthetic covering for A, B and C pillars. | ||
| Convertible seals |
Sealing materials that combine compressibility with superior design for use on a convertible vehicle soft top weather sealing application. | |
Chassis
Based on third party analysis, we are one of the leading suppliers of AVS products in North America. We are known in North America for utilizing our advanced development and testing of AVS products and subsystems to provide innovative solutions.
Our AVS products include components manufactured with various types of rubber–natural rubber, butyl or EPDM in combination with stamped steel, aluminum or cast iron sub-components. Additionally, we supply brackets that are manufactured from stamped steel, aluminum or cast iron as individual final products. The typical production process for a rubber and metal product involves mixing of rubber compounds, metal preparation (cleaning and primer application), injection molding of the rubber and metals, final assembly and testing as required based on specific products.
86
Table of Contents
Below is a description of our primary chassis products:
| Product Category |
Description | |
| Body/cradle mounts |
Enable isolation of the interior cabin from the vehicle body reducing noise, vibration and harshness.
Hydro body mounts: A body mount filled with fluid providing spring rate and damping performance that varies according to frequency and displacement of vibration. Conventional (non-hydro) mounts provide fixed response. Hydromounts can provide a more comfortable ride in a vehicle during idling or traveling. | |
| Powertrain mounts |
Secures and isolates vehicle powertrain noise, vibration, and harshness from the uni-body or frame.
Transmission mounts: Enables mounting of transmission to vehicle body while reducing vibration and harshness from the powertrain.
Torque strut: Controls the fore and aft movement of transverse mounted engines within their compartment while isolating engine noise and vibration from the vehicle body.
Hydro engine mounts: This technology applies the same principles as the above mentioned hydro body mounts specific for an engine application. | |
| Suspension |
Allows flexibility in suspension components and eliminates AVS from entering the interior cabin.
Hydrobushing: Similar benefits to hydromounts; however, these are designed to be installed in a link or control versus a bracket attached to a vehicle.
Mass damper: Developed to counteract a specific resonance at a specific frequency to eliminate undesirable vibration. | |
Fluid handling products
We are one of the leading global integrators of fluid subsystems and components that control, sense and deliver fluids and vapors in motor vehicles. We believe we are the second largest global provider of fluid handling system products manufactured in our industry. We offer an extensive product portfolio and are positioned to serve our diverse customer base around the world. Utilizing our core competencies in thermal management, emissions management and fuel delivery systems, we create the highest value for our global customers by engineering unique solutions that anticipate and exceed their needs through Design For Six Sigma, seamless launches, lean enterprise principles and key strategic alliances. For the years ended December 31, 2008 and 2009 and the nine months ended September 30, 2010, we generated approximately 34%, 35% and 34% of total corporate revenue from the sale of fluid handling products (before corporate eliminations).
We support the green technology trend as our customers expand towards hybrids and alternative powertrains required to meet future fuel efficiency demands. We provide thermal management solutions that enhance hybrid and electric vehicle powertrain cooling systems and offer bio-fuel compatible materials for alternative fuel vehicles. Our products support improved fuel economy initiatives with light weight, high performance plastic and aluminum materials that reduce weight and offer an improved value equation. We specialize in complete fuel system integration encompassing products from the fuel rail to the fuel tank lines. We support reduced emissions through the control of flow and temperature of exhaust gas.
87
Table of Contents
Our fluid handling products are principally found in four major vehicle systems: thermal management; fuel and brake; emissions management; and power management. Below is a description of our primary fluid handling products:
| Product Category |
Description | |||
| Thermal Management |
Direct, control and transport oil, coolant, water and other fluids throughout the vehicle | |||
| Engine oil cooling subsystems with over molded connections | Transmission oil cooling subsystems | |||
| Engine oil cooler tube and hose assemblies | Transmission oil cooler tube and hose assemblies | |||
| Engine oil cooling quick connects | Engine oil level indicator tube assemblies | |||
| Electro/mechanical water valves and pumps | Integrated thermostats and plastic housings | |||
| Coolant subsystems | Bypass valves | |||
| Radiator and heater hoses | Auxiliary oil coolers | |||
| Fuel & Brake |
Direct, control and transport fuel, brake fluid and vapors throughout the vehicle | |||
| Fuel supply and return lines | Flexible brake lines | |||
| Fuel/Vapor quick connects | Vacuum brake hoses | |||
| Fuel/Vapor lines | ||||
| Emissions Management |
Direct, control and transmit emission vapors and fluids throughout the vehicle | |||
| Fully integrated exhaust gas recirculation modules | Exhaust gas recirculation valves | |||
| EGR coolers and bypass coolers | DPF lines | |||
| Exhaust gas recirculation tube assemblies | Secondary air tubes | |||
| Power Management |
Direct, control and transmit power management fluids throughout the vehicle | |||
| High pressure roof lines | Power steering pressure and return lines | |||
| Hydraulic clutch lines | Air bag tubes | |||
Supplies and Raw Materials
Raw material prices have fluctuated greatly in recent years. We have implemented strategies with both our suppliers and our customers to help manage spikes in raw material prices. These actions include material substitutions, use of hedging and leveraging our global buy. Global optimization also includes using benchmarks and selective sourcing from low cost regions. We have also made process improvements to ensure the most efficient use of materials through scrap reduction, as well as standardization of material specification to maximize leverage over a higher volume purchase.
88
Table of Contents
The primary raw materials for our business include fabricated metal-based components, synthetic rubber, carbon black and natural rubber.
Patents and Trademarks
We believe one of our competitive advantages is our application of technological innovation to customer challenges. We hold over 500 patents in key product technologies, such as Daylight Opening Modules, Engineered Stretched Plastics, Low Fuel Permeation Nylon Tubing and Quick Connect Fluid Couplings, as well as core process methods, such as molding, joining and coating. Our patents are grouped into two major categories, products, which relate to specific product invention claims for products which can be produced, and processes, which relate to specific manufacturing processes that are used for producing products. The vast majority of our patents fall within the products category. We consider these patents to be of value and seek to protect our rights throughout the world against infringement. While in the aggregate these patents are important to our business, we do not believe that the loss or termination of any one of them would materially affect us. We continue to seek patent protection for our new products. Additionally, we develop significant technologies that we treat as trade secrets and choose not to disclose to the public through the patent process, but they nonetheless provide significant competitive advantage and contribute to our global leadership position in various markets.
We also have technology sharing and licensing agreements with various third parties, including with Nishikawa Rubber Company, one of our joint venture partners in body sealing products. We have mutual agreements with Nishikawa Rubber Company for sales, marketing and engineering services on certain body sealing products we sell and have maintained a relationship for more than 20 years. Under those agreements, each party pays for services provided by the other and royalties on certain products for which the other party provides design or development services.
We own or have licensed several trademarks that are registered in many countries, enabling us to protect and market our products worldwide. Key trademarks include StanPro® (aftermarket trim seals), Safe Seal™ (obstacle detection sensors) and Stratlink™ (proprietary TPV polymer).
Seasonality
Historically, sales to automotive customers are lowest during the months prior to model changeovers and during assembly plant shutdowns. However, economic conditions and consumer demand may change the traditional seasonality of the industry as lower production may prevail without the impact of seasonality. Historically, model changeover periods have typically resulted in lower sales volumes during July, August and December. During these periods of lower sales volumes, profit performance is lower but working capital improves due to continuing collection of accounts receivable.
Competition
We believe that the principal competitive factors in our industry are price, quality, service, performance, design and engineering capabilities, innovation and timely delivery. We believe that our capabilities in these core competencies are integral to our position as a market leader in each of our product lines. Our body and chassis products compete with Toyoda Gosei, Trelleborg, Tokai, Vibracoustic, Paulstra, Hutchinson, Henniges, Meteor, SaarGummi and Standard Profil, among others. Our fluid handling products compete with TI Automotive, Martinrea, Hutchinson, Conti-Tech and Pierburg Gustav Wahler, along with numerous smaller companies in this competitive market.
Customers
We are a leading supplier to the Detroit 3 in each of our product categories and are increasing our presence with European and Asian OEMs. During the year ended December 31, 2009, approximately 34.8%, 15.5%, 8.1%, 7.4% and 5.5% of our sales were of product on platforms produced by Ford, GM, Fiat, Volkswagen/Audi and
89
Table of Contents
Chrysler, respectively. Our other major customers include OEMs such as Renault/Nissan, PSA Peugeot Citroën, BMW, Daimler and various Indian and Chinese OEMs. We also sell products to Visteon/ACH, Toyota, Porsche and, through NISCO, Honda. Our business with any given customer is typically split among several contracts for different parts on a number of platforms.
Backlog
Our OEM sales are generally based upon purchase orders issued by the OEMs and as such we do not have a backlog of orders at any point in time. Once selected to supply products for a particular platform, we typically supply those products for the platform life, which is normally six to eight years, although there is no guarantee that this will occur. In addition, when we are the incumbent supplier to a given platform, we believe we have an advantage in winning the redesign or replacement platform.
Research and Development
We operate nine design, engineering and administration facilities throughout the world and employ approximately 500 research and development personnel, some of whom reside at our customers’ facilities. We utilize Design for Six Sigma and other methodologies that emphasize manufacturability and quality. We are aggressively pursuing innovations that assist in resource conservation with particular attention to developing materials that are lighter weight and can be recycled. Our development teams are also working closely with our customers to design and deliver thermal management solutions for cooling electric motors and batteries for new hybrids. We also devote considerable research and development resources into AVS, resulting in high value, state-of-the-art solutions for our customers. These activities are applied not only in our AVS product lines, but also in body sealing (noise transmission isolation and abatement via vehicle windows and doors), fuel delivery systems (isolation of fuel injectors on fuel rails) and thermal management (noise and vibration free coolant pumps and valves). We spend significantly each year to maintain and enhance our technical centers, enabling us to quickly and effectively respond to customer demands. We spent $77.2 million, $81.9 million and $62.9 million in 2007, 2008 and 2009, respectively, on research and development.
Joint Ventures and Strategic Alliances
Joint ventures represent an important part of our business, both operationally and strategically. We have used joint ventures to enter into new geographic markets such as China, Korea and India to acquire new customers and to develop new technologies. In entering new geographic markets, teaming with a local partner can reduce capital investment by leveraging pre-existing infrastructure. In addition, local partners in these markets can provide knowledge and insight into local practices and access to local suppliers of raw materials and components. In North America, joint ventures have proven valuable in establishing new relationships with North American manufacturers. For example, we have business with Honda through our NISCO joint venture. In 2005, we acquired a 20% equity interest in and expanded our technical alliance with Guyoung, a Korean supplier of metal stampings, which built a manufacturing facility in Alabama that services Hyundai. In 2006, we finalized two joint venture agreements with Jingda, one of the largest tube manufacturers in China, to expand our presence in that country. As part of the acquisition of the MAPS business in 2007, we acquired a 47.5% equity interest in Shanghai SAIC-Metzeler Sealing Systems Co. Ltd., a joint venture with SAIC, which also owns a 47.5% equity interest, and Shanghai Qinpu Zhaotun Collective Asset Management Company, which owns the remaining 5% equity interest. This joint venture business is the leading manufacturer of automotive sealing products in China. Also, in 2007, we acquired a 74% equity interest in MAP India, a joint venture with Toyoda Gosei Co., Ltd., which owns the remaining 26% equity interest. MAP India is a leading manufacturer of automotive sealing products in India.
Geographic Information
In 2009, we generated approximately 47% of sales in North America, 40% in Europe, 6% in South America and 7% in Asia/Pacific. Approximately 27%, 14%, 11% and 9% of our sales were generated from our United States, German, Mexican and Canadian operations, respectively.
90
Table of Contents
In 2008, we generated approximately 48% of sales in North America, 42% in Europe, 5% in South America and 5% in Asia/Pacific. Approximately 26%, 17%, 12% and 10% of our sales were generated from our United States, German, Canadian and Mexican operations, respectively.
In 2007, we generated approximately 61% of sales in North America, 31% in Europe, 5% in South America and 3% in Asia/Pacific. Approximately 34%, 15%, 13% and 12% of our sales were generated from our United States, Canadian, German and Mexican operations, respectively.
Employees
We maintain good relations with both our union and non-union employees and, in the past ten years, have not experienced any major work stoppages. We renegotiated some of our domestic and international union agreements in 2009 and have several contracts set to expire in the next twelve months. As of September 30, 2010, approximately 32% of our employees were represented by unions and approximately 13% of our employees were union represented employees located in the United States.
As of September 30, 2010, we had approximately 19,300 full-time and temporary employees.
Environmental
We are subject to a broad range of federal, state and local environmental and occupational safety and health laws and regulations in the United States and other countries, including those governing: emissions to air; discharges to water; noise and odor emissions; the generation, handling, storage, transportation, treatment and disposal of waste materials; the cleanup of contaminated properties; and human health and safety. We may incur substantial costs associated with hazardous substance contamination or exposure, including cleanup costs, fines and civil or criminal sanctions, third party property or natural resource damage, personal injury claims or costs to upgrade or replace existing equipment as a result of violations of or liabilities under environmental laws or the failure to maintain or comply with environmental permits required at our locations. In addition, many of our current and former facilities are located on properties with long histories of industrial or commercial operations and some of these properties have been subject to certain environmental investigations and remediation activities. We maintain environmental reserves for certain of these sites, which we believe are adequate. Because some environmental laws (such as the Comprehensive Environmental Response, Compensation and Liability Act and analogous state laws) can impose liability retroactively and regardless of fault on potentially responsible parties for the entire cost of cleanup at currently or formerly owned and operated facilities, as well as sites at which such parties disposed or arranged for disposal of hazardous waste, we could become liable for investigating or remediating contamination at our current or former properties or other properties (including offsite waste disposal locations). We may not always be in complete compliance with all applicable requirements of environmental law or regulation, and we may receive notices of violation or become subject to enforcement actions or incur material costs or liabilities in connection with such requirements. In addition, new environmental requirements or changes to interpretations of existing requirements, or in their enforcement, could have a material adverse effect on our businesses, results of operations, and financial condition. For example, while we are not large emitters of greenhouse gases, laws, regulations and certain regional initiatives under consideration by the U.S. Congress, the U.S. Environmental Protection Agency, and various states, and in effect in certain foreign jurisdictions, could result in increased operating costs to control and monitor such emissions. We have made and will continue to make expenditures to comply with environmental requirements. While our costs to defend and settle claims arising under environmental laws in the past have not been material, such costs may be material in the future.
Properties
As of September 30, 2010, our operations were conducted through 75 facilities in 18 countries, of which 66 are manufacturing facilities and nine are used for multiple purposes, including design, engineering and administration. Our corporate headquarters is located in Novi, Michigan. Our manufacturing facilities are located
91
Table of Contents
in North America, Europe, Asia, South America and Australia. We believe that substantially all of our properties are in good condition and that we have sufficient capacity to meet our current and projected manufacturing and design needs. Our principal owned and leased properties, and the number of facilities in each location with more than one facility are set forth below.
| Location |
Principal Products |
Owned/Leased | ||
| North America |
||||
| United States |
||||
| Auburn, Indiana |
Anti-Vibration Systems | Owned | ||
| Auburn Hills, Michigan(a) |
Design, engineering and administration | Leased | ||
| Bowling Green, Ohio(2) |
Body Sealing and Fluid Handling | Owned | ||
| Bremen, Indiana(b) |
Body Sealing | Owned | ||
| East Tawas, Michigan |
Fluid Handling | Owned | ||
| Fairview, Michigan |
Fluid Handling | Owned | ||
| Farmington Hills, Michigan(a) |
Design, engineering and administration | Leased | ||
| Gaylord, Michigan |
Body Sealing | Owned | ||
| Goldsboro, North Carolina(2) |
Body Sealing | Owned | ||
| Leonard, Michigan |
Fluid Handling | Owned | ||
| Mt. Sterling, Kentucky |
Fluid Handling | Owned | ||
| New Lexington, Ohio |
Fluid Handling | Owned | ||
| Novi, Michigan(a) |
Design, engineering and administration | Leased | ||
| Oscoda, Michigan |
Fluid Handling | Owned | ||
| Spartanburg, South Carolina |
Body Sealing | Owned | ||
| Surgoinsville, Tennessee |
Fluid Handling | Leased | ||
| Topeka, Indiana(b) |
Body Sealing | Owned | ||
| Canada |
||||
| Georgetown, Ontario |
Body Sealing | Owned | ||
| Glencoe, Ontario |
Fluid Handling | Owned | ||
| Mitchell, Ontario |
Anti-Vibration Systems | Owned | ||
| Stratford, Ontario(3) |
Body Sealing | Owned | ||
| Mexico |
||||
| Aguacalientes |
Body Sealing | Leased | ||
| Atlacomulco |
Fluid Handling | Owned | ||
| Guaymas |
Fluid Handling | Leased | ||
| Juarez |
Fluid Handling | Owned | ||
| Saltillo |
Fluid Handling | Leased | ||
| Torreon(2)(c) |
Fluid Handling | Owned | ||
| South America |
||||
| Brazil |
||||
| Camaçari |
Fluid Handling | Leased | ||
| Sao Paulo(a) |
Sales & Administration | Leased | ||
| Varginha |
Body Sealing and Fluid Handling | Owned | ||
| Europe |
||||
| Belgium |
||||
| Gent |
Body Sealing | Leased | ||
| Czech Republic |
||||
| Zdar |
Fluid Handling | Owned | ||
92
Table of Contents
| Location |
Principal Products |
Owned/Leased | ||
| France |
||||
| Argenteuil(a) |
Design, engineering and administration | Leased | ||
| Baclair |
Body Sealing | Leased | ||
| Creutzwald |
Fluid Handling | Owned | ||
| Lillebonne |
Body Sealing | Owned | ||
| Vitré |
Body Sealing | Owned | ||
| Germany |
||||
| Grünberg |
Fluid Handling | Leased | ||
| Hockenheim |
Fluid Handling | Owned | ||
| Lindau |
Body Sealing | Owned | ||
| Mannheim |
Body Sealing | Owned | ||
| Schelklingen |
Fluid Handling | Owned | ||
| Italy |
||||
| Battipaglia |
Body Sealing | Owned | ||
| Ciriè |
Body Sealing | Owned | ||
| Netherlands |
||||
| Amsterdam(a) |
Administration | Leased | ||
| Poland |
||||
| Bielsko-Biala |
Body Sealing | Owned | ||
| Dzierzoniow(2) |
Body Sealing | Owned | ||
| Myslenice |
Body Sealing | Leased | ||
| Piotrkow |
Body Sealing | Owned | ||
| Spain |
||||
| Getafe(d) |
Fluid Handling | Owned | ||
| United Kingdom |
||||
| Coventry(a) |
Design, engineering and administration | Leased | ||
| Asia Pacific |
||||
| Australia |
||||
| Adelaide |
Fluid Handling | Owned | ||
| China |
||||
| Changchun(b) |
Fluid Handling | Leased | ||
| Chongqing |
Fluid Handling | Owned | ||
| Huai-an(b) |
Body Sealing | Leased | ||
| Jingzhou(b) |
Fluid Handling | Owned | ||
| Kunshan |
Anti-Vibration, Body Sealing and Fluid Handling | Owned | ||
| Panyu(b) |
Body Sealing | Leased | ||
| Shanghai(b) |
Body Sealing | Owned | ||
| Wuhu |
Body Sealing | Owned | ||
| India |
||||
| Chennai |
Fluid Handling | Leased | ||
| Dharuhera(b) |
Body Sealing | Leased | ||
| Ghaziabad(b) |
Body Sealing | Leased | ||
| Gurgaon(b) |
Body Sealing | Leased | ||
| Pune |
Fluid Handling | Leased | ||
| Japan |
||||
| Hiroshima(a) |
Design, engineering and administration | Leased | ||
| Nagoya(a) |
Design, engineering and administration | Leased | ||
| Korea |
||||
| Cheong-Ju |
Body Sealing | Owned | ||
| Seo-Cheon Gun |
Body Sealing & Fluid Handling | Owned |
93
Table of Contents
| (a) | Denotes non-manufacturing locations, including design, engineering or administrative locations. |
| (b) | Denotes joint venture facility. |
| (c) | One of the facilities at this location is scheduled to be closed in 2010. |
| (d) | Denotes location to be closed in 2010. |
Legal Proceedings
We are periodically involved in claims, litigation and various legal matters that arise in the ordinary course of business. In addition, we conduct and monitor environmental investigations and remedial actions at certain locations. Each of these matters is subject to various uncertainties, and some of these matters may be resolved unfavorably for us. A reserve estimate is established for each matter and updated as additional information becomes available. We do not believe that the ultimate resolution of any of these matters will have a material adverse effect on our business, financial condition or results of operations.
On August 3, 2009, we filed a voluntary petition for relief in the Bankruptcy Court to reorganize under chapter 11 of the Bankruptcy Code. We continued to operate our businesses and owned and managed our properties as a debtor-in-possession under the jurisdiction of the Bankruptcy Court in accordance with the applicable provisions of the Bankruptcy Code until we emerged from protection under chapter 11 of the Bankruptcy Code on May 27, 2010. See “Our Reorganization.”
94
Table of Contents
Directors and Executive Officers
Information regarding our directors and executive officers as of the date of this prospectus is set forth below.
| Name |
Age | Position | ||||
| James S. McElya |
63 | Chairman, Director and Chief Executive Officer | ||||
| Edward A. Hasler |
61 | President | ||||
| Allen J. Campbell |
53 | Vice President and Chief Financial Officer | ||||
| Keith D. Stephenson |
50 | President, International | ||||
| Michael C. Verwilst |
57 | Vice President, Mergers & Acquisitions | ||||
| Timothy W. Hefferon |
57 | Vice President, General Counsel and Secretary | ||||
| Kimberly Dickens |
48 | Vice President, Human Resources | ||||
| Helen T. Yantz |
50 | Vice President and Corporate Controller | ||||
| Glenn R. August |
49 | Director | ||||
| Orlando A. Bustos |
47 | Director | ||||
| Larry Jutte |
53 | Director | ||||
| David J. Mastrocola |
49 | Director | ||||
| Stephen A. Van Oss |
56 | Director | ||||
| Kenneth L. Way |
71 | Director | ||||
James S. McElya is the Chairman of our board of directors and our Chief Executive Officer, a position he has held since March 2009 and previously held from September 2006 to July 2008. He served as executive Chairman from July 2008 to March 2009. Mr. McElya served as President and Chief Executive Officer from the date of the 2004 acquisition to September 2006. He has been a member of our board of directors since the 2004 acquisition. He was President, Cooper-Standard Automotive and a corporate Vice President of Cooper Tire & Rubber Company from June 2000 until the 2004 acquisition. Mr. McElya has over 33 years of automotive experience. He was previously President of Siebe Automotive Worldwide, a division of Invensys, PLC and spent 22 years with Handy & Harman in various executive management positions, including President, Handy & Harman Automotive, and Corporate Vice President of the parent company. Mr. McElya is the current Chairman of the board of directors of the Motor & Equipment Manufacturers Association and is a past Chairman and current member of the board of directors of the Original Equipment Supplier Association. He is a member of the board of directors of the National Alliance for Accessible Golf.
Edward A. Hasler is our President. Mr. Hasler served as President and Chief Executive Officer from July 2008 to March 2009 and as Vice Chairman and President, North America from March 2009 until May 2010. He served as President and Chief Operating Officer from September 2006 to July 2008. Mr. Hasler was President, Global Sealing Systems from the date of the 2004 acquisition to September 2006. He was the President of the Global Sealing Systems Division and a corporate Vice President of Cooper Tire & Rubber Company from 2003 until the 2004 acquisition. Mr. Hasler was employed from 2000 to 2001 in Germany as Managing Director, Europe for GDX Corporation. Prior to joining GDX, Mr. Hasler had been with Cooper Tire for nearly 15 years. At Cooper Tire, Mr. Hasler held several senior posts including Vice President, Operations; and Vice President, Controller. He has both an MBA and a BS in Business Administration.
Allen J. Campbell is our Vice President and Chief Financial Officer, a position he has held since the 2004 acquisition. He was Vice President, Asian Operations of the Cooper-Standard Automotive division of Cooper Tire & Rubber Company from 2003 until the 2004 acquisition and served as Vice President, Finance of the division from 1999 to 2003. Prior to joining Cooper Tire, Mr. Campbell was with The Dow Chemical Company for 18 years and held executive finance positions for both U.S. and Canadian operations. Mr. Campbell is a certified public accountant and received his MBA in Finance from Xavier University.
Keith D. Stephenson is our President, International, a position he has held since March 2009. He served as President, Global Body & Chassis Systems from June 2007 to March 2009. Mr. Stephenson was Chief
95
Table of Contents
Development Officer at Boler Company from January 2004 until October 2006. From 1985 to January 2004, he held various senior positions at Hendrickson, a division of Boler Company, including President of International Operations, Senior Vice President of Global Business Operations and President of the Truck Systems Group.
Michael C. Verwilst is our Vice President, Mergers & Acquisitions, a position he has held since March 2009. Previously, Mr. Verwilst served as President, Global Fluid Systems from June 2007 to March 2009. Mr. Verwilst joined the Company in 2003 as the Vice President, Strategic Planning and Business Development. Prior to joining the Company, Mr. Verwilst was a principal with Corporate Improvement Partners from 2001 to 2003. Mr. Verwilst held many executive positions with Federal-Mogul Corporation from 1978 to 2001, including Senior Vice President of Powertrain Systems and Vice President & General Manager of Powertrain Systems—Americas.
Timothy W. Hefferon is our Vice President, General Counsel and Secretary, a position he has held since the 2004 acquisition. Prior to joining the Company, Mr. Hefferon was with ThyssenKrupp USA Inc. from 1999 to 2004, where he served as Deputy General Counsel and with Federal-Mogul Corporation from 1994 to 1999, where he served as Associate General Counsel. He was a partner from 1985 to 1994 of Hill Lewis, a Detroit-based law firm, where he served on the executive committee. Mr. Hefferon received his law degree from the University of Michigan Law School.
Kimberly Dickens is our Vice President, Human Resources, a position she has held since March of 2008. Prior to joining the Company, Ms. Dickens served as Vice President, Human Resources at Federal Signal Corporation from 2004 to 2008. Previously, Ms. Dickens held numerous plant and divisional human resource positions at Borg Warner Corporation beginning in 1988, ultimately serving as Vice President, Human Resources from 2002 to 2004. Ms. Dickens has a BS in Industrial Health and Safety from Oakland University and an MBA from Lewis University.
Helen T. Yantz is our Vice President and Corporate Controller, a position she has held since January 2005. Previously, Ms. Yantz held the position of Director of Accounting and Assistant Vice President from 2001 to 2005. Prior to joining the Company, Ms. Yantz was Manager of Financial Reporting at Trinity Health Systems from 2000 to 2001. Previously, Ms. Yantz held various positions in finance at CMS Generations Co., a subsidiary of CMS Energy, from 1990 to 2000, ultimately serving as the Director of Accounting. Ms. Yantz is a certified public accountant and has a BS from Arizona State University.
Glenn R. August has been a director since May 2010. Mr. August is President and Senior Partner of Oak Hill Advisors, L.P., an investment management firm he co-founded in 1996. Mr. August was a Managing Partner of the predecessor to Oak Hill Advisors, which he co-founded in 1987. Mr. August previously worked in the mergers and acquisitions department at Morgan Stanley in New York and London. He earned an M.B.A. degree from Harvard Business School, where he was a Baker Scholar, and a B.S. degree from Cornell University. Mr. August currently serves on the board of directors of iStar Financial Inc., the Horace Mann School, The Mount Sinai Children’s Center Foundation and the 92nd Street Y.
Orlando A. Bustos has been a director since May 2010. Mr. Bustos is the Founder and has been the Senior Managing Director of OHorizons LLC since its inception in 2006. He also Chairs and is President of The OHorizons Foundation, which he co-founded in 2009. From 2005 through 2006, Mr. Bustos was the President, International at Saturn Electronics and Engineering. From 2002 through 2005, Mr. Bustos was the Executive Director, GM Global Powertrain Purchasing at General Motors. While at GM Global Powertrain he also served as Business Sector Leader for the Electronics and Controls, Hybrid systems, and Driveline Sectors. From 2003 through 2005 Mr. Bustos served as a director of GMI Diesel Engineering Ltd. in Japan. From 2002 through 2005 he served as a director of Isuzu Motors Polska Sp. z.o.o. in Poland. From 2002 through 2005 he also served as a director of DMAX Ltd. Prior to these positions, Mr. Bustos held a multitude of key leadership positions across regions, functions and business units at General Motors. Mr. Bustos holds an MBA Sloan Fellowship from the Massachusetts Institute of Technology and a B.S. in electrical engineering from Georgia Institute of Technology.
96
Table of Contents
Larry Jutte has been a director since May 2010. Mr. Jutte previously served as Senior Vice President at Honda of America Manufacturing from 2001 until 2009 and was a member of the board of directors. Prior to that, Mr. Jutte has held various management and engineering positions at Honda since 1985, including vice president and plant manager. Mr. Jutte also serves on the board of directors for The Ohio State University Center for International Business Education and Research as well for the Koenig Equipment Co. In addition to serving on these boards, Mr. Jutte is Managing Member of Auld Technologies LLC since February 2009, and serves as President and COO of Ernie Green Industries Inc since March 2010.
David J. Mastrocola has been a director since May 2010. Mr. Mastrocola also serves as chairman of the governance committee of our board of directors. Mr. Mastrocola was a partner and managing director of Goldman, Sachs & Co., where he worked from 1987 until his retirement in 2008. During that period, Mr. Mastrocola held a number of senior management positions in the Investment Banking Division, including heading or co-heading the corporate finance, mergers/strategic advisory and industrials/natural resources departments. Mr. Mastrocola also served as a member of Goldman, Sachs & Co.’s firmwide capital and commitments committees. From 1983 to 1985, Mr. Mastrocola was a senior auditor at Arthur Andersen & Co. He earned a B.S. in Accounting from Boston College and an MBA from Harvard University. Mr. Mastrocola currently serves as a trustee for Save the Children Federation, Inc.
Stephen A. Van Oss has been a director since August 2008. Mr. Van Oss also serves as chairman of the audit committee of our board of directors. Mr. Van Oss is Senior Vice President and Chief Operating Officer for WESCO Distribution Inc., a position he has held since September 2009. From July 2004 to September 2009, Mr. Van Oss served as the Senior Vice President and Chief Financial and Administrative officer for WESCO. From 2000 to 2004, Mr. Van Oss served as Vice President and Chief Financial Officer of WESCO. He served as WESCO’s Director, Information Technology from 1997 to 2000 and as its Director, Acquisition Management in 1997. From 1995 to 1996, Mr. Van Oss served as Chief Operating Officer and Chief Financial Officer of Paper Back Recycling of America, Inc. He also held various management positions with Reliance Electric Corporation. Mr. Van Oss is a director of WESCO Distribution, Inc. and is a trustee of Robert Morris University.
Kenneth L. Way has been a director since the 2004 acquisition in December 2004. Mr. Way also serves as chairman of the compensation committee of our board of directors. Mr. Way served as the Chairman of the board of directors from 1988 through 2002 and CEO from 1988 to 2000 of Lear Corporation. Mr. Way had been affiliated with Lear Corporation and its predecessor companies for 37 years in various engineering, manufacturing and general management capacities. Mr. Way is also a director of CMS Energy Corporation.
Board of Directors
On the emergence date, in accordance with our plan of reorganization and our certificate of incorporation, the number of our directors was fixed at seven. In accordance with our plan of reorganization, our initial board, effective as of the emergence date, consists of (i) James S. McElya, our Chairman and Chief Executive Officer, (ii) Glenn R. August, who was nominated by Oak Hill Advisors L.P., on behalf of certain funds and separate accounts that it manages, pursuant to its nomination agreement, (iii) Orlando A. Bustos, who was nominated by Silver Point Capital L.P., on behalf of its affiliates and related funds, pursuant to its nomination agreement, (iv) Larry Jutte, an independent director who was nominated by Capital Research and Management Company, as investment advisor to certain funds it manages, TCW Shared Opportunity Fund IV, L.P., TCW Shared Opportunity Fund IVB, L.P., TCW Shared Opportunity Fund V, L.P., TD High Yield Income Fund and Lord, and Abbett & Co. LLC, as investment manager on behalf of multiple clients, pursuant to their nomination agreement in consultation with Mr. McElya, Korn/Ferry International and the creditors’ committee appointed in our bankruptcy proceedings, (v) David J. Mastrocola, who was nominated by Barclays Capital Inc. pursuant to its nomination agreement in consultation with Mr. McElya, Korn/Ferry International and the creditors’ committee, (vi) Stephen A. Van Oss, an independent director who was selected by us from our preemergence board of directors and (vii) Kenneth L. Way, an independent director who was selected by us from our pre-emergence board of directors. See “Certain Relationships and Related Party Transactions—Nomination Agreements” for a further description of the nomination agreements.
97
Table of Contents
Committees of the Board of Directors
Our board of directors currently has an audit committee, a compensation committee and a governance committee.
Audit Committee
Our audit committee currently consists of Messrs. Mastrocola, Van Oss and Way. Mr. Van Oss serves as chairman of the committee. The audit committee currently is responsible for: (i) reviewing and discussing with management and our independent auditors our annual audited financial statements and quarterly financial statements and any audit issues and management’s response; (ii) reviewing and discussing with management and our independent auditors our financial reporting and accounting standards and principles and significant changes in such standards and principles or their application; (iii) reviewing and discussing with management and our independent auditors our internal system of financial controls and disclosure controls and our risk assessment and management policies and activities; (iv) reviewing and evaluating the independence, qualifications, and performance of our independent auditors; (v) reviewing our legal compliance and ethics programs and investigating matters relating to management’s integrity, including adherence to standards of business conduct established in our policies; and (vi) taking such actions as may be required or permitted under applicable law to be taken by an audit committee on behalf of us and our board of directors.
Compensation Committee
Our compensation committee currently consists of Messrs. August, Bustos and Way. Mr. Way serves as chairman of the committee. The compensation committee currently is responsible for: (i) the review and approval of corporate goals, objectives and other criteria relevant to the compensation of the Chief Executive Officer and other executive officers; (ii) the evaluation of the performance of the Chief Executive Officer and other executive officers and the determination and approval of their compensation; (iii) the review and approval of executive compensation programs; (iv) the review of director compensation and director and officer indemnification and insurance matters; (v) the review and approval of contracts and transactions with executive officers; (vi) the review and approval of equity-based compensation plans and awards made pursuant to such plans; (vii) the approval, review and oversight of our employee benefit plans, including the delegation of responsibility for such programs to the executive officers of the Company; and (viii) taking such actions as may be required or permitted under applicable law to be taken by a compensation committee on behalf of us and our board of directors.
Pursuant to certain of the nomination agreements, if a director of the board of directors who was nominated by Silver Point Capital, L.P. or Barclays Capital Inc. or any of their affiliates is designated as a member of the initial compensation (or equivalent) committee, we are required to take all necessary steps to cause the member of the board of directors nominated by Oak Hill Advisors L.P. to be designated as a member of such committee. If a director of the board of directors who was nominated by Oak Hill Advisors L.P. or any of its affiliates is designated as a member of the initial compensation (or equivalent) committee, we have to take all necessary steps to cause either (i) the member of the board of directors nominated by Barclays Capital Inc. or any of its affiliates or (ii) a nominee designated by Silver Point Capital, L.P. or any of its affiliates, to be designated as a member of such committee. Any material decisions or actions of the board of directors’ compensation (or equivalent) committee shall require the approval of the entire board of directors. Mr. Bustos was nominated to our board of directors by Silver Point Capital, L.P. Mr. August was nominated to our board of directors by Oak Hill Advisors L.P.
Governance Committee
Our governance committee currently consists of Messrs. Jutte, Mastrocola and Van Oss. Mr. Mastrocola serves as chairman of the committee. The governance committee currently is responsible for nominating candidates for our board of directors and assisting our board of directors in discharging its responsibilities relating to its organization, membership and performance and other issues relating to our corporate governance.
98
Table of Contents
Compensation Committee Interlocks and Insider Participation
Our compensation committee currently consists of Glenn R. August, Orlando A. Bustos and Kenneth L. Way. Mr. August is President and Senior Partner for Oak Hill Advisors, L.P. Funds and accounts managed by Oak Hill Advisors, L.P. are among the Backstop Parties. Mr. Bustos was nominated by Silver Point Capital L.P., on behalf of its affiliates and related funds. Funds and accounts managed by Silver Point Capital L.P. are among the Backstop Parties. See “Certain Relationships and Related Party Transactions” for a description of the equity commitment agreement, the equity registration rights agreement and the nomination agreements that we entered into with the Backstop Parties. Otherwise, no interlocking relationship exists between our board of directors or compensation committee and the board of directors or compensation committee of any other company.
Director Independence
Because our securities are not listed on any national securities exchange, we are not required to have a majority of, or any, independent directors. However, we determine our independent directors pursuant to the standards of the New York Stock Exchange. Currently, we have three directors that we have determined to be independent under such standards: Messrs. Jutte (governance committee member), Van Oss (audit committee and governance committee member) and Way (audit committee and compensation committee member). Mr. Mastrocola is a member of the audit committee and the governance committee and is not independent under the standards for independence of each such committee. Messrs. August and Bustos are members of the compensation committee and are not independent under the standards for independence of such committee.
Removal of Directors
Our certificate of incorporation provides that any or all of the members of our board of directors may be removed from office at any time, with or without cause, by the affirmative vote of holders of a majority of the voting power of all then outstanding shares of our capital stock entitled to vote generally in the election of directors, voting together as a single class.
Limitation of Personal Liability
Our certificate of incorporation provides that no current or former member of our board of directors will be personally liable to us or any of our stockholders for monetary damages for breach of fiduciary duty as a director, except to the extent such exemption from liability or limitation thereof is not permitted by the DGCL. If the DGCL is amended to authorize further limitation or elimination of the liability of directors, then the liability of a director to us or our stockholders will be limited or eliminated to the fullest extent permitted by the DGCL, as so amended.
Indemnification of Directors and Officers
Our certificate of incorporation contains mandatory indemnification provisions for our current and former directors and officers as described generally below.
We will be obligated to indemnify and hold harmless, to the fullest extent permitted by applicable law, as the same exists or may hereafter be amended, each person who was or is made a party or is threatened to be made a party to or is otherwise involved in any threatened, pending or completed action, suit or proceeding, whether civil, criminal, administrative or investigative, hereinafter referred to as a proceeding, by reason of the fact that he or she is or was a director or officer of the Company or, while a director or officer of the Company, is or was serving at our request as a director, officer, employee or agent of another corporation or of a partnership, joint venture, trust or other enterprise, including service with respect to an employee benefit plan, hereinafter referred to as a Covered Person, whether the basis of such proceeding is alleged action in an official capacity as a director, officer, employee or agent, or in any other capacity while serving as a director, officer, employee or agent, against all expense, liability and loss (including, without limitation, attorneys’ fees, judgments, fines, ERISA excise taxes and penalties and amounts paid in settlement) reasonably incurred or suffered by such Covered Person in connection with such proceeding, and such right to indemnification will continue as to a
99
Table of Contents
person who has ceased to be a director, officer, employee or agent and will inure to the benefit of his or her heirs, executors and administrators; provided, however, that, except for proceedings to enforce rights to indemnification, we will indemnify a Covered Person in connection with a proceeding (or part thereof) initiated by the Covered Person only if the proceeding (or part thereof) is authorized by the board. The Covered Person will have the right to be paid by us the expenses incurred in defending or otherwise participating in any such proceeding in advance of its final disposition.
In addition, we will be required pursuant to our bylaws to be the indemnitor of first resort (i.e., our obligations to any Covered Person will be primary and any obligation of third party indemnitors to advance expenses or to provide indemnification for the same expenses or liabilities incurred by any Covered Person are secondary).
Insofar as indemnification for liabilities arising under the Securities Act may be permitted to directors, officers and controlling persons of the registrant pursuant to the foregoing provisions, or otherwise, the registrant has been advised that in the opinion of the SEC such indemnification is against public policy as expressed in the Securities Act and is, therefore, unenforceable.
Other Matters Concerning Directors and Executive Officers
SEC regulations require us to describe certain legal proceedings, including bankruptcy and insolvency filings involving our directors or executive officers or companies of which a director or executive officer was an executive officer at the time of filing. Each of the executive officers listed above served as an executive officer of the Company at the time we filed for protection under chapter 11 of the Bankruptcy Code in August of 2009. Further, Messrs. Van Oss and Way served as directors of the Company at the time we filed for protection under chapter 11 of the Bankruptcy Code in August of 2009.
Code of Business Conduct and Ethics
We have adopted a Code of Business Conduct and Ethics Policy that applies to all directors, officers and employees of the Company and our subsidiaries, including our chief executive officer, our chief financial officer and our controller. The Code of Business Conduct and Ethics Policy is available on our website at www.cooperstandard.com. We will also post on our website any amendment to, or waiver from, a provision of our policies that applies to our chief executive officer, chief financial officer or controller, and that relates to any of the following elements of these policies: honest and ethical conduct; disclosure in reports or documents filed by us with the SEC and in other public communications; compliance with applicable laws, rules and regulations; prompt internal reporting of code violations; and accountability for adherence to the policies.
Compensation Discussion and Analysis
Executive summary
This Compensation Discussion and Analysis describes the key principles and material elements of our compensation policies for the “Named Executive Officers” of the Company identified below in “—Executive compensation”. Much of what is discussed below, however, applies generally to our executives and is not limited to the Named Executive Officers.
The compensation committee, with the assistance of independent executive compensation consultants, regularly reviews the various elements of our executive compensation program. In reviewing elements of compensation, we have normally placed considerable emphasis on performance-based compensation to ensure executives are compensated for annual and long-term results. Performance-based components of compensation have historically included annual bonuses tied to annual adjusted EBITDA results, long-term incentive plan awards pertaining to three year performance periods, a stock incentive plan and a management stock purchase plan.
In the latter part of 2008 and continuing into 2009, we implemented a number of cost-reduction measures in response to the conditions in the automotive industry and general economy that negatively impacted our financial results and ultimately led to the filing of the chapter 11 cases. These cost-reduction measures included temporary
100
Table of Contents
reductions in base pay, mandatory vacation without pay, bonus opportunities and benefits applicable to our salaried employees, including the Named Executive Officers, which are described under “—Processes relating to executive compensation—Executive compensation review and determinations for 2009”.
As conditions in the automotive industry and our financial performance improved in the latter months of 2009, the compensation committee discontinued certain of the temporary cost-reduction measures that affected executive compensation. The compensation committee did not authorize new stock options or other awards under our stock incentive plan. Under our plan of reorganization, our common stock was cancelled upon emergence from bankruptcy. Compensatory actions related to emergence from bankruptcy are discussed under “—Compensation matters following emergence from bankruptcy.”
Compensation philosophy and objectives
The objective of our compensation program has been to link executive compensation to our performance in a manner that accomplishes the following:
| • | enables us to attract and retain a highly qualified executive leadership team; |
| • | aligns the interests of executives with those of stockholders; and |
| • | motivates our leadership team to implement our long-term growth strategy while delivering consistently strong financial results. |
The program was designed to reward sustained enterprise value growth through incentives based on the achievement of performance objectives over varying time periods. As detailed below, our incentive programs emphasize specific Company or group-wide objectives over subjective, individual goals. Discretionary features of these programs allow for the recognition of achievements which the objective performance criteria do not fully measure but which further our key strategies. Base salary has been designed, in general, to be near the median of the range applicable to companies deemed comparable to us and performance-based compensation has been designed to provide opportunities above median levels in the industries in we compete for executives.
Processes relating to executive compensation
It is the responsibility of the compensation committee to assist in discharging our board of directors’ responsibilities relating to the compensation of our directors and executive officers and the oversight of compensation plans, policies and benefit programs. Our human resources executives and professionals support the compensation committee in its work. In evaluating and determining the salary and incentive compensation of our senior leadership team, the compensation committee receives information from our Global Vice President, Human Resources and recommendations from the CEO. The compensation committee as a whole, following discussions with the CEO, meets privately and determines the salary and incentive compensation of the CEO. Executives whose compensation is under consideration are not present during the compensation committee’s review meetings. The considerations, criteria and procedures applicable to these determinations are discussed under “—Executive Compensation Components.”
Executive compensation review and determinations for 2009. In evaluating and determining the compensation of our executives for 2009, the compensation committee departed from its normal practices due to the severe conditions in the automotive industry and general economy that ultimately led to the filing of the chapter 11 cases in August 2009. In the fourth quarter of 2008 and the first quarter of 2009, we, with the approval of the compensation committee, implemented special cost-reduction measures affecting executive compensation, including the compensation of the Named Executive Officers. These included a temporary 10% reduction in base salary that remained in effect from January 2009 through September 2009; the suspension of our annual bonus plan program applicable to our executive officers for the first half of 2009; mandatory one week unpaid vacation; the suspension of fixed matching contributions under the qualified defined contribution plan applicable to the Named Executive Officers that remained in effect from January 2009 through December 2009 and the freezing of benefit accruals under the qualified defined benefit retirement plans applicable to the Named Executive Officers.
101
Table of Contents
These actions did not reflect a permanent change in our compensation philosophy or practices, but were taken as temporary measures in response to extraordinary conditions. Early in 2009, the compensation committee had retained Hewitt Associates to assist in conducting a comprehensive review of our executive compensation program including an assessment of the competitiveness of the program as compared to the external marketplace and the recommendation of appropriate changes in the program. During the course of the year, the compensation committee determined that, in light of the extraordinary circumstances and the temporary cost-reduction measures implemented during the year, the program review as initially contemplated should be deferred. The base salaries and cash incentive award target levels applicable to our senior executives that had been established for 2008 were kept in place for 2009 subject to the temporary cost-reduction measures described above and more fully described under “—Executive Compensation Components.” The executive compensation review that resulted in the determination of executive compensation for 2008, and which had the above-mentioned carry-over effect into 2009, is described below under “—2008 Executive Compensation Review”.
2008 executive compensation review. In evaluating the compensation of our executives for 2008, the compensation committee engaged Towers Perrin to assess the market competitiveness of our executive compensation program at the time with particular focus on total direct compensation, comprised of base salary, annual incentive award opportunities, long-term incentive award opportunities, executive perquisites other than core health and welfare benefits, and executive severance and change-in-control benefits. Towers Perrin compared our programs in these areas with those of two comparator groups: a group of eleven automotive suppliers selected on the basis of annual sales (ranging from $907 million to $12.4 billion, with a median of $5.0 billion) and a group of 50 companies from various industrial segments also selected on the basis of annual sales (ranging from $290 million to $10.7 billion, with a median of $2.7 billion), as follows:
Automotive supplier revenue-based comparator group
| • American Axle & Mfg |
• Eaton Corp |
• Navistar International | ||
| • ArvinMeritor |
• Fleetwood Enterprises |
• PPG Industries Inc | ||
| • CLARCOR Inc. |
• Hayes-Lemmerz |
• Timken Co | ||
| • Cooper Tire & Rubber |
• Ingersoll-Rand Co Ltd |
|||
Broad industrial comparator group
| • Air Products and Chemicals Inc |
• GATX Corp |
• OMNOVA Solutions Inc | ||
| • American Axle & Mfg. |
• Harley-Davidson Inc. |
• Owens-Illinois Inc. | ||
| • Arctic Cat Inc. |
• Harman International Industries |
• Parker-Hannifin Corp | ||
| • ArvinMeritor Inc |
• Harsco Corp |
• Plum Creek Timber Co Inc | ||
| • Ball Corp |
• Hayes Lemmerz |
• Rockwell Automation Inc. | ||
| • Black & Decker Corp |
• HNI Corp |
• Smurfit-Stone Container | ||
| • Brady Corp |
• IDEX Corporation |
• Sonoco Products Co | ||
| • Cameron International Corp |
• ITT Corp |
• Steelcase Inc. | ||
| • Chesapeake Corp |
• Kaman Corp |
• Sybron | ||
| • CLARCOR Inc |
• Lafarge North America |
• Terex Corp | ||
| • Constar International Inc |
• Louisiana-Pacific Corp |
• Thomas & Betts Corp | ||
| • Cooper Tire & Rubber Co |
• MeadWestvaco Corp |
• Timken Co (The) | ||
| • Donaldson Co Inc. |
• Milacron Inc. |
• Toro Co (The) | ||
| • Dresser-Rand Group Inc |
• Mine Safety Appliances Co |
• Trinity Industries Inc | ||
| • Fleetwood Enterprises Inc. |
• Monaco Coach Corp |
• USG Corp | ||
| • Flowserve Corp |
• MSC Industrial Direct Co |
• Valmont Industries Inc | ||
| • Fortune Brands Inc. |
• Navistar International Corp |
|||
102
Table of Contents
The compensation committee reviewed the report of Towers Perrin with the CEO and other members of executive management. The compensation committee considered the Towers Perrin report in determining the total compensation of senior management for 2008, but did not target any percentile level among the comparator groups used in the report in determining the appropriate level of each element of compensation for the executive leadership team. The compensation committee also took into account distinctions between our equity-based incentive compensation programs and those offered by many of the companies in the comparator groups arising out of the fact that our common stock was not publicly traded as was the case with many of the comparator group companies. Taking into account the above, the survey data generally reaffirmed that compensation of the executive leadership team as then approved by the compensation committee was in accordance with the our overall compensation strategy at the time.
Executive compensation components
The elements of compensation available to our executives are:
Base salary. Our senior executives are paid a base salary that is determined prior to or at the beginning of each fiscal year or upon changes in roles or positions within the Company. The compensation committee determines the salary of the CEO and, upon the recommendation of the CEO, the salaries of other members of the executive leadership team. The salaries of other executives are determined by the executives to whom they report, upon consultation with the CEO. Our policy is to pay base salaries that are competitive in the markets in which it competes for executives and that take into account the responsibilities and contributions of each executive. The base salary provides executives with a regular stream of income.
As described above under “—Executive compensation review and determinations for 2009”, due to the severe industry and economic conditions at the time, the compensation committee did not make use of new surveys or other competitive benchmarking practices in determining the base salaries of our senior executives for 2009. At the recommendation of senior management, and consistent with actions taken with respect to other of our salaried employees, the compensation committee implemented a temporary 10% reduction in the base salaries of senior executives, including the Named Executive Officers, from the base salary levels in effect for 2008. These temporary reductions were in effect from January 1 through September 30, 2009, at which time the 2008 base salary levels were reinstated due to improved industry conditions and financial results. Mr. Stephenson’s salary was increased as of December 28, 2009 after further review by the compensation committee at that time, in connection with a market review of his position.
Annual bonus. Prior to or early in each fiscal year, the compensation committee normally determines target annual bonus amounts payable to our senior executives, including the Named Executive Officers, upon the achievement of performance targets established by the compensation committee for the year. The targets are generally set in terms of the adjusted EBITDA of us as a whole or, in some cases, of a particular operating division. Adjusted EBITDA is calculated, in general, as consolidated net income plus the sum of i) consolidated interest expense; ii) consolidated income tax expense; iii) any non-cash charges, losses or expenses; iv) most non-recurring fees, cash charges and other cash expenses; v) non-specified restructuring charges limited to 7.5% of adjusted EBITDA; vi) non-recurring fees, expenses or charges related to professional or financial advisory, financing, underwriting and other similar services related to equity offerings, investments, acquisitions, divestitures or recapitalizations; vii) extraordinary charges or losses; viii) losses related to discontinued operations; ix) losses in respect of business or asset dispositions outside the ordinary course; and x) non-recurring restructuring charges related to the integration of businesses acquired in certain acquisition transactions, subject to certain restrictions. Additional adjustments are sometimes made for extraordinary events upon approval of the compensation committee. Adjusted EBITDA is deemed by us to be an appropriate objective measurement of the financial performance of the Company or a division for that year.
In addition to establishing an adjusted EBITDA performance target, the achievement of which entitles senior executives to bonus payments at the target levels, the compensation committee establishes a “threshold” performance target, the achievement of which entitles executives to an annual bonus equal to 50% of the target
103
Table of Contents
bonus amounts. No bonuses are payable if we fails to meet the threshold performance target. In addition, the compensation committee sets a “superior performance” target, the achievement of which entitles executives to an annual bonus equal to 200% of the target bonus amounts. The superior performance adjusted EBITDA level represents a goal deemed unlikely of achievement at the beginning of the year based on the assumptions underlying the business plan, except upon performance substantially exceeding expectations. Annual bonus payments are determined on a linear basis for adjusted EBITDA attainment above the “threshold” level but not precisely at the “target” or “superior performance” level. In the first quarter following the end of the fiscal year to which the bonus applies, the compensation committee determines whether, and to what extent, the applicable performance targets were achieved based on our financial results for the fiscal year. The compensation committee may take into account special circumstances and adjust applicable performance targets and bonuses. The annual incentive bonus is designed to focus the executive leadership team on the achievement of strong financial performance over a one-year period.
As described above under “—Processes relating to executive compensation—Executive compensation review and determinations for 2009”, due to the severe industry and economic conditions at the time, the compensation committee, at the recommendation of senior management, suspended the annual bonus program applicable to senior executives for the first half of 2009. For the second half of 2009, the compensation committee approved executive bonus opportunities with target amounts set at 50% of the amounts originally established for 2009 prior to the suspension of the program. The compensation committee established the half-year bonus target amount for each member of the executive leadership team based on a percentage of base salary. With respect to the Named Executive Officers, the percentage was 50% for Messrs. McElya and Hasler, and 32.5% for Messrs. Campbell, Stephenson and Verwilst. The compensation committee set adjusted EBITDA performance targets (applicable to the executives as a whole) for the second half of 2009 in accordance with our 2009 business plan applicable to that period, as follows: second-half adjusted EBITDA of $95,220,000 (“threshold performance”) for a pay-out of 50% of the executives’ half-year target bonuses; second-half adjusted EBITDA of $105,800,000 (“target performance”) for a pay-out of 100% of the executives’ half-year target bonuses; and second-half adjusted EBITDA exceeding $122,000,000 (“superior performance”) for a maximum pay-out of 200% of the respective executives’ half-year target bonus.
For the second half of 2009, superior performance was achieved such that each executive received a maximum pay-out of 200% of his half-year target bonus.
Long term incentive compensation. We have a Long Term Incentive Plan, or LTIP, which provides for the granting by the compensation committee of performance-based awards to executive officers covering performance periods of one year or longer. Awards are normally granted in the first quarter of each year; however, interim grants may be made in the case of new hires or promotions. At the time awards are granted, the compensation committee establishes performance targets and a payment scale which determines payout amounts at different levels of performance. After the end of the performance period, the compensation committee determines whether, and to what extent, performance targets have been achieved and the amount of any awards that have been earned. Award amounts are subject to discretionary adjustment by the compensation committee (they may be adjusted downward up to 80% or upward up to 150%). If a participant engages in “inimical conduct,” meaning an action or omission contrary to our best interest, before payment of an award is made, the payment is subject to forfeit. LTIP awards are designed to focus the executive leadership team on strong, sustained cash generation and have therefore been based on the achievement of operating cash flow objectives for us as a whole, generally over three-year performance periods.
At the time LTIP awards are granted, the compensation committee establishes a target award amount for each executive which represents the amount the executive will receive at the conclusion of the applicable performance period if performance targets are exactly met during the period. Target award amounts are based on the level of responsibility of the executive and other performance-based factors.
LTIP awards have historically been based on the achievement of operating cash generation goals. Based on our business plan, the compensation committee establishes specific operating cash flow targets for us as a whole on an annual basis. The “target” performance level represents what the compensation committee deems to be good
104
Table of Contents
operating cash flow performance for the year which is reasonably capable of achievement at a high level of performance on the part of the executive leadership team and our employees, based on the assumptions and business conditions on which our business plan is based. LTIP awards for the three-year performance period ending December 31, 2009 were based on the achievement of operating cash flow targets for the years ending December 2007, 2008 and 2009. The target operating cash flow for 2007 was established at $108,200,000, for 2008 at $179,000,000, and for 2009 at $122,500,000.
At the end of each LTIP performance period, the compensation committee determines the extent to which our mean average operating cash flow performance during the performance period met the mean average of the annual operating cash flow targets established by the compensation committee during the period. Subject to the right of the compensation committee to make adjustments under the plan, LTIP award payouts are determined in accordance with the following:
| Achievement Level (Average) |
Payout % of Target Opportunity |
|||
| Less than 90% of mean target |
0 | % | ||
| At 90% of mean target |
50 | % | ||
| Each 1% over 90% |
+5 | % | ||
| At target |
100 | % | ||
| Each 1% above target |
+10 | % | ||
For the three-year performance period ending December 31, 2009, performance was 9.34% above target.
Stock incentive plan. Although the compensation committee of our board of directors was authorized to grant options at any time under the 2004 Cooper-Standard Holdings Inc. Stock Incentive Plan, options have historically not been granted on an annual or other regular or prescribed basis. The tranche of time-based options that vested as of December 23, 2009 was the last tranche of options outstanding under the Stock Incentive Plan subject to time or performance-based vesting. Due to the severe industry and economic conditions that prevailed during the first half of 2009 and the ultimate filing of the chapter 11 cases, the compensation committee determined that it was not appropriate to grant new options during 2009. The options outstanding under the 2004 Cooper-Standard Holdings Inc. Stock Incentive Plan were cancelled upon emergence from bankruptcy.
Management stock purchase plan. We maintain a nonqualified Deferred Compensation Plan which allows eligible executives and directors to defer base pay, bonus payments and long-term incentive pay and have it allocated on a pre-tax basis to various investment alternatives and ultimately distributed to the executive at a designated time in the future. The plan includes a feature referred to as the “Management Stock Purchase Plan” which provides participants the opportunity to “purchase” Company stock units with income deferred under the Deferred Compensation Plan at a price based on the fair value of our common stock as determined by the compensation committee. Purchased stock units are matched by us at year-end on a one-for-one basis, subject to an annual aggregate cap for all executives of $1,500,000 worth of matching units or 15,000 matching units, whichever is less. The compensation committee can increase the cap in any year. If the matching units are over-subscribed in a given year, participants receive a pro rata number of matching units based on the amount of stock units the participant purchased that year through deferrals. Matching units vest ratably over a three-year period, and may vest earlier upon a participant’s death, disability, retirement or termination by us without cause or by the participant for good reason. Matching units also become 100% vested upon the occurrence of a change in control for participants who are employed with us immediately prior to such change in control. Stock units are distributed to participants in the form of actual shares of our common stock, subject to restrictions on transfer, at a time in the future designated by the participant (though at our sole discretion, we may pay purchased units out in cash). A variety of other deemed fixed income and equity investment options are also available under the plan (which mirror the investment options available under the our qualified 401(k) plans), though deferrals allocated to such options are not matched.
The timing and form of future payments are specified in the elections submitted by participants with respect to deferrals made for any plan year. Executives may elect to receive payment beginning either at separation from
105
Table of Contents
service or at an otherwise specified date (generally at least three years after the year in which the deferrals are made). The form of payment for a given year’s deferral account can be any of the following: (i) single lump sum; (ii) annual installments for five years; (iii) annual installments for ten years; or (iv) a specified percentage of the account paid as a lump sum, and the remainder paid in either five annual installments or ten annual installments.
The Management Stock Purchase Plan is available to a broader group of executives than those who currently hold options under the Stock Incentive Plan. Due to the filing of the chapter 11 cases, the stock units outstanding under the Management Stock Purchase Plan were cancelled, and we do not currently consider the plan as an important component of its incentive-based compensation program.
Retirement plan benefits. The Named Executive Officers participate in our qualified defined benefit retirement plan, our qualified defined contribution investment savings plan and our nonqualified supplementary benefit plan. Benefits under these plans provide executives with an income source during their retirement years, and reward executives for long service to us. We believe that our retirement plans are generally competitive in the industries in which we compete for executives and assist us in attracting and retaining a high caliber executive leadership team.
This section summarizes the terms of the retirement benefits in effect as of December 31, 2009. In response to the continued economic downturn affecting our industry, we decided in December 2008 to implement a number of cost-reduction measures that became effective in 2009. These measures included a freeze in future accruals under our qualified defined benefit retirement plan effective February 1, 2009 and a suspension of fixed matching contributions under our qualified defined contribution investment savings plan. Our nonqualified supplementary benefit plan continues to accrue benefits but does not “make up” for benefit accruals that are lost due to the changes in the qualified plans described above. After undertaking the emergency measures described above, we also conducted an overall qualified retirement program design review during the 2009 calendar year and implemented a new qualified retirement program which became effective January 1, 2010, a brief summary of which is provided later in this section under the heading “—Defined contribution retirement plans”.
Defined benefit retirement plans. The Cooper-Standard Automotive Inc. Salaried Retirement Plan, or CSA Retirement Plan, is a defined benefit plan that covers all our non-union employees in the United States, including the Named Executive Officers. As indicated above, a freeze in future accruals under the CSA Retirement Plan became effective on February 1, 2009. However, because the terms of the CSA Retirement Plan are still relevant in the determination of ongoing pension accruals under the Supplementary Benefit Plan (as further described below), a summary of such terms has been retained in this prospectus.
The CSA Retirement Plan is funded by our contributions only. There are two types of benefits under the plan, a cash balance benefit and a final average pay benefit. There are two separate “grandfathered” final average pay formulas in the plan, but only one of those formulas applies for purposes of the Named Executive Officers whose benefits are governed by final average pay provisions, so that formula is described herein. The final average pay benefit was closed effective January 1, 2002 with respect to any participant who was not at least 40 years of age and had at least 15 years of earned service as of that date.
The cash balance portion of the CSA Retirement Plan states benefits in the form of a hypothetical account established for each participant. Prior to the February 1, 2009 CSA Retirement Plan freeze, cash balance accounts increased by two components: a pay credit equal to a stated percentage of his or her compensation (as defined more specifically below under “Determination of benefits under plans”) each year, and an earnings credit equal to the interest rate paid on 30-year Treasury bonds times the hypothetical account balance. Effective with the February 1, 2009 freeze, future pay credits are no longer provided under the CSA Retirement Plan, but future interest credits are still provided.
The final average pay benefit portion of the CSA Retirement Plan provides benefits stated as an annuity equal to 1.5% times average compensation (the highest five of the last ten years, as further described below in “Determination of benefits under plans”) times years of service. Effective with the February 1, 2009 freeze, additional accruals related to service earned and pay received after the freeze are no longer provided under the
106
Table of Contents
CSA Retirement Plan. This final average pay benefit is payable on an unreduced basis at age 62 or upon attainment of age 55 with 30 years of service.
We maintain the Cooper-Standard Automotive Inc. Nonqualified Supplementary Benefit Plan, or the Supplementary Benefit Plan, for the benefit of certain employees (those who are members of a select group of highly-compensated executive employees, including the Named Executive Officers). The Supplementary Benefit Plan provides for an additional pension benefit that is designed to compensate for any reduced benefits under the CSA Retirement Plan due to limits imposed by the Internal Revenue Code of 1986, as amended, or the Internal Revenue Code. The Supplementary Benefit Plan is also designed to provide Mr. McElya a final average pay benefit as if he were eligible for the benefits described under “Final average pay design” below. For cash balance participants, the Supplementary Benefit Plan also provides for an enhanced pay credit as further described under the heading “Determination of benefits under plans” below. The Supplementary Benefit Plan continues to accrue benefits but does not “make up” for benefit accruals that are lost due to the February 1, 2009 freeze of the CSA Retirement Plan.
Defined contribution retirement plans. The Cooper-Standard Automotive Inc. Investment Savings Plan, or the CSA Savings Plan, is a tax-qualified 401(k) retirement savings plan pursuant to which all U.S. non-union employees, including the Named Executive Officers, may contribute the lesser of up to 50% of “Compensation” (which includes the same compensation as that described below under “—Cash balance design,” except that retention bonuses are excluded) or the limit prescribed by the Internal Revenue Code (though we impose lower deferral percentage limits on highly-compensated employees). We provide a fixed match of 40% of employee contributions up to 5% of Compensation, with a maximum matching contribution of 2% of Compensation. We may make additional discretionary contributions depending upon our performance. Our contributions are 100% vested after the employee has 3 years of service. Employee contributions are always 100% vested.
As described earlier in this section, in response to the continued economic downturn, we decided to suspend the fixed Company matching contributions from January 1, 2009 through December 31, 2009. A discretionary matching contribution providing a match of 10% of employee contributions up to 5% of Compensation for 2009 (with a maximum discretionary matching contribution of 0.5% of Compensation) was provided after the end of the year. Further, we redesigned our overall qualified retirement program effective January 1, 2010 to create a safe harbor defined-contribution-only offering which improves cost predictability and reduces cost volatility while providing a market competitive program to its employees. The new program provides the same 40% fixed matching on employee contributions of up to 5% of Compensation that was in effect prior to the January 1, 2009 fixed match suspension, and the plan also continues to provide for potential discretionary contributions depending on our performance. An additional non-elective employer contribution of 3% to 5% of Compensation (depending on age plus service with the Company) was also added to the plan to provide a solid foundation for retirement savings and which helps serve to replace future qualified defined benefit plan accruals which are no longer offered under the CSA Retirement Plan.
The Supplementary Benefit Plan also provides for an additional nonqualified employer contribution which (1) makes up for any Company contributions to the CSA Savings Plan that were not permitted to be made due to limitations under the Internal Revenue Code and (2) provides a nonqualified employer contribution which, when combined with the qualified savings plan employer contribution generally, and with respect to 2009, the hypothetical contributions that would have been made had the fixed Company matching contributions not been suspended, provides for a total employer contribution of 6% of Compensation (without regard to qualified plan limits prescribed by the Internal Revenue Code). The Supplementary Benefit Plan continues to accrue benefits but does not “make up” for fixed matching contribution that were lost due to the fixed match suspension that was in effect under the CSA Savings Plan from January 1, 2009 through December 31, 2009.
Determination of benefits under plans. Benefits under the CSA Retirement Plan and the nonqualified defined benefit portion of the Supplementary Benefit Plan are governed by either a cash balance design or a final average pay design. Although a freeze in future accruals under the CSA Retirement Plan became effective on February 1, 2009, the terms of the CSA Retirement Plan are still relevant in the determination of ongoing pension accruals under the Supplementary Benefit Plan, as further elaborated upon below.
107
Table of Contents
Cash balance design. Annual pay credits are added to a participant’s cash balance account at the end of each year, based on the participant’s compensation for the year and the sum of the participant’s age and service as of the beginning of that year. Compensation used as the basis for pay credits, or Compensation, includes all compensation reported as wages for federal income tax purposes excluding employer contributions to a plan of deferred compensation, income attributable to stock options (including income attributable to any disqualifying dispositions thereof), director fees, sales awards, relocation bonuses, signing bonuses, lump-sum severance payments, suggestion system awards, tuition reimbursement, payment upon the exercise of stock appreciation rights or in lieu of the exercise of stock options, imputed income (such as, but not limited to, group term life insurance that is reported as taxable income), benefits accruing or payable under nonqualified retirement plans, expatriate income, and other amounts that are either excludable or deductible from income in whole or in part for federal income tax purposes, or that represent payments pursuant to a program of benefits or deferred compensation, whether or not qualified under the Internal Revenue Code. Annual pay credits are provided as follows:
| Sum of Age and Years of Service |
CSA Retirement Plan Applicable Percentage(1) |
Supplementary Benefit Plan Applicable Percentage(2) |
||||||
| Up to 35 |
3.0 | % | 6.0 | % | ||||
| 36—50 |
4.0 | % | 8.0 | % | ||||
| 51—65 |
5.5 | % | 11.0 | % | ||||
| 66—80 |
7.5 | % | 15.0 | % | ||||
| over 80 |
10.0 | % | 20.0 | % | ||||
| (1) | Although future pay credits are not provided under the CSA Retirement Plan after the February 1, 2009 freeze date, prior to February 1, 2009, the CSA Retirement Plan provided a pay credit equal to the executive’s Compensation, subject to qualified plan limitations under the Internal Revenue Code, multiplied by the percentage listed under the “CSA Retirement Plan Applicable Percentage” heading above. |
| (2) | Prior to the February 1, 2009 freeze of the CSA Retirement Plan, the Supplementary Benefit Plan provided a pay credit equal to the difference between (1) the executive’s Compensation, without regard to qualified plan limitations, multiplied by the percentage listed under the “Supplementary Benefit Plan Applicable Percentage” heading above, and (2) the pay credit which provided under the CSA Retirement Plan determined in the manner described in footnote 1 above. |
After the February 1, 2009 freeze of the CSA Retirement Plan, the Supplementary Benefit Plan provides a pay credit equal to the difference between (1) the executive’s Compensation, without regard to qualified plan limitations, multiplied by the percentage listed under the “Supplementary Benefit Plan Applicable Percentage” heading above, and (2) the hypothetical pay credit which would have been provided under the CSA Retirement Plan had that plan not been frozen, determined in the manner described in footnote 1 above.
Annual interest credits are also added to a participant’s cash balance account each year. This credit is calculated by multiplying the cash balance account as of the end of the prior year by an interest rate that is equal to the annual yield statistic for 30-year U.S. Treasury securities for the month of October of the prior year.
Benefits fully vest upon 3 years of service, with no benefits vested for less than 3 years of service. Service is measured based on an elapsed time basis from date of hire.
Normal retirement age is age 65 with 5 years of service. The normal retirement benefit is defined as a monthly life annuity amount that is actuarially equivalent to the cash balance account projected to normal retirement age with interest credits. For participants whose prior final average pay accrued benefits were frozen and converted to an opening account balance at January 1, 2002 when the cash balance design was implemented, an additional amount is added to the normal retirement benefit based on the difference between (i) the frozen age 65 accrued benefit at January 1, 2002 and (ii) a hypothetical age 65 life annuity amount that is actuarially equivalent to the January 1, 2002 opening cash balance account projected to normal retirement age with interest credits only.
108
Table of Contents
Benefits are payable at termination either in the form of a lump sum or an annuity (the default form and time under the nonqualified plan is a lump sum at separation from service). The lump sum is equal to the cash balance account value at the time of distribution (plus an additional amount, if applicable, associated with the procedure described above for those who had an opening account balance established as of January 1, 2002). The immediate annuity payable is the actuarial equivalent of the normal retirement annuity benefit as described above, except in the event of early retirement, as described below.
Eligibility for early retirement is satisfied with attainment of either (i) age 62 with 10 years of service, or (ii) age 55 with 15 years of service. To the extent these age and service conditions are satisfied, the annuity form of benefit available is based on reducing the normal retirement benefit by 0.6% per month up to 36 months, and 0.4% for each additional month up to 84 months, by which age at retirement precedes age 65.
The normal form of annuity is a single life annuity for non-married participants and a reduced joint life annuity with a 50% survivor benefit for married participants. Other optional forms are available on a reduced basis as well.
Final average pay design. The following highlights the basic operation of the final average pay design features of the CSA Retirement Plan and the Supplementary Benefit Plan.
The annual retirement benefit, payable as a life annuity at age 65, is equal to 1.5% multiplied by final average pay multiplied by years of service, where final average pay is determined by taking the average of the highest five calendar years of compensation within the last ten calendar years, excluding the year in which termination occurs. Compensation is determined on the same basis as that applicable to the Cash Balance Design, except lump sum severance and signing bonuses are not excluded. Prior to the February 1, 2009 freeze of the CSA Retirement Plan, benefits associated with pay in excess of qualified plan limitations were provided by the Supplementary Benefit Plan, and benefits associated with pay up to qualified plan limits were provided by the CSA Retirement Plan. After the February 1, 2009 freeze of the CSA Retirement Plan, the Supplementary Benefit Plan still provides only for benefits associated with pay in excess of qualified plan limitations, but no further benefit accruals are provided under the qualified CSA Retirement Plan.
Benefits fully vest upon 3 years of service, with no benefits vested for less than 3 years of service. Service is measured based on an elapsed time basis from date of hire.
Benefits are payable as an annuity at retirement. The normal form of annuity is a single life annuity for non-married participants or a reduced joint life annuity with a 50% survivor benefit for married participants. Other optional forms are available on a reduced basis as well.
Eligibility for early retirement is satisfied with attainment of either (i) age 62 with 10 years of service, or (ii) age 55 with 15 years of service. The annuity form of benefit available is based on reducing the normal retirement benefit by 0.4% per month by which age at retirement precedes age 62. In addition, there is no reduction in any event if a participant has attained age 55 with 30 years of service.
Termination and change in control benefits. Our Named Executive Officers receive certain benefits under their employment agreements with us upon certain termination of employment events, including following a change in control of the Company. These benefits, described in detail under “Terms Applicable to Payments Upon Termination of Employment” below, are intended to ensure that the executive leadership team is able to objectively evaluate potential change in control transactions by addressing the potential personal impact of such transactions on our executives.
Health benefits. We provides executives with health and welfare benefits under our Health & Well-Being Benefit Plan that is made available generally to its salaried employees. The Health & Well-Being Benefit Plan is a flexible plan which permits participants to choose among various co-pay options and available benefits, including medical, prescription drug, dental, long-term disability and life insurance and other benefits, depending on the needs of the participant and his or her dependents. These benefits help us remain competitive in attracting and retaining a high caliber management team.
109
Table of Contents
Perquisites. We provide each of our senior executives with a vehicle for business and personal use through our vehicle lease program or through a vehicle allowance. We also reimburse senior executives the cost of tax preparation and financial planning services up to a maximum of $3,000 per year. The compensation committee regards the level of such perquisites to be modest and of benefit to us in attracting and retaining a high caliber management team.
Compensation matters following emergence from bankruptcy. In accordance with our plan of reorganization, the employment agreements and compensatory arrangements have generally been continued. As such, benefit levels and bonus opportunities would remain similar to past practice as described herein. No change in control will be deemed to have occurred under any such arrangements as a result of the transactions consummated pursuant to our plan of reorganization and our emergence from bankruptcy. In addition, the Named Executive Officers received a cash bonus and an equity grant consisting of restricted stock and stock options upon emergence from bankruptcy. Our plan of reorganization provided that the target amount of the cash bonus assumed an emergence date on or after June 1, 2010 through August 2, 2010 and amounts would be increased by 20% in the event of emergence from bankruptcy prior to such date. Target awards were $570,000 for Mr. McElya, $412,500 for Mr. Hasler, $242,000 for Mr. Campbell, $211,750 for Mr. Stephenson and $192,500 for Mr. Verwlist. As emergence occurred prior to June 1, 2010, the named executive officers received the following amounts: $684,000 for Mr. McElya, $495,000 for Mr. Hasler, $290,400 for Mr. Campbell, $254,100 for Mr. Stephenson and $231,000 for Mr. Verwlist.
On the emergence date, we adopted the 2010 Cooper-Standard Holdings Inc. Management Incentive Plan, or the Management Incentive Plan, that was filed with the Bankruptcy Court on May 5, 2010, as part of the supplement to our plan of reorganization. Initial grants were made to key employees on the date of emergence, or the Initial Grant Awards. The total number of shares authorized to be issued under the Management Incentive Plan as the Initial Grant Awards were as follows: (1) 4% of our common stock (or 757,896 shares of common stock, plus, subject to realized dilution on the warrants, an additional 104,075 shares of common stock) to be granted as restricted stock; (2) 4% of the 7% preferred stock (convertible into 178,783 shares of common stock) to be granted as restricted 7% preferred stock; and (3) 3% of the equity (or 702,509 shares of common stock, plus, subject to realized dilution on the warrants, an additional 78,057 shares of common stock) to be granted as stock options. The total number of shares which may be issued under the Management Incentive Plan as Future Grant Awards, to be issued incrementally to officers, employees and directors, is 3% of the equity (or 702,509 shares of common stock, plus, subject to realized dilution on the warrants, 78,057 shares of common stock).
On the date of emergence, the Initial Grant Awards were made to key employees of the Company. All the named executive officers received time-based stock options, time-based restricted stock, and time-based restricted 7% preferred stock, which vest in equal installments on each anniversary of emergence for four years, while the participant remains employed (other than the CEO who did not receive any stock options and whose time-based restricted stock and time-based restricted 7% preferred stock will vest in equal installments over three years). All the named executive officers also received equity awards in respect of warrants, which vest (or restrictions thereon lapse) and become exercisable on the later of the date on which (i) the time-based stock option or restricted stock vests (or restrictions thereon lapse) and becomes exercisable in accordance with its terms or (ii) any or all of the warrants are exercised, in each case in an amount determined based on the number of shares issued upon the exercise of such warrants, which shall be determined for each exercise of a warrant by multiplying the award by the Warrant Factor (as defined below); provided that upon termination of the participant’s employment prior to full exercise or expiration of the warrants, the award shall vest and become exercisable to the extent that the time-based stock option or time-based restricted stock vested (or restrictions thereon have lapsed) and became exercisable as of the date of such termination in accordance with its terms and in an amount determined by multiplying the award by the Deemed Warrant Factor. Warrant Factor means, at the time of each exercise of warrants, (i) the number of shares actually issued by the Company upon such exercise divided by (ii) the total amount of outstanding warrants. Deemed Warrant Factor means, as of the date of the participant’s termination of employment, (i) the number of shares that would have been issued by the Company if the warrants outstanding and unexercised as of such date were deemed exercised on a net exercise basis, based on the market value of such shares as of such date, divided by (ii) the total amount of outstanding warrants.
110
Table of Contents
The unvested outstanding awards are generally canceled by the Company without consideration upon termination of employment, provided that upon termination without Cause, by the participant for Good Reason, or due to the participant’s death or Disability (generally as such terms are defined in an executive’s employment agreement if they have one, or else as defined in the Management Incentive Plan), the participant shall be deemed vested as of the date of such termination in any of the equity awards that would have otherwise vested in the calendar year in which such termination occurs.
The initial grant allocations to the named executive officers were as follows:
| Restricted Common Stock |
Restricted Common Stock in Respect of Warrants |
Restricted 7% Preferred Stock |
Stock Options | Stock Options in Respect of Warrants |
||||||||||||||||
| James S. McElya |
375,940 | 54,075 | 21,534 | 0 | 0 | |||||||||||||||
| Edward Hasler |
61,680 | 9,000 | 3,533 | 110,000 | 13,857 | |||||||||||||||
| Allen J. Campbell |
54,581 | 7,566 | 3,142 | 93,000 | 11,941 | |||||||||||||||
| Keith D. Stephenson |
54,581 | 7,566 | 3,142 | 93,000 | 11,941 | |||||||||||||||
| Michael C. Verwilst |
34,516 | 4,761 | 1,977 | 58,000 | 7,448 | |||||||||||||||
The stock options were granted with an exercise price equal to the plan of reorganization value of our common stock of $25.52 per share.
Effect of accounting and tax treatment on compensation decisions. In the review and establishment of our compensation programs, we consider the anticipated accounting and tax implications to us and our executives. Section 162(m) of the Internal Revenue Code limits the deductibility of compensation paid to executives in excess of $1,000,000 in a year, other than performance-based compensation meeting certain requirements. The compensation committee considers our anticipated tax treatment for the compensation paid to executives; however, there may be instances where the compensation committee may conclude that it is appropriate to exceed the limitation on deductibility under Section 162(m) to ensure that executive officers are compensated in a manner that is consistent with our overall compensation philosophy and objectives and which the compensation committee believes to be in our best interests.
Executive compensation
Set forth below is information regarding compensation for services to the Company in all capacities of the following executive officers, or the Named Executive Officers, during the year ended December 31, 2009: (i) our Chief Executive Officer; (ii) our Chief Financial Officer; and (iii) the three most highly compensated executive officers other than the Chief Executive Officer and Chief Financial Officer who were serving as executive officers at December 31, 2009.
111
Table of Contents
Summary compensation table
| Name and Principal |
Year (b) |
Salary (c) |
Bonus(5) (d) |
Stock Awards(6) (e) |
Option Awards(7) (f) |
Non-Equity Incentive Plan Compensation(8) (g) |
Change in Pension Value and Nonqualified Deferred Compensation Earnings(9) (h) |
All
Other Compensation (i) |
Total (j) |
|||||||||||||||||||||||||||
| James S. McElya,(1) |
2009 | $ | 809,327 | (4) | $ | 0 | $ | 0 | $ | 0 | $ | 1,626,815 | $ | 1,233,312 | $ | 112,303 | (10) | $ | 3,781,757 | (27) | ||||||||||||||||
| Chairman and Chief Executive Officer |
2008 | $ | 950,000 | $ | 0 | $ | 0 | $ | 0 | $ | 534,098 | $ | 586,959 | $ | 183,673 | (11) | $ | 2,254,730 | (28) | |||||||||||||||||
| 2007 | $ | 850,000 | $ | 37,500 | $ | 284,093 | $ | 0 | $ | 1,456,393 | $ | 588,022 | $ | 127,282 | (12) | $ | 3,343,290 | (29) | ||||||||||||||||||
| Edward Hasler,(2) |
2009 | $ | 647,596 | (4) | $ | 0 | $ | 0 | $ | 0 | $ | 1,426,815 | $ | 1,344,965 | $ | 74,494 | (13) | $ | 3,493,870 | (27) | ||||||||||||||||
| Vice Chairman and President, North America |
2008 | $ | 660,578 | $ | 0 | $ | 0 | $ | 0 | $ | 504,788 | $ | 466,978 | $ | 95,216 | (14) | $ | 1,727,560 | (28) | |||||||||||||||||
| 2007 | $ | 500,000 | $ | 37,500 | $ | 416,274 | $ | 243,146 | $ | 837,652 | $ | 240,575 | $ | 63,944 | (15) | $ | 2,339,091 | (29) | ||||||||||||||||||
| Allen J. Campbell, |
2009 | $ | 383,308 | (4) | $ | 0 | $ | 0 | $ | 0 | $ | 672,751 | $ | 117,096 | $ | 50,644 | (16) | $ | 1,223,799 | (27) | ||||||||||||||||
| Vice President and Chief Financial Officer |
2008 | $ | 440,000 | $ | 0 | $ | 0 | $ | 0 | $ | 309,386 | $ | 66,629 | $ | 71,176 | (17) | $ | 887,191 | (28) | |||||||||||||||||
| 2007 | $ | 400,000 | $ | 37,500 | $ | 224,267 | $ | 100,578 | $ | 561,597 | $ | 72,013 | $ | 68,825 | (18) | $ | 1,464,780 | (29) | ||||||||||||||||||
| Keith D. Stephenson |
2009 | $ | 335,394 | (4) | $ | 0 | $ | 0 | $ | 0 | $ | 637,001 | $ | 26,133 | $ | 188,352 | (19) | $ | 1,186,880 | (27) | ||||||||||||||||
| President, International |
2008 | $ | 385,000 | $ | 0 | $ | 0 | $ | 529,562 | $ | 0 | $ | 35,392 | $ | 37,663 | (20) | $ | 987,617 | (28) | |||||||||||||||||
| Michael C. Verwilst,(3) |
2009 | $ | 321,327 | (4) | $ | 0 | $ | 0 | $ | 0 | $ | 637,001 | $ | 70,615 | $ | 35,891 | (21) | $ | 1,064,834 | (27) | ||||||||||||||||
| Vice President, Mergers & Acquisitions |
2008 | $ | 385,000 | $ | 0 | $ | 0 | $ | 0 | $ | 162,834 | $ | 65,262 | $ | 57,261 | (22) | $ | 670,357 | (28) | |||||||||||||||||
| 2007 | $ | 325,673 | $ | 37,500 | $ | 175,028 | $ | 95,044 | $ | 400,118 | $ | 61,394 | $ | 43,491 | (23) | $ | 1,138,248 | (29) | ||||||||||||||||||
| Larry J. Beard, |
2009 | $ | 88,413 | (4) | $ | 0 | $ | 0 | $ | 0 | $ | 0 | $ | 67,758 | $ | 2,379,730 | (24) | $ | 2,535,901 | (27) | ||||||||||||||||
| Vice President Strategic Planning and Business Development |
2008 | $ | 370,443 | $ | 0 | $ | 0 | $ | 0 | $ | 309,386 | $ | 122,610 | $ | 73,428 | (25) | $ | 875,867 | (28) | |||||||||||||||||
| 2007 | $ | 365,000 | $ | 37,500 | $ | 210,293 | $ | 0 | $ | 533,433 | $ | 125,665 | $ | 51,185 | (26) | $ | 1,323,076 | (29) | ||||||||||||||||||
| (1) | Mr. McElya served as executive Chairman from July 1, 2008 through March 25, 2009. As of March 26, 2009, he resumed serving as Chief Executive Officer as well. |
| (2) | Mr. Hasler served as President and Chief Executive Officer from July 1, 2008 through March 25, 2009. As of March 26, 2009, he serves as the Vice Chairman and President, North America. In connection with his appointment in mid-2008, his annual base salary was increased to $750,000. |
| (3) | Mr. Verwilst served as President, Global Fluid Systems from June 2007 through March 26, 2009. As of March 26, 2009 he resumed serving as Vice President, Mergers and Acquisitions. |
| (4) | In response to the downturn in the economy and in the automotive supply industry, we implemented a 10% base pay reduction for all U.S. salaried employees, including the Named Executive Officers. In addition, we retained the equivalent of one week’s worth of base salary from all U.S. salaried employees in exchange for compensatory time off. The impact of these salary reduction measures are reflected in the base salary figures shown in column (c) for the Named Executive Officers. The annual base salaries that would have been in effect absent these reductions are as follows: Mr. McElya, $950,000; Mr. Hasler, $750,000; Mr. Campbell, $440,000; Mr. Stephenson, $385,000 (increased to $425,000 as of December 28, 2009); and Mr. Verwilst, $385,000. Mr. Beard’s employment ended on March 31, 2009, and his base earnings from January 1, 2009-March 31, 2009 (net of the reductions described above) are also shown in column (c). |
| (5) | The amount shown in column (d) represents for each Named Executive Officer a special, discretionary bonus awarded by our board of directors in the years indicated. Incentive cash compensation earned during the fiscal year based on pre-established criteria approved by the compensation committee under our annual incentive bonus program and Long Term Incentive Plan is reported in column (g). |
| (6) | The amount shown in column (e) represents the grant date fair value associated with Company matching units under the Management Stock Purchase Plan as determined pursuant to ASC Topic 718. As discussed herein, the value of the matching units is presumed to be $0 at December 31, 2009. Description of the Management Stock Purchase Plan is found under Executive Compensation Components. |
| (7) | The amount shown in column (f) represents the grant date fair value of stock option awards granted pursuant to ASC Topic 718. As discussed herein, the value of the stock options was presumed to be $0 at December 31, 2009. |
| (8) | The amount shown in column (g) represents: for 2009, the sum of: (i) bonus payments for 2009 under our annual incentive bonus program of, for Mr. McElya, $950,000; for Mr. Hasler, $750,000; for Mr. Campbell, $286,000; for Mr. Stephenson, $250,250; and for Mr. Verwilst, $250,250; and (ii) payments under our Long Term Incentive Plan for the performance period ending December 31, 2009 of, for Mr. McElya, $676,815; for Mr. Hasler, $676,815; for Mr. Campbell, $386,751; for Mr. Stephenson, $386,751; and for Mr. Verwilst, $386,751; and for 2008, the sum of: (i) zero bonus payments for 2008 under our annual incentive bonus program for all Named Executive Officers, and (ii) payments under our Long Term Incentive Plan for the performance period ending December 31, 2008 of, for Mr. McElya, $534,098; for Mr. Hasler, $504,788; for Mr. Campbell, $309,386; for Mr. Verwilst, $162,834; and for Mr. Beard, $309,386 (Mr. Stephenson had not yet been employed long enough to receive a payment under our Long Term Incentive Plan for the performance period ending December 31, 2008); and for 2007, the sum of: (i) bonus payments for 2007 under our annual incentive bonus program of, for Mr. McElya, $1,052,300; for Mr. Hasler, $495,200; for Mr. Campbell, $321,880; for Mr. Stephenson, $175,934; for Mr. Verwilst, $263,137; and for Mr. Beard, $293,716; and (ii) payments under our Long Term Incentive Plan for the performance period ending December 31, 2007 of, for Mr. McElya, $404,093; for Mr. Hasler, $342,452; for Mr. Campbell, $239,717; for Mr. Verwilst, $136,981; and for Mr. Beard, $239,717 (Mr. Stephenson had not yet been employed long enough to receive a payment under our Long Term Incentive Plan for the performance period ending December 31, 2007). |
| (9) | The amount shown in column (h) represents for each Named Executive Officer the sum of the aggregate annualized change in the actuarial present value of accumulated benefits under all defined benefit and actuarial pension plans (qualified and non-qualified, including supplemental plans) from the plan measurement date used for financial statement reporting purposes with respect to the prior completed fiscal year to the plan measurement date used for financial statement reporting purposes with respect to the covered fiscal year. |
112
Table of Contents
| (10) | The amount shown in column (i) represents our contributions under the qualified 401(k) CSA Investment Savings Plan and nonqualified defined contribution portion of the Supplementary Benefit Plan (totaling $80,090); the cost of Company-paid personal travel; the cost of Company-paid tax preparation and financial planning services; the cost of a Company-provided vehicle; and life insurance premiums paid by the Company. |
| (11) | The amount shown in column (i) represents our contributions under the qualified 401(k) CSA Investment Savings Plan and nonqualified defined contribution portion of the Supplementary Benefit Plan (totaling $144,245); the cost of Company-paid personal travel; the cost of Company-paid tax preparation and financial planning services; the cost of a Company-provided vehicle; and life insurance premiums paid by the Company. |
| (12) | The amount shown in column (i) represents our contributions under the qualified 401(k) CSA Investment Savings Plan and nonqualified defined contribution portion of the Supplementary Benefit Plan (totaling $105,250); the cost of Company-paid personal travel; the cost of Company-paid tax preparation and financial planning services; the cost of a Company-provided vehicle; and life insurance premiums paid by the Company. |
| (13) | The amount shown in column (i) represents our contributions under the qualified 401(k) CSA Investment Savings Plan and nonqualified defined contribution portion of the Supplementary Benefit Plan (totaling $67,705); the cost of a Company-provided vehicle; and life insurance premiums paid by the Company. |
| (14) | The amount shown in column (i) represents our contributions under the qualified 401(k) CSA Investment Savings Plan and nonqualified defined contribution portion of the Supplementary Benefit Plan (totaling $89,584); the cost of a Company-provided vehicle; and life insurance premiums paid by the Company. |
| (15) | The amount shown in column (i) represents our contributions under the qualified 401(k) CSA Investment Savings Plan and nonqualified defined contribution portion of the Supplementary Benefit Plan (totaling $60,726); and life insurance premiums paid by the Company. |
| (16) | The amount shown in column (i) represents our contributions under the qualified 401(k) CSA Investment Savings Plan and nonqualified defined contribution portion of the Supplementary Benefit Plan (totaling $38,692); the cost of Company-paid tax preparation and financial planning services; the cost of a Company-provided vehicle; and life insurance premiums paid by the Company. |
| (17) | The amount shown in column (i) represents our contributions under the qualified 401(k) CSA Investment Savings Plan and nonqualified defined contribution portion of the Supplementary Benefit Plan (totaling $60,040); the cost of Company-paid tax preparation and financial planning services; the cost of a Company-provided vehicle; and life insurance premiums paid by the Company. |
| (18) | The amount shown in column (i) represents our contributions under the qualified 401(k) CSA Investment Savings Plan and nonqualified defined contribution portion of the Supplementary Benefit Plan (totaling $43,153); the cost of a Company-provided apartment; the cost of Company-paid tax preparation and financial planning services; the cost of a Company-provided vehicle; and life insurance premiums paid by the Company. |
| (19) | The amount shown in column (i) represents our contributions under the qualified 401(k) CSA Savings Plan and nonqualified defined contribution portion of the Supplementary Benefit Plan (totaling $17,001); the cost of a Company-provided vehicle; a goods and services differential of $28,810; the value of Company-paid costs associated with Mr. Stephenson’s expatriate assignment (totaling $140,610); and life insurance premiums paid by the Company. |
| (20) | The amount shown in column (i) represents our contributions under the qualified 401(k) CSA Savings Plan and nonqualified defined contribution portion of the Supplementary Benefit Plan (totaling $33,608); the cost of a Company-provided vehicle; and life insurance premiums paid by the Company. |
| (21) | The amount shown in column (i) represents our contributions under the qualified 401(k) CSA Investment Savings Plan and nonqualified defined contribution portion of the Supplementary Benefit Plan (totaling $25,927); the cost of Company-paid tax preparation and financial planning services; the cost of a Company-provided vehicle; and life insurance premiums paid by the Company. |
| (22) | The amount shown in column (i) represents our contributions under the qualified 401(k) CSA Investment Savings Plan and nonqualified defined contribution portion of the Supplementary Benefit Plan (totaling $47,059); the cost of Company-paid tax preparation and financial planning services; the cost of a Company-provided vehicle; and life insurance premiums paid by the Company. |
| (23) | The amount shown in column (i) represents our contributions under the qualified 401(k) CSA Savings Plan and nonqualified defined contribution portion of the Supplementary Benefit Plan (totaling $35,079); the cost of Company-paid tax preparation and financial planning services; the cost of a Company-provided vehicle; and life insurance premiums paid by the Company. |
| (24) | Mr. Beard’s employment ended on March 31, 2009 due to a Resignation for Good Reason under his employment agreement. The amount shown in column (i) represents the cost of a Company-provided vehicle; life insurance premiums paid by the Company; and the amount of the compensation payable to Mr. Beard upon the termination of his employment (totaling $2,375,717, which represents a separation payment obligation of $1,237,500, a pension enhancement obligation of $234,413, $307,891 representing the payout of Mr. Beard’s non-qualified cash balance account under the Supplementary Benefit Plan less the amount the account earned in 2009 and reported under column (h), $131,204 representing the payout of Mr. Beard’s nonqualified defined contribution portion of the Supplementary Benefit Plan, $259,998 representing the portion of Mr. Beard’s Executive Deferred Compensation Plan account that was not allocated to CSA stock units, $175,594 worth of CSA stock representing 3,511.88 CSA stock units held under the Executive Deferred Compensation Plan at a share price of $50 at the time of distribution, $6,490 in vacation payout, and an estimated value of $22,627 related to temporary health and welfare benefits to be received for 24 months after termination). |
| (25) | The amount shown in column (i) represents our contributions under the qualified 401(k) CSA Investment Savings Plan and nonqualified defined contribution portion of the Supplementary Benefit Plan (totaling $54,233); a special one-time Company contribution under the Executive Deferred Compensation Plan; the cost of a Company-provided vehicle; and life insurance premiums paid by the Company. |
| (26) | The amount shown in column (i) represents our contributions under the qualified 401(k) CSA Investment Savings Plan and nonqualified defined contribution portion of the Supplementary Benefit Plan (totaling $39,568); the cost of Company-paid tax preparation and financial planning services; the cost of a Company-provided vehicle; and life insurance premiums paid by the Company. |
| (27) | The percentages of total compensation in 2009 that were attributable to base salary and total bonus (the amounts identified in columns (d) and (g)) were as follows: Mr. McElya, base salary 21.4%, bonus 43.0%; for Mr. Hasler, base salary 18.5%, bonus 40.8%; for Mr. Campbell, base salary 31.2%, bonus 54.8%; for Mr. Stephenson, base salary 28.1%, bonus 53.4%; for Mr. Verwilst, base salary 30.0%, bonus 59.5%; for Mr. Beard, base salary 3.5%, bonus 0.0%. |
| (28) | The percentages of total compensation in 2008 that were attributable to base salary and total bonus (the amounts identified in columns (d) and (g)) were as follows: Mr. McElya, base salary 42.1%, bonus 23.7%; for Mr. Hasler, base salary 38.2%, bonus 29.2%; for Mr. Campbell, base salary 49.6%, bonus 34.9%; for Mr. Stephenson, base salary 39.0%, bonus 0.0%; for Mr. Verwilst, base salary 57.4%, bonus 24.3%; for Mr. Beard, base salary 42.3%, bonus 35.3%. |
| (29) | The percentages of total compensation in 2007 that were attributable to base salary and total bonus (the amounts identified in columns (d) and (g)) were as follows: Mr. McElya, base salary 25.4%, bonus 44.7%; for Mr. Hasler, base salary 21.4%, bonus 37.4%; for Mr. Campbell, base salary 27.3%, bonus 40.9%; for Mr. Verwilst, base salary 28.6%, bonus 38.4%; for Mr. Beard, base salary 27.6%, bonus 43.2%. |
113
Table of Contents
Non-equity incentive plan compensation—annual incentive bonus
Due to the severe industry and economic conditions that developed in 2008 and continued into 2009, the compensation committee, at the recommendation of senior management, suspended the annual bonus program applicable to senior executives for the first half of 2009. For the second half of 2009, the compensation committee approved executive bonus opportunities with target amounts set at 50% of the amounts originally established for 2009 prior to the suspension of the program. For the second half of 2009, the compensation committee established an incentive bonus target amount for each member of the executive leadership team based on a percentage of base salary. With respect to the Named Executive Officers, the percentage was 50% for Messrs. McElya and Hasler, and 32.5% for Messrs. Campbell, Stephenson and Verwilst. These incentive bonus target amounts are based on the levels of responsibility of the executives and other performance-based factors. Incentive bonus amounts actually paid for 2009 performance are set forth in footnote (8) under column (g) of the above Summary Compensation Table.
2009 grants of plan-based awards
The following table sets forth information regarding plan-based awards made to the Named Executive Officers during 2009 that provide for possible future payouts.
| Name (a) |
Award Type | Grant Date (b) |
Estimated Future Payouts Under Non-Equity Incentive Plan Awards |
All Other Stock Awards: Number of Shares of Stock or Units (#) (i) |
All Other Option Awards: Number of Securities Underlying Options (j) |
Exercise or Base Price of Option Awards ($/sh) (k) |
Grant Date Fair Value of Stock and Option Awards ($/sh) (l) |
|||||||||||||||||||||||||||
| Threshold (c) |
Target (d) |
Maximum (e) |
||||||||||||||||||||||||||||||||
| James S. McElya |
LTIP(1) | 1/1/2009 | $ | 175,000 | $ | 350,000 | Not applicable(2) | — | — | — | — | |||||||||||||||||||||||
| 1/2 Year Bonus(3) | 7/1/2009 | $ | 237,500 | $ | 475,000 | $ 950,000 | ||||||||||||||||||||||||||||
| Edward A. Hasler |
LTIP(1) | 1/1/2009 | $ | 175,000 | $ | 350,000 | Not applicable(2) | — | — | — | — | |||||||||||||||||||||||
| 1/2 Year Bonus(3) | 7/1/2009 | $ | 187,500 | $ | 375,000 | $ 750,000 | ||||||||||||||||||||||||||||
| Allen J. Campbell |
LTIP(1) | 1/1/2009 | $ | 100,000 | $ | 200,000 | Not applicable(2) | — | — | — | — | |||||||||||||||||||||||
| 1/2 Year Bonus(3) | 7/1/2009 | $ | 71,500 | $ | 143,000 | $ 286,000 | ||||||||||||||||||||||||||||
| Keith D. Stephenson |
LTIP(1) | 1/1/2009 | $ | 100,000 | $ | 200,000 | Not applicable(2) | — | — | — | — | |||||||||||||||||||||||
| 1/2 Year Bonus(3) | 7/1/2009 | $ | 62,563 | $ | 125,125 | $ 250,250 | ||||||||||||||||||||||||||||
| Michael C. Verwilst |
LTIP(1) | 1/1/2009 | $ | 100,000 | $ | 200,000 | Not applicable(2) | — | — | — | — | |||||||||||||||||||||||
| 1/2 Year Bonus(3) | 7/1/2009 | $ | 62,563 | $ | 125,125 | $ 250,250 | ||||||||||||||||||||||||||||
| Larry Beard(4) |
LTIP(1) | 1/1/2009 | $ | 100,000 | $ | 200,000 | Not applicable(2) | — | — | — | — | |||||||||||||||||||||||
| 1/2 Year Bonus(3) | — | — | — | — | — | — | — | — | ||||||||||||||||||||||||||
| (1) | The non-equity incentive plan awards represent 2009 awards granted by the compensation committee to the Named Executive Officers under our Long Term Incentive Plan based on the achievement of operating cash flow objectives in the performance period beginning January 1, 2009 and ending December 31, 2011, or 2009 LTIP Awards. 2009 LTIP Awards are payable in the first quarter of 2012, depending on the level of achievement of established targets and the approval of the compensation committee. The determination of award amounts under the Long Term Incentive Plan is described under “Long-term incentive compensation” under the Executive Compensation Components section. The amounts set forth in footnote (5) under column (g) of the Summary Compensation Table do not pertain to the 2009 LTIP Awards; they reflect payments under a 2007 LTIP award granted by the compensation committee under the Long Term Incentive Plan based on the performance period beginning January 1, 2007 and ending December 31, 2009. |
| (2) | The 2009 LTIP does not provide for a maximum payout; the amount of the payout increases by 10% for each 1% increase in the actual level of achievement above the target level. |
| (3) | As described above under “Executive compensation review and determinations for 2009”, due to the severe industry and economic conditions at the time, the compensation committee, at the recommendation of senior management, suspended the annual bonus program applicable to senior executives for the first half of 2009. For the second half of 2009, the compensation committee approved executive bonus opportunities with target amounts set at 50% of the amounts originally established for 2009 prior to the suspension of the program. The compensation committee set adjusted EBITDA performance targets (applicable to the Company as a whole) for the second half of 2009 in accordance with our 2009 business plan applicable to that period for use as the basis for bonus attainment. The amounts set forth in footnote (7) under column (g) of the Summary Compensation Table pertain to payouts of the 2009 1/2 Year Bonus awards based on actual achievement based on performance to adjusted EBITDA targets. |
| (4) | Mr. Beard’s employment with the us terminated as of March 31, 2009. He is not eligible for future payouts under non-equity incentive plan awards payable with respect to periods ending after that date, and as such, forfeited any right to payment under the 2009 LTIP. |
114
Table of Contents
Outstanding equity awards at 2009 fiscal year-end
The following table sets forth information concerning outstanding stock option awards and stock units under the Management Stock Purchase Plan held by the Named Executive Officers at December 31, 2009, including the number of shares underlying both exercisable and unexercisable portions of each stock option as well as the exercise price and expiration date of each outstanding option.
| Option Awards(1) | Stock Awards | |||||||||||||||||||||||
| Name (a) |
Number of Securities Underlying Unexercised Options (#) Exercisable(2) (b) |
Equity Incentive Plan Awards: Number of Securities Underlying Unexercised Unearned Options (#)(3) (d) |
Option Exercise Price (e) |
Option Expiration Date(4) (f) |
Number of Shares or Units of Stock That Have Not Vested (#) (g) |
Market Value of Shares or Units of Stock That Have Not Vested(10) (h) |
||||||||||||||||||
| James S. McElya |
34,428 | 10,295 | $ | 100 | 12/23/2014 | 789 | (5) | $ | 0 | |||||||||||||||
| Edward A. Hasler |
18,936 | 5,662 | $ | 100 | 12/23/2014 | 1,156 | (6) | $ | 0 | |||||||||||||||
| 3,807 | 1,595 | $ | 100 | 3/15/2017 | ||||||||||||||||||||
| Allen J. Campbell |
17,215 | 5,147 | $ | 100 | 12/23/2014 | 623 | (7) | $ | 0 | |||||||||||||||
| 1,576 | 660 | $ | 100 | 3/15/2017 | ||||||||||||||||||||
| Keith D. Stephenson |
8,333 | 4,167 | $ | 100 | 3/20/2018 | 471 | (8) | $ | 0 | |||||||||||||||
| Michael C. Verwilst |
13,771 | 4,118 | $ | 100 | 12/23/2014 | |||||||||||||||||||
| 1,487 | 624 | $ | 100 | 3/15/2017 | 486 | (9) | $ | 0 | ||||||||||||||||
| Larry Beard |
— | — | — | — | — | — | ||||||||||||||||||
| (1) | All of the amounts presented in this portion of the table relate to options to purchase shares of the Company’s common stock granted to the Named Executive Officers under our Stock Incentive Plan. Options listed above with an Option Expiration Date of December 23, 2014 were granted on December 23, 2004, those with an Option Expiration Date of March 15, 2017 were granted on March 15, 2007, and those with an Option Expiration Date of March 20, 2018 were granted on March 20, 2008. |
| (2) | Represents time-based options and performance-based options which have vested and were exercisable as of December 31, 2009 with respect to the following number of shares of the Company’s common stock: for Mr. McElya, 22,362 shares time-based and 12,066 shares performance-based; for Mr. Hasler, 15,000 shares time-based and 7,743 shares performance-based; for Mr. Campbell, 12,299 shares time-based and 6,492 shares performance-based; for Mr. Stephenson, 8,333 shares time-based and 0 shares performance-based; and for Mr. Verwilst, 10,000 shares time-based and 5,258 shares performance-based. |
| (3) | Represents outstanding time-based options and performance-based options which have not been earned or vested and were unexercisable as of December 31, 2009 with respect to the following number of shares of the Company’s common stock: for Mr. McElya, 0 shares time-based and 10,295 shares performance-based; for Mr. Hasler, 0 shares time-based and 7,257 shares performance-based; for Mr. Campbell, 0 shares time-based and 5,807 shares performance-based; for Mr. Stephenson, 0 shares time-based and 4,167 shares performance-based; and for Mr. Verwilst, 0 shares time-based and 4,742 shares performance-based. |
| (4) | Options expire on the earliest to occur of: (i) the tenth anniversary of the date of grant; (ii) the first anniversary of the date of the optionee’s termination of employment due to death, disability, retirement at normal retirement age or the sale by the Company (not constituting a change of control) of the business in which the optionee was employed; (iii) 90 days following the date of the optionee’s termination of employment without cause (or for reasons other than those described in (ii)); or (iv) on the date of the optionee’s termination of Employment for cause. Mr. Beard terminated his employment with us for Good Reason on March 31, 2009, pursuant to his employment agreement; thus his options expired on June 29, 2009. |
| (5) | Represents 789 stock units, which is the portion of the units granted on December 31, 2007 through our match under the Management Stock Purchase Plan that had not yet become vested as of December 31, 2009. These matching units vest ratably over a three year period. Description of Management Stock Purchase Plan is found in Executive Compensation Components. |
115
Table of Contents
| (6) | Represents 1,156 stock units, which is the portion of the units granted on December 31, 2007 through our match under the Management Stock Purchase Plan that had not yet become vested as of December 31, 2009. These matching units vest ratably over a three year period. Description of Management Stock Purchase Plan is found in Executive Compensation Components. |
| (7) | Represents 623 stock units, which is the portion of the units granted on December 31, 2007 through our match under the Management Stock Purchase Plan that had not yet become vested as of December 31, 2009. These matching units vest ratably over a three year period. Description of Management Stock Purchase Plan is found in Executive Compensation Components. |
| (8) | Represents 471 stock units, which is the portion of the units granted on December 31, 2007 through our match under the Management Stock Purchase Plan that had not yet become vested as of December 31, 2009. These matching units vest ratably over a three year period. Description of Management Stock Purchase Plan is found in Executive Compensation Components. |
| (9) | Represents 486 stock units, which is the portion of the units granted on December 31, 2007 through our match under the Management Stock Purchase Plan that had not yet become vested as of December 31, 2009. These matching units vest ratably over a three year period. Description of Management Stock Purchase Plan is found in Executive Compensation Components. |
| (10) | The values in column (h) equal the total number of matching stock units listed in column (g) for each Named Executive Officer multiplied by the value of the Company’s common stock as of December 31, 2009, which was assumed to be $0 because the common stock of the Company was cancelled upon emergence from chapter 11 under our plan of reorganization. |
2009 option exercises and stock vested
The following table sets forth certain information regarding stock-based awards that vested during 2009 for our Named Executive Officers. No stock options were exercised by our Named Executive Officers in 2009.
| Option Awards | Stock Awards | |||||||||||||||
| Name (a) |
Number of Shares Acquired on Exercise (#) (b) |
Value Realized on Exercise ($) (c) |
Number of Shares Acquired on Vesting (#) (d) |
Value Realized on Vesting ($)(7) (e) |
||||||||||||
| James S. McElya |
— | — | 789 | (1) | $ | — | ||||||||||
| Edward A. Hasler |
— | — | 1,156 | (2) | $ | — | ||||||||||
| Allen J. Campbell |
— | — | 623 | (3) | $ | — | ||||||||||
| Keith D. Stephenson |
— | — | 471 | (4) | $ | — | ||||||||||
| Michael C. Verwilst |
— | — | 486 | (5) | $ | — | ||||||||||
| Larry Beard |
— | — | 1,168 | (6) | $ | 58,400 | ||||||||||
| (1) | Represents 789 stock units which is the portion of the units granted on December 31, 2007 through our match under the Management Stock Purchase Plan that became vested on December 31, 2009. These matching units vest ratably over a three year period. Description of Management Stock Purchase Plan is found in Executive Compensation Components. |
| (2) | Represents 1,156 stock units which is the portion of the units granted on December 31, 2007 through our match under the Management Stock Purchase Plan that became vested on December 31, 2009. These matching units vest ratably over a three year period. Description of Management Stock Purchase Plan is found in Executive Compensation Components. |
| (3) | Represents 623 stock units which is the portion of the units granted on December 31, 2007 through our match under the Management Stock Purchase Plan that became vested on December 31, 2009. These matching units vest ratably over a three year period. Description of Management Stock Purchase Plan is found in Executive Compensation Components. |
| (4) | Represents 471 stock units which is the portion of the units granted on December 31, 2007 through our match under the Management Stock Purchase Plan that became vested on December 31, 2009. These matching units vest ratably over a three year period. Description of Management Stock Purchase Plan is found in Executive Compensation Components. |
116
Table of Contents
| (5) | Represents 486 stock units which is the portion of the units granted on December 31, 2007 through our match under the Management Stock Purchase Plan that became vested on December 31, 2009. These matching units vest ratably over a three year period. Description of Management Stock Purchase Plan is found in Executive Compensation Components. |
| (6) | Represents 1,168 stock units which is the portion of the units granted on December 31, 2007 through our match under the Management Stock Purchase Plan that became vested on March 31, 2009 as a result of Mr. Beard’s Resignation for Good Reason. These matching units generally vest ratably over a three year period. Description of Management Stock Purchase Plan is found in Executive Compensation Components. |
| (7) | Except for Mr. Beard’s figure, the values in column (e) equal the total number of matching stock units listed in column (d) for each Named Executive Officer multiplied by the value of the Company’s common stock as of December 31, 2009, which was assumed to be $0 because the common stock of the Company was cancelled upon emergence from chapter 11 under the Plan of Reorganization. For Mr. Beard, the value reported under column (e) equals the number of matching stock units that became immediately vested as a result of his Resignation for Good Reason (listed in column (d)), multiplied by the value of the Company’s common stock at the time his employment ended, which was $50 per share. |
2009 pension benefits
The following table sets forth the actuarial present value of each Named Executive Officer’s accumulated benefit under the CSA Retirement Plan and the non-qualified defined benefit portion of the Supplementary Benefit Plan as described in “Retirement Plan Benefits” under the Executive Compensation Components section, assuming benefits are paid at normal retirement age or the earliest retirement age at which participants receive unreduced benefits, based on current levels of compensation. The table also shows the number of years of credited service under each plan, computed as of the same pension plan measurement date used in our audited financial statements for the year ended December 31, 2009.
| Name (a) |
Plan Name (b) |
Number of Years Credited Service (#) (c) |
Present Value of Accumulated Benefit(1) ($) (d) |
Payments During Last Fiscal Year ($) (e) |
||||||||||
| James S. McElya |
CSA Retirement Plan(2) | 9.00 | $ | 109,173 | $ | 0 | ||||||||
| Supplementary Benefit Plan(3) | 13.92 | (4) | $ | 3,641,551 | $ | 0 | ||||||||
| Edward A. Hasler |
CSA Retirement Plan(6) | 22.08 | $ | 784,537 | $ | 0 | ||||||||
| Supplementary Benefit Plan(6) | 23.00 | $ | 2,328,367 | $ | 0 | |||||||||
| Allen J. Campbell |
CSA Retirement Plan(2) | 10.33 | $ | 131,353 | $ | 0 | ||||||||
| Supplementary Benefit Plan(5) | 11.25 | $ | 336,910 | $ | 0 | |||||||||
| Keith D. Stephenson |
CSA Retirement Plan(2) | 1.58 | $ | 17,316 | $ | 0 | ||||||||
| Supplementary Benefit Plan(5) | 2.50 | $ | 51,701 | $ | 0 | |||||||||
| Michael C. Verwilst |
CSA Retirement Plan(2) | 5.83 | $ | 66,248 | $ | 0 | ||||||||
| Supplementary Benefit Plan(5) | 6.75 | $ | 237,301 | $ | 0 | |||||||||
| Larry J. Beard |
CSA Retirement Plan(2) | 9.00 | $ | 0 | $ | 108,134 | ||||||||
| Supplementary Benefit Plan(5) | 9.17 | $ | 0 | $ | 366,796 | |||||||||
| (1) | Present values determined using a December 31, 2009 measurement date and reflect benefits accrued based on service and pay earned through such date. Figures are determined based on post-commencement valuation mortality (2009 Static PPA table) and commencement of benefits at age 65, except for Mr. McElya and Mr. Hasler, who were assumed to retire at age 63 and 62 respectively because they are eligible for unreduced benefits at that age as discussed in footnotes (3) and (6) below. The assumed discount rate as of the measurement date is 5.60%. |
| (2) | Messrs. McElya, Campbell, Beard, Verwilst and Stephenson are covered under the cash balance design for purposes of the qualified CSA Retirement Plan which was frozen January 31, 2009. The amount shown for Messr. Beard is the lump sum he received in 2009. |
117
Table of Contents
| (3) | Mr. McElya receives two types of defined benefits under the Supplementary Benefit Plan. He receives a non-qualified cash balance benefit determined under usual terms. In addition, he receives a benefit determined under the final average pay design, offset by the annuity-equivalent of his qualified and nonqualified cash balance benefits. Because the final average pay design includes an unreduced feature upon attainment of age 62 and 10 years of service, which the executive would be eligible for, he was assumed to retire at age 63. |
| (4) | Mr. McElya is granted four years of additional service in the Supplementary Benefit Plan to compensate for lost (non-vested) benefits accrued with his previous employer prior to joining us in January 2000. |
| (5) | Messrs. Campbell, Stephenson, Verwilst, and Beard are covered under the cash balance design for purposes of the non-qualified Supplementary Benefit Plan. The amount shown for Messr. Beard is the lump sum he received in 2009. |
| (6) | Mr. Hasler is covered under the final average pay design for both the qualified CSA Retirement Plan and the non-qualified Supplementary Benefit Plan. Because the final average pay design includes an unreduced feature upon attainment of age 62 and 10 years of service, which the executive would be eligible for, he was assumed to retire at age 62. |
2009 nonqualified deferred compensation
The following table sets forth annual executive and company contributions under non-qualified deferred compensation provisions of the Executive Deferred Compensation Plan and the non-qualified defined contribution portion of the Supplementary Benefit Plan, as well as each Named Executive Officer’s withdrawals, earnings and fiscal-year end balances in those plans.
| Name (a) |
Executive Contribution in Last FY(1) (b) |
Registrant Contributions in Last FY(2) (c) |
Aggregate Earnings in Last FY (d) |
Aggregate Withdrawals/ Distributions (e) |
Aggregate Balance at Last FYE (f) |
|||||||||||||||
| James S. McElya |
$ | 0 | $ | 78,865 | $ | (37,326 | ) | $ | (1,034,304 | ) | $ | 755,734 | ||||||||
| Edward A. Hasler |
$ | 0 | $ | 66,480 | $ | (284,630 | ) | $ | 0 | $ | 353,325 | |||||||||
| Allen J. Campbell |
$ | 0 | $ | 37,467 | $ | (151,337 | ) | $ | 0 | $ | 208,128 | |||||||||
| Keith D. Stephenson |
$ | 0 | $ | 15,776 | $ | (138,787 | ) | $ | 0 | $ | 47,959 | |||||||||
| Michael C. Verwilst |
$ | 0 | $ | 24,702 | $ | (106,929 | ) | $ | 0 | $ | 192,379 | |||||||||
| Larry J. Beard |
$ | 0 | $ | 0 | $ | (13,549 | ) | $ | (566,797 | ) | $ | 0 | ||||||||
| (1) | Amounts represent deferrals under the Executive Deferred Compensation Plan. |
| (2) | Amounts are included in column (i) of the Summary Compensation Table and represent nonqualified matching contributions under the Supplementary Benefit Plan. Our match under the Executive Deferred Compensation Plan is made in stock units under the Management Stock Purchase Plan feature, which is more fully described in the Executive Compensation Components section. The NEOs did not make deferrals under the Management Stock Purchase Plan for the 2009 plan year and therefore did not receive matching stock units for 2009. |
Potential payments upon termination or change in control
The Named Executive Officers have entered into employment agreements with us which provide for certain benefits upon termination of employment, including termination following a change in control as defined in the Cooper-Standard Automotive Inc. Change of Control Severance Pay Plan, or the Change in Control Plan. The table below shows estimates of the value of compensation that would be payable to each Named Executive Officer upon termination of employment under certain circumstances. As indicated in the table, compensation upon termination of employment varies depending on the circumstances of the termination and whether or not it occurred following a change in control. Amounts presented in the table are calculated as if the employment of the executive terminated effective December 31, 2009. Payments due to any one of the Named Executive Officers upon actual termination of employment can only be determined at the time of termination. There can be no assurance that an actual termination or change in control would produce the same or similar results as those described below if it were to occur on any other date and if the actual circumstances at the time of termination.
118
Table of Contents
Amounts accrued under the normal terms of our pension and deferred compensation plans are not included in this table. Information concerning pension benefits and deferred compensation disclosures is presented under “2009 pension benefits”, and “2009 nonqualified deferred compensation.” Similarly, information concerning vested equity awards is not included in the table, and is presented under “Outstanding equity awards at 2009 fiscal year end.”
| Name |
Severance Payment(1) |
Pension Enhance- ment(2) |
Health/ Life(3) |
Outplace- ment Services(4) |
Accele- rated Vesting of Equity Awards(5) |
Gross- Up(6) |
Total | |||||||||||||||||||||||
| James S. McElya |
||||||||||||||||||||||||||||||
| • Termination Without Cause or Resignation for Good Reason, After Change in Control |
$ | 7,074,387 | $ | 2,509,841 | $ | 554,990 | $ | 50,000 | — | $ | 3,662,843 | $ | 13,852,061 | |||||||||||||||||
| • Termination Without Cause or Resignation for Good Reason, with no Change in Control |
$ | 6,124,387 | $ | 2,509,841 | $ | 554,990 | $ | 50,000 | — | N/A | $ | 9,239,218 | ||||||||||||||||||
| • Termination for Cause or Resignation Without Good Reason |
— | — | — | — | — | N/A | — | |||||||||||||||||||||||
| • Termination due to Death |
$ | 7,676,922 | $ | 2,509,841 | $ | 142,743 | — | — | N/A | $ | 10,329,506 | |||||||||||||||||||
| • Termination due to Disability |
$ | 7,676,922 | $ | 2,509,841 | $ | 554,990 | — | — | N/A | $ | 10,741,753 | |||||||||||||||||||
| Edward A. Hasler |
||||||||||||||||||||||||||||||
| • Termination Without Cause or Resignation for Good Reason, After Change in Control |
$ | 3,904,387 | $ | 2,015,160 | $ | 538,438 | $ | 50,000 | — | $ | 2,721,929 | $ | 9,229,914 | |||||||||||||||||
| • Termination without Cause or Resignation for Good Reasons. With no Change in Control |
$ | 2,730,000 | $ | 2,015,160 | $ | 39,149 | — | — | N/A | $ | 4,784,309 | |||||||||||||||||||
| • Termination Without Cause or Resignation Without Good Reason |
— | — | — | — | — | N/A | — | |||||||||||||||||||||||
| • Termination due to Death |
$ | 424,387 | — | — | — | — | N/A | $ | 424,387 | |||||||||||||||||||||
| • Termination due to Disability |
$ | 424,387 | — | — | — | — | N/A | $ | 424,387 | |||||||||||||||||||||
| Allen J. Campbell |
||||||||||||||||||||||||||||||
| • Termination Without Cause or Resignation for Good Reason, After Change in Control |
$ | 2,134,507 | $ | 213,285 | $ | 451,020 | $ | 50,000 | — | $ | 1,024,969 | $ | 3,873,781 | |||||||||||||||||
| • Termination without Cause or Resignation for Good Reasons. With no Change in Control |
$ | 1,452,000 | $ | 213,285 | $ | 28,819 | — | — | N/A | $ | 1,694,104 | |||||||||||||||||||
| • Termination Without Cause or Resignation Without Good Reason |
— | — | — | — | — | N/A | — | |||||||||||||||||||||||
| • Termination due to Death |
$ | 242,507 | — | — | — | — | N/A | $ | 242,507 | |||||||||||||||||||||
| • Termination due to Disability |
$ | 242,507 | — | — | — | — | N/A | $ | 242,507 | |||||||||||||||||||||
119
Table of Contents
| Name |
Severance Payment(1) |
Pension Enhance- ment(2) |
Health/ Life(3) |
Outplace- ment Services(4) |
Accele- rated Vesting of Equity Awards(5) |
Gross- Up(6) |
Total | |||||||||||||||||||||||
| Keith D. Stephenson |
||||||||||||||||||||||||||||||
| • Termination Without Cause or Resignation for Good Reason, After Change in Control |
$ | 2,018,007 | $ | 91,044 | $ | 438,096 | $ | 50,000 | — | $ | 1,095,617 | $ | 3,692,764 | |||||||||||||||||
| • Termination without Cause or Resignation for Good Reasons. With no Change in Control |
$ | 1,350,500 | $ | 91,044 | $ | 19,936 | — | — | N/A | $ | 1,461,480 | |||||||||||||||||||
| • Termination Without Cause or Resignation Without Good Reason |
— | — | — | — | — | N/A | — | |||||||||||||||||||||||
| • Termination due to Death |
$ | 242,507 | — | — | — | — | N/A | $ | 242,507 | |||||||||||||||||||||
| • Termination due to Disability |
$ | 242,507 | — | — | — | — | N/A | $ | 242,507 | |||||||||||||||||||||
| Michael Verwilst |
||||||||||||||||||||||||||||||
| • Termination Without Cause or Resignation for Good Reason, After Change in Control |
$ | 1,898,007 | $ | 136,898 | $ | 435,186 | $ | 50,000 | — | $ | 972,855 | $ | 3,492,946 | |||||||||||||||||
| • Termination without Cause or Resignation for Good Reasons, With no Change in Control |
$ | 1,270,500 | $ | 136,898 | $ | 32,564 | — | — | N/A | $ | 1,439,962 | |||||||||||||||||||
| • Termination Without Cause or Resignation Without Good Reason |
— | — | — | — | — | N/A | — | |||||||||||||||||||||||
| • Termination due to Death |
$ | 242,507 | — | — | — | — | N/A | $ | 242,507 | |||||||||||||||||||||
| • Termination due to Disability |
$ | 242,507 | — | — | — | — | N/A | $ | 242,507 | |||||||||||||||||||||
| Larry Beard(7) |
$ | 1,237,500 | $ | 234,413 | $ | 22,627 | — | $ | 58,400 | N/A | $ | 1,552,940 | ||||||||||||||||||
| (1) | Cash severance is generally paid in a lump sum at termination. Cash severance amounts estimated above are based on providing executives with prorated outstanding incentive awards and a multiple of the sum of (i) their annual base rate of salary at date of termination plus (ii) their target annual bonus for the year prior to termination, with such multiple equal to three (3) for Mr. McElya and two (2) for Messrs. Hasler, Campbell, Stephenson, and Verwilst. If the termination occurs following a change of control, each Named Executive officer’s cash severance is increased by one additional year’s base salary. Further description of the terms applicable to cash severance payments is included under “Terms applicable to payments upon termination of employment.” |
| (2) | The pension enhancement provides for payment of the present value of the additional accrued benefit that would otherwise be due from the our qualified and non-qualified pension plans had the executive continued in active service for a specified number of years beyond termination, with such number of years equal to three (3) for Mr. McElya and two (2) for Messrs. Campbell, Hasler, Stephenson, and Verwilst. Pension-eligible earnings to be used for these calculations depend on the circumstances of the termination, described under “Terms applicable to payments upon termination of employment.” |
| (3) | Health and life insurance benefits are continued for the Named Executive Officers and their covered dependents after termination of employment under certain circumstances. In such cases, the commitment is generally to provide for coverage for these benefits in a manner such that (i) benefits provided are substantially similar to those at termination and (ii) recipients of such benefits will not pay higher share of cost for such benefits than had been required prior to termination of employment based on elections in place at that time. Further description of the terms applicable to health and life insurance benefits is included under “Terms applicable to payments upon termination of employment.” |
| (4) | Under Mr. McElya’s employment agreement, payment of the cost of outplacement services is provided in an amount up to 15% of his annual base salary at the time of termination, and for purposes of the computations above, actual reimbursement was assumed not to exceed $50,000. In addition, outplacement services were assumed not to be utilized in the death and disability scenarios for Mr. McElya. Upon termination without cause (or resignation for good reason) after a change of control, all Named Executive officers are entitled to payment of the cost of outplacement services in an amount equal to the lesser of 15% of annual base salary at the time of termination, or $50,000. |
120
Table of Contents
| (5) | Represents effect of accelerated vesting related to time-based and performance-based stock options. In the event of a change in control, outstanding and unvested time-based stock options become fully vested and exercisable, and 20% to 100% of outstanding and unvested performance-based options for the tranche applicable to the year in which the change in control occurs (and the tranche(s) applicable to future years) shall vest to the extent that cumulative consolidated EBITDA performance from the 2004 calendar year through the most recent fiscal year-end meets or exceeds 85% of cumulative performance targets for the same period (where vesting occurs on a straight-line basis between 20% and 100% depending on achievement of the performance targets between 85% and 100%). |
| (6) | Upon a change of control of the Company each executive may be subject to certain excise taxes pursuant to Section 280G of the Internal Revenue Code. Pursuant to the executive’s employment agreement and/or the Severance Plan, we have agreed to reimburse the executive for all excise taxes that are imposed on the executive pursuant to Section 280G and any income and excise taxes that are payable by the executive as a result of this reimbursement. These amounts assume that no amounts will be discounted as attributable to reasonable compensation and no value will be attributed to the non-competition covenants included in the agreement. Amounts will be discounted to the extent we can demonstrate by clear and convincing evidence that the non-competition covenants included in the agreement substantially constrains the executive’s ability to perform services and there is a reasonable likelihood that the non-competition covenants will be enforced against the individual. |
| (7) | Mr. Beard’s employment ended on March 31, 2009, due to resignation for Good Reason, pursuant to his employment agreement. The amounts set forth in the table represent actual payouts that occurred in 2009, which amounts are reflected in the Summary Compensation Table on page 133. The $58,400 listed under Accelerated Vesting of Equity Awards represents the number of matching stock units under the Management Stock Purchase Plan that became immediately vested as a result of his Resignation for Good Reason (1,168), multiplied by the value of the Company’s common stock at the time his employment ended, which was $50/share; the Summary Compensation Table also includes the value of employee stock units and matching stock units that were already vested prior to Mr. Beard’s termination of employment. |
Terms applicable to payments upon termination of employment
We have in effect employment agreements with each of the Named Executive Officers which provide severance pay and benefits in the event of the executive’s termination of employment for specified reasons prior to a change of control of the Company, and a Change of Control Severance Pay Plan that provides severance pay and benefits if the executive is terminated following a change of control.
Mr. McElya’s employment agreement. On March 26, 2009, Mr. McElya’s existing employment agreement with us was amended and restated, primarily to document that Mr. McElya was again serving as our Chief Executive Officer in addition to serving as Chairman. The material provisions of Mr. McElya’s previous employment agreement, entered into in December 2007, remained unchanged. Mr. McElya’s employment agreement provides him with special retirement termination benefits in the event that he terminates employment as Chief Executive Officer with at least 90 days prior written notice and agrees to continue providing services to the us as non-executive Chairman of our board of directors for a period to be mutually agreed (a “qualified retirement”). The special retirement benefits correspond to the amounts and benefits that would otherwise be payable to Mr. McElya in connection with an involuntary termination of his employment without “cause”, or in connection with a voluntary termination of his employment for “good reason”, as such terms are defined in the employment agreement. Mr. McElya’s employment agreement also provides that, following a qualified retirement as described above, Mr. McElya’s stock options with Cooper-Standard Holdings Inc., or Holdings, will continue to vest as if he remained employed for so long as Mr. McElya continues to serve as non-executive Chairman, and his vested options upon termination as Chairman will remain exercisable until two years following the date of his termination as Chairman (or until the normal option term expiration date, if sooner).
In December 2007, Mr. McElya also entered into a put option agreement with Holdings and certain stockholders of Holdings related to the 20,000 shares of Holdings’ common stock that Mr. McElya purchased on December 23, 2004, or the Purchased Shares. Under the terms of the put option agreement, in the event of Mr. McElya’s qualified retirement as described above, or termination of employment due to death or disability, in each case, prior to the occurrence of a qualified initial public offering of Holdings’ common stock, Mr. McElya will have the right to require Holdings to purchase his Purchased Shares for fair market value. Mr. McElya’s put right under the put option agreement is generally exercisable within 180 days following the date of his termination as non-executive Chairman or termination due to death or disability.
The current term of Mr. McElya’s employment agreement ends December 31, 2010, but the term will be automatically extended for one year periods thereafter unless we provide a notice of termination by September 30
121
Table of Contents
of a given year. The agreement provides Mr. McElya with an annual base salary (currently $950,000), which is to be reviewed by our board of directors each year. Our board of directors may increase, but not decrease, the base salary. The agreement also provides Mr. McElya with an annual bonus opportunity based on a percentage of his base salary (currently 100%) as well as participation in our benefit plans and long-term incentive plans and programs. Effective January 2009, Mr. McElya and the other members of our senior leadership team, consented to a 10% reduction in base salary for a six month period, subject to extension, and waived eligibility under the annual bonus plan for a bonus with respect to the first half of 2009. In addition, Mr. McElya consented to the freezing of certain retirement and savings plan benefits.
If Mr. McElya terminates employment for “Good Reason”, or we terminates Mr. McElya’s employment without “Cause”, as those terms are defined in the agreement and described below, and in each case prior to a change of control of the Company, then we will pay or provide to Mr. McElya: (i) his accrued but unpaid salary, annual and long-term incentive compensation amounts; (ii) a pro rata payment of any target annual and long-term incentive compensation amounts for which the performance periods have not ended; (iii) the greater of a lump sum payment equal to three times his current annual base salary plus his annual target bonus amount (for the year preceding the year of his termination) or a sum equal to the biweekly payments that Mr. McElya would have received if he were paid at the rate of his average compensation for the remainder of the term; (iv) a lump sum payment equal to the value of three additional years of service credit under our qualified and non-qualified defined benefit pension plans, assuming his compensation under such plans for the three year period was the highest compensation paid to him during any of the five calendar years preceding the year in which his termination of employment occurs (not impacted by our freezing of accruals under the qualified defined benefit retirement plan); (v) three years of continued coverage under the life, accident and health plans sponsored by us and in which Mr. McElya was covered immediately prior to his termination; (vi) medical and life insurance coverage for Mr. McElya and his spouse for their lifetimes, and for his dependent children until they cease to qualify as dependents; and (vii) outplacement services for up to two calendar years following the year of termination, not to exceed a cost equal to 15% of his annual base pay. The lump sum amounts described in clauses (iii) and (iv) of the preceding sentence are payable six months following the date of Mr. McElya’s termination of employment. If, during the first 36 months of life, medical and accident benefit continuation, we are unable to provide what are otherwise intended to be non-taxable benefits to Mr. McElya and his covered family members on a tax-free basis, then we will make an additional payment to Mr. McElya to reimburse him for the taxes due on such benefits.
Termination for “Cause” under Mr. McElya’s employment agreement means termination for any of the following reasons: (i) any act or omission constituting a material breach by him of any of his significant obligations under the agreement or his continued failure or refusal to adequately perform the duties reasonably required of him which is materially injurious to us and his failure to correct such breach, failure or refusal within thirty (30) days of notice to him thereof by our board of directors; (ii) the conviction for a felony or the conviction for or finding by civil verdict of the commission by him of a dishonest act or common law fraud against us; or (iii) any other willful act or omission which is materially injurious to the financial condition or business reputation of, or is otherwise materially injurious to, us and his failure to correct such act or omission after notification by our board of directors of any such act or omission.
Termination by Mr. McElya for “Good Reason” under his employment agreement means termination following the occurrence of any of the following, without Mr. McElya’s express, prior written consent: (i) a material breach by us of our obligations under the agreement relating to Mr. McElya’s duties, compensation and benefits, including but not limited to, the assignment to him of any duties materially inconsistent with his status as Chief Executive Officer, or his removal from such position, or a substantial adverse alteration in the nature of his responsibilities except, in each case, in connection with a promotion, and the failure by us to remedy such breach within thirty (30) days after receipt of written notice of such breach from Mr. McElya; (ii) the relocation of Mr. McElya’s work location 150 miles or more from its current location, except for relocation to our headquarters and required travel on the Company’s business to an extent reasonably required to perform his duties; (iii) except as required by law, the failure by us to provide Mr. McElya with benefit plans that provide
122
Table of Contents
health, life, disability, retirement and fringe benefits that are substantially comparable in the aggregate to the level of such benefits provided him by Cooper Tire immediately prior to the 2004 acquisition other than in connection with a reduction in such level of benefits that applies to our other senior executives; (iv) the failure by us to obtain a satisfactory agreement from any successor to assume and agree to perform our obligations under the employment agreement and provide Mr. McElya with the same or a comparable position, duties, benefits, and base salary and incentive compensation as provided in the employment agreement; or (v) the failure of our board of directors to elect Mr. McElya to his existing position or an equivalent position.
If Mr. McElya terminates employment as a result of death or disability, then we will pay or provide to Mr. McElya or Mr. McElya’s beneficiaries, estate or family, as applicable, the amounts and considerations Mr. McElya would have been entitled to as if Mr. McElya’s employment had been terminated by Mr. McElya for Good Reason or by us without Cause immediately prior to the expiration of the current term of employment.
If Mr. McElya is terminated by us for Cause, Mr. McElya will be entitled to base pay and vested benefits under any plan in accordance with that plan and a pro rata portion of any incentive compensation for the year in which the termination occurs up to the date of termination.
If Mr. McElya voluntarily elects to retire and agrees to act as our non-executive Chairman of our board of directors for a mutually agreed upon term, then Mr. McElya will be entitled to the amounts and considerations Mr. McElya would have been entitled to if Mr. McElya’s employment had been terminated by Mr. McElya for Good Reason or by us without Cause immediately prior to the expiration of the current term of employment.
If we elect not to extend Mr. McElya’s employment agreement upon expiration of the current term, then Mr. McElya will be treated as if he terminated employment for good reason or we terminated without cause and entitled to the severance pay and other benefits described above, except that such pay and benefits will not be paid until his actual termination of employment which shall be deemed effective December 31 of the year in which we provided notice of its election.
The agreement also provides that if any payment or the amount of benefits due under the agreement or otherwise would be considered an excess parachute payment that subjects Mr. McElya to excise tax under Internal Revenue Code Section 4999, then we will make an additional “gross-up” payment to Mr. McElya to reimburse him for such taxes (and any taxes due on the gross-up payment).
In exchange for the benefits provided under the agreement, Mr. McElya agrees not to compete with us for a two-year period after his termination of employment, not to solicit or interfere with any of our employees or customer, and not to disclose confidential and proprietary information. Mr. McElya is also required to execute a release of all claims against us as a condition to receiving the severance payment and benefits, if applicable.
Employment agreements of other named executive officers. We have in effect employment agreements with the other Named Executive Officers, which are substantially similar to Mr. McElya’s employment agreement except as described below. The other Named Executive Officers’ employment agreements have an initial term ending December 31, 2009 (July 1, 2011 for Mr. Hasler) and continue for one year periods thereafter, unless we or Named Executive Officer provides a notice of termination at least 60 days prior to the end of any term. Under the agreements, each Named Executive Officer is paid an annual base salary, currently as follows: $750,000 for Mr. Hasler; $440,000 for Mr. Campbell; $425,000 for Mr. Stephenson; and $385,000 for Mr. Verwilst. Mr. Beard’s employment with us terminated on March 31, 2009. The agreements provide that the compensation committee may increase the base salary from time to time, based upon the recommendation of the Chief Executive Officer. The agreements also provide that the Named Executive Officers are entitled to participate in such annual and long-term incentive compensation programs and benefit plans and programs as are generally provided to senior executives. In January of 2009, the Named Executive Officers consented to a 10% reduction in their base salaries for a six month period, subject to extension, and waived their eligibility under the annual bonus plan to bonuses with respect to the first half of 2009. In addition, the Named Executive Officers consented to the freezing of certain retirement and savings plan benefits.
123
Table of Contents
If a Named Executive Officer terminates employment for “Good Reason” or we terminate the employment of the Named Executive Officer without “Cause”, as those terms are defined in the agreement and described below, and in each case prior to a change of control of the Company, then we will pay or provide to the Named Executive Officer: (i) his accrued but unpaid salary, annual and long-term incentive compensation amounts; (ii) a pro rata payment of any annual incentive compensation amounts for which the performance period has not ended; (iii) a lump sum payment equal to two times the executive’s current annual base salary plus his annual target bonus amount (for the year preceding the year of his termination); (iv) a lump sum payment equal to the value of two additional years of service credit under our qualified and nonqualified defined benefit pension plans, assuming the executive’s compensation under such plans for such period was the same as the compensation paid to him during the year preceding his termination of employment (though additional years of service credit are not provided in relation to the qualified plan for this purpose beyond January 31, 2009 when we froze the qualified plan); and (v) two years of continued coverage under the life and health plans sponsored by us at the same cost to the executive as is being charged to active employees.
Termination for “Cause” under the employment agreements of these executives means termination for any of the following reasons: (i) the executive’s willful failure to perform duties or directives which is not cured following written notice; (ii) the executive’s commission of a felony or crime involving moral turpitude; (iii) the executive’s willful malfeasance or misconduct which is demonstrably injurious to us; or (iv) material breach by the executive of the non-competition, non-solicitation or confidentiality provisions of the agreement.
Termination by any of these executives for “Good Reason” shall mean termination following any of the following: (i) a substantial diminution in the executive’s position or duties, adverse change in reporting lines, or assignment of duties materially inconsistent with the executive’s position; (ii) any reduction in the executive’s base salary or annual bonus opportunity; (iii) any reduction in the executive’s long-term cash incentive compensation opportunities, other than reductions generally affecting other senior executives participating in the applicable long-term incentive compensation programs or arrangements; (iv) our failure to pay the executive any compensation or benefits when due; (v) relocation of the executive’s principal place of work in excess of 50 miles from the executive’s current principal place of work; or (vi) any material breach by us of the terms of the Agreement; in each case if we fail to cure such event within 10 calendar days after receipt from the executive of written notice of the event which constitutes Good Reason.
If the Named Executive Officer’s employment terminates due to disability or death, then we shall make a pro rata payment of the target amounts payable under any annual and long-term incentive compensation awards then in effect. In the event of any other termination of employment, no amounts are payable under the agreement.
If we elect not to extend the Named Executive Officer’s employment agreement for any year after expiration of the initial term, then the Named Executive Officer will be treated as if he were terminated by us without Cause and entitled to the severance pay and other benefits described above, except that such pay and benefits will not be paid until his actual termination of employment and if his actual termination occurs between ages 64 and 65, his severance multiplier (if higher than one) is reduced to one, and if after age 65, the executive will not be entitled to any severance payment or other benefits under the agreement.
In exchange for the benefits provided under the agreement, the Named Executive Officers agree not to compete with us or solicit or interfere with any of our employees or customer for a two-year period after his termination of employment, and not to disclose confidential and proprietary information. Each Named Executive Officer is also required to execute a release of all claims against us as a condition to receiving the severance payment and benefits, if applicable.
Change of control severance plan. If the Named Executive Officers are terminated following a change of control of the Company, then in lieu of the severance payments and benefits described above, the executives are entitled to the severance pay and benefits provided under our Change of Control Severance Pay Plan. Under the plan, if within two years following a “Change of Control” of the Company as defined in the plan and described below, a
124
Table of Contents
Named Executive Officer is terminated by us (or the successor in the change of control transaction) without “Cause” as defined in the plan and described below, or terminates his employment for certain reasons, then we (or the successor) will pay or provide to the Named Executive Officer: (i) an amount equal to one year of his annual base salary; (ii) a pro rata payment of any annual and long-term incentive compensation amounts for which the performance periods have not ended; (iii) a lump sum payment equal to three (for Mr. McElya) and two (for all other Named Executive Officers) times his current annual base salary plus his annual target bonus amount (for the year preceding the year of the change of control); (iv) a lump sum payment equal to the value of three (for Mr. McElya) and two (for all other Named Executive Officers) additional years of service credit under our qualified and nonqualified defined benefit pension plans, assuming the executive’s compensation under such plans for respective period was the highest compensation paid to the executive during any of the five years preceding the year in which his termination of employment occurs (though additional years of service credit are not provided in relation to the qualified plan for this purpose beyond January 31, 2009 when we froze the qualified plan); (v) three years (for Mr. McElya) and two years (for all other Named Executive Officers) of continued coverage under the life and health plans sponsored by us and in which the executive was covered immediately prior to his termination; (vi) medical and life insurance coverage for the Named Executive Officer and his spouse for their lifetimes, and for his dependent children until they cease to qualify as dependents, at the same cost as was being charged to the Named Executive Officer immediately prior to the change of control; and (vii) outplacement services for up to two calendar years following the year of termination, not to exceed a cost equal to the lesser of 15% of the Executive’s annual base pay or $50,000. If, during the first 36 months (for Mr. McElya) or 24 months (for all other Named Executive Officers) of life and medical benefit continuation, we are unable to provide what are otherwise intended to be non-taxable benefits to the Named Executive Officer and his covered family members on a tax-free basis, then we will make an additional payment to the Named Executive Officer to reimburse him for the taxes due on such benefits. In addition, under the Supplementary Benefit Plan (as described in the Executive Compensation Components section), participants receive a lump sum payout of the present value of their accrued benefits under this plan within 60 days after a termination of employment as described in this paragraph.
A “Change of Control” under the plan means the occurrence of any of the following events: (i) the sale or disposition, in one or a series of related transactions, of all or substantially all of the assets of the Company to any “person” or “group” (as such terms are defined in Sections 13(d)(3) and 14(d)(2) of the Securities Exchange Act of 1934, or the Exchange Act) other than certain permitted entities affiliated with us or our pre-reorganization affiliate shareholders or (ii) any person or group, other than such permitted entities, becomes the “beneficial owner” (as defined in Rules 13d-3 and l3d-5 under the Exchange Act), directly or indirectly, of greater than or equal to 50% of the total voting power of the voting stock of the Company, including by way of merger, consolidation or otherwise, except where one or more of our pre-reorganization affiliate shareholders and/or their respective affiliates, immediately following such merger, consolidation or other transaction, continue to have the ability to designate or elect a majority of the board of directors of the Company (or the board of directors of the resulting entity or its parent company). A transaction or series of transactions that would otherwise not constitute a Change of Control is treated as a Change of Control for purposes of the Named Executive Officer’s entitlements under the plan if clause (i), above, is satisfied in respect of the business or division in which such executive is principally engaged.
Termination for “Cause” under the plan has the same meaning as termination for Cause under Mr. McElya’s employment agreement, described above. The circumstances that constitute reasons under the plan for which a Named Executive Officer may terminate his employment and be entitled to severance benefits as if he was terminated without Cause are as follows: (i) for Messrs. McElya, Hasler, Campbell, Stephenson, and Verwilst, a significant adverse change in the nature or scope of the authorities, powers, functions, responsibilities or duties attached to the position held by the executive immediately prior to the Change in Control, (ii) a reduction in the executive’s base salary or opportunities for incentive compensation under applicable our plans and programs, (iii) the termination or denial of the executive’s rights to employee benefits or a reduction in the scope or aggregate value thereof, (iv) any material breach of its obligations under the plan by us or any successor or (v) a requirement by the us that the executive move his principal work location more than 50 miles; in each case other
125
Table of Contents
than (v) unless remedied by us within ten calendar days following notice from the executive of such circumstances. Under the plan, Mr. McElya may voluntarily terminate his employment for any reason or without reason during the thirty-day period immediately following the date that is six months after a Change of Control has occurred (other than a Change of Control related to an initial public offering) and receive the severance benefits applicable to termination without Cause.
The plan also provides that if any payment or the amount of benefits due under the plan or otherwise would be considered an excess parachute payment that subjects the Named Executive Officer to excise tax under Internal Revenue Code Section 4999, then we will make an additional “gross-up” payment to the Named Executive Officer to reimburse him for such taxes (and any taxes due on the gross-up payment).
Finally, the plan provides that if the payment of any money or other benefit due under the plan could cause the application of an accelerated or additional tax to a Named Executive Officer under Internal Revenue Code Section 409A, such payment or benefit will be deferred or otherwise restructured to avoid such acceleration or additional tax.
If a Named Executive Officer’s employment is terminated for any other reason, then no amounts are payable under the plan.
In exchange for the benefits provided under the plan, each Named Executive Officer agrees not to compete with us and not to solicit or interfere with any of our employees or customers for a two-year period (for all Named Executive Officers) after his termination of employment, and agrees not to disclose confidential and proprietary information. Each Named Executive Officer is also required to execute a release of all claims against us as a condition to receiving the severance payment and benefits.
Director compensation
The following table sets forth information regarding the compensation received by each of our non-employee directors during the year ended December 31, 2009.
| Name (a) |
Fees Earned or Paid in Cash (b) |
Stock Awards (c)(6) |
Option Awards (d) |
All Other Compensation (g) |
Total (h) |
|||||||||||||||
| Gerald J. Cardinale |
$ | — | (1) | — | — | — | $ | — | ||||||||||||
| Gary L. Convis |
$ | 66,125 | (2) | — | — | — | $ | 66,125 | ||||||||||||
| Jack Daly |
$ | — | (1) | — | — | — | — | |||||||||||||
| S. A. Johnson |
$ | 127,625 | (3) | — | — | — | $ | 127,625 | ||||||||||||
| Leo F. Mullin |
$ | — | (1) | — | — | — | — | |||||||||||||
| James A. Stern |
$ | — | (1) | — | — | — | — | |||||||||||||
| Steven A. Van Oss |
$ | 76,125 | (4) | — | — | — | $ | 76,125 | ||||||||||||
| Kenneth L. Way |
$ | 77,625 | (5) | — | — | — | $ | 77,625 | ||||||||||||
| (1) | As officers or nominees of our pre-reorganization affiliate shareholders, Messrs. Cardinale, Daly, Mullin and Stern were not entitled to compensation for serving as a director or member of any committee of our board of directors. |
| (2) | Represents $60,125 ($65,000 minus 10% pay reduction for the first three quarters) for Mr. Convis’ annual outside director fee and $6,000 for attendance at meetings of our board of directors in 2009. |
| (3) | Represents $60,125 ($65,000 minus 10% pay reduction for the first three quarters) for Mr. Johnson’s annual outside director fee, $60,000 as a transitional fee paid to Mr. Johnson, who served prior to 2009 as the Company’s Lead Director, and $7,500 for attendance at meetings of our board of directors in 2009. |
| (4) | Represents $60,125 ($65,000 minus 10% pay reduction for the first three quarters) for Mr. Van Oss’ annual outside director fee, $10,000 for his service as Chairman of the audit committee, and $6,000 for attendance at meetings of our board of directors in 2009. |
126
Table of Contents
| (5) | Represents $60,125 ($65,000 minus 10% pay reduction for the first three quarters) for Mr. Way’s annual outside director fee, $10,000 for his service as Chairman of the compensation committee, and $ 7,500 for attendance at meetings of our board of directors in 2009. |
| (6) | The amount shown in column (c) represents the grant date fair value associated with Company matching stock units allocated under the Management Stock Purchase Plan as determined pursuant to ASC Topic 718. Because the Company was cancelled upon emergence from chapter 11 under our plan of reorganization, the value of the Company common stock as of December 31, 2009 is deemed to be zero. |
Summary of director compensation for 2009
None of our directors who were officers or nominees of our pre-reorganization affiliate shareholders received any compensation for serving as a director or as a member or chair of a committee of our board of directors during 2009. Members of our board of directors who were not employees of the Company or officers, nominees or employees of our pre-reorganization affiliate shareholders were compensated with an outside director fee in the amount of $65,000 per year (which was reduced by 10% for the first three quarters of 2009) and, if they served as chair of a committee of our board of directors, an additional fee of $10,000 per year. Our directors who were not employees of the Company or officers, nominees or employees of our pre-reorganization affiliate shareholders also received $1,500 per meeting of the our board of directors that such members attended, and were eligible to receive grants of non-qualified and incentive stock options and other stock-based awards under our Stock Incentive Plan.
Director compensation following emergence from bankruptcy
On the day after emergence from bankruptcy, stock options and restricted stock awards were granted to the following non-employee directors in accordance with form of award agreements adopted by our board of directors: Orlando Bustos, Larry Jutte, David Mastrocola, Stephen A. Van Oss and Kenneth L. Way. Each director was granted 4,408 shares of restricted common stock and 9,731 options to purchase common stock (with an exercise price per share equal to the plan of reorganization value of $25.52).
The time-based stock options and time-based restricted stock generally vest in installments equal to 50% on the first anniversary of the date of grant, and 25% on each of the second and third anniversaries of the date of grant, while the directors remain in service with the Company. The equity awards vest 100% in the event of a Change of Control. Upon termination of service due to the director’s death, Disability or as the result of an involuntary removal by action of the stockholders, the awards vest on a pro-rata basis based on the following fraction, the numerator of which is the days served as a director from the later of the date of grant or the most recent anniversary of the date of grant through the termination date and the denominator of which is 365, multiplied by: 1) 50%, if such termination occurs prior to the first anniversary of the date of grant, or 2) 25%, if such termination occurs between the first and third anniversaries of the date of grant, provided that, where applicable, upon a termination due to a Termination Event of the Stockholder (as such terms are defined in the director nomination agreement pursuant to which such director was nominated), the equity would vest with respect to 50% of the award if such termination occurs prior to the first anniversary and with respect to 25% of the award granted thereunder if such termination occurs between the first and third anniversaries.
Effective as of May 28, 2010, our board of directors also approved the following compensation to be paid to the non-employee directors: an annual cash retainer of $75,000 per year, to be paid quarterly, a committee chair fee of $10,000 per year, paid quarterly, for service as chair of a standing committee of our board of directors, reimbursement of travel, accommodation and other expenses for meeting fees and expenses (with no per-meeting fees for attendance), and the equity awards described above. In addition, our bylaws provide for broad indemnification of directors.
Additionally, pursuant to its nomination agreement, Oak Hill Advisors, L.P. or its affiliates will be receiving the compensation described above (including the equity grants pursuant to substantially similar terms and substantially similar award agreements) in lieu of Glenn R. August.
127
Table of Contents
The following table indicates information to our knowledge, as of October 29, 2010, regarding the beneficial ownership of our common stock by:
| • | each of our directors; |
| • | each of our named executive officers; |
| • | each stockholder known by us to beneficially hold five percent or more of our common stock; and |
| • | all of our executive officers and directors as a group. |
Beneficial ownership is determined under the rules of the SEC and generally includes voting or investment power with respect to securities. Unless indicated below, to our knowledge, the persons and entities named in the table have sole voting and investment power with respect to all shares beneficially owned, subject to community property laws where applicable. Shares of common stock subject to options, warrants or shares of 7% preferred stock that are currently exercisable or convertible, or exercisable or convertible within 60 days of October 29, 2010, are deemed to be outstanding and to be beneficially owned by the person holding such options, warrants or shares of our 7% preferred stock for the purpose of computing the percentage ownership of that person but are not treated as outstanding for the purpose of computing the percentage ownership of any other person.
All percentages and share amounts are approximate based on current information available to us. The information available to us may be incomplete.
Unless otherwise noted, the address for each person listed on the table is c/o Cooper-Standard Holdings Inc., 39550 Orchard Hill Place Drive, Novi, Michigan 48375.
| Name and Address of Beneficial Owner |
Amount and Nature of Beneficial Ownership |
Percent of All Common Stock |
||||||
| Significant Owners: |
||||||||
| Silver Point Capital L.P.(1) |
4,575,630 | 22.9 | % | |||||
| Oak Hill Advisors, L.P.(2) |
4,298,303 | 21.6 | % | |||||
| Capital Research and Management Company(4) |
2,823,856 | 14.7 | % | |||||
| Lord, Abbett & Co. LLC(5) |
1,768,836 | 9.5 | % | |||||
| Barclays Bank PLC(3) |
1,587,480 | 8.1 | % | |||||
| SOF Investments, L.P.(6) |
1,108,724 | 6.0 | % | |||||
| TCW Asset Management Company(7) |
1,010,876 | 5.4 | % | |||||
| Directors and named executive officers: |
||||||||
| James S. McElya(8) |
523,370 | 2.8 | % | |||||
| Edward A. Hasler(9) |
85,988 | * | ||||||
| Allen J. Campbell(10) |
76,040 | * | ||||||
| Keith D. Stephenson(11) |
76,040 | * | ||||||
| Michael C. Verwilst(12) |
47,850 | * | ||||||
| Glenn R. August(2) |
— | — | ||||||
| Orlando A. Bustos(13) |
12,408 | * | ||||||
| Larry Jutte(14) |
4,408 | * | ||||||
| David J. Mastrocola(14) |
4,408 | * | ||||||
| Stephen A. Van Oss(14) |
4,408 | * | ||||||
| Kenneth L. Way(14) |
4,408 | * | ||||||
| Directors and executive officers as a group (14 persons) |
973,376 | 5.3 | % | |||||
| * | Less than 1% of issued and outstanding shares of common stock. |
| (1) | Includes: (i) 872,963 shares of common stock held by Silver Point Capital Fund, L.P. (“SPCF”); (ii) 318,634 shares of common stock issuable upon conversion of preferred stock held by SPCF; (iii) 159,016 shares of common stock issuable |
128
Table of Contents
| upon exercise of warrants held by SPCF; (iv) 2,106,175 shares of common stock held by Silver Point Capital Offshore Master Fund, L.P. (“SPCOMF”); (v) 743,474 shares of common stock issuable upon conversion of preferred stock held by SPCOMF; (vi) 375,369 shares of common stock issuable upon exercise of warrants held by SPCOMF; (vii) 50,000 shares of common stock held by Mulé Associates, LLC (“Mulé”); and (viii) 50,000 shares of common stock issuable upon exercise of warrants held by Mulé. Edward A. Mulé, co-founder and partner of Silver Point Capital, L.P., has sole voting and investment power over the securities held by Mulé Associates, LLC. Silver Point Capital, L.P. shares voting and investment power with Mulé, SPCF and SPCOMF. The address for Silver Point Capital L.P. is Two Greenwich Plaza, 1st Floor, Greenwich, CT 06830. |
| (2) | Includes: (i) 40,069 shares of common stock held by Future Fund Board of Guardians (“Future Fund”); (ii) 66,773 shares of common stock issuable upon conversion of preferred stock held by Future Fund; (iii) 24,498 shares of common stock issuable upon exercise of warrants held by Future Fund; (iv) 34,293 shares of common stock held by Lerner Enterprises, LLC (“Lerner”); (v) 16,640 shares of common stock issuable upon conversion of preferred stock held by Lerner; (vi) 7,263 shares of common stock issuable upon exercise of warrants held by Future Fund; (vii) 574,304 shares of common stock held by Oak Hill Credit Alpha Master Fund, L.P. (“OH-I”); (viii) 28,913 shares of common stock issuable upon exercise of warrants held by OH-I; (ix) 476,630 shares of common stock held by Oak Hill Credit Opportunities Financing, Ltd. (“OH-II”); (x) 240,855 shares of common stock issuable upon conversion of preferred stock held by OH-II; (xi) 99,604 shares of common stock issuable upon exercise of warrants held by OH-II; (xii) 188,568 shares of common stock held by OHA Strategic Credit Fund, L.P. (“OH-III”); (xiii) 8,191 shares of common stock issuable upon exercise of warrants held by OH-III; (xiv) 48,795 shares of common stock held by OHA Strategic Credit Master Fund II, L.P. (“OH-IV”); (xv) 81,315 shares of common stock issuable upon conversion of preferred stock held by OH-IV; (xvi) 29,834 shares of common stock issuable upon exercise of warrants held by OH-IV; (xvii) 174,989 shares of common stock held by OHA Strategic Credit Master Fund, L.P. (“OH-V”); (xviii) 288,551 shares of common stock issuable upon conversion of preferred stock held by OH-V; (xix) 102,392 shares of common stock issuable upon exercise of warrants held by OH-V; (xx) 801,128 shares of common stock held by OHA Strategic Credit Master Fund (Parallel II), L.P. (“OH-VI”); (xxi) 35,866 shares of common stock issuable upon exercise of warrants held by OH-VI; (xxii) 75,065 shares of common stock held by OHA Strategic Credit Master Fund (Parallel I), L.P. (“OH-VII”); (xxiii) 3,252 shares of common stock issuable upon exercise of warrants held by OH-VII; (xxiv) 23,538 shares of common stock held by OHSF Financing, Ltd. (“OH-VIII”); (xxv) 1,130 shares of common stock issuable upon exercise of warrants held by OH-VIII; (xxvi) 285,486 shares of common stock held by OHSF II Financing, Ltd. (“OH-IX”); (xxvii) 375,208 shares of common stock issuable upon conversion of preferred stock held by OH-IX; (xxviii) 138,153 shares of common stock issuable upon exercise of warrants held by OH-IX. Oak Hill Advisors, L.P. (“OHA”) is the investment advisor to Future Fund, Lerner, OH-I, OH-II, OH-III, OH-IV, OH-V, OH-VI, OH-VII, OH-VIII, and OH-IX, and certain of its affiliates and principals, either directly or indirectly, exercise voting and dispositive power over the securities owned by them. OHA and its affiliates and principals disclaim beneficial ownership of such securities, except to the extent of their direct pecuniary interest therein. Mr. August is President and Senior Partner for Oak Hill Advisors, L.P. and may be deemed to have beneficial ownership of the foregoing securities. Mr. August disclaims beneficial ownership of the foregoing securities except to the extent of his pecuniary interest in such securities. The address for Oak Hill Advisors, L.P. is 1114 Avenue of the Americas, 27th Floor, New York, NY 10036. |
| (3) | Includes: (i) 192,642 shares of common stock held by Barclays Bank PLC; (ii) 867,023 shares of common stock issuable upon conversion of preferred stock held by Barclays Bank PLC; (iii) 16,216 shares of common stock issuable upon exercise of warrants held by Barclays Bank PLC; (iv) 83,205 shares of common stock held by Barclays Capital Inc.; and (v) 428,395 shares of common stock issuable upon exercise of warrants held by Barclays Capital Inc. Barclays Capital Inc. is an indirectly, wholly-owned subsidiary of Barclays Bank PLC. The address for Barclays Bank PLC is 745 Seventh Avenue, New York, NY 10019. |
| (4) | Includes: (i) 123,234 shares of common stock held by American Funds Insurance Series, Asset Allocation Fund (“AFIS AAF”); (ii) 85,545 shares of common stock issuable upon conversion of preferred stock held by AFIS AAF; (iii) 38,220 shares of common stock issuable upon exercise of warrants held by AFIS AAF; (iv) 4,134 shares of common stock held by American Funds Insurance Series, Global Bond Fund (“AFIS GBF”); (v) 289 shares of common stock issuable upon exercise of warrants held by AFIS GBF; (vi) 62,139 shares of common stock held by American Funds Insurance Series, High Income Bond Fund (“AFIS HIBF”); (vii) 21,385 shares of common stock issuable upon conversion of preferred stock held by AFIS HIBF; (viii) 11,422 shares of common stock issuable upon exercise of warrants held by AFIS HIBF; (ix) 1,139,235 shares of common stock held by American High Income Trust (“AHIT”); (x) 427,736 shares of common stock issuable upon conversion of preferred stock held by AHIT; (xi) 190,869 shares of common stock issuable upon exercise of warrants held by AHIT; (xii) 40,522 shares of common stock held by Capital World Bond Fund, Inc. (“CapWorld”); (xiii) 2,837 shares of common stock issuable upon exercise of warrants held by CapWorld; (xi) 85,450 shares of common stock held by The Bond Fund of America, Inc. (“BFA”); (xiv) 5,096 shares of common stock issuable upon exercise of warrants held by BFA; and (xv) 586,012 shares of common stock held by The Income Fund of America, Inc. (“IFA”). Capital Research and Management Company, as investment adviser, has sole voting and investment power over the securities owned by AFIS AAF, AFIS GBF, AFIS HIBF, AHIT, CapWorld, BFA and IFA. The address for Capital Research and Management Company is 630 Fifth Avenue, New York, NY 10111. |
129
Table of Contents
| (5) | Includes: (i) 56,469 shares of common stock held by Advanced Series Trust—AST Lord Abbett Bond Debenture Portfolio (“AST”); (ii) 7,140 shares of common stock issuable upon conversion of preferred stock held by AST; (iii) 6,262 shares of common stock issuable upon exercise of warrants held by AST; (iv) 752,939 shares of common stock held by Lord Abbett Bond-Debenture Fund, Inc. (“LA-I”); (v) 95,135 shares of common stock issuable upon conversion of preferred stock held by LA-I; (vi) 83,503 shares of common stock issuable upon exercise of warrants held by LA-I; (vii) 112,940 shares of common stock held by Lord Abbett Investment Trust—Lord Abbett High Yield Fund (“LA-II”); (viii) 14,275 shares of common stock issuable upon conversion of preferred stock held by LA-II; (ix) 12,524 shares of common stock issuable upon exercise of warrants held by LA-II; (x) 131,763 shares of common stock held by Lord Abbett Research Fund, Inc.—Lord Abbett Capital Structure Fund (“LA-III”); (xi) 16,648 shares of common stock issuable upon conversion of preferred stock held by LA-III; (xii) 14,613 shares of common stock issuable upon exercise of warrants held by LA-III; (xiii) 22,587 shares of common stock held by Lord Abbett Series Fund, Inc.—Bond Debenture Portfolio (“LA-IV”); (xiv) 2,853 shares of common stock issuable upon conversion of preferred stock held by LA-IV; (xv) 2,504 shares of common stock issuable upon exercise of warrants held by LA-IV; (xvi) 3,764 shares of common stock held by Lord Abbett Series Fund, Inc.—Capital Structure Portfolio (“LA-V”); (xvii) 481 shares of common stock issuable upon conversion of preferred stock held by LA-V; (xviii) 417 shares of common stock issuable upon exercise of warrants held by LA-V; (xix) 188,233 shares of common stock held by MET Investors Series Trust—Lord Abbett Bond Debenture Portfolio (“LA-VI”); (xx) 23,784 shares of common stock issuable upon conversion of preferred stock held by LA-VI; (xxi) 20,875 shares of common stock issuable upon exercise of warrants held by LA-VI; (xxii) 50,823 shares of common stock held by MHAM US Income Open (“MHAM”); (xxiii) 6,423 shares of common stock issuable upon conversion of preferred stock held by MHAM; (xxiv) 5,636 shares of common stock issuable upon exercise of warrants held by MHAM; (xxv) 107,294 shares of common stock held by Mizuho US High Yield Open (“Mizuho”); (xxvi) 13,559 shares of common stock issuable upon conversion of preferred stock held by Mizuho; (xxvii) 11,899 shares of common stock issuable upon exercise of warrants held by Mizuho; (xxviii) 2,824 shares of common stock held by Pollux Holdings LP (“Pollux”); (xxix) 356 shares of common stock issuable upon conversion of preferred stock held by Pollux; and (xxx) 312 shares of common stock issuable upon exercise of warrants held by Pollux. Lord, Abbett & Co. LLC, as investment advisor, has sole voting and investment power over the securities owned by AST, LA-I, LA-II, LA-III, LA-IV, LA-V, LA-VI, MHAM, Mizuho and Pollux. The address for Lord, Abbett & Co. LLC is 90 Hudson Street, Jersey City, NJ 07302. |
| (6) | Includes 1,083,241 shares of common stock and 25,483 shares of common stock issuable upon exercise of warrants. MSD Capital, L.P. is the general partner of SOF Investments, L.P. and may be deemed to have or share voting and dispositive power over, and/or beneficially own, the common shares held by SOF Investments, L.P. MSD Capital Management LLC is the general partner of MSD Capital, L.P. and may be deemed to have or share voting and/or dispositive power over, and beneficially own, the common shares held by MSD Capital, L.P. Each of Glenn R. Fuhrman, John C. Phelan and Marc R. Lisker is a manager of MSD Capital Management LLC and may be deemed to have or share voting and/or dispositive power over, and beneficially own, the common shares owned by MSD Capital Management LLC. The address for SOF Investments, L.P. is c/o MSD Capital, L.P., 645 Fifth Ave., 21st Floor, NewYork, NY 10022. |
| (7) | Includes: (i) 151,007 shares of common stock held by TCW Shared Opportunity Fund IV, L.P. (“TCW-IV”); (ii) 38,115 shares of common stock issuable upon conversion of preferred stock held by TCW-IV; (iii) 23,892 shares of common stock issuable upon exercise of warrants held by TCW-IV; (iv) 31,046 shares of common stock held by TCW Shared Opportunity Fund IVB, L.P. (“TCW-IVB”); (v) 7,771 shares of common stock issuable upon conversion of preferred stock held by TCW-IVB; (vi) 4,888 shares of common stock issuable upon exercise of warrants held by TCW-IVB;(vii) 534,867 shares of common stock held by TCW Shared Opportunity Fund V, L.P. (“TCW-V”); (viii) 134,752 shares of common stock issuable upon conversion of preferred stock held by TCW-V; and (ix) 84,538 shares of common stock issuable upon exercise of warrants held by TCW-V. The investment adviser to TCW-IV, TCW-IVB and TCW-V is TCW Asset Management Company, an SEC-registered investment adviser, and, as such, has dispositive and voting power with respect to the shares held by the funds it advises. The address for TCW Asset Management Company is 11100 Santa Monica Boulevard, Suite 2000, Los Angeles, CA 90025. |
| (8) | Includes 430,015 shares of restricted common stock and 21,757 shares of restricted preferred stock that are convertible into 93,355 shares of common stock, which were granted in connection with our emergence from bankruptcy. |
| (9) | Includes 70,680 shares of restricted common stock and 3,570 shares of restricted preferred stock that are convertible into 15,318 shares of common stock, which were granted in connection with our emergence from bankruptcy. |
| (10) | Includes 62,417 shares of restricted common stock and 3,175 shares of restricted preferred stock that are convertible into 13,623 shares of common stock, which were granted in connection with our emergence from bankruptcy. |
| (11) | Includes 62,417 shares of restricted common stock and 3,175 shares of restricted preferred stock c that are convertible into 13,623 shares of common stock, which were granted in connection with our emergence from bankruptcy. |
| (12) | Includes 39,277 shares of restricted common stock and 1,998 shares of restricted preferred stock that are convertible into 8,573 shares of common stock. |
| (13) | Includes 8,000 shares of common stock purchased in the open market and 4,408 shares of restricted common stock, which were granted in connection with our emergence from bankruptcy. |
| (14) | Represents of 4,408 shares of restricted common stock granted to each of these directors in connection with our emergence from bankruptcy. |
130
Table of Contents
Pursuant to our plan of reorganization, we have filed with the SEC a registration statement on Form S-1 under the Securities Act, of which this prospectus forms a part, to register resales of securities that we issued in connection with our emergence from bankruptcy. The securities that we have registered for resale were issued to certain holders of our prepetition senior notes and prepetition senior subordinated notes to raise a portion of the funds we needed to emerge from bankruptcy on May 27, 2010. Up to 17,166,288 shares of our common stock, 1,010,345 shares of our 7% preferred stock and 1,693,827 of our warrants are being offered by this prospectus, all of which are being registered for sale for the accounts of the selling security holders. The selling security holders acquired the shares of our common stock and 7% preferred stock and warrants (x) on May 27, 2010 pursuant to our rights offering and the commitment agreement backstopping our rights offering, in each case, in accordance with our plan of reorganization in transactions exempt from the registration requirements of the Securities Act or (y) in a subsequent private transfer from a person that received securities pursuant to clause (x) or such person’s transferee.
The securities are being registered to permit public sales of the securities, and the selling security holders may offer the securities for resale from time to time pursuant to this prospectus. However, the selling security holders are under no obligation to sell any of the securities offered pursuant to this prospectus. The selling security holders may also sell, transfer or otherwise dispose of all or a portion of their securities in transactions exempt from the registration requirements of the Securities Act or pursuant to another effective registration statement covering those securities. We may from time to time include additional selling security holders in amendments to this prospectus.
All information with respect to security ownership has been furnished by or on behalf of the selling security holders and is as of October 29, 2010. We believe, based on information supplied by the selling security holders and subject to community property laws where applicable, that except as may otherwise be indicated in the footnotes to the table below, each selling security holder has sole voting and dispositive power with respect to the securities reported as beneficially owned by it. Because the selling security holders may sell all, part or none of the securities held by them, no estimates can be given as to the number of securities that will be held by each selling security holder upon termination of any offering made hereby. In addition, the selling security holders may have sold, transferred or otherwise disposed of, or may sell, transfer or otherwise dispose of, at any time and from time to time, the securities held by them in transactions exempt from the registration requirements of the Securities Act after the date on which it provided the information set forth on the table below. For purposes of the table below, however, we have assumed that after termination of this offering, none of the securities offered by this prospectus will be held by the selling security holders.
The following table sets forth the names of the selling security holders, the number of shares of common stock, shares of 7% preferred stock and warrants beneficially owned by them as of October 29, 2010, the number of shares of common stock, shares of our 7% preferred stock and warrants being offered by them, the number of shares of common stock, shares of our 7% preferred stock and warrants each selling security holder will beneficially own if the security holder sells all of the securities being registered and each selling security holder’s percentage ownership of our total outstanding common stock if all the securities in the offering are sold. As used in this prospectus, “selling security holders” includes the successors-in-interest, donees, transferees or others who may later hold the selling security holders’ interests.
Except as provided in the footnotes to the following table, none of the selling security holders has had any position with, held any office of or had any other material relationship with us or our affiliates during the past three years.
The percentage of our outstanding common stock beneficially owned by the selling security holders after the offering is determined under the rules of the SEC and generally includes voting or investment power with respect to securities. Shares of our common stock that may be issued upon the conversion of our outstanding 7% preferred stock or upon the exercise of our outstanding warrants and options, in each case within 60 days of October 29, 2010, are deemed to be outstanding and to be beneficially owned by the person holding such securities for the purpose of computing the percentage ownership of that person but are not treated as outstanding for the purpose of computing the percentage ownership of any other person.
131
Table of Contents
| Name of Selling Security Holder |
Number of Shares of Common Stock Owned Prior to Offering(1) |
Number of Shares of 7% Preferred Stock Owned Prior to Offering |
Number of Warrants Owned Prior to Offering |
Maximum Number of Shares of Common Stock to be Sold Pursuant to this Prospectus(2) |
Maximum Number of Shares of 7% Preferred Stock to be Sold Pursuant to this Prospectus |
Maximum Number of Warrants to be Sold Pursuant to this Prospectus |
Shares of Common Stock Owned After Offering(3) |
Shares of 7% Preferred Stock Owned After Offering(3) |
Warrants Owned After Offering(3) |
|||||||||||||||||||||||||||||||||||||||
| Number(4) | Percent of Class |
Number | Percent of Class |
Number | Percent of Class |
|||||||||||||||||||||||||||||||||||||||||||
| 1798 Fundamental Strategies Master Fund Ltd.(5) |
254,474 | 42,940 | 8,542 | 387,584 | 42,940 | — | 47,721 | * | — | — | 8,542 | * | ||||||||||||||||||||||||||||||||||||
| 1798 US Special Situations Master Fund(5) |
19,186 | 7,578 | — | 51,696 | 7,578 | — | — | — | — | — | — | — | ||||||||||||||||||||||||||||||||||||
| Advanced Series Trust - AST Lord Abbett Bond Debenture Portfolio(6) |
56,469 | 1,664 | 6,262 | 58,058 | 1,664 | 2,788 | 11,813 | * | — | — | 3,474 | * | ||||||||||||||||||||||||||||||||||||
| Advent Global Opportunity Master Fund(7) |
26,614 | — | — | 24,548 | — | — | 2,066 | * | — | — | — | — | ||||||||||||||||||||||||||||||||||||
| Alden Global Distressed Opportunities Fund LP(8) |
317,689 | — | — | 317,689 | — | — | — | — | — | — | — | — | ||||||||||||||||||||||||||||||||||||
| Alden Global Value Recovery Master Fund(8) |
320,000 | — | — | 320,000 | — | — | — | — | — | — | — | — | ||||||||||||||||||||||||||||||||||||
| American Funds Insurance Series, Asset Allocation Fund(9) |
123,234 | 19,937 | 38,220 | 221,049 | 19,937 | 33,877 | 25,950 | * | — | — | 4,343 | * | ||||||||||||||||||||||||||||||||||||
| American Funds Insurance Series, Global Bond Fund(9) |
4,134 | — | 289 | 3,440 | — | — | 983 | * | — | — | 289 | * | ||||||||||||||||||||||||||||||||||||
| American Funds Insurance Series, High Income Bond Fund(9) |
62,139 | 4,984 | 11,422 | 77,449 | 4,984 | 8,469 | 17,497 | * | — | — | 2,953 | * | ||||||||||||||||||||||||||||||||||||
| American High Income Trust(9) |
1,139,235 | 99,687 | 190,869 | 1,102,501 | 99,687 | 169,382 | 655,339 | 3.6 | % | — | — | 21,487 | * | |||||||||||||||||||||||||||||||||||
| APG Fixed Income Credits Pool(10) |
174,199 | — | 11,583 | 146,400 | — | — | 39,382 | * | — | — | 11,583 | * | ||||||||||||||||||||||||||||||||||||
| Armory Master Fund, Ltd.(11) |
134,847 | — | 6,065 | 117,120 | — | — | 23,792 | * | — | — | 6,065 | * | ||||||||||||||||||||||||||||||||||||
| AST Capital Trust Co. Collective Investment Trust—DCM High Yield Bond Fund(12) |
1,044 | — | 69 | 878 | — | — | 235 | * | — | — | 69 | * | ||||||||||||||||||||||||||||||||||||
| Aviary Associates LP(13) |
49,619 | — | 3,474 | 41,280 | — | — | 11,813 | * | — | — | 3,474 | * | ||||||||||||||||||||||||||||||||||||
| Backspin Limited Partnership(14) |
17,976 | — | 1,195 | 15,108 | — | — | 4,063 | * | — | — | 1,195 | * | ||||||||||||||||||||||||||||||||||||
| Barclays Bank PLC(15) |
192,642 | 202,066 | 16,216 | 208,858 | 202,066 | — | 16,216 | * | — | — | 16,216 | * | ||||||||||||||||||||||||||||||||||||
| Barclays Capital Inc.(15) |
83,205 | — | 428,395 | 444,661 | — | — | 66,939 | * | — | — | 66,939 | 2.77 | % | |||||||||||||||||||||||||||||||||||
| Brandy Trust Multi Strategy NGA LLC(16) |
32,749 | — | 2,294 | 27,245 | — | — | 7,798 | * | — | — | 2,294 | * | ||||||||||||||||||||||||||||||||||||
| Brownstone Investment Group LLC(17) |
54,494 | — | 3,808 | 45,354 | — | — | 13,248 | * | — | — | 3,808 | * | ||||||||||||||||||||||||||||||||||||
| BTIG LLC(18) |
6,881 | — | 903 | 6,881 | — | — | 903 | * | — | — | 903 | * | ||||||||||||||||||||||||||||||||||||
132
Table of Contents
| Name of Selling Security Holder |
Number of Shares of Common Stock Owned Prior to Offering(1) |
Number of Shares of 7% Preferred Stock Owned Prior to Offering |
Number of Warrants Owned Prior to Offering |
Maximum Number of Shares of Common Stock to be Sold Pursuant to this Prospectus(2) |
Maximum Number of Shares of 7% Preferred Stock to be Sold Pursuant to this Prospectus |
Maximum Number of Warrants to be Sold Pursuant to this Prospectus |
Shares of Common Stock Owned After Offering(3) |
Shares of 7% Preferred Stock Owned After Offering(3) |
Warrants Owned After Offering(3) |
|||||||||||||||||||||||||||||||||||||||
| Number(4) | Percent of Class |
Number | Percent of Class |
Number | Percent of Class |
|||||||||||||||||||||||||||||||||||||||||||
| California Public Employees Retirement System (CalPERS)(19) |
73,200 | — | — | 73,200 | — | — | — | — | — | — | — | — | ||||||||||||||||||||||||||||||||||||
| Capital World Bond Fund, Inc.(9) |
40,522 | — | 2,837 | 33,712 | — | — | 9,647 | * | — | — | 2,837 | * | ||||||||||||||||||||||||||||||||||||
| CC Arbitrage, Ltd.(20) |
89,469 | — | 5,948 | 75,191 | — | — | 20,226 | * | — | — | 5,948 | * | ||||||||||||||||||||||||||||||||||||
| Contrarian Distressed Equity, L.P.(21) |
75,214 | — | 4,225 | 66,197 | — | — | 13,242 | * | — | — | 4,225 | * | ||||||||||||||||||||||||||||||||||||
| Contrarian Long Short, L.P.(21) |
88,642 | — | 5,040 | 77,884 | — | — | 15,798 | * | — | — | 5,040 | * | ||||||||||||||||||||||||||||||||||||
| David Fishel IRA |
34,280 | — | 2,316 | 29,280 | — | — | 7,316 | * | — | — | 2,316 | * | ||||||||||||||||||||||||||||||||||||
| DuPont Pension Trust(12) |
42,503 | — | 2,825 | 35,721 | — | — | 9,607 | * | — | — | 2,825 | * | ||||||||||||||||||||||||||||||||||||
| Event Driven, A Series of Underlying Funds Trust(22) |
35,449 | — | — | 29,280 | — | — | 5,559 | * | — | — | — | — | ||||||||||||||||||||||||||||||||||||
| Future Fund Board of Guardians(23) |
40,069 | 15,562 | 24,498 | 130,317 | 15,562 | 24,498 | 1,023 | * | — | — | — | — | ||||||||||||||||||||||||||||||||||||
| GN3 SIP, Ltd.(24) |
7,568 | — | — | 7,568 | — | — | — | — | — | — | — | — | ||||||||||||||||||||||||||||||||||||
| Golden Tree Master Fund Ltd.(24) |
41,555 | — | — | 41,555 | — | — | — | — | — | — | — | — | ||||||||||||||||||||||||||||||||||||
| Golden Tree Master Fund II Ltd.(24) |
5,916 | — | — | 5,916 | — | — | — | — | — | — | — | — | ||||||||||||||||||||||||||||||||||||
| Goldman Sachs & Company(38) |
135,749 | — | — | 135,749 | — | — | — | — | — | — | — | — | ||||||||||||||||||||||||||||||||||||
| GPC 83, LLC(25) |
2,506 | — | 301 | 2,806 | — | — | 301 | * | — | — | 301 | * | ||||||||||||||||||||||||||||||||||||
| Gracie Credit Opportunities Master Fund, LP(25) |
93,983 | — | 11,281 | 105,264 | — | — | 11,281 | * | — | — | 11,281 | * | ||||||||||||||||||||||||||||||||||||
| HFR RVA Global Opportunity Master Trust(7) |
33,058 | — | — | 30,492 | — | — | 2,566 | * | — | — | — | — | ||||||||||||||||||||||||||||||||||||
| Lerner Enterprises, LLC(23) |
34,293 | 3,878 | 7,263 | 48,193 | 3,878 | 6,013 | 10,003 | * | — | — | 1,250 | * | ||||||||||||||||||||||||||||||||||||
| Lord Abbett Bond-Debenture Fund, Inc.(6) |
752,939 | 22,172 | 83,503 | 774,045 | 22,172 | 37,170 | 157,532 | * | — | — | 46,333 | 1.9 | % | |||||||||||||||||||||||||||||||||||
| Lord Abbett Investment Trust—Lord Abbett High Yield Fund(6) |
112,940 | 3,327 | 12,524 | 116,111 | 3,327 | 5,575 | 23,628 | * | — | — | 6,949 | * | ||||||||||||||||||||||||||||||||||||
| Lord Abbett Research Fund, Inc.—Lord Abbett Capital Structure Fund(6) |
131,763 | 3,880 | 14,613 | 135,457 | 3,880 | 6,505 | 27,567 | * | — | — | 8,108 | * | ||||||||||||||||||||||||||||||||||||
| Lord Abbett Series Fund, Inc.—Bond Debenture Portfolio(6) |
22,587 | 665 | 2,504 | 23,220 | 665 | 1,115 | 4,724 | * | — | — | 1,389 | * | ||||||||||||||||||||||||||||||||||||
| Lord Abbett Series Fund, Inc.—Capital Structure Portfolio(6) |
3,764 | 112 | 417 | 3,876 | 112 | 186 | 786 | * | — | — | 231 | * | ||||||||||||||||||||||||||||||||||||
133
Table of Contents
| Name of Selling Security Holder |
Number of Shares of Common Stock Owned Prior to Offering(1) |
Number of Shares of 7% Preferred Stock Owned Prior to Offering |
Number of Warrants Owned Prior to Offering |
Maximum Number of Shares of Common Stock to be Sold Pursuant to this Prospectus(2) |
Maximum Number of Shares of 7% Preferred Stock to be Sold Pursuant to this Prospectus |
Maximum Number of Warrants to be Sold Pursuant to this Prospectus |
Shares of Common Stock Owned After Offering(3) |
Shares of 7% Preferred Stock Owned After Offering(3) |
Warrants Owned After Offering(3) |
|||||||||||||||||||||||||||||||||||||||
| Number(4) | Percent of Class |
Number | Percent of Class |
Number | Percent of Class |
|||||||||||||||||||||||||||||||||||||||||||
| MET Investors Series Trust—Lord Abbett Bond Debenture Portfolio(6) |
188,233 | 5,543 | 20,875 | 193,510 | 5,543 | 9,292 | 37,091 | * | — | — | 9,292 | * | ||||||||||||||||||||||||||||||||||||
| MHAM US Income Open(6) |
50,823 | 1,497 | 5,636 | 52,249 | 1,497 | 2,509 | 10,633 | * | — | — | 3,127 | * | ||||||||||||||||||||||||||||||||||||
| Michael Finley |
8,269 | — | 579 | 6,880 | — | — | 1,968 | * | — | — | 579 | * | ||||||||||||||||||||||||||||||||||||
| Mizuho US High Yield Open(6) |
107,294 | 3,160 | 11,899 | 110,304 | 3,160 | 5,297 | 22,448 | * | — | — | 6,602 | * | ||||||||||||||||||||||||||||||||||||
| Mulé Associates, LLC(31) |
50,000 | — | 50,000 | 100,000 | — | 50,000 | — | — | — | — | — | — | ||||||||||||||||||||||||||||||||||||
| MW Special Situations LP(16) |
9,924 | — | 695 | 8,256 | — | — | 2,363 | * | — | — | 695 | * | ||||||||||||||||||||||||||||||||||||
| New Finance Alden SPV(8) |
41,280 | — | — | 41,280 | — | — | — | — | — | — | — | — | ||||||||||||||||||||||||||||||||||||
| New Generation Limited Partnership(16) |
119,916 | — | 8,398 | 99,761 | — | — | 28,553 | * | — | — | 8,398 | * | ||||||||||||||||||||||||||||||||||||
| New Generation Turnaround Fund (Bermuda) LP(16) |
231,452 | — | 15,139 | 195,119 | — | — | 51,472 | * | — | — | 15,139 | * | ||||||||||||||||||||||||||||||||||||
| NGA Ann Arbor Partners LP(16) |
1,488 | — | 104 | 1,238 | — | — | 354 | * | — | — | 104 | * | ||||||||||||||||||||||||||||||||||||
| Oak Hill Credit Alpha Master Fund, L.P.(23). |
574,304 | — | 28,913 | 365,446 | — | — | 237,771 | 1.3 | % | — | — | 28,913 | 1.2 | % | ||||||||||||||||||||||||||||||||||
| Oak Hill Credit Opportunities Financing, Ltd.(23) |
476,630 | 56,133 | 99,604 | 622,436 | 56,133 | 87,479 | 194,653 | 1.1 | % | — | — | 12,125 | * | |||||||||||||||||||||||||||||||||||
| OHA Strategic Credit Fund, L.P.(23) |
188,568 | — | 8,191 | 103,534 | — | — | 85,034 | * | — | — | 8,191 | * | ||||||||||||||||||||||||||||||||||||
| OHA Strategic Credit Master Fund II, L.P.(23) |
48,795 | 18,951 | 29,834 | 158,699 | 18,951 | 29,834 | 1,245 | * | — | — | — | — | ||||||||||||||||||||||||||||||||||||
| OHA Strategic Credit Master Fund, L.P.(23) |
174,989 | 67,249 | 102,392 | 559,683 | 67,249 | 102,392 | 6,249 | * | — | — | — | — | ||||||||||||||||||||||||||||||||||||
| OHA Strategic Credit Master Fund (Parallel II), L.P.(23) |
801,128 | — | 35,866 | 453,315 | — | — | 374,813 | 2.0 | % | — | — | 35,866 | 1.5 | % | ||||||||||||||||||||||||||||||||||
| OHA Strategic Credit Fund (Parallel I), L.P.(23) |
75,065 | — | 3,252 | 41,109 | — | — | 37,208 | * | — | — | 3,252 | * | ||||||||||||||||||||||||||||||||||||
| OHSF Financing, Ltd.(23) |
23,538 | — | 1,130 | 14,288 | — | — | 10,380 | * | — | — | 1,130 | * | ||||||||||||||||||||||||||||||||||||
| OHSF II Financing, Ltd.(23) |
285,486 | 87,445 | 138,153 | 766,672 | 87,445 | 135,242 | 32,175 | * | — | — | 2,911 | * | ||||||||||||||||||||||||||||||||||||
| Ore Hill Sub Fund Ltd(27) |
142,448 | — | — | 142,448 | — | — | — | — | — | — | — | — | ||||||||||||||||||||||||||||||||||||
| Pollux Holdings LP(6) |
2,824 | 83 | 312 | 2,902 | 83 | 139 | 580 | * | — | — | 173 | * | ||||||||||||||||||||||||||||||||||||
| Robert Brian Crews |
653 | — | — | 200 | — | — | 453 | * | — | — | — | — | ||||||||||||||||||||||||||||||||||||
134
Table of Contents
| Name of Selling Security Holder |
Number of Shares of Common Stock Owned Prior to Offering(1) |
Number of Shares of 7% Preferred Stock Owned Prior to Offering |
Number of Warrants Owned Prior to Offering |
Maximum Number of Shares of Common Stock to be Sold Pursuant to this Prospectus(2) |
Maximum Number of Shares of 7% Preferred Stock to be Sold Pursuant to this Prospectus |
Maximum Number of Warrants to be Sold Pursuant to this Prospectus |
Shares of Common Stock Owned After Offering(3) |
Shares of 7% Preferred Stock Owned After Offering(3) |
Warrants Owned After Offering(3) |
|||||||||||||||||||||||||||||||||||||||
| Number(4) | Percent of Class |
Number | Percent of Class |
Number | Percent of Class |
|||||||||||||||||||||||||||||||||||||||||||
| Schroder Credit Renaissance Fund, Ltd(28) |
67,259 | — | 3,474 | 43,920 | — | — | 26,813 | * | — | — | 3,474 | * | ||||||||||||||||||||||||||||||||||||
| Seaport Group LLC Profit Sharing Plan(29) |
148,097 | — | 9581 | 121,101 | — | — | 36,577 | * | — | — | 9,581 | * | ||||||||||||||||||||||||||||||||||||
| SG Aurora Master Fund L.P.(30) |
35,281 | — | — | 35,281 | — | — | — | — | — | — | — | — | ||||||||||||||||||||||||||||||||||||
| Silver Point Capital Fund, L.P.(31) |
872,963 | 74,260 | 159,016 | 923,133 | 74,260 | 127,037 | 399,960 | 2.2 | % | — | — | 16,979 | * | |||||||||||||||||||||||||||||||||||
| Silver Point Capital Offshore Master Fund, L.P.(31) |
2,106,175 | 173,272 | 375,369 | 2,007,047 | 173,272 | 331,419 | 947,969 | 5.2 | % | — | — | 43,949 | 1.8 | % | ||||||||||||||||||||||||||||||||||
| Simran Pre-Event Driven Activist Opportunity Master Fund LTD(22) |
14,640 | — | 1,158 | 14,640 | — | — | 1,158 | * | — | — | 1,158 | * | ||||||||||||||||||||||||||||||||||||
| SOF Investments, L.P.(32) |
1,083,241 | — | 25,483 | 672,081 | — | — | 436,643 | 2.4 | % | — | — | 25,483 | 1.1 | % | ||||||||||||||||||||||||||||||||||
| TCW Shared Opportunity Fund IV, L.P.(33) |
151,007 | 8,883 | 23,892 | 182,414 | 8,883 | 14,892 | 30,600 | * | — | — | 9,000 | * | ||||||||||||||||||||||||||||||||||||
| TCW Shared Opportunity Fund IVB, L.P.(33) |
31,046 | 1,811 | 4,888 | 37,405 | 1,811 | 3,035 | 6,300 | * | — | — | 1,853 | * | ||||||||||||||||||||||||||||||||||||
| TCW Shared Opportunity Fund V, L.P.(33) |
534,867 | 31,405 | 84,538 | 645,736 | 31,405 | 52,650 | 108,421 | * | — | — | 31,888 | 1.3 | % | |||||||||||||||||||||||||||||||||||
| TD High Yield Income Fund(34) |
577,794 | 42,097 | 105,326 | 745,601 | 42,097 | 70,576 | 93,149 | * | — | — | 34,750 | 1.4 | % | |||||||||||||||||||||||||||||||||||
| The Bond Fund of America, Inc.(9) |
85,450 | — | 5,096 | 60,544 | — | — | 30,002 | * | — | — | 5,096 | * | ||||||||||||||||||||||||||||||||||||
| The Income Fund of America, Inc.(9) |
586,012 | — | — | — | — | — | 586,012 | 3.2 | % | — | — | — | — | |||||||||||||||||||||||||||||||||||
| The PrinceRidge Group, LLC(26) |
963 | — | 81 | 688 | — | — | 356 | * | — | — | 81 | * | ||||||||||||||||||||||||||||||||||||
| UBS AG, London Branch(35) |
519,419 | 10,104 | 30,709 | 470,447 | 10,104 | — | 48,703 | * | — | — | 30,709 | 1.3 | % | |||||||||||||||||||||||||||||||||||
| Värde Investment Partners, L.P.(37) |
405,040 | — | — | 405,040 | — | — | — | — | — | — | — | — | ||||||||||||||||||||||||||||||||||||
| VSO Master Fund, Ltd.(36) |
15,273 | — | — | 15,723 | — | — | — | — | — | — | — | — | ||||||||||||||||||||||||||||||||||||
| William M. Stern(39) |
293 | — | — | 293 | — | — | — | — | — | — | — | — | ||||||||||||||||||||||||||||||||||||
| Wilshire Institutional Master Fund SPC— Wilshire Castle Creek Covert Arb Segregated Portfolio(20) |
1,984 | — | 132 | 1,668 | — | — | 448 | * | — | — | 132 | * | ||||||||||||||||||||||||||||||||||||
135
Table of Contents
| * | Less than 1% of class |
| (1) | Does not include shares of common stock issuable upon the conversion of 7% preferred stock and exercise of warrants owned by the beneficial owner. |
| (2) | Includes shares of common stock issuable upon the conversion of 7% preferred stock and exercise of warrants offered by the selling security holders. |
| (3) | Represents the amount of securities that will be held by the selling security holders after completion of this offering based on the assumptions that (a) all securities registered for sale by the registration statement of which this prospectus forms a part will be sold and (b) that no other securities are acquired or sold by the selling security holders prior to completion of this offering. However, the selling security holders may sell all, some or none of the securities offered pursuant to this prospectus and may sell other securities that they may own pursuant to another registration statement under the Securities Act or sell some or all of their securities pursuant to an exemption from the registration provisions of the Securities Act. |
| (4) | Includes shares of common stock issuable upon the conversion of 7% preferred stock and exercise of warrants beneficially owned by selling security holders after completion of the offering. |
| (5) | Gary Lehrman and Aziz Nahas share voting and investment power over the securities owned by the selling security holder. |
| (6) | Lord, Abbett & Co. LLC, as investment advisor, has sole voting and investment power over the securities owned by the selling security holder. Funds and accounts managed by Lord, Abbett & Co. LLC are among the Backstop Parties. See “Certain Relationships and Related Party Transactions” for a description of the equity commitment agreement, the equity registration rights agreement and the nomination agreements that we entered into with the Backstop Parties. |
| (7) | Advent Capital Management, LLC is the investment manager of the selling security holder. Tracy V. Maitland is the natural person who has voting control over the securities being offered. |
| (8) | Information for the selling security holder is based solely on information available to us from our transfer agent. |
| (9) | Capital Research and Management Company, as investment adviser, has sole voting and investment power over the securities owned by the selling security holder. Funds and accounts managed by Capital Research and Management Company are among the Backstop Parties. See “Certain Relationships and Related Party Transactions” for a description of the equity commitment agreement, the equity registration rights agreement and the nomination agreements that we entered into with the Backstop Parties. |
| (10) | APG Asset Management US Inc. is the agent for the selling security and has sole voting and investment power over the securities owned by the selling security holder. |
| (11) | Armory Advisors LLC is the Investment Manager of the selling security holder. Jay Burnham, the Manager of Armory Advisors LLC, has sole voting and investment power over the securities owned by the selling security holder. |
| (12) | State Street Corp., as Trustee, and DuPont Capital Management Corp. share voting power over the securities owned by DuPont Pension Trust. Wilmington Trust, as Trustee, and DuPont Capital Management Corp. share voting power over the securities owned by AST Capital Trust Co. Collective Investment Trust—DCM High Yield Bond Fund. DuPont Capital Management Corp. has sole investment power over the securities owned by the selling security holder. |
| (13) | Steven C. Taub and Ira S. Taub, the managing members of IST, LLC, the general partner of the selling security holder, share voting and investment power over the securities owned by the selling security holder. |
| (14) | Blake Thomas, the General Partner of the selling security holder, has sole voting and investment power over the securities owned by the selling security holder. |
| (15) | Barclays Capital Inc. is an indirectly, wholly-owned subsidiary of Barclays Bank PLC. Barclays Capital Inc. acted as joint lead arranger and bookrunner for our senior ABL facility, and Barclays Bank PLC acts as a lender under our senior ABL facility. Barclays Capital Inc. acted as a joint book-running manager and an initial purchaser of our senior notes. Funds and accounts managed by Barclays Bank PLC are among the Backstop Parties. See “Certain Relationships and Related Party Transactions” for a description of the equity commitment agreement, the equity registration rights agreement and the nomination agreements that we entered into with the Backstop Parties and the fees paid to Barclays Capital Inc. and Barclays Bank PLC related to our senior ABL facility and senior notes. |
| (16) | New Generation Advisors LLC is the General Partner of the selling security holders. George Putnam III is the Manager and Attorney-In-Fact of Brandy Trust Multi Strategy NGA LLC and MW Special Situations LP and the President of New Generation Advisors LLC. Thomas Hill is Vice President of New Generation Advisors LLC. Carl Owens is Vice President of New Generation Advisors LLC. Messrs. Putnam III, Hill and Owens share voting and investment power over the securities owned by the selling security holders. |
| (17) | Douglas B. Lowey, the Managing Member of the selling security holder, has sole voting and investment power over the securities owned by the selling security holder. |
| (18) | Scott Kovalik, Steven Starker and Anton LeRoy share voting and investment power over the securities owned by the selling security holder. |
| (19) | Information for the selling security holder is based solely on information available to us from our transfer agent. |
| (20) | Castle Creek Arbitrage LLC is the investment manager acting with sole discretionary authority for the selling security holder. Allan Weine is the sole Managing Member of Castle Creek Arbitrage LLC. Castle Creek Arbitrage LLC and Mr. Weine both disclaim beneficial ownership of the securities owned by the selling security holder. |
| (21) | Contrarian Capital Management, L.L.C. has sole voting and investment power over the securities owned by the selling security holder. |
| (22) | Candi Hughes, Lance Baker, Shawn Groves and Mesh Tandon share voting and investment power over the securities owned by Event Driven, A Series of Underlying Funds Trust. Shawn Groves and Mesh Tandon share voting and investment power over the securities owned by Simran Pre-Event Driven Activist Opportunity Master Fund LTD. |
| (23) | Oak Hill Advisors, L.P. (“OHA”) is the investment advisor to the selling security holder and certain of its affiliates and principals, either directly or indirectly, exercise voting and dispositive power over the shares being registered. OHA and its affiliates and principals disclaim beneficial ownership of the shares being registered, except to the extent of their direct pecuniary interest therein. Funds and accounts managed by OHA are among the Backstop Parties. See “Certain Relationships |
136
Table of Contents
| and Related Party Transactions” for a description of the equity commitment agreement, the equity registration rights agreement and the nomination agreements that we entered into with the Backstop Parties. |
| (24) | Morris Tucker, manager of High Yield Operations, has sole voting and investment power over the securities owned by the selling security holders. |
| (25) | P&S Credit Management is the Investment Manager of the selling security holder. Daniel Nir is the Managing Member of the General Partner of the Investment Manager. Mr. Nir has sole voting and investment power over the securities owned by the selling security holders. |
| (26) | David W. Utter and Armand Pastine share voting and investment power over the securities owned by the selling security holder. |
| (27) | Ore Hill Partners LLC, as Investment Advisor, has sole voting and investment power over the securities owned by the selling security holder. |
| (28) | Steven G. Edersheim and Julian C. Schroeder share voting and investment power over the securities owned by the selling security holder. |
| (29) | Steve Smith has sole voting and investment power over the securities owned by the selling security holder. |
| (30) | Christopher Testa and Sheldon Goldman share voting and investment power over the securities owned by the selling security holder. |
| (31) | Edward A. Mulé, co-founder and partner of Silver Point Capital, L.P., has sole voting and investment power over the securities owned by Mulé Associates, LLC. Silver Point Capital, L.P. shares voting and investment power with the selling security holder. Funds and accounts managed by Silver Point Capital, L.P. are among the Backstop Parties. See “Certain Relationships and Related Party Transactions” for a description of the equity commitment agreement, the equity registration rights agreement and the nomination agreements that we entered into with the Backstop Parties. |
| (32) | MSD Capital, L.P. is the general partner of SOF Investments, L.P. and may be deemed to have or share voting and dispositive power over, and/or beneficially own, the common shares held by SOF Investments, L.P. MSD Capital Management LLC is the general partner of MSD Capital, L.P. and may be deemed to have or share voting and/or dispositive power over, and beneficially own, the common shares held by MSD Capital, L.P. Each of Glenn R. Fuhrman, John C. Phelan and Marc R. Lisker is a manager of MSD Capital Management LLC and may be deemed to have or share voting and/or dispositive power over, and beneficially own, the common shares owned by MSD Capital Management LLC. Each of Mr. Fuhrman, Mr. Phelan and Mr. Lisker disclaim beneficial ownership of such common shares, except to the extent of the pecuniary interest of such person in such shares. |
| (33) | The investment adviser to the selling security holder is TCW Asset Management Company, an SEC-registered investment adviser, and, as such, has dispositive and voting power with respect to the shares held by the funds it advises. |
| (34) | TD Asset Management, Inc., as Trustee and Manager of the selling security holder, has sole voting and investment power over the securities owned by the selling security holder. Funds and accounts managed by TD Asset Management, Inc. are among the Backstop Parties. See “Certain Relationships and Related Party Transactions” for a description of the equity commitment agreement, the equity registration rights agreement and the nomination agreements that we entered into with the Backstop Parties. |
| (35) | UBS Securities LLC an affiliate of UBS AG, London Branch, acted as a joint book-running manager and an initial purchaser of our senior notes. UBS Securities LLC acted as a co-documentation agent under our prepetition credit agreement. UBS Securities LLC acted as co-syndication agent and co-arranger under our initial DIP credit agreement. UBS Securities LLC acted as joint lead arranger and bookrunner under our senior ABL facility. |
| (36) | Information for the selling security holder is based solely on information available to us from our transfer agent. |
| (37) | Information for the selling security holder is based solely on information available to us from our transfer agent. |
| (38) | Information for the selling security holder is based solely on information available to us from our transfer agent. |
| (39) | Information for the selling security holder is based solely on information available to us from our transfer agent. |
137
Table of Contents
CERTAIN RELATIONSHIPS AND RELATED PARTY TRANSACTIONS
Equity Commitment Agreement
In connection with our plan of reorganization, we entered into an equity commitment agreement on March 19, 2010 with certain funds and/or accounts managed by Silver Point Capital, L.P., Barclays Bank PLC, Oak Hill Advisors, L.P., Lord, Abbett & Co. LLC, Capital Research and Management Company, TCW Asset Management Company and TD Asset Management Inc., all of which were holders of our prepetition senior notes and prepetition senior subordinated notes. We collectively refer to these entities as the Backstop Parties. Under the commitment agreement, the Backstop Parties committed to purchase 11.75% of our common stock and $100 million of our 7% preferred stock (convertible into 19.7% of our common stock), upon our emergence from bankruptcy (in each case, assuming conversion of the 7% preferred stock). The Backstop Parties also agreed to fully backstop any unsubscribed portion of the equity rights offering we conducted as part of our plan of reorganization. In aggregate, the commitment agreement provided us with commitment to purchase $355 million of our common stock and 7% preferred stock in connection with our emergence from bankruptcy. The commitment agreement also provided for the Backstop Parties to receive warrants to purchase 7% of our common stock upon emergence (assuming conversion of the 7% preferred stock). On account of their commitment to backstop the rights offering and certain other agreements to support our plan of reorganization, we paid the Backstop Parties an aggregate commitment premium equal to $12.4 million, plus reimbursement for certain transaction expenses.
Equity Registration Rights Agreement
In connection with the equity commitment agreement, on the date of our emergence from bankruptcy, we entered into a registration rights agreement, or the equity registration rights agreement, with the Backstop Parties and certain other holders of registrable securities. Registrable securities will consist of any shares of our common stock and 7% preferred stock, any warrants issued pursuant to our plan of reorganization and any shares of common stock issuable upon conversion of 7% preferred stock or upon exercise of warrants that are beneficially owned by the Backstop Parties and such other holders. Registrable securities will cease to be registrable securities under certain circumstances and upon the happening of certain events, such as upon their sale under a registration statement or pursuant to Rule 144.
The equity registration rights agreement gives the Backstop Parties and such other holders certain registration rights, including demand registration, shelf registration and piggyback registration rights. Any Backstop Party or such other holder that owned at least 5% of the outstanding common stock (on a fully diluted basis) as of the date of our emergence from bankruptcy and continues to own 5% of the outstanding common stock (on a fully diluted basis), each of which is referred to herein as a demand holder, has certain rights to demand the registration of its registrable securities on a registration statement, which may be a shelf registration, filed with the SEC on an underwritten or non-underwritten basis. Prior to our initial underwritten public offering, demand holders holding at least 35% of the outstanding registrable securities or any Backstop Party that owns at least 7.5% of the outstanding common stock (on a fully diluted basis) may make an initial demand registration, so long as the total offering price of the shares to be sold in the offering exceeds $75 million in the aggregate. After our initial underwritten public offering, any demand holder may make a demand registration so long as the total offering price of the shares to be sold in the offering exceeds, in the case of a registration on Form S-1, $50 million in the aggregate or, in the case of a registration on Form S-3, $20 million in the aggregate. We will not be required to effect more than two demand registrations in any 12-month period. In addition, we will not be required to effect a demand registration if within the 12-month period preceding the date of a request for a demand registration we have effected one demand registration and another registration statement has been declared effective within the 12-month period preceding such demand request and at least $20 million of the then outstanding registrable securities were entitled to be included in such registration. We will also not be required to effect a demand registration during certain suspension periods as set forth in the equity registration rights agreement. We are not required to conduct more than 12 underwritten demand registrations in total or more than eight demand registrations for the Backstop Parties on a Form S-1. In addition to the above demand rights, demand holders
138
Table of Contents
may request us to file a shelf registration for the continuous offering of the registrable securities, and whenever we propose to file a registration statement and registrable securities may be included in such registration, the holders of registrable securities may exercise piggyback registration rights.
The equity registration rights agreement also provides, subject to certain exceptions, that any holder party to the agreement that holds 5% or more of the outstanding shares of the common stock (on a fully diluted basis) will be restricted from effecting any public sale or distribution of any of our equity securities, or any securities convertible into exchangeable or exercisable for our equity securities, held by such holder for the seven days prior to and the 180-day period following the pricing date of our underwritten initial public offering and the seven days prior to and the 90-day period following the date of pricing any other underwritten offering by us.
Nomination Agreements
On the date of our emergence from bankruptcy, we entered into separate director nomination agreements with (i) Barclays Capital Inc., or Barclays, (ii) Silver Point Capital L.P., on behalf of its affiliates and related funds, or Silver Point, (iii) Oak Hill Advisors L.P., on behalf of certain funds and separate accounts that it manages, or Oak Hill, and (iv) Capital Research and Management Company, as investment advisor to certain funds it manages, TCW Shared Opportunity Fund IV, L.P., TCW Shared Opportunity Fund IVB, L.P., TCW Shared Opportunity Fund V, L.P., TD High Yield Income Fund, and Lord, Abbett & Co. LLC, as investment manager on behalf of multiple clients, such entities together referred to herein as the Designating Parties and together with Barclays, Silver Point and Oak Hill, as the Backstop Stockholders, and each such agreement is referred to herein as the nomination agreement and together, the nomination agreements. Each of the nomination agreements will continue to be in effect until the earlier of (i) termination of such agreement at the election of the applicable nominating parties, (ii) immediately prior to our annual meeting of stockholders held during the calendar year 2013 and (iii) the applicable nominating parties together with their respective “affiliates” (as defined in the nomination agreements) no longer “beneficially own” (as defined in the nomination agreements) in the aggregate 7.5% or greater of the issued and outstanding common stock (assuming the conversion of all outstanding shares of 7% preferred stock).
Pursuant to the Designating Parties and Barclays’ nomination agreements, each of the Designating Parties, acting together, and Barclays had the right to nominate one independent member of our board of directors, and such nominee would be selected in reasonable consultation with (but without the need for the approval of) our Chief Executive Officer and Korn/Ferry International, or such other executive search firm mutually acceptable to such Backstop Stockholder and us, so long as a committee of “independent directors” (as defined in such nomination agreements) determines that the respective Backstop Stockholder’s nominee will be nominated for election to our board of directors.
Pursuant to Silver Point and Oak Hill’s nomination agreements, Silver Point had the right to nominate one member of our board of directors (subject to the consent of Barclays if such member nominated by Silver Point was not independent) and Oak Hill had the right to nominate one member of our board of directors. In addition, each of Silver Point and Oak Hill had the right to appoint one observer to our board of directors in addition to the member of our board of directors nominated by each of them.
Pursuant to these rights, Oak Hill nominated Glenn R. August to our board of directors, Silver Point nominated Orlando A. Bustos to our board of directors, the Designating Parties nominated Larry Jutte to our board of directors as an independent director, and Barclays nominated David J. Mastrocola to our board of directors. Each of these nominees was appointed to our board of directors as of the effective date of our emergence from bankruptcy on May 27, 2010.
Each of the members of our board of directors will serve in accordance with applicable federal and state laws, our certificate of incorporation, the Certificate of Designations for the 7% Cumulative Participating Convertible
139
Table of Contents
Preferred Stock and our bylaws. Nominees to our board of directors pursuant to each of the nomination agreements are entitled to compensation paid to other non-employee members of our board of directors. With respect to the nomination agreement with Oak Hill, if the nominee is an employee of Oak Hill or its affiliate, at the option of Oak Hill and subject to the approval of our board of directors, the nomination agreement provides that such compensation (or its economic equivalent) will instead be paid to Oak Hill or its affiliates. In accordance with the terms of Oak Hill’s nomination agreement, Oak Hill elected to receive such compensation, which was approved by our board of directors, and Oak Hill or its affiliates will be receiving the compensation described above (including the equity grants pursuant to substantially similar terms) in lieu of Glenn R. August.
Senior ABL Facility
Barclays Capital Inc., an affiliate of Barclays Bank PLC, acted as joint lead arranger and bookrunner for our senior ABL facility, and Barclays Bank PLC acts as a lender under our senior ABL facility. Pursuant to these arrangements, we paid Barclays Capital Inc. and Barclays Bank PLC aggregate fees of approximately $0.6 million.
Senior Notes
Barclays Capital Inc. acted as a joint book-running manager and an initial purchaser in the $450 million offering of our 8½% senior notes due 2018 for which it received a placement fee of approximately $1.7 million.
Other Relationships
A sibling of David J. Mastrocola, one of our directors, is a partner at Ernst & Young LLP, our auditor. Ernst & Young LLP received approximately $4.1 million for audit, audit-related and tax fees for services performed for us during the year ended December 31, 2009.
We paid OHorizons LLC approximately $0.4 million in professional fees during the nine months ended September 30, 2010 for services rendered to Silver Point Capital, L.P. and Barclays Capital Inc. in connection with their roles as Backstop Parties. Orlando A. Bustos, one of our directors, is the founder and the senior managing director of OHorizons LLC and was appointed to our board of directors pursuant to a nomination agreement we entered into with Silver Point Capital, L.P. in connection with our emergence from bankruptcy. See “—Nomination Agreements.”
140
Table of Contents
Common Stock
We are authorized to issue up to 190,000,000 shares of common stock, par value $0.001 per share. As of November 11, 2010, an aggregate of 18,376,112 shares of our common stock were issued and outstanding.
All shares of common stock vote as one class, except as otherwise provided by law. Each share of common stock carries one vote on the record date for the determination of the stockholders entitled to vote.
Each share of common stock is entitled to any dividends to be declared on a record date on or after the issue date of the common stock, except, however, that for so long as any shares of 7% preferred stock are outstanding, dividends may not be declared or paid on common stock (unless paid in common stock) unless the full cumulative preferred dividends have been paid and, in the case of a cash dividend, the Company shall have redeemed all shares of 7% preferred stock tendered in an offer to purchase such shares.
Holders of our common stock are not entitled to preemptive rights, and no redemption or sinking fund provisions are applicable to our common stock. All outstanding shares of our common stock are, and any shares of common stock to be issued upon the conversion of our 7% preferred stock or exercise of our warrants will be, fully paid and non-assessable.
In the event of our liquidation, dissolution or winding up, holders of common shares are entitled to share ratably in proportion to their shareholding in our assets, if any, remaining after the payment of all of our debts and liabilities, subject to any liquidation preference on any outstanding preference shares.
Warrants
An aggregate of 2,419,753 warrants have been issued and 2,419,753 shares of common stock are issuable upon exercise of the warrants. The warrants are exercisable into shares of common stock at an exercise price of $27.33 per share (subject to adjustment in accordance with anti-dilution protections) or on a cashless basis whereby for each warrant exercised its holder will receive a number of shares of common stock equal to (i) the “closing sale price” (as defined in the Warrant Agreement that we entered into with Computershare Inc. and Computershare Trust Company, N.A. on May 28, 2010) minus the exercise price (in each case as of the exercise date), divided by (ii) such “closing sale price.” The warrants may be exercised at any time during the period beginning upon our emergence from bankruptcy and ending at the close of business on the 90-month anniversary of our emergence from bankruptcy, or November 2017. However, warrants purchased pursuant to this registration statement are exercisable only if a registration statement and a prospectus relating to our common stock issuable upon exercise of such warrants is effective and current.
The warrants are subject to certain anti-dilution protection, including in the case of, among others, stock splits, stock dividends and distributions, tender or exchange offers, rights plans and certain issuances of common stock or derivatives. Warrant holders do not have the rights or privileges of holders of our common stock, including voting rights, until they exercise their warrants and receive shares of our common stock. After the issuance of shares of our common stock upon exercise of the warrants, each holder will be entitled to one vote for each share held of record on all matters to be voted on by stockholders.
No fractional shares will be issued upon exercise of warrants. If a holder exercises warrants and would be entitled to receive a fractional interest of a share, we will pay cash valued at the closing sale price of the exercise date.
This description is qualified in its entirety by reference to the complete text of the warrant agreement between us and Computershare Inc. and Computershare Trust Company, N.A., which is included as an exhibit to the registration statement of which this prospectus is a part.
141
Table of Contents
Preferred Stock
We are authorized to issue up to 10,000,000 shares of preferred stock, par value $0.001 per share. We have designated 2,000,000 shares of our authorized preferred stock as 7% cumulative participating convertible preferred stock, par value $0.001 per share, of which 1,052,446 are issued and outstanding as of November 11, 2010.
The following is a summary of the material terms of our 7% preferred stock, contained in the certificate of designations for the 7% preferred stock. This description is qualified in its entirety by reference to the complete text of the certificate of designations for our 7% preferred stock, which is included as an exhibit to the registration statement of which this prospectus is a part.
General
Pursuant to our plan of reorganization and the commitment agreement, the Backstop Parties purchased 1,000,000 shares of our 7% preferred stock, with a stated value of $100.00 per share.
Ranking
The 7% preferred stock ranks senior to our common stock and all other classes or series of our capital stock, except for any other class or series, the terms of which expressly provide that it ranks on a parity with the 7% preferred stock. In the event of our liquidation, winding-up or dissolution, holders of 7% preferred stock are entitled to priority in payments from us in an amount equal to the greater of (x) the stated value of the 7% preferred stock plus accrued and unpaid cumulative preferred dividends and (y) the conversion value of the 7% preferred stock.
Dividends
Holders of 7% preferred stock are entitled to receive, when, as and if declared by our board of directors, out of funds legally available for the payment of dividends, cumulative preferred dividends on a quarterly basis at the rate of 7% per year. Dividends may be paid in cash or “in-kind” with additional shares of 7% preferred stock at the option of the Company.
In addition, shares of 7% preferred stock are entitled to receive dividends to the same extent and on the same basis as dividends with respect to our common stock determined, when, as and if declared by our board of directors, out of funds legally available for the payment of dividends, in accordance with the number of shares of common stock issuable upon conversion of the 7% preferred stock at the time such dividend is declared. For so long as any shares of 7% preferred stock are outstanding, dividends may not be declared or paid on the common stock (unless paid in common stock) and we may not acquire any common stock unless the full cumulative preferred dividends have been paid and, in the case of a cash dividend on or cash acquisition of the common stock, unless we have redeemed all shares of 7% preferred stock tendered in an offer to purchase such shares.
Conversion at option of holders
Shares of 7% preferred stock are convertible at any time into shares of common stock at the option of the holders. As of the date of this prospectus, the outstanding shares of 7% preferred stock are convertible into 4,469,568 shares of our common stock. The initial and current conversion price of the 7% preferred stock is $23.30574 per share of common stock, subject to certain adjustments, including, among others, stock splits and reclassifications, stock dividends and distributions, tender or exchange offers, reorganization events, rights plans and certain issuances of common stock or derivatives. The number of shares of common stock delivered upon conversion is equal to the number obtained by dividing (i) the sum of the stated value and all accrued and unpaid cumulative dividends by (ii) the conversion price.
142
Table of Contents
Conversion at option of the Company
We may convert the 7% preferred stock at our option, for the number of shares of common stock as provided in the preceding paragraph, at any time after the third anniversary of our emergence from bankruptcy if (i) the closing sale price of the common stock exceeded 155% of the conversion price of the 7% preferred stock for each of 30 consecutive trading days within the 45-day period prior to the notification by us to the holders of the 7% preferred stock of our exercise of the conversion right, (ii) our common stock has been listed on the New York Stock Exchange, or the NYSE, or the NASDAQ Global Select Market or the NASDAQ Global Market, or, collectively, NASDAQ, and has been registered pursuant to section 12 of the Exchange Act, and (iii) a registration statement covering resales of the common stock issuable upon conversion of the 7% preferred stock has been declared effective prior to the date of notice and will remain available for resales for at least 60 days after the conversion date, subject to certain exceptions.
Conversion upon IPO
We may cause the conversion of all shares of 7% preferred stock into shares of common stock immediately prior to the consummation of an underwritten initial public offering of the common stock if (i) the holders of two-thirds of the then outstanding shares of 7% preferred stock approve the conversion and (ii) the common stock has been listed on the NYSE or NASDAQ and has been registered pursuant to section 12 of the Exchange Act.
Redemption rights upon certain transactions
On or within 30 days after receipt of a notice from us of certain events that constitute a change of control or involve a “cash transaction” (as defined below), the holders of 7% preferred stock may require us to redeem all or a portion of their 7% preferred stock at the greater of the stated value of the 7% preferred stock plus accrued and unpaid cumulative preferred dividends or the value of the shares of the common stock into which such shares of 7% preferred stock are then convertible. If a “cash transaction” occurs prior to the fifth anniversary of our emergence from bankruptcy, holders of 7% preferred stock will be entitled to receive cash equal to the greater of (i), in the case of a “cash transaction” that occurs prior to the first anniversary of our emergence from bankruptcy, the stated value of the 7% preferred stock plus accrued and unpaid cumulative preferred dividends both multiplied by 1.175, after the first anniversary and prior to the fifth anniversary of our emergence from bankruptcy, the stated value of the 7% preferred stock plus accrued and unpaid cumulative preferred dividends both multiplied by 1.125 and, thereafter, the stated value of the 7% preferred stock plus accrued and unpaid cumulative preferred dividends and (ii) the conversion value of the 7% preferred stock as of such date. “Cash transaction” means a merger, consolidation, share exchange or other similar transaction or a sale, lease or other transfer in one transaction or a series of related transactions of all or substantially all of our consolidated assets in which all of the common stock is converted into the right to receive cash.
Redemption at option of the Company
From and after the sixth anniversary of our emergence from bankruptcy, we may, at our option, redeem shares of 7% preferred stock at any time, in whole or in part, for cash at the greater of (x) the stated value of the 7% preferred stock plus accrued and unpaid cumulative dividends (which value will be multiplied by 1.125 if the redemption occurs prior to the seventh anniversary of our emergence from bankruptcy) and (y) 75% of the conversion value of the 7% preferred stock as of the second trading day prior to the redemption date. If 75% of the conversion value of the 7% preferred stock is greater than the amount in (x) above, we may redeem the shares of 7% preferred stock in part for cash equal to the redemption value of the 7% preferred stock and in part for shares of common stock valued as of the second trading day prior to the redemption date equal to the difference between the redemption value of the 7% preferred stock and 75% of the conversion value of the 7% preferred stock. In order for us to elect to exercise this redemption right, a registration statement covering resales of the common stock issuable upon redemption of the 7% preferred stock must have been declared effective prior to the date of notice and must remain available for resales for at least 60 days after the redemption date, subject to certain exceptions. In addition, in order for us to exercise this redemption right, all cumulative preferred dividends and all participating dividends must have been paid for all past dividend periods.
143
Table of Contents
Voting
Each share of 7% preferred stock carries one vote for each share of common stock into which such share of 7% preferred stock may be converted on the record date for the determination of the stockholders entitled to vote and will be entitled to vote on any matter upon which shares of the common stock are entitled to vote, voting together with the common stock and not as a separate class. In addition, the holders of two-thirds of the outstanding 7% preferred stock are required to approve certain actions, including:
| • | changes to our certificate of incorporation or the certificate of designations of the 7% preferred stock that are adverse to the rights of the 7% preferred stock; |
| • | changes of the 7% preferred stock (whether by merger, consolidation, reclassification or otherwise) into cash, securities or other property (except in accordance with the certificate of designations) or, in the case of a merger or consolidation involving us in which we are not the surviving entity, the 7% preferred stock may be exchanged for an equivalent number of shares of preferred stock of the surviving or resulting entity with substantially the same terms as the 7% preferred stock; |
| • | any issuance of shares of 7% preferred stock (other than the shares of 7% preferred stock issued at the effective date and additional shares issued as “in-kind” dividends); provided, however, that any issuance of shares of 7% preferred stock that are not offered to the existing holders of 7% preferred stock on a pro rata basis relative to their holdings on the same terms as offered to other participants in the issuance shall require the approval of each holder of 7% preferred stock; |
| • | the creation, authorization, issuance or increase in the amount of any equity security that ranks equally with or senior to the 7% preferred stock with respect to dividend rights, rights of redemption or rights of liquidation, dissolution or winding-up including us; and |
| • | the conversion of the shares of 7% preferred stock into shares of common stock immediately prior to the consummation of our initial underwritten public offering. |
Transfer Agent
Our transfer agent is Computershare Trust Company, N.A.
Anti-Takeover Effects of Certain Provisions of Our Certificate of Incorporation and Bylaws and Delaware Law
Certain provisions that are included in our certificate of incorporation and bylaws, which are summarized in the following paragraphs, and applicable provisions of the DGCL, may make it more difficult for or prevent an unsolicited third party from acquiring control of us or changing our board of directors and management. These provisions may have the effect of deterring hostile takeovers or delaying changes in our control or in our management. These provisions are intended to enhance the likelihood of continued stability in the composition of our board of directors and in the policies furnished by them and to discourage certain types of transactions that may involve an actual or threatened change in our control. The provisions also are intended to discourage certain tactics that may be used in proxy fights. These provisions, however, could have the effect of discouraging others from making tender offers for our shares and, as a consequence, they also may inhibit fluctuations in the market price of our shares that could result from actual or rumored takeover attempts.
Size of board and vacancies
Our certificate of incorporation provides that the number of directors on our board of directors is fixed by our board of directors. Newly created directorships resulting from any increase in our authorized number of directors and vacancies in our board of directors resulting from death, resignation or removal from office will be filled solely by a majority vote of the directors then in office, even if less than a quorum, or by a sole remaining director.
144
Table of Contents
No cumulative voting
The DGCL provides that stockholders are not entitled to the right to cumulate votes in the election of directors unless our certificate of incorporation provides otherwise. Our certificate of incorporation does not expressly provide for cumulative voting.
Removal of directors
Our certificate of incorporation provides that any director may be removed at any time, with or without cause by the affirmative vote of the holders of a majority of the voting power of all then outstanding shares of stock entitled to vote generally in the election of directors, voting together as a single class.
Bylaw amendments
Our bylaws provide that the bylaws may only be amended by a majority of our board of directors or upon the affirmative vote of the holders of at least a majority of the voting power of all outstanding shares of stock entitled to vote generally in the election of directors, voting together as a single class.
Calling of special meetings of stockholders
Our certificate of incorporation provides that special meetings of our stockholders: (i) may be called by the chairman of the board, the chief executive officer, or any member of the board of directors pursuant to a resolution adopted by a majority of our board of directors; and (ii) must be called by the secretary at the written request of the holders of record of at least 20% of the voting power of the outstanding stock entitled to vote on the matter or matters to be brought before the proposed special meeting.
Stockholder action by written consent
The DGCL permits stockholder action by written consent unless otherwise provided by a corporation’s certificate of incorporation. Our certificate of incorporation provides that our stockholders may not act by written consent, unless the action by written consent of the stockholders is approved in advance by a board resolution or except as expressly provided by the terms of any series of preferred stock.
Advance notice requirements for stockholder proposals
Our bylaws establish advance notice procedures with respect to stockholder proposals. Stockholders will only be able to consider proposals specified in the notice of meeting or brought before the meeting by or at the direction of our board of directors or by a stockholder who was a stockholder of record on the record date for the meeting, who is entitled to vote at the meeting and who has given to our secretary timely written notice, in proper form, of the stockholder’s intention to bring that business before the meeting. In order to bring business before an annual meeting, a stockholder’s notice must be received by the secretary of the company at the principal executive offices of the company not less than 90 calendar days or more than 120 calendar days before the first anniversary of the previous year’s annual meeting of stockholders, subject to certain exceptions contained in our bylaws. If the date of the applicable annual meeting is more than 30 days before or more than 60 days after such anniversary date, notice by a stockholder to be timely must be so received not earlier than 120 calendar days and not later than 90 calendar days before the date of such annual meeting or the tenth day following the date on which notice of the date of the annual meeting was mailed or public announcement of the date of such meeting is made by the company.
For the purposes of determining whether a stockholder’s notice is received in a timely manner for the annual meeting of stockholders in 2011, a stockholder’s notice must be received not later than February 15, 2011 and not before January 15, 2011. The adjournment or postponement of an annual meeting or the announcement does not commence a new time period for the giving of a stockholder’s notice as described above.
145
Table of Contents
Advance notice requirements for director nominations
Our bylaws establish advance notice procedures with respect to stockholder nomination of candidates for election as directors. Stockholders will only be able to consider nominations specified in the notice of meeting or brought before the meeting by or at the direction of our board of directors or by a stockholder who was a stockholder of record on the record date for the meeting, who is entitled to vote at the meeting and who has given to our secretary timely written notice, in proper form, of the stockholder’s intention to bring that business before the meeting. In order to nominate directors to our board of directors at an annual meeting, a stockholder’s notice must be received by the secretary of the company at the principal executive offices of the company not less than 90 calendar days or more than 120 calendar days before the first anniversary of the previous year’s annual meeting of stockholders, subject to certain exceptions contained in our bylaws. If the date of the applicable annual meeting is more than 30 days before or more than 60 days after such anniversary date, notice by a stockholder to be timely must be so received not earlier than 120 calendar days and not later than 90 calendar days before the date of such annual meeting or the tenth day following the date on which notice of the date of the annual meeting was mailed or public announcement of the date of such meeting is made by the company.
In order to nominate directors at a special meeting of stockholders called for the purpose of electing directors, a stockholder’s notice must be received by the secretary of the company at the principal executive offices of the company not earlier than 120 calendar days and not later than 90 calendar days before the date of the special meeting or the tenth day following the date on which notice of the date of the special meeting was mailed or public announcement of the date is made by the company. In the case of a special meeting of stockholders called due to a special meeting request for the purpose of electing directors, proper notice must be received not later than 15 days prior to the meeting.
For the purposes of determining whether a stockholder’s notice is received in a timely manner for the annual meeting of stockholders in 2011, a stockholder’s notice must be received not later than February 15, 2011 and not before January 15, 2011. The adjournment or postponement of an annual meeting or the announcement does not commence a new time period for the giving of a stockholder’s notice as described above.
Amendments to certificate of incorporation and bylaws
The DGCL provides generally that the affirmative vote of a majority of the outstanding shares entitled to vote is required to amend a corporation’s certificate of incorporation, unless the certificate of incorporation requires a greater percentage. Our certificate of incorporation provides that the following provisions may be amended by our stockholders only by a vote of at least two-thirds of the voting power of all then outstanding shares of our stock entitled to vote generally in the election of directors, voting together as a single class:
| • | the number, election and terms of the directors; |
| • | the ability of our board of directors to fill vacancies on the board; |
| • | the removal of directors; |
| • | the rights of the holders of preferred stock to elect directors; |
| • | the power of our board of directors to adopt, amend, alter or repeal the bylaws; |
| • | the limitation on stockholder action by written consent; |
| • | the limitation and notice requirements for special meetings; and |
| • | the amendment provision requiring that the above provisions be amended only with a two-thirds supermajority vote. |
146
Table of Contents
Undesignated preferred stock
The authorization of our undesignated preferred stock makes it possible for our board of directors to issue our preferred stock with voting or other rights or preferences that could impede the success of any attempt to change control of us.
Section 203 of the Delaware General Corporation Law
We are not governed by Section 203 of the Delaware General Corporation Law. Section 203 of the Delaware General Corporation Law regulates corporate acquisitions and provides that specified persons who, together with affiliates and associates, own, or within three years did own, 15% or more of the outstanding voting stock of a corporation may not engage in business combinations with the corporation for a period of three years after the date on which the person became an interested stockholder unless:
| • | prior to such time, the corporation’s board of directors approved either the business combination or the transaction which resulted in the stockholder becoming an interested stockholder; |
| • | upon consummation of the transaction which resulted in the stockholder becoming an “interested stockholder,” the interested stockholder owned at least 85% of the corporation’s outstanding voting stock at the time the transaction commenced, other than statutorily excluded shares; or |
| • | at or after the time a person became an interested stockholder, the business combination is approved by the corporation’s board of directors and authorized at an annual or special meeting of stockholders by the affirmative vote of at least two-thirds of the outstanding voting stock which is not owned by the interested stockholder. |
The term “business combination” is defined to include mergers, asset sales and other transactions in which the interested stockholder receives or could receive a financial benefit on other than a pro rata basis with other stockholders.
147
Table of Contents
DESCRIPTION OF CERTAIN INDEBTEDNESS
Senior ABL Facility
On the date of our emergence from bankruptcy, the Company, CSA U.S., or the U.S. Borrower, CSA Canada, or the Canadian Borrower and, together with the U.S. Borrower, the Borrowers, and certain subsidiaries of the U.S. Borrower entered into our senior ABL facility with certain lenders, Bank of America, N.A., as agent, or the Agent, for such lenders, Deutsche Bank Trust Company Americas, as syndication agent, and Banc of America Securities LLC, Deutsche Bank Securities Inc., UBS Securities LLC and Barclays Capital, as joint lead arrangers and bookrunners. This description is qualified in its entirety by reference to the complete text of the credit agreement governing our senior ABL facility, which is included as an exhibit to the registration statement of which this prospectus is a part.
General
Our senior ABL facility provides for an aggregate revolving loan availability of up to $125 million, subject to borrowing base availability, including a $45 million letter of credit sub-facility and a $20 million swing line sub-facility. Our senior ABL facility also provides for an uncommitted $25 million incremental loan facility, for a potential total senior ABL facility of $150 million (if requested by the Borrowers and the lenders agree to fund such increase). No consent of any lender (other than those participating in the increase) is required to effect any such increase.
Maturity
Any borrowings under our senior ABL facility will mature, and the commitments of the lenders under our senior ABL facility will terminate, on May 27, 2014.
Use of proceeds
There were no borrowings made under our senior ABL facility on the date of our emergence from bankruptcy. After our emergence from bankruptcy, proceeds from our senior ABL facility may be used by the Borrowers to pay certain unsecured claims, administrative expenses and administrative claims as contemplated by our plan of reorganization, to issue commercial and standby letters of credit, to finance ongoing working capital needs and for general corporate purposes.
Borrowing base
Loan (and letter of credit) availability under our senior ABL facility is subject to a borrowing base, which at any time is limited to the lesser of: (A) the maximum facility amount (subject to certain adjustments) and (B) (i) up to 85% of eligible accounts receivable; plus (ii) up to the lesser of 70% of eligible inventory or 85% of the appraised net orderly liquidation value of eligible inventory; minus reserves established by the Agent. The accounts receivable portion of the borrowing base is subject to certain formulaic limitations (including concentration limits). The inventory portion of the borrowing base is limited to eligible inventory, as determined by an independent appraisal. The borrowing base is also subject to certain reserves, which are established by the Agent (which may include changes to the advance rates indicated above). Loan availability under our senior ABL facility is apportioned, as follows: $100 million to the U.S. Borrower and $25 million to the Canadian Borrower.
Guarantees; security
The obligations of the U.S. Borrower under our senior ABL facility and cash management arrangements and interest rate, foreign currency or commodity swaps entered into by us, in each case with the lenders and their affiliates, or collectively, additional ABL secured obligations, are guaranteed on a senior secured basis by us and all of our U.S. subsidiaries (other than CS Automotive LLC), and the obligations of the Canadian Borrower under our senior ABL facility and additional ABL secured obligations of the Canadian Borrower and its Canadian subsidiaries are guaranteed on a senior secured basis by us, all of the Canadian subsidiaries of the Canadian Borrower and all of our U.S. subsidiaries. The U.S. Borrower guarantees the additional ABL secured
148
Table of Contents
obligations of its subsidiaries and the Canadian Borrower guarantees the additional ABL secured obligations of its Canadian subsidiaries. The obligations under our senior ABL facility and related guarantees are secured by a first priority lien on all of each Borrower’s and each guarantor’s existing and future personal property consisting of accounts receivable, payment intangibles, inventory, documents, instruments, chattel paper and investment property, certain money, deposit accounts and securities accounts and certain related assets and proceeds of the foregoing.
Interest
Borrowings under our senior ABL facility bear interest at a rate equal to, at the Borrowers’ option:
| • | in the case of borrowings by the U.S. Borrower, LIBOR or the base rate plus, in each case, an applicable margin; or |
| • | in the case of borrowings by the Canadian Borrower, BA rate, Canadian prime rate or Canadian base rate plus, in each case, an applicable margin. |
The initial applicable margin is 3.5% with respect to the LIBOR or BA-based borrowings and 2.5% with respect to base rate, Canadian prime rate and Canadian base rate borrowings. The applicable margin is subject, in each case, to quarterly performance pricing adjustments commencing six months after the closing date.
Fees
In addition to paying interest on outstanding principal under our senior ABL facility, the Borrowers are required to pay a fee in respect of committed but unutilized commitments equal to 0.50% per annum when usage of our senior ABL facility (as apportioned between the U.S. and Canadian facilities) is greater than 50% and 0.75% per annum when usage of our senior ABL facility is equal to or less than 50%. The Borrowers are also required to pay a fee on outstanding letters of credit under our senior ABL facility at a rate equal to the applicable margin in respect of LIBOR and BA-based borrowings plus a fronting fee at a rate of 0.125% per annum to the issuer of such letters of credit, together with customary issuance and other letter of credit fees. Our senior ABL facility also requires the payment of customary agency and administrative fees.
Voluntary prepayments
The Borrowers are able to voluntarily reduce the unutilized portion of the commitment amount and repay outstanding loans, in each case, in whole or in part, at any time without premium or penalty (other than customary breakage and related reemployment costs with respect to repayments of LIBOR-based borrowings).
Covenants; events of default
Our senior ABL facility includes affirmative and negative covenants that will impose substantial restrictions on our financial and business operations, including its ability to incur and secure debt, make investments, sell assets, pay dividends or make acquisitions. Our senior ABL facility also includes a requirement to maintain a monthly fixed charge coverage ratio of no less than 1.1 to 1.0 when availability under our senior ABL facility is less than specified levels. Our senior ABL facility also contains various events of default that are customary for comparable facilities.
Senior Notes due 2018
General
On May 11, 2010, we issued $450 million aggregate principal amount of 8 1/2% senior notes due 2018 in a private placement exempt from registration under the Securities Act through CSA Escrow Corporation, or the escrow issuer, an indirect wholly-owned non-debtor subsidiary of Cooper-Standard Automotive Inc., or CSA, our direct wholly-owned subsidiary. Upon our emergence from bankruptcy on May 27, 2010, CSA Escrow Corporation merged with and into CSA, with CSA as the surviving entity, and CSA assumed all of the obligations under the senior notes and the indenture governing the senior notes and the guarantees by the guarantors became effective. This description is qualified in its entirety by reference to the full text of the indenture governing our senior notes, which is included as an exhibit to the registration statement of which this prospectus is a part.
149
Table of Contents
Guarantees
Our senior notes are guaranteed, jointly and severally, on a senior unsecured basis, by the Company and all of CSA’s wholly-owned domestic restricted subsidiaries, or, collectively, the obligors. If CSA or any of its domestic restricted subsidiaries acquires or creates another wholly-owned domestic restricted subsidiary that guarantees certain debt of CSA or a guarantor, such newly acquired or created subsidiary will also guarantee our senior notes.
Ranking
Our senior notes and the guarantees constitute senior debt of the obligors and (1) rank equally in right of payment with all of the obligors’ existing and future senior debt, (2) rank senior in right of payment to all of the obligors’ existing and future subordinated debt, (3) are effectively subordinated in right of payment to all of the obligors’ existing and future secured indebtedness and secured obligations to the extent of the value of the collateral securing such indebtedness and obligations and (4) are structurally subordinated to all existing and future indebtedness and other liabilities of CSA’s non-guarantor subsidiaries (other than indebtedness and liabilities owed to CSA or one of its guarantor subsidiaries).
Optional redemption
CSA has the right to redeem our senior notes at the redemption prices set forth below:
| • | on and after May 1, 2014, all or a portion of our senior notes may be redeemed at a redemption price of 104.250% of the principal amount thereof if redeemed during the twelve-month period beginning on May 1, 2014, 102.125% of the principal amount thereof if redeemed during the twelve-month period beginning on May 1, 2015, and 100% of the principal amount thereof if redeemed on or after May 1, 2016, plus any accrued an unpaid interest to the redemption date; |
| • | prior to May 1, 2013, up to 35% of our senior notes issued under the indenture may be redeemed with the proceeds from certain equity offerings at a redemption price of 108.50% of the principal amount thereof, plus any accrued and unpaid interest to the redemption date; and |
| • | prior to May 1, 2014, all or a portion of our senior notes may be redeemed at a price equal to 100% of the principal amount thereof plus a make-whole premium. |
Change of control
If a change of control occurs, unless CSA has exercised its right to redeem all of our outstanding senior notes through an optional redemption (as described above), each noteholder shall have the right to require that CSA repurchase such noteholder’s senior notes at a purchase price in cash equal to 101% of the principal amount on the date of purchase plus accrued and unpaid interest, if any, to the date of purchase, subject to the right of the noteholders of record on the relevant record date to receive interest due on the relevant interest payment date.
Covenants
The indenture limits, among other things, the ability of CSA and its restricted subsidiaries to pay dividends or distributions, repurchase equity, prepay subordinated debt or make certain investments, incur additional debt or issue certain disqualified stock and preferred stock, incur liens, merge or consolidate with another company or sell all or substantially all of its assets, enter into transactions with affiliates and allow to exist certain restrictions on the ability of the subsidiary guarantors to pay dividends or make other payments to CSA, in each case, subject to exclusions and other customary exceptions. In addition, certain of these covenants will not be applicable during any period of time when our senior notes have an investment grade rating. The indenture also contains customary events of default.
150
Table of Contents
CERTAIN U.S. FEDERAL INCOME TAX CONSIDERATIONS
The following discussion is a summary of certain material U.S. federal income tax consequences of holding and disposing of our 7% preferred stock, common stock and warrants, converting our 7% preferred stock into common stock and exercising our warrants for common stock. This summary applies only to holders that are beneficial owners of our 7% preferred stock, common stock or warrants and that hold the 7% preferred stock, common stock or warrants as “capital assets” (generally, property held for investment). This summary is based on the U.S. Internal Revenue Code of 1986, as amended (the “Code”), its legislative history, existing final, temporary and proposed Treasury regulations, administrative pronouncements by the U.S. Internal Revenue Service (the “IRS”), and judicial decisions, all as in effect or in existence as of the date of this prospectus and all of which at any time may be repealed, revoked or modified or subject to differing interpretations so as to result in U.S. federal income tax consequences different from those discussed below, possibly with retroactive effect. The Company has not obtained, and does not intend to obtain, any ruling from the IRS concerning any of the U.S. federal income tax consequences discussed in this summary. Accordingly, there can be no assurance that the IRS will not assert a different position concerning any of the U.S. federal income tax consequences discussed below or that any such position would not be sustained by a court.
This summary does not purport to address all U.S. federal income tax consequences that may be relevant to a particular holder and you are urged to consult your own tax advisor regarding your specific tax situation. In particular, this summary does not address the tax consequences that may be relevant to holders in special tax situations including, for example:
| • | banks and financial institutions; |
| • | insurance companies; |
| • | brokers, dealers and traders in securities, currencies or commodities; |
| • | entities that are tax-exempt for U.S. federal income tax purposes and retirement plans, individual retirement accounts and tax-deferred accounts; |
| • | persons liable for alternative minimum tax; |
| • | certain U.S. expatriates; |
| • | regulated investment companies or real estate investment trusts; |
| • | persons that actually or constructively own 10% or more (measured by voting power or value) of our stock; |
| • | persons who acquired our 7% preferred stock, common stock or warrants pursuant to the exercise of any employee share option or otherwise as compensation, or pursuant to a tax free or tax deferred transaction; |
| • | persons whose functional currency is not the U.S. dollar; |
| • | partnerships, including entities and arrangements classified as partnerships for U.S. federal income tax purposes, and persons holding our 7% preferred stock, common stock or warrants through partnerships; or |
| • | persons holding our 7% preferred stock, common stock or warrants as part of a conversion, constructive sale, wash sale or other integrated transaction or a hedge, straddle or synthetic security. |
This discussion does not address any tax consequences other than U.S. federal income tax consequences.
In this discussion, a “U.S. Holder” is a beneficial owner of our 7% preferred stock, common stock or warrants that is, for U.S. federal income tax purposes: (a) an individual who is a citizen or resident of the United States; (b) a corporation (or other entity taxable as a corporation) organized under the laws of the United States, any State thereof or the District of Columbia; (c) an estate whose income is subject to U.S. federal income taxation regardless of its source; or (d) a trust if (1) a court within the United States is able to exercise primary supervision over its administration and one or more “United States persons” (as defined in the Code) have the authority to control all substantial decisions of the trust, or (2) the trust has a valid election in effect under applicable U.S. Treasury regulations to be treated as a “United States person”.
151
Table of Contents
In this discussion, a “Non-U.S. Holder” is a beneficial owner of 7% preferred stock, common stock or warrants that is not a U.S. Holder and not a partnership (or an entity or arrangement classified as a partnership for U.S. federal income tax purposes).
The tax treatment of a partner in a partnership (including an entity or arrangement classified as a partnership for U.S. federal income tax purposes) that holds our 7% preferred stock, common stock or warrants generally will depend on the partner’s status, the activities of the partnership and certain determinations made at the partner level. A prospective investor in our 7% preferred stock, common stock or warrants that is a partnership, and partners in such a partnerships, should consult their own tax advisors.
Based on the terms of the 7% preferred stock, the Company expects, and therefore this discussion assumes, that our 7% preferred stock should be treated as “common stock” for purposes of Section 305 of the Code. If our 7% preferred stock were not so treated the consequences may differ from those stated herein.
PROSPECTIVE INVESTORS ARE URGED TO CONSULT THEIR OWN TAX ADVISORS REGARDING THE APPLICATION OF THE U.S. FEDERAL INCOME TAX RULES TO THEIR PARTICULAR CIRCUMSTANCES AS WELL AS THE U.S. STATE AND LOCAL, AND FOREIGN AND OTHER TAX CONSEQUENCES TO THEM OF THE PURCHASE, OWNERSHIP AND DISPOSITION OF PREFERRED STOCK, COMMON STOCK AND WARRANTS, CONVERSION OF PREFERRED STOCK INTO COMMON STOCK AND EXERCISE OF WARRANTS FOR COMMON STOCK.
Taxation of U.S. Holders of Warrants
Sale or other taxable disposition of warrants
Upon the sale, exchange or other taxable disposition of a warrant, in general, a U.S. Holder will recognize taxable gain or loss measured by the difference, if any, between (i) the amount realized on the sale, exchange or other taxable disposition, and (ii) the U.S. Holder’s adjusted tax basis in the warrant disposed of. A U.S. Holder’s adjusted tax basis in the warrant generally will equal the U.S. Holder’s cost to acquire the warrant, as adjusted in the manner described below, under “—Adjustments under the warrants”. A U.S. Holder’s gain or loss generally will be capital gain or loss and generally will be long term capital gain or loss if, at the time of the sale or other disposition, the U.S. Holder’s holding period for the warrant is more than one year. Subject to limited exceptions, capital losses cannot be used to offset ordinary income. Long term capital gain recognized by a non-corporate U.S. Holder currently is subject to a preferential rate of U.S. federal income taxation.
Exercise of warrants
Because the warrants permit settlement though a cashless “net share settlement”, the U.S. federal income tax consequences of the exercise of a warrant are not entirely clear. It is expected that a U.S. Holder exercising a warrant would not recognize gain or loss for U.S. federal income tax purposes either (i) because the warrant should be treated as an option to acquire common stock or (ii) because exercise of the warrant for common stock is treated as a tax free “recapitalization”. In either case, a U.S. Holder’s initial tax basis in the common stock received (including any tax basis attributable to a fractional share of common stock), would equal such U.S. holder’s adjusted tax basis in the warrant exercised, increased by the amount of cash paid (if any) to exercise the warrant. If the warrant is treated as an option to acquire common stock, a U.S. Holder’s holding period for the common stock received on exercise generally would commence on the day following the exercise. If exercise of the warrant is treated as a tax free recapitalization, a U.S. Holder’s holding period generally would include the U.S. Holder’s holding period for the warrant exercised.
Despite the foregoing, the IRS could take the position that the exercise of a warrant constitutes a taxable exchange resulting in gain or loss, which would be capital gain or loss. The amount of capital gain or loss recognized on such an exchange and its character as short term or long term would depend on the position taken by the IRS regarding the nature of that exchange. If the U.S. Holder is treated as exchanging the warrants for
152
Table of Contents
shares of our common stock, the amount of capital gain or loss would be the difference between the fair market value of our common stock (and cash received in lieu of a fractional share of common stock), reduced by the amount of cash paid (if any) to exercise the warrants, and the U.S. Holder’s adjusted tax basis in the warrants exchanged. In that case, the U.S. Holder would have long term capital gain or loss if it has held the warrants for more than one year and the U.S. Holder’s initial tax basis in the common stock received would equal its fair market value.
Alternatively—specifically if the exercising U.S. Holder elects a cashless “net share settlement”—the IRS could take the position that the U.S. Holder is treated as selling a portion of the warrants or underlying common stock for cash that is used to pay the exercise price for the warrants, in which case the amount of capital gain or loss would be the difference between that exercise price and the U.S. Holder’s adjusted tax basis attributable to the warrants or common stock deemed sold. If the U.S. Holder is treated as selling warrants, such U.S. Holder would have long term capital gain or loss if the U.S. Holder held the warrants for more than one year at the time of exercise. If the U.S. Holder is treated as selling underlying common stock, such U.S. Holder would have short term capital gain or loss. The U.S. Holder’s initial tax basis in the common stock received would equal such U.S. Holder’s adjusted tax basis in the warrants deemed exercised, increased by the U.S. Holder’s deemed amount realized from the warrants or common stock deemed sold.
A U.S. Holder that receives cash in lieu of receipt of a fractional share of common stock should generally be treated as recognizing capital gain or loss in an amount equal to the difference, if any, between the amount of cash received and the adjusted tax basis allocable to the fractional share.
Subject to limited exceptions, capital losses cannot be used to offset ordinary income. Long term capital gain recognized by a non-corporate U.S. Holder currently is subject to a preferential rate of U.S. federal income taxation.
U.S. holders should consult their tax advisors regarding the tax consequences of the exercise of the warrants.
Lapse of warrants
A U.S. Holder that allows a warrant to lapse would generally recognize a loss for U.S. federal income tax purposes equal to the adjusted tax basis of the warrant. In general, such a loss would be a capital loss, and would be a short term or long term capital gain or loss depending on the U.S. Holder’s holding period for the warrant.
Adjustments under the warrants
Certain events, such as adjustment of the exercise price of the warrants, could result in a deemed taxable distribution to a U.S. Holder of warrants if the adjustment has the effect of increasing the proportionate interest of the U.S. Holder in our earnings and profits or assets, without regard to whether the U.S. Holder receives any cash or other property. However, adjustments to the exercise price made pursuant to a bona fide reasonable adjustment formula that has the effect of preventing the dilution of the interests of U.S. Holders of the warrants generally will not result in a taxable deemed distribution. In the event of a deemed taxable distribution, a U.S. Holder’s basis in its warrants will be increased by the amount of the taxable distribution. If a taxable deemed distribution occurs, such deemed distribution would be taxable as a dividend, return of capital or capital gain in accordance with the rules discussed below, and U.S. Holders may recognize income as a result even though they receive no cash or property.
153
Table of Contents
Taxation of U.S. Holders of 7% Preferred Stock and Common Stock
Dividends and Other Distributions on 7% Preferred Stock or Common Stock. Distributions on our 7% preferred stock and common stock will constitute dividends and will be included in a U.S. Holder’s gross income (as ordinary income) when paid to the extent of our current or accumulated earnings and profits as determined under U.S. federal income tax principles. Distributions on our 7% preferred stock and common stock received by a U.S. Holder that exceed our current and accumulated earnings and profits will be treated first as a non-taxable return of capital reducing (but, not below zero) the U.S. Holder’s adjusted tax basis in the 7% preferred stock or common stock and, to the extent such distributions exceed the U.S. Holder’s adjusted tax basis in the 7% preferred stock or common stock, as capital gain. Subject to certain exceptions, dividends received by non-corporate U.S. Holders currently are taxed at a maximum rate of 15% (effective for tax years through 2010), provided that certain holding period requirements are met. Dividends paid to corporate U.S. Holders will generally qualify for the dividends-received deduction, provided that certain holding period requirements are met. Notwithstanding the foregoing, a distribution of additional shares of our 7% preferred stock to U.S. Holders of the 7% preferred stock in connection with payment of the quarterly preferred dividend (as described in “Description of Capital Stock—Preferred Stock—Dividends”) generally would not be expected to constitute a taxable event for U.S. federal income tax purposes. A U.S. Holder that receives additional shares of our 7% preferred stock in connection with such a payment of the quarterly preferred dividend would reallocate its tax basis in the shares of 7% preferred stock prior to the distribution between such shares and the additional shares of 7% preferred stock received in accordance with their relative fair market values and the U.S. Holder’s holding period for the additional shares of 7% preferred stock received would include the holding period for the shares of 7% preferred stock on which such additional shares were distributed.
Certain events, such as adjustment of the conversion price of our 7% preferred stock could, in some circumstances, be deemed to result in the payment of a taxable distribution to the U.S. Holders of our 7% preferred stock if such event has the effect of increasing the proportionate interest of U.S. Holders of our 7% preferred stock in our earnings and profits or assets. A failure to fully adjust the conversion price of the 7% preferred stock to reflect a stock dividend or other event increasing the proportionate interest of U.S. Holders of the common stock in our earnings and profits or assets could, in some circumstances, be deemed to result in the payment of a taxable distribution to U.S. Holders of our common stock. In addition, a change in the exercise price of the warrants or another similar transaction could, in some circumstances, be deemed to result in the payment of a taxable distribution to U.S. Holders of the 7% preferred stock or common stock. However, adjustments to the conversion price made pursuant to a bona fide reasonable adjustment formula that has the effect of preventing the dilution of the interests of U.S. Holders of the 7% preferred stock or the common stock generally will not result in a taxable deemed distribution. If a taxable deemed distribution occurs, such deemed distribution would be taxable as a dividend, return of capital or capital gain in accordance with the rules discussed above, and U.S. Holders may recognize income as a result even though they receive no cash or property.
Conversion of 7% Preferred Stock into Common Stock. The conversion by a U.S. Holder of 7% preferred stock into common stock should not constitute a taxable event for U.S. federal income tax purposes (except to the extent of any cash received in lieu of a fractional share of common stock) and a U.S. Holder’s holding period and tax basis in the 7% preferred stock converted (other than tax basis attributable to a fractional share of common stock for which cash is received) should carry over to the common stock received upon conversion. A U.S. Holder that receives cash in lieu of receipt of a fractional share of common stock should generally be treated as recognizing capital gain or loss in an amount equal to the difference, if any, between the amount of cash received and the adjusted tax basis allocable to the fractional share.
Sale or Other Taxable Disposition of 7% Preferred Stock or Common Stock. Upon the sale or other taxable disposition of the 7% preferred stock or common stock, in general, a U.S. Holder will recognize taxable gain or loss measured by the difference, if any, between (i) the amount realized on the sale, exchange or other taxable disposition, and (ii) the U.S. Holder’s adjusted tax basis in the 7% preferred stock or the common stock disposed
154
Table of Contents
of. A U.S. Holder’s adjusted tax basis in the 7% preferred stock or common stock generally would be computed by reference to the U.S. Holder’s cost to acquire such 7% preferred stock or common stock, subject to certain adjustments, as discussed above. A U.S. Holder’s gain or loss generally will be capital gain or loss and generally will be long term capital gain or loss if, at the time of the sale or other disposition, the U.S. Holder’s holding period for the 7% preferred stock or the common stock is more than one year. Subject to limited exceptions, capital losses cannot be used to offset ordinary income. Long term capital gain recognized by a non-corporate U.S. holder currently is subject to a preferential rate of U.S. federal income taxation.
Taxation of Non-U.S. Holders of Warrants, 7% Preferred Stock and Common Stock
Dividends on 7% preferred stock or common stock and adjustments under the warrants
We will have to withhold U.S. federal income tax at a rate of 30%, or a lower rate under an applicable income tax treaty, from the gross amount of the dividends paid on our 7% preferred stock or common stock, as well as any deemed dividends resulting from adjustments to the exercise price of the warrants or adjustments to the conversion rate of the 7% preferred stock (each as described above), to a Non-U.S. holder that are not effectively connected with the Non-U.S. Holder’s conduct of a trade or business in the United States. Distributions, including taxable deemed distributions, will constitute dividends to the extent of our current or accumulated earnings and profits, as determined under U.S. federal income tax principles. Distributions that exceed our current and accumulated earnings and profits will be treated first as a non-taxable return of capital reducing (but, not below zero) the Non-U.S. Holder’s tax basis in the 7% preferred stock, common stock or warrants (as applicable) and, to the extent such distributions exceed the Non-U.S. Holder’s adjusted tax basis in the 7% preferred stock, common stock, or warrants (as applicable), as capital gain. In the case of any deemed dividends, the applicable withholding tax may apply to distributions on the Non-U.S. Holder’s common stock or 7% preferred stock, common stock deliverable upon conversion of 7% preferred stock or upon exercise of warrants, or on other proceeds we subsequently pay to such Non-U.S. Holder. Notwithstanding the foregoing, a distribution of additional shares of our 7% preferred stock to Non-U.S. Holders of the 7% preferred stock in connection with payment of the quarterly preferred dividend (as described in “Description of Capital Stock—Preferred Stock—Dividends”) generally would not be expected to constitute a taxable event for U.S. federal income tax purposes.
In order to claim the benefit of an applicable income tax treaty, a Non-U.S. holder will be required to provide a properly executed IRS Form W-8BEN (or other applicable form) in accordance with the applicable certification and disclosure requirements. Special rules apply to partnerships and other pass-through entities and these certification and disclosure requirements also may apply to beneficial owners of partnerships and other pass-through entities that hold our 7% preferred stock or common stock. A Non-U.S. Holder that satisfies the requirements for a reduced rate of U.S. federal withholding tax under an income tax treaty may obtain a refund or credit of any excess amounts withheld by filing an appropriate claim for a refund with the IRS. Non-U.S. Holders should consult their own tax advisors regarding their entitlement to benefits under a relevant income tax treaty and the manner of claiming the benefits.
Dividends that are effectively connected with a Non-U.S. Holder’s conduct of a trade or business in the United States (and, if required by an applicable income tax treaty are attributable to a permanent establishment in the United States) are taxed on a net income basis at the regular graduated U.S. federal income tax rates in the same manner as if the Non-U.S. Holder were a resident of the United States. In such cases, we will not have to withhold U.S. federal income tax if the Non-U.S. holder provides a properly executed IRS Form W-8ECI (or other applicable form) in accordance with the applicable certification and disclosure requirements. In addition, a “branch profits tax” may be imposed at a 30% rate, or a lower rate under an applicable income tax treaty, on a foreign corporation that has earnings and profits (attributable to dividends or otherwise) that are effectively connected with the conduct of a trade or business in the United States.
155
Table of Contents
Conversion of 7% preferred stock into common stock
The conversion by a Non-U.S. Holder of our 7% preferred stock into common stock should not constitute a taxable event for U.S. federal income tax purposes (except to the extent of any cash received in lieu of a fractional share of common stock, which will be treated in the manner described below) and a Non-U.S. Holder’s holding period and tax basis in the 7% preferred stock converted (other than tax basis attributable to a fractional share of common stock for which cash is received) should carry over to the common stock received upon conversion.
Sale or other disposition of 7% preferred stock, common stock or warrants and exercise of warrants
A Non-U.S. Holder generally will not be subject to U.S. federal income tax or any withholding thereof with respect to gain realized on a sale or other disposition of our 7% preferred stock, common stock or warrants, or with respect to an exercise of warrants unless one of the following applies:
| • | the gain is effectively connected with the Non-U.S. Holder’s conduct of a trade or business in the United States (and if required by an applicable income tax treaty, is attributable to a permanent establishment maintained by the Non-U.S. Holder in the United States); in these cases, the Non-U.S. Holder will generally be taxed on its net gain derived from the disposition or exercise at the regular graduated rates in the same manner as if the Non-U.S. Holder were a resident of the United States and, if the Non-U.S. Holder is a foreign corporation, the “branch profits tax” described above may also apply; |
| • | the Non-U.S. Holder is an individual who is present in the United States for 183 days or more in the taxable year of the disposition or exercise and meets certain other requirements; in this case, except as otherwise provided by an applicable income tax treaty, the gain, which may be offset by U.S. source capital losses, generally will be subject to a flat 30% U.S. federal income tax (even though the Non-U.S. Holder is not considered a resident alien under the Code); or |
| • | our 7% preferred stock, common stock or warrants constitute a United States real property interest by reason of our status as a “United States real property holding corporation,” or a “USRPHC,” for U.S. federal income tax purposes at any time during the shorter of (i) the 5-year period ending on the date you dispose of the 7% preferred stock, common stock or warrants, or exercise the warrants or (ii) the period you held the 7% preferred stock, common stock or warrants. |
Generally, a corporation is a USRPHC if the fair market value of its “U.S. real property interests” equals or exceeds 50% of the sum of the fair market value of its worldwide real property interests plus its other assets used or held for use in a trade or business. We believe that we are not currently, and we do not anticipate becoming in the future, a USRPHC.
Information Reporting and Backup Withholding
Information returns may be filed with the IRS in connection with payments of dividends on our 7% preferred stock and common stock and the proceeds of a sale or other disposition of our 7% preferred stock, common stock or warrants, or an exercise of warrants. A non-exempt U.S. Holder may be subject to U.S. backup withholding on these payments if it fails to provide its taxpayer identification number to the withholding agent and comply with certification procedures or otherwise establish an exemption from backup withholding.
A Non-U.S. Holder may be subject to U.S. information reporting and backup withholding on these payments unless the Non-U.S. Holder complies with certification procedures to establish that it is not a United States person. In addition, the amount of any dividends (including deemed dividends) on our 7% preferred stock, common stock or warrants paid to a Non-U.S. Holder, and the amount of any U.S. federal tax withheld thereform, must be annually reported to the IRS and the holder. This information may be made available by the IRS under the provisions of an applicable income tax treaty or agreement with the tax authorities of the country in which the Non-U.S. Holder resides.
156
Table of Contents
Payment of the proceeds of the sale or other disposition of the 7% preferred stock, common stock or warrants to or through a non-U.S. office of a U.S. broker or of a non-U.S. broker with certain specified U.S. connections generally will be subject to information reporting requirements, but not backup withholding, unless the Non-U.S. Holder certifies under penalties of perjury that it is not a United States person or an exemption otherwise applies. Payments of the proceeds of a sale or other disposition of the 7% preferred stock, common stock or warrants to or through a U.S. office of a broker generally will be subject to information reporting and backup withholding, unless the Non-U.S. Holder certifies under penalties of perjury that it is not a United States person or otherwise establishes an exemption.
The amount of any backup withholding from a payment will be allowed as a credit against the holder’s U.S. federal income tax liability and may entitle the holder to a refund, provided that the required information is timely furnished to the IRS.
Additional Withholding Requirements
Under recently enacted legislation, the relevant withholding agent may be required to withhold 30% of any dividends and the proceeds of a sale of our 7% preferred stock, common stock or warrants paid after December 31, 2012 to (i) a foreign financial institution (as defined pursuant to that legislation) unless such foreign financial institution agrees to verify, report and disclose its U.S. accountholders and meets certain other specified requirements or (ii) a non-financial foreign entity that is the beneficial owner of the payment unless such entity certifies that it does not have any substantial United States owners or provides the name, address and taxpayer identification number of each substantial United States owner and such entity meets certain other specified requirements. If payment of this withholding tax is made, Non-U.S. Holders that are otherwise eligible for an exemption from, or reduction of, U.S. withholding taxes with respect to such dividends or proceeds will be required to seek a credit or refund from the IRS to obtain the benefit of such exemption or reduction. Non-U.S. Holders should contact their own tax advisors regarding the particular consequences to them of this legislation.
157
Table of Contents
On behalf of the selling security holders, we are registering for resale 11,181,673 shares of our common stock, 1,010,345 shares of our 7% preferred stock, 4,335,176 shares of our common stock issuable upon conversion of our 7% preferred stock, 1,693,827 warrants to purchase shares of our common stock, and 1,693,827 shares of our common stock issuable upon exercise of our warrants. As used in this prospectus, “selling security holders” includes the successors-in-interest, donees, transferees or others who may later hold the selling security holders’ interests. This prospectus may also be used by transferees of the selling security holders, including broker-dealers or other transferees who borrow or purchase the securities to settle or close out short sales of shares of securities. Selling security holders will act independently of us in making decisions with respect to the timing, manner and size of each sale or non-sale related transfer. We will not receive any proceeds from sales by the selling security holders.
We expect that the selling security holders will sell their shares primarily through sales on the OTC Bulletin Board or any other stock exchange, market or trading facility on which our shares are traded or in private transactions. Sales of the securities may be made at fixed or negotiated prices and may be effected by means of one or more of the following transactions, which may involve cross or block transactions:
| • | ordinary brokerage transactions and transactions in which the broker-dealer solicits purchasers; |
| • | block trades in which the broker-dealer will attempt to sell the shares as agent, but may position and resell a portion of the block as principal to facilitate the transaction; |
| • | purchases by a broker-dealer as principal and resale by the broker-dealer for its account; |
| • | an exchange distribution in accordance with the rules of the applicable exchange; |
| • | privately negotiated transactions; |
| • | settlement of short sales; |
| • | transactions in which broker-dealers may agree with one or more selling security holders to sell a specified number of such shares at a stipulated price per share; |
| • | through the writing or settlement of options or other hedging transactions, whether through an options exchange or otherwise; or |
| • | a combination of any of the above or any other method permitted pursuant to applicable law. |
The selling security holders will have the sole discretion not to accept any purchase offer or make any sale of their securities if they deem the purchase price to be unsatisfactory at a particular time. To the extent required, this prospectus may be amended and supplemented from time to time to describe a specific plan of distribution.
Broker-dealers engaged by selling security holders may arrange for other broker-dealers to participate in sales. Broker-dealers may receive commissions or discounts from the selling security holders or, if any broker-dealer acts as agent for the purchase of securities, from the purchaser, in amounts to be negotiated. Selling security holders do not expect these commissions and discounts to exceed what is customary in the types of transactions involved.
In connection with sales of securities, or interests therein, selling security holders may enter into hedging transactions with broker-dealers or other financial institutions, which may in turn engage in short sales of the securities in the course of hedging the positions they assume. Selling security holders may also engage in short sales, puts and calls or other transactions in our securities or derivatives of our securities and may sell and deliver shares in connection with these transactions.
158
Table of Contents
Selling security holders and broker-dealers or agents involved in an arrangement to sell any of the offered securities may, under certain circumstances, be deemed to be “underwriters” with respect to securities they sell within the meaning of the Securities Act. Any profit on such sales and any discount, commission, concession or other compensation received by any such underwriter, broker-dealer or agent, may be deemed an underwriting discount and commission under the Exchange Act. No selling security holder has informed us that they have an agreement or understanding, directly or indirectly, with any person to distribute the securities. If a selling security holder should notify us that they have a material arrangement with a broker-dealer for the resale of their securities, we would be required to amend the registration statement of which this prospectus forms a part, and file a prospectus supplement to describe the agreement between the selling security holder and broker-dealer or agent, provide required information regarding the plan of distribution, and otherwise revise the disclosure in this prospectus as needed. We would also file the agreement between the selling security holder and the broker-dealer as an exhibit to the post-effective amendment to the registration statement.
We have agreed to pay all fees and expenses incurred by us incident to the registration of our securities, including SEC filing fees. Each selling security holder will be responsible for all costs and expenses in connection with the sale of their securities, including brokerage commissions or dealer discounts. Selling security holders will be indemnified by us against certain losses, claims, damages and liabilities, including certain liabilities under the Securities Act.
There can be no assurance that the selling security holders will sell any or all of the securities registered pursuant to the registration statement of which this prospectus forms a part.
To comply with the securities laws of certain jurisdictions, if applicable, the securities will be offered or sold in such jurisdictions only through registered or licensed brokers or dealers.
Selling security holders and other persons participating in the sale or distribution of the securities offered hereby, will be subject to applicable provisions of the Exchange Act and rules and regulations promulgated thereunder, including, without limitation, Regulation M. With certain exceptions, Regulation M restricts certain activities of, and limits the timing of purchases and sales of any of the securities by, selling security holders, affiliated purchasers and any broker-dealer or other person who participates in a distribution of the securities. Under Regulation M, these persons are precluded from bidding for or purchasing, or attempting to induce any person to bid for or purchase, any security subject to the distribution until the distribution is complete. Regulation M also prohibits any bids or purchases made in order to stabilize the price of a security in connection with the distribution of that security. All of these limitations may affect the marketability of the securities offered by this prospectus.
159
Table of Contents
The validity of the securities offered in this prospectus is being passed upon for us by Fried, Frank, Harris, Shriver & Jacobson LLP, New York, New York.
The consolidated financial statements of Cooper-Standard Holdings Inc. as of December 31, 2009 and 2008, and for each of the three years in the period ended December 31, 2009, appearing in this Prospectus and Registration Statement have been audited by Ernst & Young LLP, independent registered public accounting firm, as set forth in their report thereon (which contains an explanatory paragraph describing conditions that raise substantial doubt about our ability to continue as a going concern as described in note 3 to our consolidated financial statements) appearing elsewhere herein, and are included in reliance upon such report given on the authority of such firm as experts in accounting and auditing.
WHERE YOU CAN FIND MORE INFORMATION
We file periodic and annual reports and other information with the SEC. We are not required to send annual reports to security holders pursuant to the SEC’s proxy rules. You may read and copy any document that we file with the SEC at the SEC’s Public Reference Room at 100 F Street, N.E., Washington, D.C. 20549. You may obtain further information on the operation of the Public Reference Room by calling the SEC at 1-800-SEC-0330. Our SEC filings also are available to the public over the Internet at the SEC’s website at http://www.sec.gov.
Our principal executive offices are located at 39550 Orchard Hill Place Drive, Novi, Michigan 48375, and our telephone number at that address is (248) 596-5900. You may find additional information about us and our subsidiaries on our website at www.cooperstandard.com. The information contained on, or that can be accessed through, our website is not incorporated by reference in, and is not part of, this prospectus, and should not be relied upon in connection with any investment decision.
160
Table of Contents
| Page | ||||
| Audited Annual Financial Statements |
||||
| Report of Ernst & Young LLP, independent registered public accounting firm |
F-2 | |||
| Consolidated statements of operations for the years ended December 31, 2007, 2008 and 2009 |
F-3 | |||
| Consolidated balance sheets as of December 31, 2008 and 2009 |
F-4 | |||
| F-5 | ||||
| Consolidated statements of cash flows for the years ended December 31, 2007, 2008 and 2009 |
F-6 | |||
| F-7 | ||||
| F-59 | ||||
| Interim Financial Statements (as of September 30, 2010) |
||||
| F-60 | ||||
| F-61 | ||||
| F-62 | ||||
| F-63 | ||||
F-1
Table of Contents
REPORT OF INDEPENDENT REGISTERED PUBLIC ACCOUNTING FIRM
The Board of Directors and Management
Cooper-Standard Holdings Inc.
We have audited the accompanying consolidated balance sheets of Cooper-Standard Holdings Inc. and subsidiaries as of December 31, 2009 and 2008, and the related consolidated statements of operations, changes in equity (deficit) and cash flows for each of the three years in the period ended December 31, 2009. Our audits also included the financial statement schedule for the three years in the period ended December 31, 2009. These financial statements and schedule are the responsibility of the Company’s management. Our responsibility is to express an opinion on these financial statements and schedule based on our audits.
We conducted our audits in accordance with the standards of the Public Company Accounting Oversight Board (United States). Those standards require that we plan and perform the audit to obtain reasonable assurance about whether the financial statements are free of misstatement. We were not engaged to perform an audit of the Company’s internal control over financial reporting. Our audits included consideration of internal control over financial reporting as a basis for designing audit procedures that are appropriate in the circumstances, but not for the purpose of expressing an opinion on the effectiveness of the Company’s internal control over financial reporting. Accordingly, we express no such opinion. An audit also includes examining on a test basis, evidence supporting the amounts and disclosures in the financial statements, assessing the accounting principles used and significant estimates made by management, and evaluating the overall financial statement presentation. We believe that our audits provide a reasonable basis for our opinion.
In our opinion, the financial statements referred to above present fairly, in all material respects, the consolidated financial position of Cooper-Standard Holdings Inc. and subsidiaries at December 31, 2009 and 2008 and the consolidated results of their operations and their cash flows for each of the three years in the period ended December 31, 2009, in conformity with U.S. generally accepted accounting principles. Also, in our opinion, the related financial statement schedule for the three years in the period ended December 31, 2009, when considered in relation to the basic financial statements taken as a whole, presents fairly in all material respects the information set forth therein.
The accompanying consolidated financial statements have been prepared assuming that the Company will continue as a going concern. As more fully described in Note 3 to the consolidated financial statements, on August 3, 2009, Cooper Standard Holdings, Inc. and its wholly owned United States subsidiaries filed a voluntary petition for reorganization under Chapter 11 of the United States Bankruptcy Code. On August 4, 2009, the Company’s Canadian subsidiary, Cooper Standard Automotive Canada Limited commenced proceedings seeking relief from its creditors under Canada’s Companies’ Creditors Arrangement Act in the Ontario Superior Court of Justice in Toronto, Canada. As discussed in Note 3 to the consolidated financial statements, uncertainties inherent in the bankruptcy process raise substantial doubt about the Company’s ability to continue as a going concern. Management’s intentions with respect to these matters are also described in Note 3. The accompanying consolidated financial statements do not include any adjustments that might result from the outcome of this uncertainty.
As discussed in Note 2 to the consolidated financial statements, in 2009, the Company changed its method of accounting for and presentation of consolidated net income (loss) attributable to Cooper-Standard Holdings, Inc. and non-controlling interests.
As discussed in Notes 11 and 12 to the consolidated financial statements in 2008 and in 2007, the Company changed its method of accounting for pension and other postretirement benefit plans, respectively.
/s/ Ernst & Young LLP
Detroit, Michigan
March 31, 2010
F-2
Table of Contents
(DEBTOR-IN-POSSESSION)
CONSOLIDATED STATEMENTS OF OPERATIONS
(Dollar amounts in thousands)
| Year
Ended December 31, 2007 |
Year
Ended December 31, 2008 |
Year
Ended December 31, 2009 |
||||||||||
| Sales |
$ | 2,511,153 | $ | 2,594,577 | $ | 1,945,259 | ||||||
| Cost of products sold |
2,114,039 | 2,260,063 | 1,678,953 | |||||||||
| Gross profit |
397,114 | 334,514 | 266,306 | |||||||||
| Selling, administration, & engineering expenses |
222,134 | 231,709 | 199,552 | |||||||||
| Amortization of intangibles |
31,850 | 30,996 | 14,976 | |||||||||
| Impairment charges |
146,366 | 33,369 | 363,496 | |||||||||
| Restructuring |
26,386 | 38,300 | 32,411 | |||||||||
| Operating profit (loss) |
(29,622 | ) | 140 | (344,129 | ) | |||||||
| Interest expense, net of interest income |
(89,577 | ) | (92,894 | ) | (64,333 | ) | ||||||
| Equity earnings |
2,207 | 897 | 4,036 | |||||||||
| Reorganization items, net |
— | — | (17,367 | ) | ||||||||
| Other income (expense), net |
(468 | ) | (1,368 | ) | 9,919 | |||||||
| Loss before income taxes |
(117,460 | ) | (93,225 | ) | (411,874 | ) | ||||||
| Provision (benefit) for income tax expense |
32,946 | 29,295 | (55,686 | ) | ||||||||
| Consolidated net loss |
(150,406 | ) | (122,520 | ) | (356,188 | ) | ||||||
| Add: Net (income) loss attributed to noncontrolling interests |
(587 | ) | 1,069 | 126 | ||||||||
| Net loss attributable to Cooper-Standard Holdings Inc. |
$ | (150,993 | ) | $ | (121,451 | ) | $ | (356,062 | ) | |||
The accompanying notes are an integral part of these consolidated financial statements.
F-3
Table of Contents
(DEBTOR-IN-POSSESSION)
CONSOLIDATED BALANCE SHEETS
December 31, 2008 and 2009
(Dollar amounts in thousands)
| December 31, 2008 |
December 31, 2009 |
|||||||
| ASSETS |
||||||||
| Current assets: |
||||||||
| Cash and cash equivalents |
$ | 111,521 | $ | 380,254 | ||||
| Accounts receivable, net |
333,693 | 355,543 | ||||||
| Inventories, net |
116,952 | 111,575 | ||||||
| Prepaid expenses |
19,162 | 22,153 | ||||||
| Other |
42,226 | 76,454 | ||||||
| Total current assets |
623,554 | 945,979 | ||||||
| Property, plant, and equipment, net |
623,987 | 586,179 | ||||||
| Goodwill |
244,961 | 87,728 | ||||||
| Intangibles, net |
227,453 | 10,549 | ||||||
| Other assets |
98,296 | 106,972 | ||||||
| $ | 1,818,251 | $ | 1,737,407 | |||||
| LIABILITIES AND EQUITY (DEFICIT) |
||||||||
| Current liabilities: |
||||||||
| Debt payable within one year |
$ | 94,136 | $ | 18,204 | ||||
| Debtor-in-possession financing |
— | 175,000 | ||||||
| Accounts payable |
192,948 | 166,346 | ||||||
| Payroll liabilities |
69,601 | 71,523 | ||||||
| Accrued liabilities |
94,980 | 87,073 | ||||||
| Total current liabilities |
451,665 | 518,146 | ||||||
| Long-term debt |
1,049,959 | 11,059 | ||||||
| Pension benefits |
161,625 | 148,936 | ||||||
| Postretirement benefits other than pensions |
76,822 | 76,261 | ||||||
| Deferred tax liabilities |
28,265 | 7,875 | ||||||
| Other long-term liabilities |
30,253 | 19,727 | ||||||
| Liabilities subject to compromise |
— | 1,261,903 | ||||||
| Total liabilities |
1,798,589 | 2,043,907 | ||||||
| Equity (deficit): |
||||||||
| Common stock, $0.01 par value, 4,000,000 shares authorized at December 31, 2008 and December 31, 2009, 3,479,100 shares issued and outstanding at December 31, 2008, 3,482,612 shares issued and outstanding at December 31, 2009 |
35 | 35 | ||||||
| Additional paid-in capital |
354,894 | 356,316 | ||||||
| Accumulated deficit |
(280,216 | ) | (636,278 | ) | ||||
| Accumulated other comprehensive loss |
(59,536 | ) | (31,037 | ) | ||||
| Total Cooper-Standard Holdings Inc. equity (deficit) |
15,177 | (310,964 | ) | |||||
| Noncontrolling interests |
4,485 | 4,464 | ||||||
| Total equity (deficit) |
19,662 | (306,500 | ) | |||||
| Total liabilities and equity (deficit) |
$ | 1,818,251 | $ | 1,737,407 | ||||
The accompanying notes are an integral part of these consolidated financial statements.
F-4
Table of Contents
(DEBTOR-IN-POSSESSION)
CONSOLIDATED STATEMENTS OF CHANGES IN EQUITY (DEFICIT)
(Dollar amounts in thousands)
| Common Shares |
Common Stock |
Additional Paid-In Capital |
Retained Earnings (Deficit) |
Accumulated Other Comprehensive Income (Loss) |
Cooper- Standard Holdings Inc. Equity (Deficit) |
Non-Controlling Interest |
Total Equity (Deficit) |
|||||||||||||||||||||||||
| Balance at December 31, 2006 |
3,238,100 | $ | 32 | $ | 323,778 | $ | (4,151 | ) | $ | 1,050 | $ | 320,709 | $ | 3,254 | $ | 323,963 | ||||||||||||||||
| Investment noncontrolling interest |
2,453 | 2,453 | ||||||||||||||||||||||||||||||
| Adoption of Fin 48 |
(195 | ) | (195 | ) | (195 | ) | ||||||||||||||||||||||||||
| Issuance of common stock |
250,000 | 3 | 29,997 | 30,000 | 30,000 | |||||||||||||||||||||||||||
| Repurchase of common stock |
(4,500 | ) | (450 | ) | (450 | ) | (450 | ) | ||||||||||||||||||||||||
| Stock-based compensation |
1,549 | 1,549 | 1,549 | |||||||||||||||||||||||||||||
| Impact of change in measurement date on benefit plans net of ($1,020) tax effect |
25,846 | 25,846 | 25,846 | |||||||||||||||||||||||||||||
| Comprehensive income (loss): |
||||||||||||||||||||||||||||||||
| Net income (loss) for 2007 |
(150,993 | ) | (150,993 | ) | 587 | (150,406 | ) | |||||||||||||||||||||||||
| Other comprehensive income (loss): |
||||||||||||||||||||||||||||||||
| Benefit plan liability, net of ($1,934) tax effect |
6,794 | 6,794 | 6,794 | |||||||||||||||||||||||||||||
| Currency translation adjustment |
43,246 | 43,246 | 1,949 | 45,195 | ||||||||||||||||||||||||||||
| Fair value change of derivatives, net of $19 tax effect |
(7,948 | ) | (7,948 | ) | (7,948 | ) | ||||||||||||||||||||||||||
| Comprehensive income (loss): |
(108,901 | ) | 2,536 | (106,365 | ) | |||||||||||||||||||||||||||
| Balance at December 31, 2007 |
3,483,600 | 35 | 354,874 | (155,339 | ) | 68,988 | 268,558 | 8,243 | 276,801 | |||||||||||||||||||||||
| Impact of Change in measurement date on benefit plans |
(3,426 | ) | (3,426 | ) | (3,426 | ) | ||||||||||||||||||||||||||
| Transaction with affiliate |
(1,741 | ) | (1,741 | ) | ||||||||||||||||||||||||||||
| Dividends paid to noncontrolling interest |
(662 | ) | (662 | ) | ||||||||||||||||||||||||||||
| Repurchase of common stock |
(4,500 | ) | (540 | ) | (540 | ) | (540 | ) | ||||||||||||||||||||||||
| Stock-based compensation |
560 | 560 | 560 | |||||||||||||||||||||||||||||
| Comprehensive income (loss): |
||||||||||||||||||||||||||||||||
| Net loss for 2008 |
(121,451 | ) | (121,451 | ) | (1,069 | ) | (122,520 | ) | ||||||||||||||||||||||||
| Other comprehensive loss: |
||||||||||||||||||||||||||||||||
| Benefit plan liability, net of ($1,097) tax effect |
(53,614 | ) | (53,614 | ) | (53,614 | ) | ||||||||||||||||||||||||||
| Currency translation adjustment |
(58,929 | ) | (58,929 | ) | (286 | ) | (59,215 | ) | ||||||||||||||||||||||||
| Fair value change of derivatives, net of ($44) tax effect |
(15,981 | ) | (15,981 | ) | (15,981 | ) | ||||||||||||||||||||||||||
| Comprehensive loss |
(249,975 | ) | (1,355 | ) | (251,330 | ) | ||||||||||||||||||||||||||
| Balance at December 31, 2008 |
3,479,100 | 35 | 354,894 | (280,216 | ) | (59,536 | ) | 15,177 | 4,485 | 19,662 | ||||||||||||||||||||||
| Issuance of common stock |
3,512 | 88 | 88 | 88 | ||||||||||||||||||||||||||||
| Stock-based compensation |
1,334 | 1,334 | 1,334 | |||||||||||||||||||||||||||||
| Comprehensive income (loss): |
||||||||||||||||||||||||||||||||
| Net loss for 2009 |
(356,062 | ) | (356,062 | ) | (126 | ) | (356,188 | ) | ||||||||||||||||||||||||
| Other comprehensive income (loss): |
||||||||||||||||||||||||||||||||
| Benefit plan liability, net of $1,120 tax effect |
(3,499 | ) | (3,499 | ) | (3,499 | ) | ||||||||||||||||||||||||||
| Currency translation adjustment |
25,898 | 25,898 | 105 | 26,003 | ||||||||||||||||||||||||||||
| Fair value change of derivatives, net of ($3,843) tax effect |
6,100 | 6,100 | 6,100 | |||||||||||||||||||||||||||||
| Comprehensive loss |
(327,563 | ) | (21 | ) | (327,584 | ) | ||||||||||||||||||||||||||
| Balance at December 31, 2009 |
3,482,612 | $ | 35 | $ | 356,316 | $ | (636,278 | ) | $ | (31,037 | ) | $ | (310,964 | ) | $ | 4,464 | $ | (306,500 | ) | |||||||||||||
The accompanying notes are an integral part of these consolidated financial statements.
F-5
Table of Contents
(DEBTOR-IN-POSSESSION)
CONSOLIDATED STATEMENTS OF CASH FLOWS
(Dollar amounts in thousands)
| Year Ended December 31, 2007 |
Year Ended December 31, 2008 |
Year Ended December 31, 2009 |
||||||||||
| Operating Activities: |
||||||||||||
| Consolidated net loss |
$ | (150,406 | ) | $ | (122,520 | ) | $ | (356,188 | ) | |||
| Adjustments to reconcile consolidated net loss to net cash provided by (used in) operating activities: |
||||||||||||
| Depreciation |
104,199 | 109,109 | 98,801 | |||||||||
| Amortization of intangibles |
31,850 | 30,996 | 14,976 | |||||||||
| Impairment charges |
146,366 | 33,369 | 363,496 | |||||||||
| Reorganization items |
— | — | 17,367 | |||||||||
| Non-cash restructuring charges |
626 | 9,029 | 1,268 | |||||||||
| Gain on bond repurchase |
— | (1,696 | ) | (9,096 | ) | |||||||
| Amortization of debt issuance cost |
4,883 | 4,866 | 10,286 | |||||||||
| Deferred income taxes |
(1,296 | ) | 14,045 | (36,797 | ) | |||||||
| Changes in operating assets and liabilities, net of effects of businesses acquired: |
||||||||||||
| Accounts receivable |
(10,976 | ) | 163,279 | 14,886 | ||||||||
| Inventories |
14,836 | 28,062 | 9,914 | |||||||||
| Prepaid expenses |
3,440 | (2,880 | ) | (974 | ) | |||||||
| Accounts payable |
39,945 | (86,316 | ) | 50,081 | ||||||||
| Accrued liabilities |
(16,567 | ) | (28,148 | ) | 27,117 | |||||||
| Other |
18,473 | (14,702 | ) | (75,155 | ) | |||||||
| Net cash provided by operating activities |
185,373 | 136,493 | 129,982 | |||||||||
| Investing activities: |
||||||||||||
| Property, plant, and equipment |
(107,255 | ) | (92,125 | ) | (46,113 | ) | ||||||
| Acquisition of business, net of cash acquired |
(158,671 | ) | 4,937 | — | ||||||||
| Gross proceeds from sale-leaseback transaction |
4,806 | 8,556 | — | |||||||||
| Proceeds from sale of fixed assets |
1,096 | 4,775 | 642 | |||||||||
| Other |
7 | — | — | |||||||||
| Net cash used in investing activities |
(260,017 | ) | (73,857 | ) | (45,471 | ) | ||||||
| Financing activities: |
||||||||||||
| Proceeds from issuance of debtor-in-possession financing |
— | — | 175,000 | |||||||||
| Payments on debtor-in-possession financing |
— | — | (313 | ) | ||||||||
| Proceeds from issuance of long-term debt |
59,968 | — | — | |||||||||
| Increase in short term debt, net |
6,189 | 37,004 | 24,104 | |||||||||
| Principal payments on long-term debt |
(37,557 | ) | (16,528 | ) | (11,646 | ) | ||||||
| Proceeds from issuance of stock |
30,000 | — | 88 | |||||||||
| Debt issuance cost |
(3,104 | ) | (561 | ) | (20,592 | ) | ||||||
| Repurchase of common stock |
(450 | ) | (540 | ) | — | |||||||
| Repurchase of bonds |
— | (5,306 | ) | (737 | ) | |||||||
| Other |
— | — | 171 | |||||||||
| Net cash provided by financing activities |
55,046 | 14,069 | 166,075 | |||||||||
| Effects of exchange rate changes on cash |
4,153 | (6,061 | ) | 18,147 | ||||||||
| Changes in cash and cash equivalents |
(15,445 | ) | 70,644 | 268,733 | ||||||||
| Cash and cash equivalents at beginning of period |
56,322 | 40,877 | 111,521 | |||||||||
| Cash and cash equivalents at end of period |
$ | 40,877 | $ | 111,521 | $ | 380,254 | ||||||
The accompanying notes are an integral part of these consolidated financial statements.
F-6
Table of Contents
NOTES TO CONSOLIDATED FINANCIAL STATEMENTS
(Dollar amounts in thousands except per share amounts)
Note 1. Description of Business
Description of business
Cooper-Standard Holdings Inc. (the “Company”), through its wholly-owned subsidiary Cooper-Standard Automotive Inc., or CSA U.S, is a leading global manufacturer of fluid handling, body sealing, and Anti-Vibration Systems, or AVS, components, systems, subsystems, and modules, primarily for use in passenger vehicles and light trucks for global original equipment manufacturers, or OEMs, and replacement markets. The Company conducts substantially all of its activities through its subsidiaries.
The Company is one of the largest global producers of body sealing systems, one of the two largest North American producers in the AVS business, and the second largest global producer of the types of fluid handling products that we manufacture. We design and manufacture our products in each major automotive region of the world in close proximity to our customers through a disciplined and consistent approach to engineering and production. The Company operates in 66 manufacturing locations and nine design, engineering, and administrative locations in 18 countries around the world.
Note 2. Significant Accounting Policies
Principles of combination and consolidation—The consolidated financial statements include the accounts of the Company and the wholly owned and less than wholly owned subsidiaries controlled by the Company. All material intercompany accounts and transactions have been eliminated. Acquired businesses are included in the consolidated financial statements from the dates of acquisition.
Effective January 1, 2009 the Company adopted Financial Accounting Standards Board, or FASB, Accounting Standards Codification, or ASC, Topic 810, “Consolidation.” ASC Topic 810-10-65 establishes accounting and reporting standards for noncontrolling interests in subsidiaries. This statement requires the reporting of all noncontrolling interests as a separate component of equity, the reporting of consolidated net income (loss) as the amount attributable to both the parent and the noncontrolling interests and the separate disclosure of net income (loss) attributable to the parent and to the noncontrolling interests. In addition, this statement provides accounting and reporting guidance related to changes in noncontrolling ownership interests. Upon adoption, certain prior period amounts have been reclassified to conform to the current period financial statement presentation. These reclassifications have no effect on our previously reported results of operations. Refer to Note 17, Other Income (Expense) for additional information on the adoption of ASC Topic 810-10-65.
The equity method of accounting is followed for investments in which the Company does not have control, but does have the ability to exercise significant influence over operating and financial policies. Generally this occurs when ownership is between 20 to 50 percent. The cost method is followed in those situations where the Company’s ownership is less than 20 percent and the Company does not have the ability to exercise significant influence.
The Company’s investment in Nishikawa Standard Company, or NISCO, a 50 percent owned joint venture in the United States, is accounted for under the equity method. This investment totaled $11,905 and $13,400 at December 31, 2008 and 2009, respectively, and is included in other assets in the accompanying consolidated balance sheets.
The Company’s investment in Guyoung Technology Co. Ltd, or Guyoung, a 20 percent owned joint venture in Korea, is accounted for under the equity method. This investment totaled $1,179 and $1,370 at December 31, 2008 and 2009, respectively, and is included in other assets in the accompanying consolidated balance sheets.
F-7
Table of Contents
COOPER-STANDARD HOLDINGS INC.
NOTES TO CONSOLIDATED FINANCIAL STATEMENTS—(Continued)
(Dollar amounts in thousands except per share amounts)
The fair value of Guyoung’s stock has declined since the Company’s 2006 acquisition and during 2008, the Company determined that the decline in fair value was other than temporary and an impairment of $2,669 was recorded in equity earnings in our consolidated statement of operations.
The Company’s investment in Shanghai SAIC-Metzler Sealing Systems Co. Ltd., a 47.5 percent owned joint venture in China, is accounted for under the equity method. This investment totaled $20,166 and $20,994 at December 31, 2008 and 2009, respectively, and is included in other assets in the accompanying consolidated balance sheets.
Foreign currency—The financial statements of foreign subsidiaries are translated to U.S. dollars at the end-of-period exchange rates for assets and liabilities and a weighted average exchange rate for each period for revenues and expenses. Translation adjustments for those subsidiaries whose local currency is their functional currency are recorded as a component of accumulated other comprehensive income (loss) in stockholders’ equity. Transaction related gains and losses arising from fluctuations in currency exchange rates on transactions denominated in currencies other that the functional currency are recognized in earnings as incurred, except for those intercompany balances which are designated as long-term.
Cash and cash equivalents—The Company considers highly liquid investments with an original maturity of three months or less to be cash equivalents.
Accounts receivable—The Company records trade accounts receivable when revenue is recorded in accordance with its revenue recognition policy and relieves accounts receivable when payments are received from customers. Generally the Company does not require collateral for its accounts receivable.
Allowance for doubtful accounts—The allowance for doubtful accounts is established through charges to the provision for bad debts. The Company evaluates the adequacy of the allowance for doubtful accounts on a periodic basis. The evaluation includes historical trends in collections and write-offs, management’s judgment of the probability of collecting accounts, and management’s evaluation of business risk. This evaluation is inherently subjective, as it requires estimates that are susceptible to revision as more information becomes available. The allowance for doubtful accounts was $4,040 and $5,871 at December 31, 2008 and 2009, respectively.
Advertising expense—Expenses incurred for advertising are generally expensed when incurred. Advertising expense was $842 for 2007, $1,080 for 2008, and $345 for 2009.
Inventories—Inventories are valued at lower of cost or market. Cost is determined using the first-in, first-out method. Finished goods and work-in-process inventories include material, labor and manufacturing overhead costs. The Company records inventory reserves for inventory in excess of production and/or forecasted requirements and for obsolete inventory in production. As of December 31, 2008 and 2009, inventories are reflected net of reserves of $14,242 and $17,158, respectively.
Derivative financial instruments—Derivative financial instruments are utilized by the Company to reduce foreign currency exchange, interest rate, and commodity price risks. The Company has established policies and procedures for risk assessment and the approval, reporting, and monitoring of derivative financial instrument activities. On the date the derivative is established, the Company designates the derivative as either a fair value hedge, a cash flow hedge, or a net investment hedge in accordance with its established policy. The Company does not enter into financial instruments for trading or speculative purposes.
F-8
Table of Contents
COOPER-STANDARD HOLDINGS INC.
NOTES TO CONSOLIDATED FINANCIAL STATEMENTS—(Continued)
(Dollar amounts in thousands except per share amounts)
Income taxes—Income tax expense in the consolidated and combined statements of operations is accounted for in accordance with ASC Topic 740, Accounting for Income Taxes, which requires the recognition of deferred income taxes using the liability method.
Deferred tax assets or liabilities are determined based on differences between financial reporting and tax bases of assets and liabilities and are measured using enacted tax laws and rates. A valuation allowance is provided on deferred tax assets if we determine that it is more likely than not that the asset will not be realized.
Long-lived assets—Property, plant, and equipment are recorded at cost and depreciated using primarily the straight-line method over their estimated useful lives. Leasehold improvements are amortized over the expected life of the asset or term of the lease, whichever is shorter. Intangibles with finite lives, which include technology, customer contracts, and customer relationships, are amortized over their estimated useful lives. The Company evaluates the recoverability of long-lived assets when events and circumstances indicate that the assets may be impaired and the undiscounted net cash flows estimated to be generated by those assets are less than their carrying value. If the net carrying value exceeds the fair value, an impairment loss exists and is calculated based on a discounted cash flow analysis or estimated salvage value. Discounted cash flows are estimated using internal budgets and assumptions regarding discount rates and other factors.
Pre-Production Costs Related to Long Term Supply Arrangements—Costs for molds, dies, and other tools owned by us to produce products under long-term supply arrangements are recorded at cost in property, plant, and equipment and amortized over the lesser of three years or the term of the related supply agreement. The amounts capitalized were $10,896 and $9,324 at December 31, 2008 and 2009, respectively. Costs incurred during the engineering and design phase of customer-owned tooling projects are expensed as incurred unless a contractual arrangement for reimbursement by the customer exists. Reimbursable tooling costs included in other assets were $3,822 and $2,561 at December 31, 2008 and 2009, respectively. Development costs for tools owned by the customer are recorded in accounts receivable in the accompanying combined balance sheets if considered a receivable in the next twelve months. At December 31, 2008 and 2009, $77,769 and $65,351, respectively, was included in accounts receivable for customer-owned tooling of which $32,768 and $40,510, respectively, was not yet invoiced to the customer.
Goodwill—Goodwill is not amortized but is tested annually for impairment by reporting unit which is determined in accordance with ASC Topic 350 “Intangibles-Goodwill and Other”. The Company utilizes an income approach to estimate the fair value of each of its reporting units. The income approach is based on projected debt-free cash flow which is discounted to the present value using discount factors that consider the timing and risk of cash flows. The Company believes that this approach is appropriate because it provides a fair value estimate based upon the reporting unit’s expected long-term operating cash flow performance. Fair value is estimated using recent automotive industry and specific platform production volume projections, which are based on both third party and internally-developed forecasts, as well as commercial, wage and benefit, inflation and discount rate assumptions. Other significant assumptions include the weighted average cost of capital, terminal value growth rate, terminal value margin rates, future capital expenditures and changes in future working capital requirements. While there are inherent uncertainties related to the assumptions used and to management’s application of these assumptions to this analysis, the Company believes that the income approach provides a reasonable estimate of the fair value of its reporting units. The Company conducts its annual goodwill impairment analysis as of October 1st of each fiscal year.
Revenue Recognition and Sales Commitments—We generally enter into agreements with our customers to produce products at the beginning of a vehicle’s life. Although such agreements do not generally provide for minimum quantities, once we enter into such agreements, fulfillment of our customers’ purchasing requirements
F-9
Table of Contents
COOPER-STANDARD HOLDINGS INC.
NOTES TO CONSOLIDATED FINANCIAL STATEMENTS—(Continued)
(Dollar amounts in thousands except per share amounts)
can be our obligation for an extended period or the entire production life of the vehicle. These agreements generally may be terminated by our customer at any time. Historically, terminations of these agreements have been minimal. In certain limited instances, we may be committed under existing agreements to supply products to our customers at selling prices which are not sufficient to cover the direct cost to produce such products. In such situations, we recognize losses as they are incurred.
We receive blanket purchase orders from many of our customers on an annual basis. Generally, such purchase orders and related documents set forth the annual terms, including pricing, related to a particular vehicle model. Such purchase orders generally do not specify quantities. We recognize revenue based on the pricing terms included in our annual purchase orders as our products are shipped to our customers. As part of certain agreements, we are asked to provide our customers with annual cost reductions. We accrue for such amounts as a reduction of revenue as our products are shipped to our customers. In addition, we generally have ongoing adjustments to our pricing arrangements with our customers based on the related content and cost of our products. Such pricing accruals are adjusted as they are settled with our customers.
Amounts billed to customers related to shipping and handling are included in sales in our consolidated statements of operations. Shipping and handling costs are included in cost of sales in our consolidated statements of operations.
Research and development—Costs are charged to selling, administration and engineering expense as incurred and totaled, $77,183 for 2007, $81,942 for 2008, and $62,880 for 2009.
Stock-based compensation—Effective January 1, 2006, the Company adopted ASC Topic 718, “Compensation-Stock Compensation,” using the prospective method. The prospective method requires compensation cost to be recognized for all share-based payments granted after the effective date of ASC 718. All awards granted prior to the effective date of ASC 718 are accounted for in accordance with Accounting Principles Board Opinion, or APB, No. 25, “Accounting for Stock Issued to Employees.”
Use of estimates—The preparation of financial statements in conformity with accounting principles generally accepted in the United States requires management to make estimates and assumptions that affect reported amounts of (1) revenues and expenses during the reporting period and (2) assets and liabilities, as well as disclosure of contingent assets and liabilities, at the date of the financial statements. Actual results could differ from those estimates.
Reclassifications—Certain prior period amounts have been reclassified to conform to the current year presentation. For further segment reclassifications, see Note 20. “Business Segments.”
Going Concern
The Company is operating pursuant to chapter 11 of the Bankruptcy Code and continuation as a going concern is contingent upon, among other things, the Company’s ability to complete and execute a plan of reorganization. The accompanying consolidated financial statements have been prepared assuming the Company will continue as a going concern and contemplate the realization of assets and the satisfaction of liabilities upon execution of the plan of reorganization. For additional details regarding the Company’s reorganization under chapter 11 of the bankruptcy code and the current status of its plan of reorganization see Note 3. “Reorganization under Chapter 11 of the Bankruptcy Code.”
F-10
Table of Contents
COOPER-STANDARD HOLDINGS INC.
NOTES TO CONSOLIDATED FINANCIAL STATEMENTS—(Continued)
(Dollar amounts in thousands except per share amounts)
Recent accounting pronouncements
In June 2009, the FASB approved the “FASB Accounting Standards Codification,” or the Codification or ASC, as the single source of authoritative nongovernmental U.S. GAAP. The Codification does not change current U.S. GAAP, but is intended to simplify user access to all authoritative U.S. GAAP by providing all authoritative literature related to a particular topic in one place. All existing accounting standard documents will be superseded and all other accounting literature not included in the Codification will be considered nonauthoritative. The Codification is effective for interim and annual periods ending after September 15, 2009. The adoption of the Codification changed the Company’s references to U.S. GAAP accounting standards, but did not impact the Company’s results of operating financial position or liquidity.
In May 2009, the FASB issued ASC Topic 855, “subsequent events,” which provides guidance to establish general standards of accounting for and disclosures of events that occur after the balance sheet date but before financial statements are issued or available to be issued. ASC Topic 855 also requires entities to disclose the date through which subsequent events were evaluated as well as the rationale for why that date was selected. ASC Topic 855 is effective for interim and annual periods ending after June 15, 2009. The Company adopted this statement effective June 30, 2009. See Note 26. “Subsequent Events” for additional information.
In April 2009, the FASB issued FSP ASC Topic 320-10-65, which extends the Disclosures about Fair Value of Financial Instruments, to interim reporting periods. The provisions of this standard are effective for interim and annual reporting periods ending after June 15, 2009. The effects of adoption were not significant. See Note 21. “Fair Value of Financial Instruments,” for additional disclosures related to the fair value of the Company’s Prepetition Credit Facility and Notes.
In August 2009, the FASB issued ASU No. 2009-05 which amends “Fair Value Measurements and Disclosures—Overall” (ASC Topic 820-10) to provide guidance on the fair value measurement of liabilities. This update requires clarification for circumstances in which a quoted price in an active market for the identical liability is not available, a reporting entity is required to measure fair value using one or more of the following techniques: 1) a valuation technique that uses either the quoted price of the identical liability when traded as an asset or quoted prices for similar liabilities or similar liabilities when traded as an asset; or 2) another valuation technique that is consistent with the principles in ASC Topic 820 such as the income and market approach to valuation. The amendments in this update also clarify that when estimating the fair value of a liability, a reporting entity is not required to include a separate input or adjustment to other inputs relating to the existence of a restriction that prevents the transfer of the liability. This update further clarifies that if the fair value of a liability is determined by reference to a quoted price in an active market for an identical liability, that price would be considered a Level 1 measurement in the fair value hierarchy. Similarly, if the identical liability has a quoted price when traded as an asset in an active market, it is also a Level 1 fair value measurement if no adjustments to the quoted price of the asset are required. This update is effective for the fourth quarter 2009.
In December 2008, the FASB issued “Employers’ Disclosures about Postretirement Benefit Plan Assets” (ASC Topic 715-20-65). This guidance will expand disclosure by requiring the following new disclosures: 1) how investment allocation decisions are made by management; 2) major categories of plan assets; and 3) significant concentrations of risk. Additionally, ASC 715-20-65 will require an employer to disclose information about the valuation of plan assets similar to that required in ASC Topic 820 Fair Value Measurements and Disclosures. This guidance is effective for fiscal year ending December 31, 2009. The principal impact was expanded disclosure regarding the Company’s benefit plan assets.
In March 2008, the FASB issued “Disclosures About Derivative Instruments and Hedging Activities-an Amendment of FASB Statement No. 133” (ASC Topic 815). ASC Topic 815 requires entities that utilize
F-11
Table of Contents
COOPER-STANDARD HOLDINGS INC.
NOTES TO CONSOLIDATED FINANCIAL STATEMENTS—(Continued)
(Dollar amounts in thousands except per share amounts)
derivative instruments to provide qualitative disclosures about their objectives and strategies for using such instruments, as well as any details of credit risk related contingent features contained within derivatives. ASC Topic 815 also requires entities to disclose additional information about the amounts and locations of derivatives located within the financial statements, how the accounting provisions have been applied and the impact that hedges have on an entity’s financial position, financial performance, and cash flows. The Company adopted this statement as of January 1, 2009.
In September 2006, the FASB issued “Fair Value Measurements” (ASC Topic 820). ASC Topic 820 defines fair value, establishes a framework for measuring fair value in generally accepted accounting principles, and expands disclosures about fair value measurement. This statement applies under other accounting pronouncements that require or permit fair value measurements and does not require any new fair value measurements. The Company adopted ASC Topic 820 as of January 1, 2008 except for non-financial assets and liabilities recognized or disclosed at fair value on a non-recurring basis, for which the effective date was fiscal years beginning after November 15, 2008. See Note 21, Fair Value of Financial Instruments, for additional discussion of ASC Topic 820.
Note 3. Reorganization Under Chapter 11 of the Bankruptcy Code
Filing of Bankruptcy Cases
During 2009, the Company’s revenues were adversely affected, particularly in the first half of the year, by the sharp decline in worldwide automotive production that followed the disruption in the global financial markets that began in 2008. Faced with a highly-leveraged balance sheet with debt exceeding $1.2 billion and unfavorable market conditions, including the severe downturn in the automotive industry and the accompanying decrease in production volumes, diminishing availability of credit and the overall deterioration in the U.S. economy, the Company dedicated a substantial portion of its cash flows from operations to the payment of principal and interest on the Company’s indebtedness. Due to the adverse business impact of these factors, the Company’s ability to maintain sufficient liquidity, satisfy its financial covenant requirements under the Prepetition Credit Agreement (as defined below) and make interest and principal payments on its outstanding indebtedness became uncertain. Recognizing the need for a comprehensive solution for these financial issues, prior to seeking bankruptcy protection, the Company engaged in discussions regarding possible alternatives to filing for bankruptcy, including refinancing a portion of its indebtedness with its key creditors. However, the Company was unable to complete those negotiations prior to seeking bankruptcy protection.
On August 3, 2009, the Company and each of its direct and indirect wholly-owned U.S. subsidiaries (collectively with the Company, the “Debtors”) filed voluntary petitions for relief under Chapter 11 of Title 11 of the United States Code (the “Bankruptcy Code”) in the United States Bankruptcy Court for the District of Delaware (the “Bankruptcy Court”). The Debtors’ chapter 11 cases (the “Chapter 11 Cases”) are being jointly administered under Case No. 09-12743(PJW). The Debtors continue to operate their businesses and manage their properties as “debtors-in-possession” under the jurisdiction of the Bankruptcy Court and in accordance with the
applicable provisions of the Bankruptcy Code and orders of the Bankruptcy Court. On August 14, 2009, the Official Committee of Unsecured Creditors (the “Creditors’ Committee”) was appointed in the Chapter 11 Cases.
On August 4, 2009, the Company’s Canadian subsidiary, Cooper-Standard Automotive Canada Limited, a corporation incorporated under the laws of Ontario ( “CSA Canada”), commenced proceedings seeking relief from its creditors under Canada’s Companies’ Creditors Arrangement Act (the “Canadian Proceedings”) in the Ontario Superior Court of Justice in Toronto, Canada (Commercial List) (the “Canadian Court”), court file no. 09-8307-00CL. The Canadian court has granted the Canadian debtors a stay of any Canadian proceedings to
F-12
Table of Contents
COOPER-STANDARD HOLDINGS INC.
NOTES TO CONSOLIDATED FINANCIAL STATEMENTS—(Continued)
(Dollar amounts in thousands except per share amounts)
allow the Debtors to pursue confirmation of a plan of reorganization in the U.S. proceedings. The stay is currently in effect through May 31, 2010. The Company (and its legal counsel) believe the Canadian court will continue to issue this stay through completion of the chapter 11 proceedings. The Company’s subsidiaries and operations outside the United States and Canada are not included in the Chapter 11 Cases or the Canadian Proceedings (other than CSA Canada) and continue to operate in the ordinary course of business.
As a result of the Chapter 11 Cases, realization of assets and liquidation of liabilities are subject to uncertainty. While operating as debtors-in-possession under the protection of chapter 11 of the Bankruptcy Code, and subject to Bankruptcy Court approval or otherwise as permitted in the normal course of business, the Debtors may sell or otherwise dispose of assets and liquidate or settle liabilities for amounts other than those reflected in the consolidated financial statements, and may pursue various strategic alternatives as deemed appropriate by our board of directors to serve the best interests of the Company and its stakeholders.
In general, under the priority scheme established by the Bankruptcy Code, post-petition liabilities and secured claims must be satisfied before prepetition unsecured creditors and interest holders can receive any distribution or retain any property under a chapter 11 plan of reorganization. The ultimate recovery, if any, to the holders of the Company’s 7% Senior Notes due 2012 (the “Senior Notes”) and 8 3/8% Senior Subordinated Notes due 2014 (the “Senior Subordinated Notes” and, together with the Senior Notes, the “Notes,” and the holders of the Notes, the “Noteholders”) and other interest holders will not be determined until confirmation of a chapter 11 plan or plans of reorganization. No assurance can be given as to what values, if any, will be ascribed in the Chapter 11 Cases to each of these constituencies or what types or amounts of distributions, if any, they will receive. If certain requirements of the Bankruptcy Code are met, a chapter 11 plan of reorganization can be confirmed notwithstanding its rejection by such holders and notwithstanding the fact that such holders do not receive or retain any property on account of their interests under the chapter 11 plan. Accordingly, the Company urges that the appropriate caution be exercised with respect to existing and future investments in the Company’s securities as the value and prospects are highly speculative. At this time there is no assurance we will be able to restructure as a going concern or successfully obtain confirmation of and implement a plan of reorganization.
Filing of the Original Chapter 11 Plan of Reorganization and Original Disclosure Statement
Prior to commencing the Chapter 11 Cases and since the filing of the Debtors’ petition for relief under the Bankruptcy Code, the Debtors have sought a consensual restructuring of their balance sheets so as to be able to emerge from chapter 11 with an appropriate capital structure that would enable the Debtors to remain competitive. After exploring a number of restructuring alternatives, which included discussions with the Creditors’ Committee, the lenders under the Prepetition Credit Agreement (as defined below) and certain Noteholders (the “First Backstop Parties”) came forward with proposal to backstop an equity rights offering, the proceeds of which would be used to pay the claims under the Prepetition Credit Facility in full. After further negotiations with the First Backstop Parties and the Creditors’ Committee regarding the proposal, on February 1, 2010, the Debtors filed their Joint Chapter 11 Plan of Reorganization (the “Original Plan”), an accompanying Disclosure Statement (the “Original Disclosure Statement”) and a Commitment Agreement, dated February 1, 2010 (the “Original Equity Commitment Agreement,” which the Company entered into with the First Backstop Parties). The Original Plan provided for a backstopped $245,000 equity rights offering which, when combined with proposed exit financing, would allow the Debtors to pay the claims under the Prepetition Credit Agreement in full, in cash, while distributing equity in the Company upon emergence from chapter 11 to the Noteholders, as well as rights to purchase additional equity.
F-13
Table of Contents
COOPER-STANDARD HOLDINGS INC.
NOTES TO CONSOLIDATED FINANCIAL STATEMENTS—(Continued)
(Dollar amounts in thousands except per share amounts)
Filing of Amended Chapter 11 Plan of Reorganization and Disclosure Statement
Shortly after filing the Original Plan, certain Noteholders (the “Second Backstop Parties” and, with the “First Backstop Parties”, the “New Backstop Parties”) approached the Debtors with an alternative proposal to backstop a rights offering that contained certain advantages when compared to the recovery provided for in the Original Plan. While the Debtors made significant progress negotiating a commitment agreement with the Second Backstop Parties, the Debtors had significant concerns about going forward with such alternative proposal for various reasons including, without limitation, uncertainty about receiving sufficient votes to confirm any plan of reorganization based on such alternative.
After extensive, arm’s-length negotiations between the Debtors, the Creditors’ Committee, the First Backstop Parties and the Second Backstop Parties, all parties agreed upon the terms of a revised restructuring proposal incorporated in a new Commitment Agreement, dated March 19, 2010 (the “Equity Commitment Agreement”), which terminated the Original Equity Commitment Agreement upon execution, and the Debtors filed with the Bankruptcy Court on March 20, 2010 a First Amended Joint Chapter 11 Plan of Reorganization (as amended by the Second Amended Joint Chapter 11 Plan of Reorganization, dated March 26, 2010, the “Plan of Reorganization”) and an accompanying new Disclosure Statement (as amended by the First Amended Disclosure Statement, dated March 26, 2010, the “Disclosure Statement”). The Disclosure Statement and the Equity Commitment Agreement were approved by the Bankruptcy Court on March 26, 2010. The Equity Commitment Agreement and the Plan of Reorganization provide for a backstopped equity rights offering and the purchase of new common stock and new preferred stock of the Company by the New Backstop Parties (as described below), with aggregate proceeds to the Company of $355,000 that would unimpair the claims under the Prepetition Credit Agreement and the Senior Notes and improve the recovery to the Senior Subordinated Noteholders. The Equity Commitment Agreement is subject to certain customary conditions, including, among other things, confirmation of the Plan of Reorganization. Under the Plan of Reorganization, holders of Senior Notes will receive payment in full, in cash, provided that certain of the New Backstop Parties have each agreed to forgo their right as holders of Senior Notes to receive payment in full, in cash, and in lieu thereof, have agreed to accept their pro rata share of 20.95% of the new common stock of the Company. In addition, holders of Senior Subordinated Notes will receive a distribution of 8% of the new common stock of the Company and warrants to acquire an additional 3% of the new common stock of the Company that may be exercised at a strike price of $27.33 per share, and eligible noteholders of Senior Subordinated Notes will receive rights to purchase 39.6% of the new common stock of the Company pursuant to the rights offering at a subscription price of $21.54 per share. In addition, the New Backstop Parties have agreed to purchase 11.75% of the new common stock of the Company at a price per share of $27.07 and 1,000,000 shares of new preferred stock of the Company at a price per share of $100.00 and will receive warrants to acquire an additional 7% of the new common stock of the Company that may be exercised at a strike price of $27.33 per share.
In order for the Debtors to successfully emerge from chapter 11, the Bankruptcy Court must first confirm a chapter 11 plan with respect to the Debtors that satisfies the requirements of the Bankruptcy Code. To be confirmed, a chapter 11 plan would, among other things, need to resolve the Debtors’ prepetition obligations, set forth the revised capital structure of the newly reorganized entity and provide for corporate governance subsequent to exit from bankruptcy.
In order for the Amended Plan to be confirmed by the Bankruptcy Court pursuant to section 1129(b) of the Bankruptcy Code, at least one class of impaired claims must accept the Plan of Reorganization, determined without including votes to accept the Amended Plan cast by “insiders,” as that term is defined in section 101(31) of the Bankruptcy Code. A class of claims has accepted a plan if such plan has been accepted by creditors that hold at least two-thirds in amount and more than one-half in number of the allowed claims of such class held by creditors that have accepted or rejected such plan. The New Backstop Parties (which hold a substantial majority
F-14
Table of Contents
COOPER-STANDARD HOLDINGS INC.
NOTES TO CONSOLIDATED FINANCIAL STATEMENTS—(Continued)
(Dollar amounts in thousands except per share amounts)
in dollar amount of the outstanding principal amount of Senior Subordinated Notes) support the Amended Plan and have agreed to vote in favor of the Amended Plan. In addition, confirmation of the Amended Plan is subject to the satisfaction of numerous conditions, including, among other things, consummation of the rights offering and entry into a new debt agreement and a new secured working capital facility.
Under the Bankruptcy Code, the exclusive period in which the Debtors may file a chapter 11 plan or plans of reorganization is 120-days from the date of the filing of the petition. The exclusive period in which the Debtors may solicit acceptances for any chapter 11 plan or plans of reorganization is 180-days from the date of the filing of the petition. The Bankruptcy Code also provides that the Bankruptcy Court may extend the 120-day plan exclusivity period up to 18 months after the petition date and the 180-day solicitation exclusivity period up to 20 months after the petition date. The Debtors’ exclusive period to file a chapter 11 plan or plans of reorganization has been extended to June 29, 2010. The Debtors’ exclusive period to solicit any plan or plans has been extended to August 30, 2010. If the Debtors’ exclusivity periods expire, other parties in interest will be allowed to file their own plans and solicit acceptances in connection therewith.
Debtor-in-Possession Financing
In connection with the commencement of the Chapter 11 Cases and the Canadian Proceedings, the Company entered into a Debtor-in-Possession Credit Agreement, dated August 5, 2009 (the “Initial DIP Credit Agreement”), among the Company, CSA U.S., and Cooper-Standard Automotive Canada Limited ( “CSA Canada”), various lenders party thereto, Deutsche Bank Trust Company Americas, as the administrative agent, Banc of America Securities LLC, General Electric Corporation and UBS Securities LLC, as co-syndication agents, Deutsche Bank Trust Company Americas, as documentation agent, Deutsche Bank Securities Inc. and General Electric Capital Corporation, as joint lead arrangers and book runners, and Banc of America Securities LLC and UBS Securities LLC, as co-arrangers. On December 2, 2009, Metzeler Automotive Profile Systems GmbH, a German limited liability company (the “German Borrower” and together with CSA U.S. and CSA Canada, the “DIP Borrowers”) became an additional borrower under the Initial DIP Credit Agreement. Under the Initial DIP Credit Agreement, the DIP Borrowers borrowed an aggregate of $175,000 principal amount of superpriority senior secured term loans in order to finance their operating, working capital and other general corporate needs (including the payment of fees and expenses in accordance with the orders of the Bankruptcy Court and the Canadian Court authorizing such borrowings).
In order to refinance the Initial DIP Credit Agreement on terms more favorable to the Company, on December 18, 2009 the Company entered into a new Debtor-in-Possession Credit Agreement (the “DIP Credit Agreement”), among Cooper-Standard Holdings Inc., the “DIP Borrowers,” various lenders party thereto, Deutsche Bank Trust Company Americas, as the administrative agent (in such capacity, the “DIP Agent”), collateral agent and documentation agent, and Deutsche Bank Securities Inc., as syndication agent, sole lead arranger and book runner.
On December 29, 2009, the Bankruptcy Court entered a final order approving the DIP Credit Agreement (and related loan documentation) and the borrowings thereunder. Funding under the DIP Credit Agreement occurred on December 30, 2009, whereby (i) $75,000 was borrowed by CSA U.S., (ii) $50,000 was borrowed by CSA Canada and (iii) $50,000 was borrowed by the German Borrower. Concurrently with such funding, liens on assets of the Company and certain of its subsidiaries were granted and guarantees by certain subsidiaries of the Company of the obligations under the DIP Credit Agreement were made. All of the proceeds of the borrowings under the DIP Credit Agreement, together with cash on hand of the DIP Borrowers, were used to repay all borrowings and amounts outstanding under the Initial DIP Credit Agreement, and to pay related fees and expenses.
F-15
Table of Contents
COOPER-STANDARD HOLDINGS INC.
NOTES TO CONSOLIDATED FINANCIAL STATEMENTS—(Continued)
(Dollar amounts in thousands except per share amounts)
For additional information on the DIP Credit Agreement, see Note 10. “Debt” below.
Other Chapter 11 Cases Updates
On October 2, 2009, the Debtors filed their schedules of assets and liabilities (the “Schedules”) and statements of financial affairs with the Bankruptcy Court. On October 27, 2009, the Bankruptcy Court entered an order establishing December 4, 2009 as the deadline (the “General Bar Date”) for all entities, other than governmental agencies, to file proofs of claim against the Debtors stating the amounts to which the claimants contend that they are entitled, subject to the rights of the Debtors to contest both the validity and amount of the claims. The Bankruptcy Court also set February 1, 2010 as the deadline for governmental entities to file their proofs of claim (the “Governmental Bar Date” and, together with the General Bar Date, the “Bar Dates”). The Debtors will continue to evaluate all claims asserted in the Chapter 11 Cases and may file periodic motions seeking to modify, reject, liquidate or allow such claims.
Liquidity and Going Concern
The accompanying consolidated financial statements have been prepared assuming we will continue as a going concern. This assumes a continuing of operations and the realization of assets and liabilities in the ordinary course of business. The consolidated financial statements do not include any adjustments that might result if we were forced to discontinue operations. We have had a history of net losses. Our net losses are principally attributable to insufficient revenue to cover our relatively high percentage of fixed costs, including the interest costs on our debt and our depreciation expense. We also have an accumulated stockholders’ deficit of $306,500 at December 31, 2009.
As a result of filing for chapter 11 bankruptcy, the Company adopted ASC 852, Reorganization on August 3, 2009. ASC 852, is applicable to companies in chapter 11 of the Bankruptcy Code, generally does not change the manner in which financial statements are prepared. However, among other disclosures, it does require that the financial statements for periods subsequent to the filing of the chapter 11 petition distinguish transactions and events that are directly associated with the reorganization from the ongoing operations of the business. Revenues, expenses, realized gains and losses, and provisions for losses that can be directly associated with the reorganization and restructuring of the business must be reported separately as reorganization items in the statements of operations. The balance sheet must distinguish prepetition liabilities subject to compromise from both those prepetition liabilities that are not subject to compromise and from post-petition liabilities. Liabilities that may be affected by a plan of reorganization must be reported at the amounts expected to be allowed, even if they may be settled for lesser amounts. In addition, reorganization items must be disclosed separately in the statement of cash flows. The Company has segregated those items as outlined above for all reporting periods subsequent to such date.
As a result of the Chapter 11 Cases, realization of assets and liquidation of liabilities are subject to uncertainty. While operating as debtors-in-possession under the protection of chapter 11 of the Bankruptcy Code, and subject to Bankruptcy Court approval or otherwise as permitted in the normal course of business, the Debtors may sell or otherwise dispose of assets and liquidate or settle liabilities for amounts other than those reflected in the consolidated financial statements, and may pursue various strategic alternatives as deemed appropriate by the Company’s board of directors to serve the best interests of the Company and its stakeholders.
Liabilities Subject to Compromise
The majority of the Debtors’ prepetition debt is in default and is classified as “Liabilities Subject to Compromise” in the accompanying consolidated balance sheet at December 31, 2009.
F-16
Table of Contents
COOPER-STANDARD HOLDINGS INC.
NOTES TO CONSOLIDATED FINANCIAL STATEMENTS—(Continued)
(Dollar amounts in thousands except per share amounts)
In addition to the Debtors prepetition debt which is in default, liabilities subject to compromise reflects the Debtors other liabilities incurred prior to the commencement of the bankruptcy proceedings. These amounts represent the Company’s estimate of known or potential prepetition claims to be resolved in connection with the bankruptcy proceedings. Such claims remain subject to future adjustments. Future adjustments may result from: (i) negotiations; (ii) actions of the Bankruptcy Court; (iii) further developments with respect to disputed claims; (iv) rejection of executory contracts and leases; (v) the determination of value of any collateral securing claims; (vi) proofs of claims; or (vii) other events. Payment terms for these claims will be established in connection with a plan of reorganization. The Debtors liabilities subject to compromise consist of the following:
| December 31, 2009 |
||||
| Prepetition debt (including accrued interest of $27,095) |
$ | 1,138,565 | ||
| Accounts payable |
12,148 | |||
| Pension and deferred compensation |
20,680 | |||
| Derivatives |
18,090 | |||
| Other |
72,420 | |||
| Debtor liabilities subject to compromise |
$ | 1,261,903 | ||
Effective August 3, 2009, the Company ceased recording interest expense on outstanding prepetition debt instruments classified as liabilities subject to compromise. An additional $28,274 of interest expense would have been recorded from August 3, 2009 to December 31, 2009 if the Company had continued to accrue interest on these instruments.
Reorganization Items
ASC Topic 852-10 requires reorganization items such as revenues, expenses such as professional fees directly related to the process of reorganizing the Debtors under chapter 11, realized gains and losses, provisions for losses, and interest income resulting from the reorganization and restructuring of the business to be separately disclosed. The Debtors’ reorganization items consist of the following:
| (Income)/ Expense |
||||
| For the year ended December 31, 2009 |
||||
| Professional fees directly related to reorganization |
$ | 17,737 | ||
| Miscellaneous-other |
(370 | ) | ||
| Total reorganization items |
$ | 17,367 | ||
Note 4. Debtor-in-Possession Financial Statements
The financial statements contained within this note represent the combined financial statements for the Debtors’ and Canadian Debtor only. The Company’s non-Debtor subsidiaries are treated as non-consolidated affiliates in these financial statements and as such their net income is included as “Equity loss from non-Debtor affiliates, net of tax” in the statement of operations and their assets are included as “Investments in non-Debtor affiliates” in the balance sheet. The Debtors’ and Canadian Debtor financial statements contained herein have been prepared in accordance with the guidance in ASC Topic 852-10.
F-17
Table of Contents
COOPER-STANDARD HOLDINGS INC.
NOTES TO CONSOLIDATED FINANCIAL STATEMENTS—(Continued)
(Dollar amounts in thousands except per share amounts)
DEBTOR-IN-POSSESSION CONDENSED COMBINED
STATEMENTS OF OPERATIONS
| Year Ended December 31, 2009 |
||||
| Sales |
$ | 871,047 | ||
| Cost of products sold |
748,339 | |||
| Gross profit |
122,708 | |||
| Selling, administration, & engineering expenses |
90,827 | |||
| Amortization of intangibles |
11,093 | |||
| Impairment charges |
242,822 | |||
| Restructuring |
6,660 | |||
| Operating loss |
(228,694 | ) | ||
| Interest expense, net of interest income |
(53,101 | ) | ||
| Equity earnings |
1,650 | |||
| Reorganization items, net |
(17,367 | ) | ||
| Other income |
24,192 | |||
| Loss before income taxes |
(273,320 | ) | ||
| Benefit for income tax expense |
(26,551 | ) | ||
| Equity loss from non-Debtor affiliates, net of tax |
(109,293 | ) | ||
| Consolidated net loss |
(356,062 | ) | ||
| Add: Net loss attributable to noncontrolling interests |
— | |||
| Net loss attributable to Debtors |
$ | (356,062 | ) | |
F-18
Table of Contents
COOPER-STANDARD HOLDINGS INC.
NOTES TO CONSOLIDATED FINANCIAL STATEMENTS—(Continued)
(Dollar amounts in thousands except per share amounts)
DEBTOR-IN-POSSESSION CONDENSED COMBINED
BALANCE SHEET
| December 31, 2009 |
||||
| ASSETS |
||||
| Current assets: |
||||
| Cash and cash equivalents |
$ | 186,930 | ||
| Accounts receivable, net |
145,398 | |||
| Inventories, net |
48,017 | |||
| Prepaid expenses |
4,232 | |||
| Receivable from non-Debtor affiliates, net |
27,484 | |||
| Other |
66,363 | |||
| Total current assets |
478,424 | |||
| Property, plant, and equipment, net |
216,634 | |||
| Goodwill |
87,728 | |||
| Investment in non-Debtor affiliates |
279,215 | |||
| Intangibles, net |
1,679 | |||
| Notes receivable from non-Debtor affiliates, net |
260,139 | |||
| Other assets |
32,511 | |||
| $ | 1,356,330 | |||
| LIABILITIES AND DEFICIT |
||||
| Current liabilities: |
||||
| Debt payable within one year |
$ | 47 | ||
| Debtor-in-possession financing |
125,000 | |||
| Accounts payable |
60,846 | |||
| Payroll liabilities |
26,284 | |||
| Accrued liabilities |
31,632 | |||
| Total current liabilities |
243,809 | |||
| Pension benefits |
71,668 | |||
| Postretirement benefits other than pensions |
65,831 | |||
| Deferred tax liabilities |
10,662 | |||
| Other long-term liabilities |
13,421 | |||
| Liabilities subject to compromise |
1,261,903 | |||
| Total liabilities |
1,667,294 | |||
| Total deficit |
(310,964 | ) | ||
| Total liabilities and deficit |
$ | 1,356,330 | ||
F-19
Table of Contents
COOPER-STANDARD HOLDINGS INC.
NOTES TO CONSOLIDATED FINANCIAL STATEMENTS—(Continued)
(Dollar amounts in thousands except per share amounts)
DEBTOR-IN-POSSESSION CONDENSED COMBINED
STATEMENTS OF CASH FLOW
| Year Ended December 31, 2009 |
||||
| Operating Activities: |
||||
| Net cash used in operating activities |
$ | (22,677 | ) | |
| Investing activities: |
||||
| Property, plant, and equipment |
(15,033 | ) | ||
| Other |
236 | |||
| Net cash used in investing activities |
(14,797 | ) | ||
| Financing activities: |
||||
| Proceeds from issuance of debtor-in-possession financing, net of debt issuance costs |
104,720 | |||
| Payments on debtor-in-possession financing |
(313 | ) | ||
| Increase (decrease) in short term debt |
21,398 | |||
| Principal payments on long-term debt |
(9,029 | ) | ||
| Transactions with non-Debtor subsidiaries |
(22,443 | ) | ||
| Repurchase of bonds |
(737 | ) | ||
| Other |
123 | |||
| Net cash provided by financing activities |
93,719 | |||
| Effects of exchange rate changes on cash |
16,248 | |||
| Changes in cash and cash equivalents |
72,493 | |||
| Cash and cash equivalents at beginning of period |
114,437 | |||
| Cash and cash equivalents at end of period |
$ | 186,930 | ||
Note 5. Acquisitions
In March of 2007, the Company completed the acquisition of the El Jarudo fuel rail manufacturing business of Automotive Components Holdings, LLC, or El Jarudo or the El Jarudo business. The business is located in Juarez, Mexico and is a producer of automotive fuel rails. This acquisition does not meet the thresholds for a significant acquisition and therefore no pro forma financial information is presented.
On August 31, 2007, the Company completed the acquisition of nine Metzeler Automotive Profile Systems sealing systems operations in Germany, Italy, Poland, Belarus, Belgium, and a joint venture interest in China, or MAPS or the MAPS businesses, from Automotive Sealing Systems S.A. The MAPS businesses were acquired for $143,063 subject to an adjustment based on the difference between targeted working capital and working capital at the closing date, which was settled in June 2008. After adjusting for working capital and direct acquisition costs, the total acquisition value under purchase accounting was $144,378.
In December of 2007, the Company completed the acquisition of the 74% joint venture interest of Automotive Sealing Systems, S.A. (ASSSA) in Metzeler Automotive Profiles India Private Limited, or MAP India. The remaining 26 percent in the joint venture is owned by Toyoda Gosei Co., Ltd. This acquisition does not meet the thresholds for a significant acquisition and therefore no pro forma financial information is presented.
F-20
Table of Contents
COOPER-STANDARD HOLDINGS INC.
NOTES TO CONSOLIDATED FINANCIAL STATEMENTS—(Continued)
(Dollar amounts in thousands except per share amounts)
Note 6. Restructuring
The Company implemented several restructuring initiatives in prior years in connection with the closure of facilities in North America, Europe and Asia. The Company initiated all of these initiatives prior to December 31, 2007 and continued to execute the closures through the end of 2009. The majority of the costs associated with the closures were incurred shortly after the original implementation. However, the Company continues to incur costs related to principally to the liquidation of the respective facilities. The following table summarizes the 2008 and 2009 activity related to these initiatives:
| Employee Separation Costs |
Other Exit Costs |
Asset Impairments |
Total | |||||||||||||
| Balance at January 1, 2008 |
$ | 8,723 | $ | 4,752 | $ | — | $ | 13,475 | ||||||||
| Expense incurred |
2,209 | 4,780 | 4,687 | 11,676 | ||||||||||||
| Cash payments |
(8,822 | ) | (8,792 | ) | 165 | (17,449 | ) | |||||||||
| Utilization of reserve |
— | — | (4,852 | ) | (4,852 | ) | ||||||||||
| Balance at December 31, 2008 |
$ | 2,110 | $ | 740 | $ | — | $ | 2,850 | ||||||||
| Expense incurred |
(517 | ) | 3,298 | 1,089 | 3,870 | |||||||||||
| Cash payments |
(1,593 | ) | (3,800 | ) | — | (5,393 | ) | |||||||||
| Utilization of reserve |
— | — | (1,089 | ) | (1,089 | ) | ||||||||||
| Balance at December 31, 2009 |
$ | — | $ | 238 | $ | — | $ | 238 | ||||||||
2008 Initiatives
In July 2008, the Company implemented a restructuring action and announced the closure of two manufacturing facilities, one located in Australia and the other located in Germany. Both closures are a result of changes in market demands and volume reductions and are substantially completed as of December 31, 2009. However, the Company will continue to incur costs until the facilities are sold. The estimated total cost of this initiative is approximately $21,100. The following table summarizes the activity for this initiative during the year ended December 31, 2008 and December 31, 2009:
| Employee Separation Costs |
Other Exit Costs |
Asset Impairments |
Total | |||||||||||||
| Balance at January 1, 2008 |
$ | — | $ | — | $ | — | $ | — | ||||||||
| Expense incurred |
14,455 | 149 | 3,282 | 17,886 | ||||||||||||
| Cash payments |
(995 | ) | (149 | ) | — | (1,144 | ) | |||||||||
| Utilization of reserve |
— | — | (3,282 | ) | (3,282 | ) | ||||||||||
| Balance at December 31, 2008 |
$ | 13,460 | $ | — | $ | — | $ | 13,460 | ||||||||
| Expense incurred |
562 | 2,557 | 118 | 3,237 | ||||||||||||
| Cash payments |
(12,579 | ) | (2,322 | ) | — | (14,901 | ) | |||||||||
| Utilization of reserve |
— | — | (118 | ) | (118 | ) | ||||||||||
| Balance at December 31, 2009 |
$ | 1,443 | $ | 235 | $ | — | $ | 1,678 | ||||||||
As a result of this initiative, a pension plan curtailment gain of $800 was recognized as a reduction to restructuring expense during the fourth quarter of 2009.
F-21
Table of Contents
COOPER-STANDARD HOLDINGS INC.
NOTES TO CONSOLIDATED FINANCIAL STATEMENTS—(Continued)
(Dollar amounts in thousands except per share amounts)
In 2008, the Company initiated the closing of a European facility and the idling of a Canadian facility. During the year ended December 31, 2009, the Company recorded other exit costs of $483 and asset impairments of $61 in connection with this initiative.
Reorganization-Product Line Operating Group Discontinuation Initiative
During 2008, the Company commenced the initial phase of a reorganization ultimately involving the discontinuation of its global product line operating divisions, formerly called the Body & Chassis Systems division (which included the body sealing and AVS product lines) and the Fluid Systems division, and the establishment of a new operating structure organized on the basis of geographic regions. The estimated cost of this initial phase is approximately $7,800. The following table summarizes the activity for this initiative during the year ended December 31, 2008 and December 31, 2009:
| Employee Separation Costs |
Other Exit Costs |
Asset Impairments |
Total | |||||||||||||
| Balance at January 1, 2008 |
$ | — | $ | — | $ | — | $ | — | ||||||||
| Expense incurred |
7,670 | — | — | 7,670 | ||||||||||||
| Cash payments |
(3,741 | ) | — | — | (3,741 | ) | ||||||||||
| Utilization of reserve |
— | — | — | — | ||||||||||||
| Balance at December 31, 2008 |
$ | 3,929 | $ | — | $ | — | $ | 3,929 | ||||||||
| Expense incurred |
134 | — | — | 134 | ||||||||||||
| Cash payments |
(3,405 | ) | — | — | (3,405 | ) | ||||||||||
| Balance at December 31, 2009 |
$ | 658 | $ | — | $ | — | $ | 658 | ||||||||
2009 Initiatives
In the first quarter of 2009, the Company initiated the final phase of the reorganization of its operating structure, formally discontinuing its product line operating divisions and putting into place the new operating divisions based on geographic regions. The estimated total cost of this initiative is $18,700. The following table summarizes the activity for this initiative during the year ended December 31, 2009:
| Employee Separation Costs |
Other Exit Costs |
Asset Impairments |
Total | |||||||||||||
| Balance at January 1, 2009 |
$ | — | $ | — | $ | — | $ | — | ||||||||
| Expense incurred |
18,570 | 86 | — | 18,656 | ||||||||||||
| Cash payments |
(11,457 | ) | (86 | ) | — | (11,543 | ) | |||||||||
| Balance at December 31, 2009 |
$ | 7,113 | $ | — | $ | — | $ | 7,113 | ||||||||
As a result of this initiative a curtailment gain related to other postretirement benefits of $3,404 was recognized as a reduction to restructuring expense during the fourth quarter of 2009.
F-22
Table of Contents
COOPER-STANDARD HOLDINGS INC.
NOTES TO CONSOLIDATED FINANCIAL STATEMENTS—(Continued)
(Dollar amounts in thousands except per share amounts)
The Company also initiated several other initiatives during 2009. These initiatives relate to the reorganization or closure of operating facilities in South America, Europe and Asia Pacific. The estimated total cost associated with these actions amount to $19,250. The following table summarizes the activity for these initiatives during the year ended December 31, 2009:
| Employee Separation Costs |
Other Exit Costs |
Asset Impairments |
Total | |||||||||||||
| Balance at January 1, 2009 |
$ | — | $ | — | $ | — | $ | — | ||||||||
| Expense incurred |
9,864 | 368 | — | 10,232 | ||||||||||||
| Cash payments |
(5,649 | ) | (312 | ) | — | (5,961 | ) | |||||||||
| Utilization of reserve |
— | — | — | — | ||||||||||||
| Balance at December 31, 2009 |
$ | 4,215 | $ | 56 | $ | — | $ | 4,271 | ||||||||
The Company expects the reorganization of its operating structure and the other 2009 initiatives to be substantially completed by the end of 2010.
Note 7. Inventories
Inventories are comprised of the following:
| December 31, 2008 |
December 31, 2009 |
|||||||
| Finished goods |
$ | 35,069 | $ | 27,826 | ||||
| Work in process |
26,520 | 25,616 | ||||||
| Raw materials and supplies |
55,363 | 58,133 | ||||||
| Inventories, net |
$ | 116,952 | $ | 111,575 | ||||
Note 8. Property, Plant, and Equipment
Property, plant, and equipment is comprised of the following:
| December 31, | Estimated Useful Lives |
|||||||||||
| 2008 | 2009 | |||||||||||
| Land and improvements |
$ | 78,548 | $ | 81,609 | ||||||||
| Buildings and improvements |
229,384 | 240,413 | 15 to 40 years | |||||||||
| Machinery and equipment |
640,350 | 696,259 | 5 to 14 years | |||||||||
| Construction in Progress |
48,123 | 41,499 | ||||||||||
| 996,405 | 1,059,780 | |||||||||||
| Accumulated depreciation |
(372,418 | ) | (473,601 | ) | ||||||||
| Property, plant and equipment, net |
$ | 623,987 | $ | 586,179 | ||||||||
During 2008 it was determined that fixed assets at two of the Company’s locations were impaired. As a result of this impairment, Property, Plant and Equipment was reduced by $6,408 during 2008.
During 2009 it was determined that fixed assets at several of the Company’s locations were impaired. As a result of this impairment, Property, Plant and Equipment was reduced by $3,825 during 2009.
F-23
Table of Contents
COOPER-STANDARD HOLDINGS INC.
NOTES TO CONSOLIDATED FINANCIAL STATEMENTS—(Continued)
(Dollar amounts in thousands except per share amounts)
Depreciation expense totaled $104,199 for 2007, $109,109 for 2008, and $98,801 for 2009, respectively.
Note 9. Goodwill and Intangibles
Goodwill
The changes in the carrying amount of goodwill by reportable operating segment for the years ended December 31, 2008 and 2009 are summarized as follows:
| North America |
International | Total | ||||||||||
| Balance at January 1, 2008 |
$ | 181,687 | $ | 108,901 | $ | 290,588 | ||||||
| Adjustments to the Acquisition of El Jarudo |
(379 | ) | — | (379 | ) | |||||||
| Purchase price adjustments pre-acquisition |
— | (22,107 | ) | (22,107 | ) | |||||||
| Impairment charge |
— | (23,141 | ) | (23,141 | ) | |||||||
| Balance at December 31, 2008 |
$ | 181,308 | $ | 63,653 | $ | 244,961 | ||||||
| Impairment charge |
(93,580 | ) | (63,653 | ) | (157,233 | ) | ||||||
| Balance at December 31, 2009 |
$ | 87,728 | $ | — | $ | 87,728 | ||||||
Goodwill is not amortized but is tested annually for impairment, or when events or circumstances indicate that impairment may exist, by reporting units, which are determined in accordance with ASC Topic 350. During the second quarter of 2009, several events occurred that indicated potential impairment of the Company’s goodwill. Such events included: (a) the chapter 11 bankruptcy of both Chrysler LLC and General Motors and unplanned plant shut-downs; (b) continued product volume risk and negative product mix changes; (c) the Company’s commencement of negotiations with its Sponsors, senior secured lenders, and bondholders to recapitalize its long term debt and equity; (d) the Company’s recognition as the second quarter progressed that there was an increasing likelihood that it would breach its financial covenants under its Prepetition Credit Agreement; (e) the Company’s decision to defer its June 15, 2009 interest payment on its Notes pending the outcome of its quarterly financial results; (f) an analysis of whether the Company would meet its financial covenants for the past quarter; and (g) negotiations with its various constituencies. As a result of the combination of the above factors in the second quarter, the Company significantly reduced its projections for the remainder of the year. This significant decrease in projections resulted in the carrying value of assets at all of the Company’s reporting units being greater than the related reporting units’ fair value. As a result, the Company recorded goodwill impairment charges of $93,580 in its North America reporting unit, $39,604 in its Europe reporting unit, $22,628 in its South America reporting unit and $1,421 in its Asia Pacific reporting unit during the second quarter of 2009. As of December 31, 2009, accumulated goodwill impairment for the North America and International segments is $243,988 and $86,794, respectively.
Changes in the factors noted above, including a change in the estimated transaction value of the bankruptcy could impact the valuation of the Company’s remaining goodwill and other intangibles.
The pre-acquisition purchase price adjustments for the period ended December 31, 2008 represent adjustments related to various tax matters and were recorded in accordance with EITF Issue No. 93-7 “Uncertainties Related to Income Taxes in a Purchase Business Combination” and restructuring accrual reversals related to the FHS acquisition.
During the fourth quarter of 2008, the Company recorded an impairment charge of $23,141 in its International segment. These charges were a result of a weakening global economy, a global decline in vehicle production volumes and changes in product mix.
F-24
Table of Contents
COOPER-STANDARD HOLDINGS INC.
NOTES TO CONSOLIDATED FINANCIAL STATEMENTS—(Continued)
(Dollar amounts in thousands except per share amounts)
Other Intangible Assets
During the second quarter of 2009, the Company assessed the realization of its intangible assets in connection with revisions to the Company’s projections as a result of the negotiations associated with the bankruptcy. The Company’s undiscounted cash flows (as adjusted to reflect the current outlook) were not sufficient to support the realization of certain intangible assets. As a result the Company performed discounted cash flow analysis for each intangible asset and determined that the fair value of certain intangible assets exceeded the assets’ respective fair value. During the second quarter of 2009, the Company recorded intangible impairment charges of $148,143 in its North America segment and $54,295 of intangible impairment charges in its International segment. The following table shows the impairment by intangible asset type:
| Customer contracts |
$ | 68,177 | ||
| Customer relationships |
131,364 | |||
| Developed technology |
1,558 | |||
| Trademarks and tradenames |
1,339 | |||
| Total intangible impairment |
$ | 202,438 | ||
During the fourth quarter of 2008 the Company recorded intangible impairment charges of $3,820 in its North America segment. Based on a discounted cash flow analysis it was determined that these intangible assets exceeded their fair value and impairment charges were recorded.
The following table presents intangible assets, which are amortized on a straight line basis, and accumulated amortization balances of the Company as of December 31, 2008 and 2009, respectively:
| Gross Carrying Amount |
Accumulated Amortization |
Net Carrying Amount |
Amortization Period |
|||||||||||||
| Customer contracts |
$ | 156,039 | $ | (78,100 | ) | $ | 77,939 | 7 to 9 years | ||||||||
| Customer relationships |
169,105 | (33,669 | ) | 135,436 | 15 to 20 years | |||||||||||
| Developed technology |
6,421 | (2,204 | ) | 4,217 | 5 to 12 years | |||||||||||
| Trademarks and tradenames |
1,700 | (306 | ) | 1,394 | 12 to 20 years | |||||||||||
| Other |
11,358 | (2,891 | ) | 8,467 | ||||||||||||
| Balance at December 31, 2008 |
$ | 344,623 | $ | (117,170 | ) | $ | 227,453 | |||||||||
| Developed technology |
$ | 3,335 | $ | (1,479 | ) | $ | 1,856 | 5 to 12 years | ||||||||
| Other |
8,986 | (293 | ) | 8,693 | ||||||||||||
| Balance at December 31, 2009 |
$ | 12,321 | $ | (1,772 | ) | $ | 10,549 | |||||||||
Amortization expense totaled $31,850 for 2007, $30,996 for 2008, and $14,976 for 2009. Estimated amortization expense will total approximately $740 over each of the next five years.
F-25
Table of Contents
COOPER-STANDARD HOLDINGS INC.
NOTES TO CONSOLIDATED FINANCIAL STATEMENTS—(Continued)
(Dollar amounts in thousands except per share amounts)
Note 10. Debt
Outstanding debt consisted of the following at December 31, 2008 and 2009:
| December 31, 2008 |
December 31, 2009 |
|||||||
| Senior Notes |
$ | 200,000 | $ | — | (a) | |||
| Senior Subordinated Notes |
323,350 | — | (a) | |||||
| Term Loan A |
25,036 | — | (a) | |||||
| Term Loan B |
66,365 | — | (a) | |||||
| Term Loan C |
165,805 | — | (a) | |||||
| Term Loan D |
184,300 | — | (a) | |||||
| Term Loan E |
88,458 | — | (a) | |||||
| Revolving Credit Facility |
60,933 | |||||||
| DIP Financing |
— | 175,000 | ||||||
| Capital leases and other borrowings |
29,848 | 29,263 | ||||||
| Total debt |
1,144,095 | 204,263 | ||||||
| Less: Current portion of long term debt |
(94,136 | ) | (18,204 | ) | ||||
| DIP financing |
— | (175,000 | ) | |||||
| Total long-term debt |
$ | 1,049,959 | $ | 11,059 | ||||
| (a) | Debt in default is classified as liabilities subject to compromise. |
General
During the first quarter of 2008, the Company purchased and retired $7,150 of its $330,500 outstanding Senior Subordinated Notes on the open market. The purchase was accounted for as an extinguishment of debt and, accordingly, $1,696 was recognized as a gain on debt extinguishment, after writing off the related unamortized debt issuance costs. The gain is included in other income (expense) in the consolidated statement of operations.
During the second quarter of 2009, the Company purchased and retired $10,000 of its $323,350 outstanding Senior Subordinated Notes on the open market. The purchase was accounted for as an extinguishment of debt and, accordingly, $9,096 was recognized as a gain on debt extinguishment, after writing off the related unamortized debt issuance costs. The gain is included in other income (expense) in the consolidated statement of operations.
The Company had $28,067 of standby letters of credit outstanding under the Revolving Credit Facility as of December 31, 2009.
Default under the Notes and Forbearance Agreements
On June 15, 2009, the Company did not make required interest payments in an aggregate amount of approximately $20,121 due and payable under the Senior Notes and the Senior Subordinated Notes issued by CSA U.S. The Company announced that it would utilize the applicable 30-day grace period on these scheduled interest payments to allow the Company to continue discussions with its lenders and other parties in an effort to increase liquidity and improve the Company’s capital structure. The failure to make the scheduled interest payments did not constitute an event of default at such time under the indentures governing the Notes. However, the failure to make the scheduled interest payments after the expiration of the 30-day grace period did constitute
F-26
Table of Contents
COOPER-STANDARD HOLDINGS INC.
NOTES TO CONSOLIDATED FINANCIAL STATEMENTS—(Continued)
(Dollar amounts in thousands except per share amounts)
an event of default under the indentures. On July 15, 2009, the Company entered into (i) Senior Notes Forbearance Agreements (the “Senior Notes Forbearance Agreements”) with holders of more than 75% the aggregate principal amount of the outstanding Senior Notes and (ii) a Senior Subordinated Notes Forbearance Agreement (the “Senior Subordinated Notes Forbearance Agreement” and together with the Senior Notes Forbearance Agreements, the “Forbearance Agreements”) with holders of a majority of the aggregate principal amount of the outstanding Senior Subordinated Notes. The Forbearance Agreements provided that the noteholders party to the Forbearance Agreements would not exercise, and would not direct the applicable trustee to exercise, any remedies under the indenture agreements for a defined period of time not to exceed August 14, 2009 with respect to certain defaults resulting from the failure to make the interest payments under the Notes.
Default under the Prepetition Credit Agreement and Limited Waiver
As the event of default under the indentures governing the Notes resulted in a cross-default under the Company’s Prepetition Credit Agreement, the Company obtained a limited waiver from a majority of the lenders party thereto on July 15, 2009. Under the limited waiver, as amended and restated, certain defaults resulting from the failure to make the interest payments on the Notes as described above were waived for a defined period of time not to exceed August 14, 2009.
Bankruptcy Cases
The filing of the Chapter 11 Cases by the Debtors on August 3, 2009 constituted a default or otherwise triggered repayment obligations under substantially all prepetition debt obligations of the Debtors, and as a result, the loan commitments of the lenders under the Prepetition Credit Agreement were terminated (including the availability under the revolving credit facility, including with respect to standby letters of credit) and all principal and accrued and unpaid interest outstanding under the Prepetition Credit Agreement, the Senior Notes and the Senior Subordinated Notes accelerated and became due and payable (subject to the automatic stay under chapter 11). Under chapter 11, the filing of a bankruptcy petition automatically stays most actions against a debtor, including actions with respect to prepetition claims and litigation. Absent an order of the Bankruptcy Court, substantially all prepetition liabilities are subject to compromise under a chapter 11 plan of reorganization. As of the date of the filing of the Chapter 11 Cases, approximately $608,000 of principal and accrued and unpaid interest was outstanding under the Prepetition Credit Agreement, approximately $208,800 of principal and accrued and unpaid interest was outstanding under the Senior Notes and approximately $329,900 of principal and accrued and unpaid interest was outstanding under the Senior Subordinated Notes.
DIP Credit Agreement
On August 5, 2009, the Bankruptcy Court entered an interim order approving debtor-in-possession financing on an interim basis. Pursuant to this interim order, the Company entered into a Debtor-in-Possession Credit Agreement, dated as of August 5, 2009 (the “Initial DIP Credit Agreement”), among the Company, CSA U.S., and CSA Canada, various lenders party thereto, Deutsche Bank Trust Company Americas, as administrative agent and collateral agent, Banc of America Securities LLC, General Electric Corporation and UBS Securities LLC, as co-syndication agents, Deutsche Bank Trust Company Americas, as documentation agent, Deutsche Bank Securities Inc. and General Electric Capital Corporation, as joint lead arrangers and book runners, and Banc of America Securities LLC and UBS Securities LLC, as co-arrangers. The Company received final approval of the Initial DIP Credit Agreement from the Bankruptcy Court on September 1, 2009. The Company received approval of the Initial DIP Credit Agreement from the Canadian Court on August 6, 2009. The Initial DIP Credit Agreement was amended on August 31, 2009 and September 11, 2009. Both amendments primarily updated some post-closing non-U.S. collateral delivery requirements. In addition, on December 2, 2009, Metzeler
F-27
Table of Contents
COOPER-STANDARD HOLDINGS INC.
NOTES TO CONSOLIDATED FINANCIAL STATEMENTS—(Continued)
(Dollar amounts in thousands except per share amounts)
Automotive Profile Systems GmbH, a German limited liability company (the “German Borrower” and together with CSA U.S. and CSA Canada, the “DIP Borrowers”), became an additional borrower under the Initial DIP Credit Agreement. Under the Initial DIP Credit Agreement, the DIP Borrowers borrowed an aggregate of $175,000 principal amount of superpriority senior secured term loans in order to finance their operating, working capital and other general corporate needs (including the payment of fees and expenses in accordance with the orders of the Bankruptcy Court and the Canadian Court authorizing such borrowings). The Initial DIP Credit Agreement also provided for an ability to incur up to an aggregate of $25,000 in uncommitted incremental debt.
In order to refinance the Initial DIP Credit Agreement on terms more favorable to the Company, on December 18, 2009 the Company entered into a Debtor-in-Possession Credit Agreement (the “DIP Credit Agreement”), among the Company, the DIP Borrowers, various lenders party thereto, Deutsche Bank Trust Company Americas, as the administrative agent (in such capacity, the “DIP Agent”), collateral agent and documentation agent, and Deutsche Bank Securities Inc., as syndication agent, sole lead arranger and book runner. Under the DIP Credit Agreement, the lenders party thereto committed to provide superpriority senior secured term loans to the DIP Borrowers in an aggregate principal amount of up to $175,000 (the “DIP Facility”), subject to certain conditions. The DIP Credit Agreement also provides for an additional uncommitted $25,000 incremental facility, for a total DIP Facility of up to $200,000 (if the incremental facility is requested and committed to by the requisite lenders).
On December 29, 2009, the Bankruptcy Court entered a final order approving the DIP Credit Agreement (and related loan documentation) and the borrowings thereunder. Funding under the DIP Credit Agreement occurred on December 30, 2009, whereby (i) $75,000 was borrowed by CSA U.S., (ii) $50,000 was borrowed by CSA Canada and (iii) $50,000 was borrowed by the German Borrower. All of the proceeds of the borrowings under the DIP Facility, together with cash on hand of the DIP Borrowers, were used to repay all borrowings and amounts outstanding under the Initial DIP Credit Agreement, and to pay related fees and expenses.
The obligations of the DIP Borrowers under the DIP Credit Agreement are guaranteed by the Company and certain of its U.S. and foreign subsidiaries, subject to limitations on guarantees by foreign entities of the obligations of the DIP Borrowers. The obligations under the DIP Credit Agreement and related guarantees are secured by liens on the assets of the Company, the DIP Borrowers and certain of the Company’s U.S. and foreign subsidiaries, subject to limitations on liens granted by foreign entities supporting certain of the obligations of the DIP Borrowers and guarantors. Liens under the DIP Credit Agreement have first priority priming status with
respect to substantially all of the assets of the Company, the DIP Borrowers and their subsidiaries in the United States and Canada and are entitled to superpriority administrative expense claim status in the Chapter 11 Cases.
Loans under the DIP Credit Agreement bear interest at a rate per annum equal to (i) LIBOR (with a LIBOR floor of 2%) plus 6% or (ii) a base rate based on the higher of the federal funds overnight rate plus 0.5% and the prime lending rate (with a floor of 3%) plus 5%. Overdue principal and interest bear interest at a default rate of 2% over the applicable rate as determined under the terms of the DIP Credit Agreement. In addition, the DIP Credit Agreement obligates the DIP Borrowers to pay an agency fee and an extension fee to the DIP Agent.
Loans under the DIP Credit Agreement will amortize at a rate of 1% per annum, payable in quarterly installments. The outstanding principal amount of the loans under the DIP Credit Agreement, plus accrued and unpaid interest thereon, will be due and payable in full at maturity, which is the earliest of: (i) August 4, 2010, (ii) the first date on which both a plan of reorganization for each of the Company and its U.S. subsidiaries, which is confirmed by the Bankruptcy Court, and a plan of compromise or arrangement of CSA Canada, which is confirmed by the Canadian Court, in each case providing for the repayment of the obligations under the DIP Credit Agreement, become effective, and (iii) the acceleration of the DIP Facility or termination of the
F-28
Table of Contents
COOPER-STANDARD HOLDINGS INC.
NOTES TO CONSOLIDATED FINANCIAL STATEMENTS—(Continued)
(Dollar amounts in thousands except per share amounts)
commitments thereunder, including, without limitation, as a result of the occurrence of an event of default. With the consent of the requisite lenders and payment of an extension fee equal to 1% of the outstanding loans and commitments, the DIP Borrowers may at their option extend the maturity date by 90 days if no default exists or would result therefrom. Loans under the DIP Credit Agreement may be prepaid by the DIP Borrowers at any time in whole or in part without premium or penalty (except for customary breakage costs).
The DIP Credit Agreement includes affirmative and negative covenants that will impose substantial restrictions on the financial and business operations of the Company and its subsidiaries, including their ability to incur and secure debt, make investments, sell assets, pay dividends or make acquisitions. The DIP Credit Agreement also contains certain financial covenants including (i) the achievement of a minimum amount of consolidated EBITDA, (ii) the maintenance of a minimum amount of liquidity and (iii) limitations on the amount of capital expenditures. The DIP Credit Agreement also contains various events of default that are customary for debtor-in-possession financings of this type.
Amendments to the Prepetition Credit Agreement
The Company, CSA U.S., CSA Canada and Cooper-Standard Automotive International Holdings B.V., a corporation organized under the laws of the Netherlands (the “Dutch Borrower” and together with CSA U.S, and CSA Canada, the “Prepetition Borrowers”), entered into the Fifth Amendment and Consent to Credit Agreement, dated July 14, 2009 (the “Fifth Amendment to the Prepetition Credit Agreement”), with the lenders party thereto and the Prepetition Agent (as defined below), providing for the amendment of the Company’s existing Credit Agreement, dated as of December 23, 2004 (as amended from time to time, the “Prepetition Credit Agreement”), to permit, (i) the incurrence of the loans and guarantees and the granting of liens on the assets of the Company and its subsidiaries, pursuant to the Initial DIP Credit Agreement and (ii) the Prepetition Credit Agreement administrative agent’s entering into intercreditor agreements and/or amendments to the security and pledge agreements that secure the obligations under the Prepetition Credit Agreement to provide that any liens incurred pursuant to the Initial DIP Credit Agreement will have priority over the liens under the Prepetition Credit Agreement. The Prepetition Credit Agreement was amended on December 16, 2009 in connection with the refinancing of the Initial DIP Credit Agreement in the same manner as provided by the Fifth Amendment to the Prepetition Credit Agreement except in respect of the DIP Credit Agreement. In addition, the Prepetition Credit Agreement was amended on August 18, 2009 to amend and define certain rights and allocations among the lenders party thereto.
Other borrowings at December 31, 2008 and 2009 reflect borrowings under capital leases and local bank lines, including $11,809 and $15,075 of short-term notes payable, respectively, classified in debt payable within one year on the consolidated balance sheet.
The maturities of debt at December 31, 2009 are as follows:
| 2010 |
$ | 196,140 | ||
| 2011 |
3,270 | |||
| 2012 |
2,979 | |||
| 2013 |
637 | |||
| 2014 |
358 | |||
| Thereafter |
879 | |||
| $ | 204,263 | |||
Interest paid on third party debt was $91,764, $95,419 and $57,851 for 2007, 2008, and 2009, respectively.
F-29
Table of Contents
COOPER-STANDARD HOLDINGS INC.
NOTES TO CONSOLIDATED FINANCIAL STATEMENTS—(Continued)
(Dollar amounts in thousands except per share amounts)
Note 11. Pensions
The Company maintains defined benefit pension plans covering substantially all employees located in the United States. Benefits generally are based on compensation, length of service and age for salaried employees and on length of service for hourly employees. The Company’s policy is to fund pension plans such that sufficient assets will be available to meet future benefit requirements. The Company also sponsors defined benefit pension plans for employees in some of its international locations.
The Company also sponsors defined contribution pension plans for certain salaried and hourly U.S. employees of the Company. Participation is voluntary. The Company matches contributions of participants, up to various limits based on its profitability, in substantially all plans. Matching contributions under these plans totaled $3,872 in 2007, $2,549 in 2008 and $602 in 2009.
The following tables disclose information related to the Company’s defined benefit pension plans.
| 2008 | 2009 | |||||||||||||||
| U.S. | Non- U.S. |
U.S. | Non- U.S. |
|||||||||||||
| Change in projected benefit obligation: |
||||||||||||||||
| Projected benefit obligations at beginning of period |
$ | 255,959 | $ | 142,742 | $ | 251,791 | $ | 113,484 | ||||||||
| Measurement change service and interest cost |
6,393 | 1,046 | — | — | ||||||||||||
| Service cost—employer |
10,131 | 3,439 | 2,826 | 2,292 | ||||||||||||
| Participant contributions |
— | 35 | — | — | ||||||||||||
| Interest cost |
15,516 | 7,634 | 15,146 | 7,146 | ||||||||||||
| Actuarial (gain) loss |
3,965 | (18,968 | ) | 18,509 | 9,071 | |||||||||||
| Amendments |
66 | — | (227 | ) | — | |||||||||||
| Benefits paid |
(19,767 | ) | (9,384 | ) | (17,294 | ) | (11,721 | ) | ||||||||
| Foreign currency exchange rate effect |
— | (14,144 | ) | — | 7,763 | |||||||||||
| Curtailment/Settlements |
(20,472 | ) | (305 | ) | — | 361 | ||||||||||
| Acquisitions of MAPS & El Jarudo |
— | 410 | — | — | ||||||||||||
| Other |
— | 979 | — | (5 | ) | |||||||||||
| Projected benefit obligations at end of period |
$ | 251,791 | $ | 113,484 | $ | 270,751 | $ | 128,391 | ||||||||
| Change in plans’ assets: |
||||||||||||||||
| Fair value of plans’ assets at beginning of period |
$ | 225,006 | $ | 62,318 | $ | 162,645 | $ | 41,122 | ||||||||
| Actual return on plans’ assets |
(59,701 | ) | (10,552 | ) | 31,414 | 6,203 | ||||||||||
| Employer contributions |
17,107 | 9,340 | 9,801 | 8,826 | ||||||||||||
| Participant contributions |
— | 35 | — | — | ||||||||||||
| Benefits paid |
(19,767 | ) | (9,384 | ) | (17,294 | ) | (11,721 | ) | ||||||||
| Foreign currency exchange rate effect |
— | (11,208 | ) | — | 6,320 | |||||||||||
| Other |
— | 573 | — | (4 | ) | |||||||||||
| Fair value of plans’ assets at end of period |
$ | 162,645 | $ | 41,122 | $ | 186,566 | $ | 50,746 | ||||||||
| Funded status of the plans |
$ | (89,146 | ) | $ | (72,362 | ) | $ | (84,185 | ) | $ | (77,645 | ) | ||||
| Amounts recognized in the balance sheets: |
||||||||||||||||
| Accrued liabilities (current) |
$ | (210 | ) | $ | (4,897 | ) | $ | (12,847 | ) | $ | (4,418 | ) | ||||
| Pension benefits (long term) |
(88,936 | ) | (72,689 | ) | (71,338 | ) | (77,598 | ) | ||||||||
| Other assets |
— | 5,224 | — | 4,371 | ||||||||||||
| Net amount recognized at December 31 |
$ | (89,146 | ) | $ | (72,362 | ) | $ | (84,185 | ) | $ | (77,645 | ) | ||||
F-30
Table of Contents
COOPER-STANDARD HOLDINGS INC.
NOTES TO CONSOLIDATED FINANCIAL STATEMENTS—(Continued)
(Dollar amounts in thousands except per share amounts)
Included in cumulative other comprehensive loss at December 31, 2009 are the following amounts that have not yet been recognized in net periodic benefit cost: unrecognized prior service costs of $ 1,742 ($1,720 net of taxes), unrecognized actuarial losses of $68,570 ($67,539 net of tax) and net transition obligation of $239 ($169 net of tax).
The amounts included in cumulative other comprehensive loss and expected to be recognized in net periodic benefit cost during the fiscal year-ended December 31, 2010 are $186, $3,495 and $16, respectively.
The accumulated benefit obligation for all domestic and international defined benefit pension plans was $249,478 and $108,251 at December 31, 2008 and $268,911 and $123,131 at December 31, 2009, respectively. As of December 31, 2008, the fair value of plan assets for two of the Company’s defined benefit plans exceeded the projected benefit obligation of $27,588 by $5,224. As of December 31, 2009, the fair value of plan assets for two of the Company’s defined benefit plans exceeded the projected benefit obligation of $45,920 by $4,371.
During 2008, the Company froze the defined benefits for the US Salaried Plan which resulted in a curtailment gain that reduced the projected benefit obligation for 2008.
Weighted average assumptions used to determine benefit obligations at December 31:
| 2008 | 2009 | |||||||||||||||
| U.S. | Non- U.S. |
U.S. | Non- U.S. |
|||||||||||||
| Discount rate |
6.18 | % | 6.35 | % | 5.79 | % | 5.66 | % | ||||||||
| Rate of compensation increase |
3.25 | % | 3.22 | % | 3.25 | % | 3.46 | % | ||||||||
The following table provides the components of net pension expense for the plans:
| 2007 | 2008 | 2009 | ||||||||||||||||||||||
| U.S. | Non- U.S. |
U.S. | Non- U.S. |
U.S. | Non- U.S. |
|||||||||||||||||||
| Service cost |
$ | 12,030 | $ | 5,500 | $ | 10,131 | $ | 3,439 | $ | 2,826 | 2,292 | |||||||||||||
| Interest cost |
14,390 | 5,778 | 15,516 | 7,634 | 15,146 | 7,146 | ||||||||||||||||||
| Expected return on plan assets |
(16,940 | ) | (3,712 | ) | (18,151 | ) | (4,144 | ) | (13,118 | ) | (2,988 | ) | ||||||||||||
| Amortization of prior service cost, recognized actuarial loss and transition obligation |
240 | 503 | 191 | 453 | 3,840 | 201 | ||||||||||||||||||
| Curtailment gain/settlement |
— | (5,231 | ) | — | — | (159 | ) | (261 | ) | |||||||||||||||
| Other |
— | — | 140 | (56 | ) | — | — | |||||||||||||||||
| Net periodic benefit cost |
$ | 9,720 | $ | 2,838 | $ | 7,827 | $ | 7,326 | $ | 8,535 | $ | 6,390 | ||||||||||||
A curtailment gain of ($779) for the year ended December 31, 2009 included in the table above for one of the Company’s international locations was recorded as a reduction to restructuring expense.
F-31
Table of Contents
COOPER-STANDARD HOLDINGS INC.
NOTES TO CONSOLIDATED FINANCIAL STATEMENTS—(Continued)
(Dollar amounts in thousands except per share amounts)
Weighted-average assumptions used to determine net periodic benefit costs for the years ended December 31 were:
| 2007 | 2008 | 2009 | ||||||||||||||||||||||
| U.S. | Non- U.S. |
U.S. | Non- U.S. |
U.S. | Non- U.S. |
|||||||||||||||||||
| Discount rate |
5.75 | % | 4.90 | % | 6.25 | % | 5.53 | % | 6.18 | % | 6.02 | % | ||||||||||||
| Expected return on plan assets |
8.50 | % | 8.00 | % | 8.00 | % | 6.92 | % | 8.00 | % | 7.11 | % | ||||||||||||
| Rate of compensation increase |
3.25 | % | 3.44 | % | 3.25 | % | 3.14 | % | 3.25 | % | 3.34 | % | ||||||||||||
To develop the expected return on assets assumption, the Company considered the historical returns and the future expectations for returns for each asset class, as well as the target asset allocation of the pension portfolio.
The weighted average asset allocations for the Company’s pension plans at December 31, 2008 and 2009 by asset category are approximately as follows:
| 2008 | 2009 | |||||||||||||||
| U.S. | Non- U.S. |
U.S. | Non- U.S. |
|||||||||||||
| Equity securities |
37 | % | 45 | % | 41 | % | 53 | % | ||||||||
| Debt securities |
28 | % | 54 | % | 23 | % | 47 | % | ||||||||
| Real Estate |
5 | % | 0 | % | 3 | % | 0 | % | ||||||||
| Balanced funds(1) |
29 | % | 0 | % | 31 | % | 0 | % | ||||||||
| Cash and cash equivalents |
1 | % | 1 | % | 2 | % | 0 | % | ||||||||
| 100 | % | 100 | % | 100 | % | 100 | % | |||||||||
| (1) | Invested primarily in equity, fixed income and cash instruments. |
Equity security investments are structured to achieve an equal balance between growth and value stocks. The Company determines the annual rate of return on pension assets by first analyzing the composition of its asset portfolio. Historical rates of return are applied to the portfolio. This computed rate of return is reviewed by the Company’s investment advisors and actuaries. Industry comparables and other outside guidance is also considered in the annual selection of the expected rates of return on pension assets.
Plan Assets
Investments in equity securities and debt securities are valued at fair value using a market approach and observable inputs, such as quoted market prices in active markets (Level 1 input based on the GAAP fair value hierarchy). Investments in Balanced Funds are valued at fair value using a market approach and inputs that are directly or indirectly observable (Level 2 input based on the GAAP fair value hierarchy). Investments in Real Estate funds are valued at fair value based on appraisals for each investment fund. The appraisals are considered an unobservable input (Level 3 input based on the GAAP fair value hierarchy). The Company’s plan assets include investments in real estate funds of $6,003 as of December 31, 2009. For the year ended December 31, 2009, changes in the fair value of these plan assets were due to unrealized losses of $2,745. For further information on the GAAP fair value hierarchy, see Note 21. “Fair Value of Financial Instruments.”
F-32
Table of Contents
COOPER-STANDARD HOLDINGS INC.
NOTES TO CONSOLIDATED FINANCIAL STATEMENTS—(Continued)
(Dollar amounts in thousands except per share amounts)
The Company estimates its benefit payments for its domestic and foreign pension plans during the next ten years to be as follows:
| U.S. | Non- U.S. |
Total | ||||||||||
| 2010 |
$ | 20,799 | $ | 7,614 | $ | 28,413 | ||||||
| 2011 |
14,930 | 7,424 | 22,354 | |||||||||
| 2012 |
15,465 | 7,313 | 22,778 | |||||||||
| 2013 |
15,828 | 8,400 | 24,228 | |||||||||
| 2014 |
16,151 | 8,285 | 24,436 | |||||||||
| 2015-2019 |
88,588 | 45,048 | 133,636 | |||||||||
The Company estimates it will make cash contributions of approximately $14,800 to its pension plans in 2010.
Note 12. Postretirement Benefits Other Than Pensions
The Company provides certain retiree health care and life insurance benefits covering substantially all U.S. salaried and certain hourly employees and employees in Canada. Employees are generally eligible for benefits upon retirement and completion of a specified number of years of creditable service. Independent actuaries determine postretirement benefit costs for each applicable subsidiary of the Company. The Company’s policy is to fund the cost of these postretirement benefits as these benefits become payable.
The following tables disclose information related to the Company’s postretirement benefit plans.
| 2008 | 2009 | |||||||||||||||
| U.S. | Non- U.S. |
U.S. | Non- U.S. |
|||||||||||||
| Change in benefit obligation: |
||||||||||||||||
| Benefit obligations at beginning of year |
$ | 66,787 | $ | 14,084 | $ | 58,905 | $ | 9,569 | ||||||||
| Measurement change service and interest cost |
1,293 | 354 | — | — | ||||||||||||
| Service cost |
1,471 | 654 | 1,307 | 446 | ||||||||||||
| Interest cost |
3,751 | 760 | 3,493 | 796 | ||||||||||||
| Actuarial loss (gain) |
(5,516 | ) | (3,463 | ) | (2,228 | ) | 749 | |||||||||
| Benefits paid |
(2,610 | ) | (475 | ) | (2,073 | ) | (486 | ) | ||||||||
| Curtailment gain |
— | — | (2,433 | ) | (748 | ) | ||||||||||
| Plan change |
(6,271 | ) | — | (94 | ) | — | ||||||||||
| Other |
— | — | 159 | 338 | ||||||||||||
| Foreign currency exchange rate effect |
— | (2,345 | ) | — | 1,664 | |||||||||||
| Benefit obligation at end of year |
$ | 58,905 | $ | 9,569 | $ | 57,036 | $ | 12,328 | ||||||||
| Funded status of the plans |
$ | (58,905 | ) | $ | (9,569 | ) | $ | (57,036 | ) | $ | (12,328 | ) | ||||
| Net amount recognized at December 31 |
$ | (58,905 | ) | $ | (9,569 | ) | $ | (57,036 | ) | $ | (12,328 | ) | ||||
Included in cumulative other comprehensive loss at December 31, 2009 are the following amounts that have not yet been recognized in net periodic benefit cost: unrecognized prior service credits of $ 11,071 ($11,319 net of tax) and unrecognized actuarial gains of $26,316 ($25,889 net of tax). The amounts included in cumulative other comprehensive loss and expected to be recognized in net periodic benefit cost during the fiscal year-ended December 31, 2010 are ($1,822) and ($1,527), respectively.
F-33
Table of Contents
COOPER-STANDARD HOLDINGS INC.
NOTES TO CONSOLIDATED FINANCIAL STATEMENTS—(Continued)
(Dollar amounts in thousands except per share amounts)
During 2008 plan changes were made to four of the plans. These changes resulted in a decrease of $6,271 in projected benefit obligation at December 31, 2008.
The following table provides the components of net periodic expense for the plans:
| 2007 | 2008 | 2009 | ||||||||||
| Service cost |
$ | 2,509 | $ | 2,125 | $ | 1,753 | ||||||
| Interest cost |
4,901 | 4,511 | 4,289 | |||||||||
| Amortization of prior service credit and recognized actuarial gain |
(908 | ) | (2,895 | ) | (3,290 | ) | ||||||
| Curtailment gain |
— | — | (3,404 | ) | ||||||||
| Other |
— | — | 160 | |||||||||
| Net periodic benefit cost |
$ | 6,502 | $ | 3,741 | $ | (492 | ) | |||||
The curtailment gain for the year ended December 31, 2009 in the table above was recorded as a reduction to restructuring expense.
The weighted average assumed discount rate used to determine domestic benefit obligations was 6.10% and 5.80% at December 31, 2008 and 2009, respectively. The weighted-average assumed discount rate used to determine domestic net periodic expense was 5.75%, 6.25%, and 6.10% for 2007, 2008, and 2009, respectively.
The weighted average assumed discount rate used to determine international benefit obligations was 7.50% and 6.80% at December 31, 2008 and 2009, respectively. The weighted-average assumed discount rate used to determine domestic net periodic expense was 5.25%, 5.50%, and 7.50% for 2007, 2008, and 2009, respectively.
At December 31, 2009, the weighted average assumed annual rate of increase in the cost of health care benefits (health care cost trend rate) was 8.82% for 2010 for the U.S. and 9.0% for Non-U.S. with both grading down over time to 5.0% in 2018. A one-percentage point change in the assumed health care cost trend rate would have had the following effects:
| Increase | Decrease | |||||||
| Effect on service and interest cost components |
$ | 301 | $ | (241 | ) | |||
| Effect on projected benefit obligations |
2,609 | (2,152 | ) | |||||
The Company estimates its benefit payments for its postretirement benefit plans during the next ten years to be as follows:
| U.S. | Non- U.S. |
Total | ||||||||||
| 2010 |
$ | 3,072 | $ | 546 | $ | 3,618 | ||||||
| 2011 |
3,257 | 551 | 3,808 | |||||||||
| 2012 |
3,391 | 561 | 3,952 | |||||||||
| 2013 |
3,520 | 584 | 4,104 | |||||||||
| 2014 |
3,643 | 589 | 4,232 | |||||||||
| 2015 - 2019 |
20,537 | 3,194 | 23,731 | |||||||||
Other post retirement benefits recorded in our consolidated balance sheets include $11,725 and $10,429 as of December 31, 2008 and 2009, respectively, for termination indemnity plans for two of our European locations.
F-34
Table of Contents
COOPER-STANDARD HOLDINGS INC.
NOTES TO CONSOLIDATED FINANCIAL STATEMENTS—(Continued)
(Dollar amounts in thousands except per share amounts)
Note 13. Income Taxes
Components of the Company’s income (loss) before income taxes and adjustment for non-controlling interests are as follows:
| Year Ended December 31, 2007 |
Year Ended December 31, 2008 |
Year Ended December 31, 2009 |
||||||||||
| Domestic |
$ | (182,579 | ) | $ | (124,515 | ) | $ | (285,177 | ) | |||
| Foreign |
65,119 | 31,290 | (126,697 | ) | ||||||||
| $ | (117,460 | ) | $ | (93,225 | ) | $ | (411,874 | ) | ||||
The Company’s provision (benefit) for income taxes consists of the following:
| Year Ended December 31, 2007 |
Year Ended December 31, 2008 |
Year Ended December 31, 2009 |
||||||||||
| Current |
||||||||||||
| Federal |
$ | 5,047 | $ | 2,293 | $ | (7,267 | ) | |||||
| State |
212 | 701 | 417 | |||||||||
| Foreign |
28,983 | 12,256 | (12,039 | ) | ||||||||
| Deferred |
||||||||||||
| Federal |
— | — | — | |||||||||
| State |
(954 | ) | — | — | ||||||||
| Foreign |
(342 | ) | 14,045 | (36,797 | ) | |||||||
| $ | 32,946 | $ | 29,295 | $ | (55,686 | ) | ||||||
The following schedule reconciles the United States statutory federal rate to the income tax provision:
| Year Ended December 31, 2007 |
Year Ended December 31, 2008 |
Year Ended December 31, 2009 |
||||||||||
| Tax at U.S. statutory rate |
$ | (41,111 | ) | $ | (32,629 | ) | $ | (144,156 | ) | |||
| State and local taxes |
(4,732 | ) | (1,359 | ) | (5,999 | ) | ||||||
| Tax credits |
(9,675 | ) | (6,995 | ) | (11,433 | ) | ||||||
| Goodwill Impairment |
50,024 | 8,099 | 50,712 | |||||||||
| Worthless security deduction |
(23,947 | ) | — | — | ||||||||
| Liquidation of foreign subsidiary |
— | 17,703 | — | |||||||||
| US-Canada APA Settlement |
— | — | 7,132 | |||||||||
| Effect of tax rate changes |
4,891 | (1,304 | ) | (260 | ) | |||||||
| Foreign withholding taxes |
5,176 | 2,529 | 861 | |||||||||
| Effect of foreign tax rates |
(4,130 | ) | (6,828 | ) | (1,141 | ) | ||||||
| Valuation allowance |
51,788 | 45,154 | 39,898 | |||||||||
| Other, net |
4,662 | 4,925 | 8,700 | |||||||||
| Income tax provision (benefit) |
$ | 32,946 | $ | 29,295 | $ | (55,686 | ) | |||||
| Effective income tax rate |
(28.0 | )% | (31.4 | )% | 13.5 | % | ||||||
F-35
Table of Contents
COOPER-STANDARD HOLDINGS INC.
NOTES TO CONSOLIDATED FINANCIAL STATEMENTS—(Continued)
(Dollar amounts in thousands except per share amounts)
Payment for income taxes net of refunds in 2007, 2008, and 2009 was $20,622, $25,797 and ($1,006) respectively. These amounts do not include any payments or refunds of income taxes related to the US-Canada Advanced Pricing Agreement settlement.
Deferred tax assets and liabilities reflect the estimated tax effect of accumulated temporary differences between the basis of assets and liabilities for tax and financial reporting purposes, as well as net operating losses, tax credit and other carryforwards. Significant components of the Company’s deferred tax assets and liabilities at December 31 are as follows:
| 2008 | 2009 | |||||||
| Deferred tax assets: |
||||||||
| Postretirement and other benefits |
$ | 73,339 | $ | 68,398 | ||||
| Capitalized expenditures |
12,765 | 10,892 | ||||||
| Net operating loss and tax credit carryforwards |
179,923 | 193,817 | ||||||
| All other items |
38,741 | 36,518 | ||||||
| Total deferred tax assets |
304,768 | 309,625 | ||||||
| Deferred tax liabilities: |
||||||||
| Property, plant and equipment |
(39,071 | ) | (38,990 | ) | ||||
| Intangibles |
(77,098 | ) | — | |||||
| All other items |
(2,497 | ) | (12,129 | ) | ||||
| Total deferred tax liabilities |
(118,666 | ) | (51,119 | ) | ||||
| Valuation allowances |
(175,215 | ) | (210,650 | ) | ||||
| Net deferred tax assets (liabilities) |
$ | 10,887 | $ | 47,856 | ||||
The net deferred taxes in the consolidated balance sheet are as follows:
| 2008 | 2009 | |||||||
| Current Assets |
$ | 9,078 | $ | 7,239 | ||||
| Non-Current Assets |
32,508 | 58,555 | ||||||
| Current Liabilities |
(2,434 | ) | (10,063 | ) | ||||
| Non-Current Liabilities |
(28,265 | ) | (7,875 | ) | ||||
| $ | 10,887 | $ | 47,856 | |||||
At December 31, 2009, the U.S. has operating loss carryforwards of $83,400 with expiration dates beginning in 2027. The Company’s foreign subsidiaries, primarily in France, Brazil, Germany, UK and Australia, have operating loss carryforwards aggregating $124,500 with indefinite expiration periods while Spain has an operating loss carryforward of $14,700 with expiration dates beginning in 2010. Other foreign subsidiaries in China, India, Mexico, Italy, the Netherlands, Belgium, Czech Republic and Korea have operating losses aggregating $64,900, with expiration dates beginning in 2013. The Company’s Polish subsidiaries have special economic zone credits totaling $26,200. The Company’s Czech Republic subsidiary has an income tax incentive totaling $5,800. The U.S. foreign tax credit and research tax credit carryforwards are $36,400 and $16,700 respectively, with expiration dates beginning in 2015 and 2023. The Company and its domestic subsidiaries have anticipated tax benefits of state net operating losses and credit carryforwards of $22,000 with expiration dates beginning in 2010.
F-36
Table of Contents
COOPER-STANDARD HOLDINGS INC.
NOTES TO CONSOLIDATED FINANCIAL STATEMENTS—(Continued)
(Dollar amounts in thousands except per share amounts)
During 2009, due to our recent operating performance in the United States and current industry conditions, we continued to assess, based upon all available evidence, that it was more likely than not that we would not realize our U.S. deferred tax assets. During 2009, our U.S. valuation allowance increased by $33,100, primarily related to operating losses incurred in the United States during 2009, offset by reductions in tax attributes resulting from the settlement of the U.S. and Canadian Advanced Pricing Agreement. Going forward, the need to maintain valuation allowances against deferred tax assets in the U.S. and other affected countries will cause variability in the Company’s effective tax rate. The Company will maintain a full valuation allowance against our deferred tax assets in the U.S. and applicable foreign countries until sufficient positive evidence exists to eliminate them. Effective January 1, 2009, with the adoption of ASC Topic 805 the benefit of the reversal of the valuation allowances on pre-acquisition contingencies will be included as a component of income tax expense.
Deferred income taxes have not been provided on approximately $300,000 of undistributed earnings of foreign subsidiaries as such amounts are considered permanently reinvested. It is not practical to estimate any additional income taxes and applicable withholding taxes that would be payable on remittance of such undistributed earnings.
Under the terms of the Stock Purchase Agreement with Cooper Tire, the Company is indemnified against substantially all contingent income tax liabilities related to periods prior to the 2004 Acquisition. During March 2008 the Company became aware of a potentially favorable settlement of the pending bi-lateral Advance Pricing Arrangement (“APA”) negotiations between the United States (US) and Canada relating to the periods 2000—2007. Agreement between the two governments will impact transfer pricing matters between the Company and its wholly owned Canadian subsidiary. In March 2009, the US and Canadian governments signed Mutual Agreement Letters agreeing to the terms of the bi-lateral APA. On June 23, 2009, the final Canadian bi-lateral Advance Pricing Agreement with the Company was completed and signed. The settlement of the bi-lateral APA results in income tax refunds to Cooper-Standard Automotive Canada for the years 2000—2007 of up to $88,000 Canadian dollars. Under the terms of the Stock Purchase Agreement with Cooper Tire and Rubber Company (“CTR”) dated September 16, 2004, CTR has a claim against the Company for the amount of tax refunds received by Cooper-Standard Automotive Canada relating to the years 2000—2004. Refunds received from the Canadian government will be based on the preparation of amended tax returns for the years 2000—2007. The settlement of the APA should also result in a corresponding increase to the US taxable income of CSA for the years 2005—2007, but is not expected to result in any significant cash payment as the increased U.S. tax liability will be largely offset by existing tax credit carryforwards. On July 27, 2009, Cooper Standard Automotive Canada received approximately CAD $80,000 which represented the federal portion of the expected refunds plus interest as a result of settlement of the Canadian APA.
The Company, CSA U.S. and CSA Canada (collectively, the “Defendants”) were named as defendants in an adversary proceeding (Case No. 09-52014 (PJW)) initiated by Cooper Tire & Rubber Company and Cooper Tire Rubber & Company UK Limited (together, “CTR”) in the Bankruptcy Court on August 19, 2009 (the “CTR Adversary Proceeding”). CTR’s complaint had sought a declaratory judgment that CTR was entitled to a portion of the CAD$80,000 tax refund received by CSA Canada from the Canadian government on July 27, 2009 and a portion of all future refunds received by CSA Canada, in each case relating to the period prior to the Company’s 2004 Acquisition. CTR also sought imposition of a resulting trust or, in the alternative, a constructive trust in favor of CTR and turnover of the portion of the Canadian income tax refunds attributable to the years 2000 through 2004. On September 29, 2009, the Canadian Court issued an order lifting the stay in the Canadian Proceedings to allow CTR to commence proceedings against CSA Canada in the Chapter 11 Cases and ordering all income tax refunds received by CSA Canada after September 29, 2009 be segregated immediately upon receipt and not disbursed, encumbered or otherwise dealt with in any way until further order of the Canadian Court. On October 5, 2009, CTR filed an amended complaint in the adversary proceeding against the Company,
F-37
Table of Contents
COOPER-STANDARD HOLDINGS INC.
NOTES TO CONSOLIDATED FINANCIAL STATEMENTS—(Continued)
(Dollar amounts in thousands except per share amounts)
CSA U.S. and CSA Canada. It is the Company’s belief that CTR’s right to tax refunds for pre-acquisition periods is that of a general unsecured creditor and is subject to the general rules and processes of the Chapter 11 Cases. In connection with the CTR Adversary Proceedings, the Defendants, CTR and the Creditors’ Committee entered into an Agreement Concerning Terms and Conditions of a Compromise and Settlement, dated March 17, 2010 (the “CTR Settlement Agreement”). Under the terms of the CTR Settlement Agreement, which is subject to Bankruptcy Court approval CTR agreed to dismiss its complaint in the Bankruptcy Court with prejudice and claim no further entitlement to the tax refunds. The Defendants agreed to, among other things, (i) pay CTR approximately $17,600 in cash and (ii) to obtain a release of CTR’s obligations in connection with a guarantee of one of the Company’s leases or, alternatively, provide a letter of credit in favor of CTR, in the initial amount of $7,000 (but declining by $1,000 per year for seven years) to reimburse CTR for any amounts that it is required to pay the Company’s landlord on account of such guarantee. The Defendants and CTR have also granted general mutual releases to each other with respect to claims and liabilities under the purchase agreement governing the 2004 Acquisition and other claims and liabilities, subject to certain exceptions relating to certain continuing indemnification obligations. As noted above, the effectiveness of the CTR Settlement Agreement is subject to Bankruptcy Court approval, and the Bankruptcy Court has scheduled a hearing on April 15, 2010 to consider the settlement.
At December 31, 2009, the Company has $3,218 ($3,654 including interest and penalties) of total unrecognized tax benefits. Of this total, $1,236 represents the amount of unrecognized tax benefits that, if recognized, would affect the effective income tax rate. The total unrecognized tax benefits differ from the amount which would effect the effective tax rate due to the impact of valuation allowances and the impact of Cooper Tire indemnifying substantially all income tax liabilities resulting from periods prior to the 2004 Acquisition.
A reconciliation of the beginning and ending amount of unrecognized tax benefits is as follows (in thousands):
| Year Ended December 31, 2007 |
Year Ended December 31, 2008 |
Year Ended December 31, 2009 |
||||||||||
| Balance as of January 1 |
$ | 4,021 | $ | 3,930 | $ | 4,728 | ||||||
| Tax Positions related to the current period |
||||||||||||
| Gross Additions |
568 | 411 | 255 | |||||||||
| Gross Reductions |
— | — | — | |||||||||
| Tax Positions related to prior years |
||||||||||||
| Gross Additions |
167 | 1,127 | — | |||||||||
| Gross Reductions |
— | (244 | ) | (1,086 | ) | |||||||
| Settlements |
(362 | ) | (32 | ) | (59 | ) | ||||||
| Lapses on Statutes of Limitations |
(464 | ) | (464 | ) | (620 | ) | ||||||
| Balance as of December 31 |
$ | 3,930 | $ | 4,728 | $ | 3,218 | ||||||
The Company, or one of its subsidiaries, files income tax returns in the United States and other foreign jurisdictions. Under the terms of the Stock Purchase Agreement with Cooper Tire, the Company is indemnified against substantially all income tax liabilities related to periods prior to the 2004 Acquisition. Subsequently, in the United States, all Internal Revenue Service examinations prior to the 2004 Acquisition are the responsibility of Cooper Tire; therefore the Company is not subject to U.S. federal, state, or local tax examinations for years ending December 23, 2004 and prior. The Internal Revenue Service (IRS) completed an examination of the Company’s U.S. income tax returns for 2005 and 2006 during 2009. The only material adjustments were those related to the US and Canada Advanced Pricing Agreement. It is anticipated that an examination of the Company’s U.S. income tax returns for 2007 and 2008 will begin during Q1 of 2010. The Company’s foreign
F-38
Table of Contents
COOPER-STANDARD HOLDINGS INC.
NOTES TO CONSOLIDATED FINANCIAL STATEMENTS—(Continued)
(Dollar amounts in thousands except per share amounts)
subsidiaries are legally required to comply with the statute of limitations in each jurisdiction; however the Company is indemnified against substantially all income tax liabilities that may result from periods prior to the 2004 Acquisition. The Company’s major foreign jurisdictions are Brazil, Canada, France, Germany, Italy, Mexico and Poland. The Company is no longer subject to income tax examinations in major foreign jurisdictions for years prior to 2002.
The Company does not anticipate any significant changes to its total unrecognized tax benefits within the next 12 months.
The Company classifies all tax related interest and penalties as income tax expense. At December 31, 2009, the Company has recorded $436 in liabilities for tax related interest and penalties on its Consolidated Balance Sheet.
Note 14. Lease Commitments
The Company rents certain manufacturing facilities and equipment under long-term leases expiring at various dates. Rental expense for operating leases was $22,303, $23,331, and $21,570 for 2007, 2008, and 2009.
Future minimum payments for all non-cancelable operating leases are as follows:
| 2010 |
$ | 14,546 | ||
| 2011 |
12,097 | |||
| 2012 |
9,715 | |||
| 2013 |
8,527 | |||
| 2014 |
6,713 | |||
| Thereafter |
19,981 |
Note 15. Accumulated Other Comprehensive Income (Loss)
Cumulative other comprehensive income (loss) in the accompanying balance sheets consists of:
| 2007 | 2008 | 2009 | ||||||||||
| Cumulative currency translation adjustment |
$ | 57,505 | $ | (1,424 | ) | $ | 24,474 | |||||
| Benefit plan liability |
23,977 | (28,540 | ) | (33,159 | ) | |||||||
| Tax effect |
916 | (181 | ) | 939 | ||||||||
| Net |
24,893 | (28,721 | ) | (32,220 | ) | |||||||
| Fair value change of derivatives |
(16,748 | ) | (32,685 | ) | (22,742 | ) | ||||||
| Tax effect |
3,338 | 3,294 | (549 | ) | ||||||||
| Net |
(13,410 | ) | (29,391 | ) | (23,291 | ) | ||||||
| $ | 68,988 | $ | (59,536 | ) | $ | (31,037 | ) | |||||
The adoption of ASC Topic 810 resulted in the reclassification of amounts previously attributable to minority interest (now referred to as noncontrolling interest) to a separate component of stockholders’ equity on the accompanying consolidated balance sheets. Additionally, net income attributable to noncontrolling interests is shown separately from net income in the consolidated statement of operations. This reclassification has no effect on our previously reported results of operations.
F-39
Table of Contents
COOPER-STANDARD HOLDINGS INC.
NOTES TO CONSOLIDATED FINANCIAL STATEMENTS—(Continued)
(Dollar amounts in thousands except per share amounts)
Note 16. Contingent Liabilities
Employment Contracts
The Company has employment arrangements with certain key executives that provide for continuity of management. These arrangements include payments of multiples of annual salary, certain incentives, and continuation of benefits upon the occurrence of specified events in a manner that is believed to be consistent with comparable companies.
Unconditional Purchase Orders
Noncancellable purchase order commitments for capital expenditures made in the ordinary course of business were $12,593 and $19,252 at December 31, 2008 and 2009, respectively.
Legal and Other Claims
The Company is periodically involved in claims, litigation, and various legal matters that arise in the ordinary course of business. In addition, the Company conducts and monitors environmental investigations and remedial actions at certain locations. Each of these matters is subject to various uncertainties, and some of these matters may be resolved unfavorably with respect to the Company. A reserve estimate is established for each matter and updated as additional information becomes available. Based on the information currently known to us, we do not believe that the ultimate resolution of any of these matters will have a material adverse effect on our financial condition, results of operations, or cash flows.
Note 17. Other Income (Expense), net
The components of Other Income (Expense) for the years 2007, 2008, and 2009 are as follows:
| Year Ended December 31, 2007 |
Year Ended December 31, 2008 |
Year Ended December 31, 2009 |
||||||||||
| Foreign currency gains (losses) |
$ | (454 | ) | $ | (845 | ) | $ | 4,455 | ||||
| Gain on debt repurchase |
— | 1,696 | 9,096 | |||||||||
| Loss on disposal of fixed assets |
(14 | ) | — | — | ||||||||
| Interest rate swaps |
— | — | (2,414 | ) | ||||||||
| Loss on sale of receivables |
— | (2,219 | ) | (1,218 | ) | |||||||
| Other income (expense) |
$ | (468 | ) | $ | (1,368 | ) | $ | 9,919 | ||||
Prior year amounts related to noncontrolling interest (minority interest) historically reflected as a component of other income (expense) have been reclassified to conform to current year presentation as required by ASC Topic 810. The adoption of ASC Topic 810 resulted in the reclassification of amounts being reported as minority interest, totaling $587 and ($1,069), for the years ended December 31, 2007 and 2008, respectively, being shown separately from net income (loss) in the accompanying consolidated statement of operations.
Note 18. Related Party Transactions
Sales to NISCO, a 50% owned joint venture, totaled $30,941, $26,658, and $21,705, in 2007, 2008, and 2009, respectively. In 2008, the Company received from NISCO a dividend of $5,000 all of which was related to earnings.
Purchases of materials from Guyoung Technology Co. Ltd, a 20% owned joint venture, totaled $5,041, $1,313 and $4,204 in 2007, 2008 and 2009, respectively.
F-40
Table of Contents
COOPER-STANDARD HOLDINGS INC.
NOTES TO CONSOLIDATED FINANCIAL STATEMENTS—(Continued)
(Dollar amounts in thousands except per share amounts)
In connection with the MAPS acquisition, the Company received $15,000 of capital contributions from each of its two Sponsors and their respective affiliates in 2007. The Company also paid $625 of transaction advisory fees to each of its two Sponsors in 2007.
Note 19. Capital Stock and Stock Options
In 2004, the Company was formed and was capitalized in conjunction with the 2004 Acquisition via the sale of 3,180,000 shares of common stock for $318,000 to affiliates of The Cypress Group L.L.C. and GS Capital Partners 2000, L.P., whom we refer to as our “Sponsors”. Pursuant to subscription agreements entered into as of August 27, 2007, the Company issued a total of 250,000 additional shares of common stock to its Sponsors for $30,000 which was invested by the Sponsors in connection with the financing of the Company’s August 2007 acquisition of certain Metzeler Automotive Profile Systems sealing operations. Following the 2004 Acquisition and through December 31, 2007, five members of the board of directors and certain members of senior management purchased $4,910 of common stock. The Company repurchased $300 of common stock during 2005 from one such member of senior management whose employment with the Company terminated in 2005 and another $450 of common stock during 2007 from another such member of senior management whose employment with the Company terminated in 2006 and another $540 of common stock during 2008 from another such member of senior management whose employment with the Company terminated in 2007.
Effective as of the closing of the 2004 Acquisition, the Company established the 2004 Cooper-Standard Holdings Inc. Stock Incentive Plan, which permits the granting of nonqualified and incentive stock options, stock appreciation rights, restricted stock, and other stock-based awards to employees and directors. As of December 31, 2008 and 2009, the Company had 423,615 shares of common stock reserved for issuance under the plan, including outstanding options granted to certain employees and directors to purchase 192,615 and 168,017 shares of common stock, respectively, at a price of $100 per share, which was determined by the Company to be fair market value. In addition, there are also outstanding options granted to certain employees and directors to purchase 27,000 shares of common stock at a price of $120 per share. These options have a ten-year life. Of the options outstanding as of December 31, 2008 and 2009, options covering 165,239 and 140,641 shares of common stock, respectively, were granted upon the closing of the 2004 Acquisition or in the first year thereafter. During 2009, options covering 24,598 of these shares were forfeited. These options were issued prior to the effective date of ASC Topic 718 and therefore are accounted for in accordance with APB No. 25 and no stock compensation is required to be recognized. Of the 140,641 options outstanding at December 31, 2009, 108,326 are vested with a weighted average remaining contractual term of 5 years. A summary of option transactions for the years ended 2007, and 2008 for options that were granted after the effective date of ASC Topic 718 is shown below:
| 2007 | 2008 | 2009 | ||||||||||||||||||||||
| Options | Wtd. Avg. Ex. Price |
Options | Wtd. Avg. Ex. Price |
Options | Wtd. Avg. Ex. Price |
|||||||||||||||||||
| Outstanding at Beginning of Year |
4,025 | $ | 100.00 | 29,487 | $ | 100.00 | 54,376 | $ | 109.93 | |||||||||||||||
| Granted |
25,462 | $ | 100.00 | 27,000 | $ | 120.00 | — | $ | — | |||||||||||||||
| Cancelled |
— | $ | — | (655 | ) | $ | 100.00 | — | $ | — | ||||||||||||||
| Forfeited |
— | $ | — | (1,456 | ) | $ | 100.00 | — | $ | — | ||||||||||||||
| Outstanding at End of Year |
29,487 | $ | 100.00 | 54,376 | $ | 109.93 | 54,376 | $ | 109.93 | |||||||||||||||
| Exercisable at End of Year |
4,264 | $ | 100.00 | 24,566 | $ | 108.01 | 38,960 | $ | 110.10 | |||||||||||||||
| Weighted Average Fair Value of Options Granted |
$ | 46.02 | $ | 42.39 | $ | — | ||||||||||||||||||
| Weighted Average Remaining Contractual Life (years): |
||||||||||||||||||||||||
| Outstanding at End of Year |
9.2 | 8.7 | 7.7 | |||||||||||||||||||||
| Exercisable at End of Year |
9.2 | 8.6 | 7.8 | |||||||||||||||||||||
F-41
Table of Contents
COOPER-STANDARD HOLDINGS INC.
NOTES TO CONSOLIDATED FINANCIAL STATEMENTS—(Continued)
(Dollar amounts in thousands except per share amounts)
Stock compensation expense totaling $561, $635 and $699 has been recognized in 2007, 2008, and 2009, respectively for these options.
One-half of the options granted to employees in the initial one-year period following the 2004 Acquisition vest on a time basis, 20% per year over five years; the remaining one-half vest on a performance basis at a rate of between 0% and 20% per year, depending on the extent to which established performance targets are attained, with 85% attainment of performance targets being the threshold for any vesting. Performance-based options granted during this period are subject to certain acceleration provisions and, regardless of the achievement of performance targets in any year, may vest in full in the event of a transaction in which the Company’s Sponsors realize an internal rate of return of at least 20% on their investment in the Company, or may vest in full 8 years following the date of grant if the compensation committee determines that certain accounting treatment would be required in the absence of such vesting. The same principles apply in the case of options granted after this initial period but before 2008, except that only the last three years of the five-year period applicable to options granted in the initial period are taken into account, and vesting occurs in increments of 33% rather than 20%. With respect to options granted in 2008, two-thirds of the options vest on a time basis at a rate of 50% per year over two years and the remaining one-third were eligible for vesting based on the performance of the Company in 2008. Options granted to employees covering 131,403 and 140,685 shares were vested as of December 31, 2008 and 2009, respectively. All of the options granted to directors vest on a time basis, 20% per year over five years in the case of options granted before 2008, and 50% per year over two years in the case of options granted in 2008. Options granted to directors covering an aggregate of 3,700 and 6,600 shares were vested as of December 31, 2008 and 2009, respectively.
The Company uses expected volatility of similar entities to develop the expected volatility. The expected option life was calculated using the simplified method. The risk free rate is based on U.S. Treasury zero-coupon issues with a term equal to the expected option life, on the date the stock options were granted. Fair value for the shares that are accounted for under ASC Topic 718 was estimated at the date of the grant using the Black-Scholes option pricing model using the following weighted average assumptions:
| 2007 | 2008 | |||
| Expected volatility |
40.00% | 34.00% | ||
| Dividend yield |
0.00% | 0.00% | ||
| Expected option life |
6.0 years | 5.5 years | ||
| Risk-free rate |
4.50% | 2.40% - 2.65% |
No options were granted during 2009.
The Company also maintains a nonqualified Deferred Compensation Plan which allows eligible executives and directors to defer base pay, bonus payments and long-term incentive pay and have it allocated on a pre-tax basis to various investment alternatives and ultimately distributed to the executive at a designated time in the future. In December 2006, a new plan feature referred to as the “Management Stock Purchase Plan” was established which provides participants the opportunity to “purchase” Company stock units with income deferred under the deferred compensation plan at a price based on the fair value of Company common stock determined on a semi-annual basis by the compensation committee of the Company’s board of directors. Purchased stock units are matched by the Company at year-end on a one-for-one basis, subject to plan provisions which allow for an annual cap on the aggregate number of matching stock units, which the compensation committee may apply in its discretion. On December 31, 2009, approximately 37,417 Company stock units at $50 per unit were outstanding under this plan, subject to certain adjustments based on net actual incentive payments. Approximately 18,658 of these stock units are matching stock units that generally vest ratably over a three year period. As of
F-42
Table of Contents
COOPER-STANDARD HOLDINGS INC.
NOTES TO CONSOLIDATED FINANCIAL STATEMENTS—(Continued)
(Dollar amounts in thousands except per share amounts)
December 31, 2009, approximately 11,646 units were vested. In accordance with ASC Topic 718, for units granted to retirement eligible employees, compensation expense must be recognized immediately, since employees meeting eligibility for retirement would be immediately vested in this plan upon leaving employment. Compensation expense related to Company stock units equaled $988, $629, and $662, in 2007, 2008, and 2009, respectively.
Note 20. Business Segments
During 2007, the Company began managing its operations through three business segments: Body & Chassis Systems, Fluid Systems, and Asia Pacific. The Body & Chassis segment consisted mainly of body sealing products and components that protect vehicle interiors from weather, dust, and noise intrusion as well as systems and components that control and isolate noise vibration in a vehicle to improve ride and handling. The Fluid segment consisted primarily of subsystems and components that direct, control, measure, and transport fluids and vapors throughout a vehicle. The Asia Pacific segment consisted of both Body & Chassis and Fluid operations in that region with the exception of the Company’s interest in a joint venture in China which was acquired as part of the MAPS acquisition, and the MAP India joint venture. These joint ventures were included in the Body & Chassis segment which was in line with the internal management structure. The Company continued to report its operating results in three business segments for all of 2008 and the first quarter of 2009.
On March 26, 2009, the Company announced the implementation of a plan involving the discontinuation of its global Body & Chassis and Fluid Systems operating divisions and the establishment of a new operating structure organized on the basis of geographic regions. Under the plan, the Company’s operating structure as well as reporting segments, has changed, and the Company revised its segment disclosures beginning with the second quarter of 2009 from the three previously used reportable segments to two reportable segments, North America and International (comprising all of the Company’s operations outside of North America). Prior periods have been revised to conform to the current period presentation. The Company recognized a charge of $7,800 and $18,656 in 2008 and 2009, related to this realignment. See Note 6. “Restructuring” for discussions on the restructuring. Due to this segment revision, the Company has also revised the previously reported amounts in Note 9, “Goodwill and Intangibles,” to conform to the new segment presentation.
ASC Topic 280, “Segment Reporting,” establishes the standards for reporting information about operating segments in financial statements. In applying the criteria set forth in ASC 280, the Company has determined that it operates in two segments.
The accounting policies of the Company’s business segments are consistent with those described in Note 2. The Company evaluates segment performance based on segment profit before tax. The results of each segment include certain allocations for general, administrative, interest, and other shared costs. However, certain shared costs are not allocated to the segments and are included below in Eliminations and other. Intersegment sales are conducted at market prices. Segment assets are calculated based on a moving average over several quarters and exclude corporate assets, goodwill, intangible assets, deferred taxes, and certain other assets.
F-43
Table of Contents
COOPER-STANDARD HOLDINGS INC.
NOTES TO CONSOLIDATED FINANCIAL STATEMENTS—(Continued)
(Dollar amounts in thousands except per share amounts)
The following table details information on the Company’s business segments:
| For the Year Ended December 31, | ||||||||||||
| 2007 | 2008 | 2009 | ||||||||||
| Sales to external customers |
||||||||||||
| North America |
$ | 1,526,458 | $ | 1,244,423 | $ | 910,306 | ||||||
| International |
984,695 | 1,350,154 | 1,034,953 | |||||||||
| Consolidated |
$ | 2,511,153 | $ | 2,594,577 | $ | 1,945,259 | ||||||
| Intersegment sales |
||||||||||||
| North America |
$ | 5,528 | $ | 3,687 | $ | 4,377 | ||||||
| International |
12,363 | 11,585 | 5,467 | |||||||||
| Eliminations and other |
(17,891 | ) | (15,272 | ) | (9,844 | ) | ||||||
| Consolidated |
$ | — | $ | — | $ | — | ||||||
| Segment profit |
||||||||||||
| North America |
$ | (86,723 | ) | $ | (36,662 | ) | $ | (246,015 | ) | |||
| International |
(30,737 | ) | (56,563 | ) | (165,859 | ) | ||||||
| Income before income taxes |
$ | (117,460 | ) | $ | (93,225 | ) | $ | (411,874 | ) | |||
| Depreciation and amortization expense |
||||||||||||
| North America |
$ | 85,617 | $ | 77,135 | $ | 60,192 | ||||||
| International |
46,788 | 59,199 | 49,240 | |||||||||
| Eliminations and other |
3,644 | 3,771 | 4,345 | |||||||||
| Consolidated |
$ | 136,049 | $ | 140,105 | $ | 113,777 | ||||||
| Capital expenditures |
||||||||||||
| North America |
$ | 45,738 | $ | 27,565 | $ | 14,194 | ||||||
| International |
58,263 | 54,783 | 30,076 | |||||||||
| Eliminations and other |
3,254 | 9,777 | 1,843 | |||||||||
| Consolidated |
$ | 107,255 | $ | 92,125 | $ | 46,113 | ||||||
| Segment assets |
||||||||||||
| North America |
$ | 938,946 | $ | 694,442 | ||||||||
| International |
791,531 | 877,971 | ||||||||||
| Eliminations and other |
87,774 | 164,994 | ||||||||||
| Consolidated |
$ | 1,818,251 | $ | 1,737,407 | ||||||||
Net interest expense (income) included in segment profit for North America totaled $40,430, $45,831 and $31,013 for the years ended December 31, 2007, 2008 and 2009, respectively. International totaled $49,147, $47,063 and $33,320 for the years ended December 31, 2007, 2008 and 2009, respectively.
Restructuring costs included in segment profit for North America totaled $9,360, $13,356 and $8,624 for the years ended December 31, 2007, 2008 and 2009, respectively. International restructuring costs totaled $17,026, $24,944 and $23,787 for the years ended December 31, 2007, 2008 and 2009, respectively.
F-44
Table of Contents
COOPER-STANDARD HOLDINGS INC.
NOTES TO CONSOLIDATED FINANCIAL STATEMENTS—(Continued)
(Dollar amounts in thousands except per share amounts)
Geographic information for revenues, based on country of origin, and long-lived assets is as follows:
| 2007 | 2008 | 2009 | ||||||||||
| Revenues |
||||||||||||
| United States |
$ | 857,051 | $ | 668,500 | $ | 516,411 | ||||||
| Canada |
380,793 | 304,652 | 175,670 | |||||||||
| Mexico |
288,614 | 271,271 | 218,225 | |||||||||
| Germany |
324,305 | 440,393 | 277,859 | |||||||||
| Other |
660,390 | 909,761 | 757,094 | |||||||||
| Consolidated |
$ | 2,511,153 | $ | 2,594,577 | $ | 1,945,259 | ||||||
| Tangible long-lived assets |
||||||||||||
| United States |
$ | 167,287 | $ | 138,098 | ||||||||
| Canada |
50,773 | 48,450 | ||||||||||
| Mexico |
55,295 | 54,363 | ||||||||||
| Germany |
108,608 | 102,796 | ||||||||||
| Other |
242,024 | 242,472 | ||||||||||
| Consolidated |
$ | 623,987 | $ | 586,179 | ||||||||
Sales to customers of the Company which contributed ten percent or more of its total consolidated Sales and the related percentage of consolidated Company sales for 2007, 2008, and 2009 are as follows:
| Customer |
2007 Percentage of Combined Sales |
2008 Percentage of Combined Sales |
2009 Percentage of Combined Sales |
|||||||||
| Ford |
27 | % | 25 | % | 31 | % | ||||||
| General Motors |
20 | % | 16 | % | 14 | % | ||||||
Note 21. Fair Value of Financial Instruments
Fair values of the Senior Notes and the Senior Subordinated Notes approximated $146,900 and $256,106 at December 31, 2008 and December 31, 2009 based on quoted market prices, compared to the recorded values totaling $523,350 and $505,300, respectively. Fair values of the Term Loans approximated $247,600 and $512,828 at December 31, 2008 and December 31, 2009, based on quoted market prices, compared to the recorded values totaling $530,000 and $520,637, respectively. The fair value of the DIP financing approximated $177,188 at December 31, 2009, based on quoted market prices, compared to the recorded value totaling $175,000 at December 31, 2009.
The Company uses derivative financial instruments, including forwards and swap contracts to manage its exposures to fluctuations in foreign exchange, interest rates and commodity prices. For a fair value hedge both the effective and ineffective, if significant, portions are recorded in earnings and reflected in the consolidated statement of operations. For a cash flow hedge, the effective portion of the change in the fair value of the derivative is recorded in accumulated other comprehensive income (loss) in the consolidated balance sheet. The ineffective portion, if significant, is recorded in other income or expense. When the underlying hedged transaction is realized or the hedged transaction is no longer probable, the gain or loss included in accumulated other comprehensive income (loss) is recorded in earnings and reflected in the consolidated statement of operations on the same line as the gain or loss on the hedged item attributable to the hedged risk.
F-45
Table of Contents
COOPER-STANDARD HOLDINGS INC.
NOTES TO CONSOLIDATED FINANCIAL STATEMENTS—(Continued)
(Dollar amounts in thousands except per share amounts)
The Company formally documents its hedge relationships, including the identification of the hedging instruments and the hedged items, as well as its risk management objectives and strategies for undertaking the cash flow hedges. The Company also formally assesses whether a cash flow hedge is highly effective in offsetting changes in the cash flows of the hedged item. Derivatives are recorded at fair value in other current assets and other current liabilities.
Derivative Instruments and Hedging Activities
The failure to make the scheduled interest payments on the Senior Notes and Senior Subordinated Notes and the expiration of the applicable 30-day period on July 16, 2009 constituted a “cross-default” under the Company’s ISDA Agreements in the names of Cooper-Standard Automotive, Inc., Cooper-Standard Automotive Canada, Limited and Cooper-Standard Automotive International Holdings B.V., with its various senior lenders as counterparties. As a result, the counterparties to certain outstanding derivative contracts under these ISDA Agreements elected to exercise their option of early termination under such contracts. Certain interest rate, foreign exchange and commodity swap derivatives that were designated under ASC 815 as cash flow hedges were terminated for the purposes of ASC 815 as a result of the failure to make the interest payment and in anticipation of the termination events. The value of these terminated derivatives, totaling $18,090, is classified as liabilities subject to compromise. The amounts in accumulated other comprehensive income at termination were frozen and will be recognized at the time the Company emerges from bankruptcy to the statement of operations over the remaining life of the underlying exposures.
Cash Flow Hedges
Forward foreign exchange contracts—The Company enters into forward contracts to hedge currency risk of the U.S. Dollar against the Euro. The forward contracts are used to mitigate the potential volatility to earnings and cash flow arising from changes in currency exchange rates that impact the Company’s foreign currency transactions. The gain or loss on the forward contracts is reported as a component of other comprehensive income (loss) (OCI) and reclassified into earnings in the same period or periods during which the hedged transaction affects earnings. For the year ended December 31, 2009, $(30) was reclassified from AOCI into cost of products sold.
For the forward contracts terminated as cash flow hedges for the year ended December 31, 2009, $4,838 was reclassified from AOCI into cost of products sold.
Interest rate swaps—The Company has an interest rate swap contract to manage cash flow fluctuations of variable rate debt due to changes in market interest rates. This contract which fixes the interest payment of a certain variable rate debt instrument is accounted for as a cash flow hedge. As of December 31, 2009, the USD notional amount of this contract was $9,508. At December 31, 2009, the fair value before taxes of the Company’s interest rate swap contract was $(406) and is recorded in accrued liabilities and other long-term liabilities in the Company’s consolidated balance sheet with the offset reflected in accumulated other comprehensive income (loss) (AOCI), net of deferred taxes. For the year ended December 31, 2009, $146 was reclassified from AOCI into interest expense. The amount to be reclassified in the next twelve months is expected to be approximately $(204).
For interest rate swaps terminated as cash flow hedges, $(22,912) is recognized in OCI as of December 31, 2009. For the year ended December 31, 2009, $6,807 was reclassified from AOCI into interest expense and for the year ended December 31, 2009, $2,414 was reclassified from AOCI to other expense (income).
F-46
Table of Contents
COOPER-STANDARD HOLDINGS INC.
NOTES TO CONSOLIDATED FINANCIAL STATEMENTS—(Continued)
(Dollar amounts in thousands except per share amounts)
Commodity price hedges—The Company has exposure to the prices of commodities in the procurement of certain raw materials. The primary purpose of the Company’s commodity price hedging activities is to manage the volatility associated with these forecasted purchases. The Company primarily utilized forward contracts with maturities of less than 24 months, which were accounted for as cash flow hedges. These instruments were intended to offset the effect of changes in commodity prices on forecasted inventory purchases. As of December 31, 2009, these forward contracts have been terminated as cash flow hedges. For the year ended December 31, 2009, $3,774 was reclassified from AOCI to cost of products sold.
Fair Value Measurements
ASC clarifies that fair value is an exit price, representing the amount that would be received to sell an asset or paid to transfer a liability in an orderly transaction between market participants. As such, fair value is a market-based measurement that should be determined based upon assumptions that market participants would use in pricing an asset or liability. As a basis for considering such assumptions, ASC establishes a three-tier fair value hierarchy, which prioritizes the inputs used in measuring fair value as follows:
| Level 1: |
Observable inputs such as quoted prices in active markets; | |
| Level 2: |
Inputs, other than quoted prices in active markets, that are observable either directly or indirectly; and | |
| Level 3: |
Unobservable inputs in which there is little or no market data, which require the reporting entity to develop its own assumptions. | |
Estimates of the fair value of foreign currency and commodity derivative instruments are determined using exchange traded prices and rates. The Company also considers the risk of non-performance in the estimation of fair value, and includes an adjustment for non-performance risk in the measure of fair value of derivative instruments. In certain instances where market data is not available, the Company uses management judgment to develop assumptions that are used to determine fair value.
Fair value measurements and the fair value hierarchy level for the Company’s liabilities measured or disclosed at fair value on a recurring basis as of December 31, 2009, are shown below:
| Contract |
Asset (Liability) |
Level 1 | Level 2 | Level 3 | ||||||||||||
| Interest rate swap |
$ | (406 | ) | $ | — | $ | — | $ | (406 | ) | ||||||
| Total |
$ | (406 | ) | $ | — | $ | — | $ | (406 | ) | ||||||
F-47
Table of Contents
COOPER-STANDARD HOLDINGS INC.
NOTES TO CONSOLIDATED FINANCIAL STATEMENTS—(Continued)
(Dollar amounts in thousands except per share amounts)
A reconciliation of changes in assets and liabilities related to derivative instruments measured at fair value using the market and income approach adjusted for our and our counterparty’s credit risks for the year ended December 31, 2009, is shown below:
| Net Derivative Liabilities |
||||
| Beginning Balance as of January 1, 2009 |
$ | 22,370 | ||
| Total (gains) or losses (realized or unrealized) included in earnings (or changes in net liabilities) |
18,306 | |||
| Included in other comprehensive income |
(7,310 | ) | ||
| Purchases, issuances, and settlements |
(14,870 | ) | ||
| Terminated hedges |
(18,090 | ) | ||
| Ending Balance as of December 31, 2009 |
$ | 406 | ||
| The amount of total (gains) or losses for the period included in earnings (or changes in net liabilities) attributable to the change in unrealized (gains) or losses relating to assets still held at the reporting date |
$ | — | ||
| (Gains) and losses (realized and unrealized) included in earnings (or changes in net liabilities) for the period (above) are reported in cost of products sold and other income (expense): |
||||
| Total (gains) or losses included in earnings (or changes in net liabilities) for the period (above) |
$ | 18,306 | ||
| Change in unrealized (gains) or losses relating to assets still held at the reporting date |
— | |||
Items measured at fair value on a non-recurring basis
In addition to items that are measured at fair value on a recurring basis, the Company measures certain assets and liabilities at fair value on a non-recurring basis, which are not included in the table above. As these non-recurring fair value measurements are generally determined using unobservable inputs, these fair value measurements are classified within Level 3 of the fair value hierarchy. For further information on assets and liabilities measured at fair value on a non-recurring basis, see Note 2. “Summary of Significant Accounting Policies,” Note 6. “Restructuring,” Note 8. “Property, Plant and Equipment” and Note 9. “Goodwill and Intangibles.”
Note 22. Selected Quarterly Information (Unaudited)
| First Quarter |
Second Quarter |
Third Quarter |
Fourth Quarter |
|||||||||||||
| 2008 |
||||||||||||||||
| Sales |
$ | 756,021 | $ | 765,639 | $ | 599,656 | $ | 473,261 | ||||||||
| Gross profit |
119,119 | 117,989 | 62,484 | 34,922 | ||||||||||||
| Consolidated net income (loss) |
15,705 | 11,403 | (32,808 | ) | (116,820 | ) | ||||||||||
| Net income (loss) attributable to Cooper-Standard Holdings Inc. |
15,672 | 11,587 | (32,595 | ) | (116,115 | ) | ||||||||||
| First Quarter |
Second Quarter |
Third Quarter |
Fourth Quarter |
|||||||||||||
| 2009 |
||||||||||||||||
| Sales |
$ | 401,768 | $ | 448,046 | $ | 517,842 | $ | 577,603 | ||||||||
| Gross profit |
37,832 | 55,287 | 82,067 | 91,120 | ||||||||||||
| Consolidated net income (loss) |
(55,277 | ) | (349,344 | ) | 10,666 | 37,767 | ||||||||||
| Net income (loss) attributable to Cooper-Standard Holdings Inc. |
(54,966 | ) | (349,340 | ) | 10,847 | 37,397 | ||||||||||
F-48
Table of Contents
COOPER-STANDARD HOLDINGS INC.
NOTES TO CONSOLIDATED FINANCIAL STATEMENTS—(Continued)
(Dollar amounts in thousands except per share amounts)
Note 23. Sale Leaseback Transaction
During the year ended December 31, 2007, the Company sold a manufacturing facility to an independent third party. Gross proceeds from this sale were $4,806. Concurrent with this sale, the Company entered into an agreement to lease the facility back from the purchaser over a lease term of 10 years. This lease is accounted for as an operating lease. A gain of $723 was deferred and is being amortized over the lease term.
During the year ended December 31, 2008, the Company sold a manufacturing facility to an independent third party and simultaneously agreed to lease the facility from that party for a period of 15 years. Gross proceeds from this sale were $8,556. The transaction is structured as an operating lease.
Note 24. Guarantor and Non-Guarantor Subsidiaries
In connection with the December 2004 acquisition by the Company of the automotive segment of Cooper Tire & Rubber Company, Cooper-Standard Automotive Inc. (for purpose of this Note 24, the “Issuer”), a wholly-owned subsidiary, issued the Senior Notes and Senior Subordinated Notes with a total principal amount of $550,000. Cooper-Standard Holdings Inc. (the “Parent”) and all wholly-owned domestic subsidiaries of the Issuer (the “Guarantors”) unconditionally guarantee the notes. The following consolidated financial data provides information regarding the financial position, results of operations and cash flows of the Guarantors. Separate financial statements of the Guarantors are not presented because management has determined that those would not be material to the holders of the notes. The Guarantors account for their investments in the non-guarantor subsidiaries on the equity method. The principal elimination entries are to eliminate the investments in subsidiaries and intercompany balances and transactions.
F-49
Table of Contents
COOPER-STANDARD HOLDINGS INC.
NOTES TO CONSOLIDATED FINANCIAL STATEMENTS—(Continued)
(Dollar amounts in thousands except per share amounts)
CONSOLIDATING STATEMENT OF OPERATIONS
For the Year Ended December 31, 2007
| Parent | Issuer | Guarantors | Non-Guarantors | Eliminations | Consolidated Totals |
|||||||||||||||||||
| (dollars in millions) | ||||||||||||||||||||||||
| Sales |
$ | — | $ | 456.8 | $ | 713.9 | $ | 1,464.3 | $ | (123.8 | ) | $ | 2,511.2 | |||||||||||
| Cost of products sold |
— | 411.9 | 571.8 | 1,254.2 | (123.8 | ) | 2,114.1 | |||||||||||||||||
| Selling, administration, & engineering expenses |
— | 103.0 | 51.8 | 67.3 | — | 222.1 | ||||||||||||||||||
| Amortization of intangibles |
— | 21.5 | 2.8 | 7.6 | — | 31.9 | ||||||||||||||||||
| Impairment charges |
— | 143.0 | 3.4 | — | — | 146.4 | ||||||||||||||||||
| Restructuring |
— | 6.3 | 1.1 | 19.0 | — | 26.4 | ||||||||||||||||||
| Operating profit (loss) |
— | (228.9 | ) | 83.0 | 116.2 | — | (29.7 | ) | ||||||||||||||||
| Interest expense, net of interest income |
— | (76.2 | ) | — | (13.3 | ) | — | (89.5 | ) | |||||||||||||||
| Equity earnings |
— | (0.3 | ) | 2.3 | 0.2 | — | 2.2 | |||||||||||||||||
| Other income (expense) |
— | 41.5 | 0.2 | (42.2 | ) | — | (0.5 | ) | ||||||||||||||||
| Income (loss) before income taxes |
— | (263.9 | ) | 85.5 | 60.9 | — | (117.5 | ) | ||||||||||||||||
| Provision for income tax expense (benefit) |
— | 20.3 | (15.3 | ) | 27.9 | — | 32.9 | |||||||||||||||||
| Income (loss) before equity in income (loss) of subsidiaries |
— | (284.2 | ) | 100.8 | 33.0 | — | (150.4 | ) | ||||||||||||||||
| Equity in net income (loss) of subsidiaries |
(150.4 | ) | 133.8 | — | — | 16.6 | — | |||||||||||||||||
| Consolidated net income (loss) |
(150.4 | ) | (150.4 | ) | 100.8 | 33.0 | 16.6 | (150.4 | ) | |||||||||||||||
| Less: Net (income) loss attributable to noncontrolling interest |
— | — | — | (0.6 | ) | — | (0.6 | ) | ||||||||||||||||
| Net Income (loss) attributable to Cooper-Standard Holdings Inc. |
$ | (150.4 | ) | $ | (150.4 | ) | $ | 100.8 | $ | 32.4 | $ | 16.6 | $ | (151.0 | ) | |||||||||
F-50
Table of Contents
COOPER-STANDARD HOLDINGS INC.
NOTES TO CONSOLIDATED FINANCIAL STATEMENTS—(Continued)
(Dollar amounts in thousands except per share amounts)
CONSOLIDATING STATEMENT OF OPERATIONS
For the Year Ended December 31, 2008
| Parent | Issuer | Guarantors | Non-Guarantors | Eliminations | Consolidated Totals |
|||||||||||||||||||
| (dollars in millions) | ||||||||||||||||||||||||
| Sales |
$ | — | $ | 381.0 | $ | 553.7 | $ | 1,759.1 | $ | (99.2 | ) | $ | 2,594.6 | |||||||||||
| Cost of products sold |
— | 347.7 | 465.4 | 1,546.2 | (99.2 | ) | 2,260.1 | |||||||||||||||||
| Selling, administration, & engineering expenses |
— | 87.8 | 40.7 | 103.2 | — | 231.7 | ||||||||||||||||||
| Amortization of intangibles |
— | 20.5 | 2.3 | 8.2 | — | 31.0 | ||||||||||||||||||
| Impairment charges |
— | 24.7 | 2.3 | 6.4 | — | 33.4 | ||||||||||||||||||
| Restructuring |
— | 5.4 | 4.2 | 28.7 | — | 38.3 | ||||||||||||||||||
| Operating profit (loss) |
— | (105.1 | ) | 38.8 | 66.4 | — | 0.1 | |||||||||||||||||
| Interest expense, net of interest income |
— | (77.8 | ) | — | (15.1 | ) | — | (92.9 | ) | |||||||||||||||
| Equity earnings |
— | (4.4 | ) | 3.4 | 1.9 | — | 0.9 | |||||||||||||||||
| Other income (expense) |
— | 27.2 | (0.9 | ) | (27.7 | ) | — | (1.4 | ) | |||||||||||||||
| Income (loss) before income taxes |
— | (160.1 | ) | 41.3 | 25.5 | — | (93.3 | ) | ||||||||||||||||
| Provision for income tax expense (benefit) |
— | 4.1 | (1.1 | ) | 26.3 | — | 29.3 | |||||||||||||||||
| Income (loss) before equity in income (loss) of subsidiaries |
— | (164.2 | ) | 42.4 | (0.8 | ) | — | (122.6 | ) | |||||||||||||||
| Equity in net income (loss) of subsidiaries |
(122.6 | ) | 41.6 | — | — | 81.0 | — | |||||||||||||||||
| Consolidated net income (loss) |
(122.6 | ) | (122.6 | ) | 42.4 | (0.8 | ) | 81.0 | (122.6 | ) | ||||||||||||||
| Less: Net (income) loss attributable to noncontrolling interest |
— | — | — | 1.1 | — | 1.1 | ||||||||||||||||||
| Net Income (loss) attributable to Cooper-Standard Holdings Inc. |
$ | (122.6 | ) | $ | (122.6 | ) | $ | 42.4 | $ | 0.3 | $ | 81.0 | $ | (121.5 | ) | |||||||||
F-51
Table of Contents
COOPER-STANDARD HOLDINGS INC.
NOTES TO CONSOLIDATED FINANCIAL STATEMENTS—(Continued)
(Dollar amounts in thousands except per share amounts)
CONSOLIDATING STATEMENT OF OPERATIONS
For the Year Ended December 31, 2009
| Parent | Issuer | Guarantors | Non-Guarantors | Eliminations | Consolidated Totals |
|||||||||||||||||||
| (dollars in millions) | ||||||||||||||||||||||||
| Sales |
$ | — | $ | 333.9 | $ | 404.6 | $ | 1,286.1 | $ | (79.3 | ) | $ | 1,945.3 | |||||||||||
| Cost of products sold |
— | 288.1 | 326.9 | 1,143.3 | (79.3 | ) | 1,679.0 | |||||||||||||||||
| Selling, administration, & engineering expenses |
— | 77.4 | 30.4 | 91.7 | — | 199.5 | ||||||||||||||||||
| Amortization of intangibles |
— | 10.2 | 0.9 | 3.9 | — | 15.0 | ||||||||||||||||||
| Impairment charges |
— | 240.7 | 31.6 | 91.2 | — | 363.5 | ||||||||||||||||||
| Restructuring |
— | 4.3 | 1.0 | 27.1 | — | 32.4 | ||||||||||||||||||
| Operating profit (loss) |
— | (286.8 | ) | 13.8 | (71.1 | ) | — | (344.1 | ) | |||||||||||||||
| Interest expense, net of interest income |
— | (51.8 | ) | — | (12.5 | ) | — | (64.3 | ) | |||||||||||||||
| Equity earnings |
— | 0.1 | 1.5 | 2.4 | — | 4.0 | ||||||||||||||||||
| Reorganization items, net |
— | (17.4 | ) | — | — | — | (17.4 | ) | ||||||||||||||||
| Other income (expense), net |
— | 23.4 | (1.4 | ) | (12.1 | ) | — | 9.9 | ||||||||||||||||
| Income (loss) before income taxes |
— | (332.5 | ) | 13.9 | (93.3 | ) | — | (411.9 | ) | |||||||||||||||
| Provision for income tax expense (benefit) |
— | 65.0 | (2.7 | ) | (118.0 | ) | — | (55.7 | ) | |||||||||||||||
| Income (loss) before equity in income (loss) of subsidiaries |
— | (397.5 | ) | 16.6 | 24.7 | — | (356.2 | ) | ||||||||||||||||
| Equity in net income (loss) of subsidiaries |
(356.2 | ) | 41.3 | — | — | 314.9 | — | |||||||||||||||||
| Consolidated net income (loss) |
(356.2 | ) | (356.2 | ) | 16.6 | 24.7 | 314.9 | (356.2 | ) | |||||||||||||||
| Less: Net (income) loss attributable to noncontrolling interest |
— | — | — | 0.1 | — | 0.1 | ||||||||||||||||||
| Net Income (loss) attributable to Cooper-Standard Holdings Inc. |
$ | (356.2 | ) | $ | (356.2 | ) | $ | 16.6 | $ | 24.8 | $ | 314.9 | $ | (356.1 | ) | |||||||||
F-52
Table of Contents
COOPER-STANDARD HOLDINGS INC.
NOTES TO CONSOLIDATED FINANCIAL STATEMENTS—(Continued)
(Dollar amounts in thousands except per share amounts)
CONSOLIDATING BALANCE SHEET
December 31, 2008
| Parent | Issuer | Guarantors | Non-Guarantors | Eliminations | Consolidated Totals |
|||||||||||||||||||
| (dollars in millions) | ||||||||||||||||||||||||
| ASSETS |
||||||||||||||||||||||||
| Current assets: |
||||||||||||||||||||||||
| Cash and cash equivalents |
$ | — | $ | 40.0 | $ | — | $ | 71.5 | $ | — | $ | 111.5 | ||||||||||||
| Accounts receivable, net |
— | 49.2 | 63.0 | 221.5 | — | 333.7 | ||||||||||||||||||
| Inventories |
— | 17.1 | 21.2 | 78.7 | — | 117.0 | ||||||||||||||||||
| Prepaid Expenses |
— | (1.1 | ) | 0.6 | 19.7 | — | 19.2 | |||||||||||||||||
| Other |
— | 27.8 | 2.7 | 11.7 | — | 42.2 | ||||||||||||||||||
| Total current assets |
— | 133.0 | 87.5 | 403.1 | — | 623.6 | ||||||||||||||||||
| Investments in affiliates and intercompany accounts, net |
15.2 | 315.4 | 599.5 | 161.4 | (1,058.1 | ) | 33.4 | |||||||||||||||||
| Property, plant, and equipment, net |
— | 70.3 | 118.5 | 435.2 | — | 624.0 | ||||||||||||||||||
| Goodwill |
— | 194.1 | 17.3 | 33.6 | — | 245.0 | ||||||||||||||||||
| Other assets |
— | 149.4 | 17.1 | 125.8 | — | 292.3 | ||||||||||||||||||
| $ | 15.2 | $ | 862.2 | $ | 839.9 | $ | 1,159.1 | $ | (1,058.1 | ) | $ | 1,818.3 | ||||||||||||
| LIABILITIES & EQUITY (DEFICIT) |
||||||||||||||||||||||||
| Current liabilities: |
||||||||||||||||||||||||
| Debt payable within one year |
$ | — | $ | 43.5 | $ | — | $ | 50.6 | $ | — | $ | 94.1 | ||||||||||||
| Accounts payable |
— | 36.4 | 25.0 | 131.6 | — | 193.0 | ||||||||||||||||||
| Accrued liabilities |
— | 65.6 | 6.7 | 92.3 | — | 164.6 | ||||||||||||||||||
| Total current liabilities |
— | 145.5 | 31.7 | 274.5 | — | 451.7 | ||||||||||||||||||
| Long-term debt |
— | 957.5 | — | 92.5 | — | 1,050.0 | ||||||||||||||||||
| Other long-term liabilities |
— | 165.0 | 6.7 | 125.2 | — | 296.9 | ||||||||||||||||||
| — | 1,268.0 | 38.4 | 492.2 | — | 1,798.6 | |||||||||||||||||||
| Total Cooper-Standard Holdings Inc. equity (deficit) |
15.2 | (405.8 | ) | 801.5 | 662.4 | (1,058.1 | ) | 15.2 | ||||||||||||||||
| Noncontrolling interest |
— | — | — | 4.5 | — | 4.5 | ||||||||||||||||||
| Total equity (deficit) |
15.2 | (405.8 | ) | 801.5 | 666.9 | (1,058.1 | ) | 19.7 | ||||||||||||||||
| Total liabilities and equity (deficit) |
$ | 15.2 | $ | 862.2 | $ | 839.9 | $ | 1,159.1 | $ | (1,058.1 | ) | $ | 1,818.3 | |||||||||||
F-53
Table of Contents
COOPER-STANDARD HOLDINGS INC.
NOTES TO CONSOLIDATED FINANCIAL STATEMENTS—(Continued)
(Dollar amounts in thousands except per share amounts)
CONSOLIDATING BALANCE SHEET
December 31, 2009
| Parent | Issuer | Guarantors | Non-Guarantors | Eliminations | Consolidated Totals |
|||||||||||||||||||
| (dollars in millions) | ||||||||||||||||||||||||
| ASSETS |
||||||||||||||||||||||||
| Current assets: |
||||||||||||||||||||||||
| Cash and cash equivalents |
$ | — | $ | 91.5 | $ | 0.7 | $ | 288.1 | $ | — | $ | 380.3 | ||||||||||||
| Accounts receivable, net |
— | 54.3 | 61.0 | 240.2 | — | 355.5 | ||||||||||||||||||
| Inventories |
— | 16.4 | 22.9 | 72.3 | — | 111.6 | ||||||||||||||||||
| Prepaid Expenses |
— | 3.4 | 0.4 | 18.4 | — | 22.2 | ||||||||||||||||||
| Other |
— | 42.8 | 0.5 | 33.1 | — | 76.4 | ||||||||||||||||||
| Total current assets |
— | 208.4 | 85.5 | 652.1 | — | 946.0 | ||||||||||||||||||
| Investments in affiliates and intercompany accounts, net |
(311.0 | ) | 580.2 | 660.4 | (197.6 | ) | (696.0 | ) | 36.0 | |||||||||||||||
| Property, plant, and equipment, net |
— | 65.5 | 94.1 | 426.6 | — | 586.2 | ||||||||||||||||||
| Goodwill |
— | 87.7 | — | — | — | 87.7 | ||||||||||||||||||
| Other assets |
— | 11.2 | 3.7 | 66.6 | — | 81.5 | ||||||||||||||||||
| $ | (311.0 | ) | $ | 953.0 | $ | 843.7 | $ | 947.7 | $ | (696.0 | ) | $ | 1,737.4 | |||||||||||
| LIABILITIES & EQUITY (DEFICIT) |
||||||||||||||||||||||||
| Current liabilities: |
||||||||||||||||||||||||
| Debt payable within one year |
$ | $ | 75.0 | $ | $ | 118.2 | $ | $ | 193.2 | |||||||||||||||
| Accounts payable |
— | 37.4 | 14.2 | 114.7 | — | 166.3 | ||||||||||||||||||
| Accrued liabilities |
— | 41.4 | 5.9 | 111.3 | — | 158.6 | ||||||||||||||||||
| Total current liabilities |
— | 153.8 | 20.1 | 344.2 | — | 518.1 | ||||||||||||||||||
| Liabilities subject to compromise |
69.1 | 1,077.9 | 2.8 | 112.1 | — | 1,261.9 | ||||||||||||||||||
| Long-term debt |
— | — | — | 11.1 | — | 11.1 | ||||||||||||||||||
| Other long-term liabilities |
— | 141.3 | 6.4 | 105.1 | — | 252.8 | ||||||||||||||||||
| 69.1 | 1,373.0 | 29.3 | 572.5 | — | 2,043.9 | |||||||||||||||||||
| Total Cooper-Standard Holdings Inc. equity (deficit) |
(380.1 | ) | (420.0 | ) | 814.4 | 370.7 | (696.0 | ) | (311.0 | ) | ||||||||||||||
| Noncontrolling interest |
— | — | — | 4.5 | — | 4.5 | ||||||||||||||||||
| Total equity (deficit) |
(380.1 | ) | (420.0 | ) | 814.4 | 375.2 | (696.0 | ) | (306.5 | ) | ||||||||||||||
| Total liabilities and equity (deficit) |
$ | (311.0 | ) | $ | 953.0 | $ | 843.7 | $ | 947.7 | $ | (696.0 | ) | $ | 1,737.4 | ||||||||||
F-54
Table of Contents
COOPER-STANDARD HOLDINGS INC.
NOTES TO CONSOLIDATED FINANCIAL STATEMENTS—(Continued)
(Dollar amounts in thousands except per share amounts)
CONSOLIDATING STATEMENT OF CASH FLOWS
For the Year Ended December 31, 2007
| Parent | Issuer | Guarantors | Non-Guarantors | Eliminations | Consolidated Totals |
|||||||||||||||||||
| (dollars in millions) | ||||||||||||||||||||||||
| OPERATING ACTIVITIES |
||||||||||||||||||||||||
| Net cash provided by (used in) operating activities |
$ | — | $ | (56.4 | ) | $ | 28.2 | $ | 213.6 | $ | — | $ | 185.4 | |||||||||||
| INVESTING ACTIVITIES |
||||||||||||||||||||||||
| Property, plant, and equipment |
— | (12.6 | ) | (18.6 | ) | (76.1 | ) | — | (107.3 | ) | ||||||||||||||
| Acquisition of businesses, net of cash acquired |
— | — | (10.0 | ) | (148.7 | ) | — | (158.7 | ) | |||||||||||||||
| Gross proceeds from sale-leaseback transaction |
— | — | — | 4.8 | — | 4.8 | ||||||||||||||||||
| Other |
— | 0.1 | — | 1.1 | — | 1.2 | ||||||||||||||||||
| Net cash used in investing activities |
— | (12.5 | ) | (28.6 | ) | (218.9 | ) | — | (260.0 | ) | ||||||||||||||
| FINANCING ACTIVITIES |
||||||||||||||||||||||||
| Proceeds from issuance of long-term debt |
— | 60.0 | — | — | — | 60.0 | ||||||||||||||||||
| Increase/(decrease) in short term debt |
— | 1.4 | — | 4.8 | — | 6.2 | ||||||||||||||||||
| Principal payments on long-term debt |
— | (2.7 | ) | — | (34.9 | ) | — | (37.6 | ) | |||||||||||||||
| Debt issuance costs |
— | (2.9 | ) | — | (0.2 | ) | — | (3.1 | ) | |||||||||||||||
| Equity Contributions |
— | 30.0 | — | — | — | 30.0 | ||||||||||||||||||
| Other |
— | (0.5 | ) | — | — | — | (0.5 | ) | ||||||||||||||||
| Net cash provided by (used in) financing activities |
— | 85.3 | — | (30.3 | ) | — | 55.0 | |||||||||||||||||
| Effects of exchange rate changes on cash |
— | 4.3 | — | (0.1 | ) | — | 4.2 | |||||||||||||||||
| Changes in cash and cash equivalents |
— | 20.7 | (0.4 | ) | (35.7 | ) | — | (15.4 | ) | |||||||||||||||
| Cash and cash equivalents at beginning of period |
— | 21.9 | 0.4 | 34.0 | — | 56.3 | ||||||||||||||||||
| Cash and cash equivalents at end of period |
$ | — | $ | 42.6 | $ | — | $ | (1.7 | ) | $ | — | 40.9 | ||||||||||||
| Depreciation and amortization |
$ | — | $ | 40.8 | 30.8 | $ | 64.4 | $ | — | $ | 136.0 | |||||||||||||
F-55
Table of Contents
COOPER-STANDARD HOLDINGS INC.
NOTES TO CONSOLIDATED FINANCIAL STATEMENTS—(Continued)
(Dollar amounts in thousands except per share amounts)
CONSOLIDATING STATEMENT OF CASH FLOWS
For the Year Ended December 31, 2008
| Parent | Issuer | Guarantors | Non-Guarantors | Eliminations | Consolidated Totals |
|||||||||||||||||||
| (dollars in millions) | ||||||||||||||||||||||||
| OPERATING ACTIVITIES |
||||||||||||||||||||||||
| Net cash provided by (used in) operating activities |
$ | 0.5 | $ | (24.0 | ) | $ | 12.2 | $ | 147.8 | $ | — | $ | 136.5 | |||||||||||
| INVESTING ACTIVITIES |
||||||||||||||||||||||||
| Property, plant, and equipment |
— | (9.1 | ) | (12.5 | ) | (70.6 | ) | — | (92.2 | ) | ||||||||||||||
| Gross proceeds from sale-leaseback transaction |
— | — | — | 8.6 | — | 8.6 | ||||||||||||||||||
| Other |
— | 4.1 | 0.3 | 5.3 | — | 9.7 | ||||||||||||||||||
| Net cash used in investing activities |
— | (5.0 | ) | (12.2 | ) | (56.7 | ) | — | (73.9 | ) | ||||||||||||||
| FINANCING ACTIVITIES |
||||||||||||||||||||||||
| Increase/(decrease) in short term debt |
— | 35.8 | — | 1.2 | — | 37.0 | ||||||||||||||||||
| Principal payments on long-term debt |
— | (2.9 | ) | — | (13.6 | ) | — | (16.5 | ) | |||||||||||||||
| Repurchase of bonds |
— | (5.3 | ) | — | — | — | (5.3 | ) | ||||||||||||||||
| Other |
(0.5 | ) | (0.5 | ) | — | (0.1 | ) | — | (1.1 | ) | ||||||||||||||
| Net cash provided by (used in) financing activities |
(0.5 | ) | 27.1 | — | (12.5 | ) | — | 14.1 | ||||||||||||||||
| Effects of exchange rate changes on cash |
— | (0.7 | ) | — | (5.4 | ) | — | (6.1 | ) | |||||||||||||||
| Changes in cash and cash equivalents |
— | (2.6 | ) | — | 73.2 | — | 70.6 | |||||||||||||||||
| Cash and cash equivalents at beginning of period |
— | 42.6 | — | (1.7 | ) | — | 40.9 | |||||||||||||||||
| Cash and cash equivalents at end of period |
$ | — | $ | 40.0 | $ | — | $ | 71.5 | $ | — | $ | 111.5 | ||||||||||||
| Depreciation and amortization |
$ | — | $ | 37.7 | $ | 24.8 | $ | 77.6 | $ | — | $ | 140.1 | ||||||||||||
F-56
Table of Contents
COOPER-STANDARD HOLDINGS INC.
NOTES TO CONSOLIDATED FINANCIAL STATEMENTS—(Continued)
(Dollar amounts in thousands except per share amounts)
CONSOLIDATING STATEMENT OF CASH FLOWS
For the Year Ended December 31, 2009
| Parent | Issuer | Guarantors | Non-Guarantors | Eliminations | Consolidated Totals |
|||||||||||||||||||
| (dollars in millions) | ||||||||||||||||||||||||
| OPERATING ACTIVITIES |
||||||||||||||||||||||||
| Net cash provided by (used in) operating activities |
$ | — | $ | (32.3 | ) | $ | 9.1 | $ | 153.1 | $ | — | $ | 129.9 | |||||||||||
| INVESTING ACTIVITIES |
||||||||||||||||||||||||
| Property, plant, and equipment |
— | (4.3 | ) | (7.0 | ) | (34.8 | ) | — | (46.1 | ) | ||||||||||||||
| Fixed asset proceeds |
— | — | 0.2 | 0.4 | — | 0.6 | ||||||||||||||||||
| Net cash used in investing activities |
— | (4.3 | ) | (6.8 | ) | (34.4 | ) | — | (45.5 | ) | ||||||||||||||
| FINANCING ACTIVITIES |
||||||||||||||||||||||||
| Increase/(decrease) in short term debt |
— | 81.7 | — | 96.5 | — | 178.2 | ||||||||||||||||||
| Principal payments on long-term debt |
— | (2.3 | ) | — | (9.3 | ) | — | (11.6 | ) | |||||||||||||||
| Repurchase of bonds |
— | (0.7 | ) | — | — | — | (0.7 | ) | ||||||||||||||||
| Other |
— | 10.5 | (1.7 | ) | (8.6 | ) | — | 0.2 | ||||||||||||||||
| Net cash provided by (used in) financing activities |
— | 89.2 | (1.7 | ) | 78.6 | — | 166.1 | |||||||||||||||||
| Effects of exchange rate changes on cash |
— | (1.1 | ) | 0.1 | 19.3 | — | 18.3 | |||||||||||||||||
| Changes in cash and cash equivalents |
— | 51.5 | 0.7 | 216.6 | — | 268.8 | ||||||||||||||||||
| Cash and cash equivalents at beginning of period |
— | 40.0 | — | 71.5 | — | 111.5 | ||||||||||||||||||
| Cash and cash equivalents at end of period |
$ | — | $ | 91.5 | $ | 0.7 | $ | 288.1 | $ | — | $ | 380.3 | ||||||||||||
| Depreciation and amortization |
$ | — | $ | 26.8 | $ | 22.3 | $ | 64.7 | $ | — | $ | 113.8 | ||||||||||||
Note 25. Accounts Receivable Factoring
As a part of its working capital management, the Company sells certain receivables through third party financial institutions without recourse. The amount sold varies each month based on the amount of underlying receivables and cash flow needs of the Company.
At December 31, 2008 and 2009, the Company had $43,544 and $ 39,703, respectively of receivables outstanding under receivable transfer agreements entered into by various locations. The Company incurred a loss on the sale of receivables for the year ended December 31, 2008 and 2009 of $2,219 and $950, respectively; this amount is recorded in other income (expense) in the consolidated statements of operations. The Company continues to service the receivables for one of the locations. These are permitted transactions under the Company’s credit agreement. The Company is also pursuing similar arrangements in various locations.
F-57
Table of Contents
COOPER-STANDARD HOLDINGS INC.
NOTES TO CONSOLIDATED FINANCIAL STATEMENTS—(Continued)
(Dollar amounts in thousands except per share amounts)
In addition, during the second quarter of 2009, the Company elected to participate in the Auto Supplier Support Program sponsored by the U.S. Treasury Department. The Auto Supplier Support Program is designed to provide eligible suppliers with access to government-backed protection on those Chrysler LLC (“Chrysler”) and General Motors Corporation (“GM”) U.S. dollar receivables that are accepted into the program. In applying for the program, the Company selected the program option that provides government-backed protection on collection of the receivables and expedited payment terms, for which a charge of 3% of the accepted receivables is applicable. The Company has been designated by both Chrysler and GM as an eligible supplier. During the year ended December 31, 2009, the Company received payments of $8,936 and incurred charges of $268 which is recorded in other income (expense) in the consolidated statements of operations.
In addition, the Company has been advised that Export Development Canada (“EDC”) has made available to the Company’s Canadian subsidiary insurance coverage on certain GM and Chrysler receivables. EDC’s program is designed to guarantee a substantial portion of a Canadian supplier’s eligible receivables under the program. The Canadian subsidiary will be charged 6% per annum of the amount made available to it under the program.
Note 26. Subsequent Events
In preparing these financial statements, the Company has evaluated events and transactions for potential recognition or disclosure through March 31, 2010, the date the financial statements were issued.
On March 17, 2010 Cooper-Standard Holdings Inc., CSA U.S., and CSA Canada and CTR entered into the CTR Settlement Agreement. See Note 13. “Income Taxes” for a discussion of the settlement agreement reached between the Company, Cooper-Standard Automotive Inc. and the Canadian Debtor and CTR on March 17, 2010 in respect of tax refunds received by Cooper-Standard Automotive Canada relating to the years 2000 through 2004.
On February 1, 2010, the Debtors filed the Original Plan and the Original Disclosure Statement with the Bankruptcy Court. On March 26, 2010, the Debtors filed the Plan of Reorganization and the Disclosure Statement with the Bankruptcy Court. See Note 3. “Reorganization under Chapter 11 of the Bankruptcy Code” for a discussion of the current status of the Chapter 11 Cases and Canadian Proceedings.
During the first quarter of 2010, the Company decided to prepay a portion of the borrowing under the DIP agreement. On January 29, 2010, MAPS Germany, the Additional Borrower under the DIP Agreement, prepaid $25,000 of its portion of the borrowing and on March 26, 2010, the Canadian Borrower, prepaid $25,000.
See Item 1. “Business—Bankruptcy Cases” for a discussion of the current status of the Chapter 11 Cases and Canadian Proceedings.
F-58
Table of Contents
Valuation and Qualifying Accounts
(dollars in millions)
| Description |
Balance at beginning of period |
Acquisition(a) | Charged to Expenses |
Charged (credited) to other accounts(b) |
Deductions | Balance at end of period |
||||||||||||||||||
| Allowance for doubtful accounts deducted from accounts receivable |
||||||||||||||||||||||||
| Year ended December 31, 2007 |
$ | 10.1 | 0.9 | 0.1 | 0.8 | (1.7 | ) | $ | 10.2 | |||||||||||||||
| Year ended December 31, 2008 |
$ | 10.2 | — | (1.4 | ) | (2.1 | ) | (2.7 | ) | $ | 4.0 | |||||||||||||
| Year ended December 31, 2009 |
$ | 4.0 | — | 0.9 | 2.5 | (1.6 | ) | $ | 5.8 | |||||||||||||||
| Inventory reserve account deducted from inventories |
||||||||||||||||||||||||
| Year ended December 31, 2007 |
$ | 10.5 | 2.1 | 7.6 | 0.9 | (7.1 | ) | $ | 14.0 | |||||||||||||||
| Year ended December 31, 2008 |
$ | 14.0 | — | 5.9 | (1.6 | ) | (4.1 | ) | $ | 14.2 | ||||||||||||||
| Year ended December 31, 2009 |
$ | 14.2 | — | 10.9 | 1.1 | (9.0 | ) | $ | 17.2 | |||||||||||||||
| (a) | 2007 relates to MAPS acquisition. |
| (b) | Primarily foreign currency translation. |
| Balance
at beginning of period |
Additions | Deductions(a) | Balance at end of period |
|||||||||||||||||
| Description |
Charged to Income |
Charged to Equity |
||||||||||||||||||
| Tax valuation allowance |
||||||||||||||||||||
| Year ended December 31, 2007 |
$ | 80.8 | 56.4 | (3.3 | ) | (5.1 | ) | $ | 128.8 | |||||||||||
| Year ended December 31, 2008 |
$ | 128.8 | 45.2 | 21.4 | (20.2 | ) | $ | 175.2 | ||||||||||||
| Year ended December 31, 2009 |
$ | 175.2 | 39.9 | (4.5 | ) | — | $ | 210.6 | ||||||||||||
| (a) | Net reduction in tax valuation allowance is a result of the reversal of valuation allowances set up through purchase accounting and reversed through goodwill as a result of utilization of tax loss carry forwards and other cumulative book/tax difference. |
F-59
Table of Contents
CONDENSED CONSOLIDATED STATEMENTS OF OPERATIONS
(Unaudited)
(Dollar amounts in thousands, except per share data)
| Predecessor | Successor | |||||||||||||||
| Three Months Ended September 30, 2009 |
Three Months Ended September 30, 2010 |
|||||||||||||||
| Sales |
$ | 517,842 | $ | 585,650 | ||||||||||||
| Cost of products sold |
435,775 | 483,559 | ||||||||||||||
| Gross profit |
82,067 | 102,091 | ||||||||||||||
| Selling, administration & engineering expenses |
52,658 | 68,584 | ||||||||||||||
| Amortization of intangibles |
194 | 3,842 | ||||||||||||||
| Restructuring |
4,378 | 818 | ||||||||||||||
| Operating profit |
24,837 | 28,847 | ||||||||||||||
| Interest expense, net of interest income |
(11,914 | ) | (10,664 | ) | ||||||||||||
| Equity earnings |
1,228 | 1,815 | ||||||||||||||
| Reorganization items, net |
(5,642 | ) | — | |||||||||||||
| Other income, net |
5,930 | 5,454 | ||||||||||||||
| Income before income taxes |
14,439 | 25,452 | ||||||||||||||
| Provision for income tax expense |
3,773 | 4,443 | ||||||||||||||
| Consolidated net income |
10,666 | 21,009 | ||||||||||||||
| Add: Net (income) loss attributed to noncontrolling interests |
181 | (176 | ) | |||||||||||||
| Net income attributable to Cooper-Standard Holdings Inc. |
$ | 10,847 | $ | 20,833 | ||||||||||||
| Net income available to Cooper-Standard Holdings Inc. common stockholders |
N/A | $ | 15,116 | |||||||||||||
| Basic net income per share attributable to Cooper-Standard Holdings Inc. |
N/A | $ | 0.86 | |||||||||||||
| Diluted net income per share attributable to Cooper-Standard Holdings Inc. |
N/A | $ | 0.83 | |||||||||||||
| Predecessor | Successor | |||||||||||||||
| Nine Months Ended September 30, 2009 |
Five Months Ended May 31, 2010 |
Four Months Ended September 30, 2010 |
||||||||||||||
| Sales |
$ | 1,367,656 | $ | 1,009,128 | $ | 801,292 | ||||||||||
| Cost of products sold |
1,192,470 | 832,201 | 665,434 | |||||||||||||
| Gross profit |
175,186 | 176,927 | 135,858 | |||||||||||||
| Selling, administration & engineering expenses |
146,233 | 92,166 | 91,629 | |||||||||||||
| Amortization of intangibles |
14,783 | 319 | 5,106 | |||||||||||||
| Impairment charges |
362,699 | — | — | |||||||||||||
| Restructuring |
32,871 | 5,893 | 1,200 | |||||||||||||
| Operating profit (loss) |
(381,400 | ) | 78,549 | 37,923 | ||||||||||||
| Interest expense, net of interest income |
(53,632 | ) | (44,505 | ) | (14,195 | ) | ||||||||||
| Equity earnings |
1,701 | 3,613 | 2,549 | |||||||||||||
| Reorganization items and fresh-start accounting adjustments, net |
(5,642 | ) | 660,048 | — | ||||||||||||
| Other income (expense), net |
13,679 | (21,156 | ) | 5,024 | ||||||||||||
| Income (loss) before income taxes |
(425,294 | ) | 676,549 | 31,301 | ||||||||||||
| Provision (benefit) for income tax expense |
(31,339 | ) | 39,940 | 5,352 | ||||||||||||
| Consolidated net income (loss) |
(393,955 | ) | 636,609 | 25,949 | ||||||||||||
| Add: Net (income) loss attributed to noncontrolling interests |
496 | (322 | ) | (186 | ) | |||||||||||
| Net income (loss) attributable to Cooper-Standard Holdings Inc. |
$ | (393,459 | ) | $ | 636,287 | $ | 25,763 | |||||||||
| Net income available to Cooper-Standard Holdings Inc. common stockholders |
N/A | N/A | $ | 18,328 | ||||||||||||
| Basic net income per share attributable to Cooper-Standard Holdings Inc. |
N/A | N/A | $ | 1.05 | ||||||||||||
| Diluted net income per share attributable to Cooper-Standard Holdings Inc. |
N/A | N/A | $ | 1.00 | ||||||||||||
The accompanying notes are an integral part of these financial statements.
F-60
Table of Contents
CONDENSED CONSOLIDATED BALANCE SHEETS
(Dollar amounts in thousands, except per share data)
| Predecessor December 31, 2009 |
Successor September 30, 2010 |
|||||||
| (Unaudited) | ||||||||
| Assets |
||||||||
| Current assets: |
||||||||
| Cash and cash equivalents |
$ | 380,254 | $ | 232,349 | ||||
| Accounts receivable, net |
355,543 | 443,311 | ||||||
| Inventories, net |
111,575 | 123,860 | ||||||
| Prepaid expenses |
22,153 | 24,703 | ||||||
| Other |
76,454 | 35,674 | ||||||
| Total current assets |
945,979 | 859,897 | ||||||
| Property, plant and equipment, net |
586,179 | 594,469 | ||||||
| Goodwill |
87,728 | 138,471 | ||||||
| Intangibles, net |
10,549 | 153,034 | ||||||
| Other assets |
106,972 | 116,587 | ||||||
| $ | 1,737,407 | $ | 1,862,458 | |||||
| Liabilities and Equity (Deficit) |
||||||||
| Current liabilities: |
||||||||
| Debt payable within one year |
$ | 18,204 | $ | 19,166 | ||||
| Debtor-in-possession financing |
175,000 | — | ||||||
| Accounts payable |
166,346 | 179,944 | ||||||
| Payroll liabilities |
71,523 | 104,975 | ||||||
| Accrued liabilities |
87,073 | 111,762 | ||||||
| Total current liabilities |
518,146 | 415,847 | ||||||
| Long-term debt |
11,059 | 457,867 | ||||||
| Pension benefits |
148,936 | 175,406 | ||||||
| Postretirement benefits other than pensions |
76,261 | 82,131 | ||||||
| Deferred tax liabilities |
7,875 | 24,322 | ||||||
| Other long-term liabilities |
19,727 | 32,173 | ||||||
| Liabilities subject to compromise |
1,261,903 | — | ||||||
| Total liabilities |
$ | 2,043,907 | $ | 1,187,746 | ||||
| 7% Cumulative participating convertible preferred stock, $0.001 par value, 10,000,000 shares authorized at September 30, 2010, 1,052,444 shares issued and outstanding at September 30, 2010 |
— | 129,939 | ||||||
| Equity (deficit): |
||||||||
| Predecessor common stock, $0.01 par value, 4,000,000 shares authorized at December 31, 2009, 3,482,612 shares issued and outstanding at December 31, 2009 |
35 | — | ||||||
| Common stock, $0.001 par value, 190,000,000 shares authorized at September 30, 2010, 18,376,112 shares issued and outstanding at September 30, 2010 |
— | 17 | ||||||
| Additional paid-in capital |
356,316 | 476,341 | ||||||
| Accumulated retained earnings (deficit) |
(636,278 | ) | 22,871 | |||||
| Accumulated other comprehensive income (loss) |
(31,037 | ) | 43,143 | |||||
| Total Cooper-Standard Holdings Inc. equity (deficit) |
(310,964 | ) | 542,372 | |||||
| Noncontrolling interests |
4,464 | 2,401 | ||||||
| Total equity (deficit) |
(306,500 | ) | 544,773 | |||||
| Total liabilities and equity (deficit) |
$ | 1,737,407 | $ | 1,862,458 | ||||
The accompanying notes are an integral part of these financial statements.
F-61
Table of Contents
CONDENSED CONSOLIDATED STATEMENTS OF CASH FLOWS
(Unaudited)
(Dollar amounts in thousands)
| Predecessor | Successor | |||||||||||||
| Nine Months Ended September 30, 2009 |
Five Months Ended May 31, 2010 |
Four Months Ended September 30, 2010 |
||||||||||||
| Operating Activities: |
||||||||||||||
| Consolidated net income (loss) |
$ | (393,955 | ) | $ | 636,609 | $ | 25,949 | |||||||
| Adjustments to reconcile consolidated net income (loss) to net cash provided by (used in) operating activities: |
||||||||||||||
| Depreciation |
73,343 | 35,333 | 31,843 | |||||||||||
| Amortization |
14,783 | 319 | 5,106 | |||||||||||
| Impairment charges |
362,699 | — | — | |||||||||||
| Non-cash restructuring |
182 | 46 | — | |||||||||||
| Reorganization items |
5,642 | (660,048 | ) | — | ||||||||||
| Gain on bond repurchase |
(9,096 | ) | — | — | ||||||||||
| Amortization of debt issuance cost |
5,407 | 11,505 | 408 | |||||||||||
| Changes in operating assets and liabilities |
(28,776 | ) | (99,159 | ) | 16,976 | |||||||||
| Net cash provided by (used in) operating activities |
30,229 | (75,395 | ) | 80,282 | ||||||||||
| Investing activities: |
||||||||||||||
| Property, plant and equipment |
(25,526 | ) | (22,935 | ) | (23,517 | ) | ||||||||
| Proceeds from the sale of assets and other |
308 | 3,851 | 104 | |||||||||||
| Net cash used in investing activities |
(25,218 | ) | (19,084 | ) | (23,413 | ) | ||||||||
| Financing activities: |
||||||||||||||
| Proceeds from issuance of debtor-in-possession financing, net of debt issuance cost |
108,012 | — | — | |||||||||||
| Proceeds from issuance of long-term debt |
— | 450,000 | — | |||||||||||
| Payments on debtor-in-possession financing |
(313 | ) | (175,000 | ) | — | |||||||||
| Increase (decrease) in short term debt |
22,943 | (2,069 | ) | 3,138 | ||||||||||
| Cash dividends paid |
— | — | (1,395 | ) | ||||||||||
| Payments on long-term debt |
(11,310 | ) | (709,574 | ) | (1,484 | ) | ||||||||
| Debt issuance cost and back stop fees |
— | (30,991 | ) | — | ||||||||||
| Issuance of preferred and common stock |
— | 355,000 | — | |||||||||||
| Repurchase of bonds |
(737 | ) | — | — | ||||||||||
| Other |
259 | — | 22 | |||||||||||
| Net cash provided by (used in) financing activities |
118,854 | (112,634 | ) | 281 | ||||||||||
| Effects of exchange rate changes on cash |
18,269 | 5,528 | (3,470 | ) | ||||||||||
| Changes in cash and cash equivalents |
142,134 | (201,585 | ) | 53,680 | ||||||||||
| Cash and cash equivalents at beginning of period |
111,521 | 380,254 | 178,669 | |||||||||||
| Cash and cash equivalents at end of period |
$ | 253,655 | $ | 178,669 | $ | 232,349 | ||||||||
The accompanying notes are an integral part of these financial statements.
F-62
Table of Contents
NOTES TO CONDENSED CONSOLIDATED FINANCIAL STATEMENTS
(Unaudited)
(Dollar amounts in thousands except per share amounts)
1. Overview
Basis of presentation
Cooper-Standard Holdings Inc. (the “Company”), through its wholly-owned subsidiary Cooper-Standard Automotive Inc. (“CSA U.S.”), is a leading manufacturer of body sealing, anti-vibration (“AVS”) and fluid handling components, systems, subsystems and modules, primarily for use in passenger vehicles and light trucks, that are manufactured by global automotive original equipment manufacturers (“OEMs”) and replacement markets. The Company conducts substantially all of its activities through its subsidiaries.
On May 27, 2010, the Company and certain of its U.S. and Canadian subsidiaries emerged from bankruptcy proceedings under Chapter 11 of the United States Bankruptcy Code (the “Bankruptcy Code”) (“Chapter 11”). In accordance with the provisions of Financial Accounting Standards Board (“FASB”) Accounting Standards Codification (“ASC”) 852, “Reorganizations,” the Company adopted fresh-start accounting upon its emergence from Chapter 11 bankruptcy proceedings and became a new entity for financial reporting purposes as of June 1, 2010. Accordingly, the consolidated financial statements for the reporting entity subsequent to emergence from Chapter 11 bankruptcy proceedings (the “Successor”) are not comparable to the consolidated financial statements for the reporting entity prior to emergence from Chapter 11 bankruptcy proceedings (the “Predecessor”).
The accompanying unaudited condensed consolidated financial statements have been prepared pursuant to the rules and regulations of the Securities and Exchange Commission (“SEC”) for interim financial information and should be read in conjunction with the consolidated financial statements and notes thereto included in the Company’s Annual Report on Form 10-K for the fiscal year ended December 31, 2009, as filed with the SEC. Accordingly, they do not include all of the information and footnotes required by accounting principles generally accepted in the United States for complete financial statements. These financial statements include all adjustments (consisting of normal, recurring adjustments) considered necessary for a fair presentation of the financial position and results of operations of the Company. The operating results for the interim period ended September 30, 2010 are not necessarily indicative of results for the full year.
Recent accounting pronouncements
In January 2010, the FASB issued Accounting Standards Update (“ASU”) 2010-06, “Guidance Amending Fair Value Disclosures for Interim and Annual Reporting Periods Beginning After December 15, 2009.” This guidance requires disclosures about transfers of financial instruments into and out of Level 1 and 2 designations and disclosures about purchases, sales, issuances and settlements of financial instruments with a Level 3 designation. The Company adopted this statement effective January 1, 2010. The adoption of ASU No. 2010-06 did not have a material impact on the Company’s consolidated financial statements.
The FASB amended ASC 810, “Consolidations,” with ASU 2009-17, “Improvements to Financial Reporting by Enterprises Involved with Variable Interest Entities.” This update significantly changes the model for determining whether an entity is the primary beneficiary and should thus consolidate a variable interest entity. In addition, this update requires additional disclosures and an ongoing assessment of whether a variable interest entity should be consolidated. The provisions of this update are effective for annual reporting periods beginning after November 15, 2009. The effects of adoption were not significant.
2. Reorganization Under Chapter 11
Filing of Bankruptcy Cases
During the first half of 2009, the Company experienced a substantial decrease in revenues caused by the severe decline in worldwide automotive production that followed the global financial crisis that began in 2008. On
F-63
Table of Contents
NOTES TO CONDENSED CONSOLIDATED FINANCIAL STATEMENTS—(Continued)
(Unaudited)
(Dollar amounts in thousands except per share amounts)
August 3, 2009, the Company and each of its direct and indirect wholly-owned U.S. subsidiaries (collectively with the Company, the “Debtors”) filed voluntary petitions for relief under Chapter 11 in the United States Bankruptcy Court for the District of Delaware (the “Bankruptcy Court”) (Consolidated Case No. 09-12743(PJW)) (the “Chapter 11 Cases”). On August 4, 2009, the Company’s Canadian subsidiary, Cooper-Standard Automotive Canada Limited, a corporation incorporated under the laws of Ontario (“CSA Canada”), commenced proceedings seeking relief from its creditors under Canada’s Companies’ Creditors Arrangement Act (the “Canadian Proceedings”) in the Ontario Superior Court of Justice in Toronto, Canada (Commercial List) (the “Canadian Court”), court file no. 09-8307-00CL. The Company’s subsidiaries and operations outside of the United States and Canada were not subject to the requirements of the Bankruptcy Code. On March 26, 2010, the Debtors filed with the Bankruptcy Court their Second Amended Joint Chapter 11 Plan of Reorganization (as amended and supplemented, the “Plan of Reorganization”) and their First Amended Disclosure Statement (as amended and supplemented, the “Disclosure Statement”). On May 12, 2010, the Bankruptcy Court entered an order approving and confirming the Plan of Reorganization (the “Confirmation Order”). CSA Canada’s plan of compromise or arrangement was sanctioned on April 16, 2010.
On May 27, 2010 (the “Effective Date”), the Debtors consummated the reorganization contemplated by the Plan of Reorganization and emerged from Chapter 11 bankruptcy proceedings.
Post-Emergence Capital Structure and Recent Events
Following the Effective Date, our capital structure consisted of the following:
| • | Senior ABL facility. A senior secured asset-based revolving credit facility in the aggregate principal amount of $125,000 (the “Senior ABL Facility”), which contains an uncommitted $25,000 “accordion” facility that will be available at our request if the lenders at the time consent. |
| • |
8 1/2% senior notes due 2018. $450,000 of senior unsecured notes (the “Senior Notes”) that bear interest at 8 1/2% per annum and mature on May 1, 2018. |
| • | Common stock, 7% preferred stock and warrants. Equity securities comprised of (i) 17,489,693 shares of our common stock, (ii) 1,000,000 shares of our 7% cumulative participating convertible preferred stock (“7% preferred stock”), which are initially convertible into 4,290,788 shares of our common stock, and (iii) 2,419,753 warrants (“warrants”) to purchase up to an aggregate of 2,419,753 shares of our common stock. |
On the Effective Date, the Company issued to key employees of the Company, (i) 757,896 shares of common stock plus, subject to realized dilution on the warrants, an additional 104,075 shares of common stock as restricted stock, (ii) 41,664 shares of 7% preferred stock as restricted 7% preferred stock, and (iii) 702,509 options to purchase shares of common stock, plus, subject to realized dilution on the warrants, an additional 78,057 options to purchase shares of common stock. On the day after the Effective Date, the Company issued to certain of its directors and Oak Hill Advisors L.P. or its affiliates, 26,448 shares of common stock as restricted stock and 58,386 options to purchase shares of common stock. The Company also reserved 780,566 shares of common stock for future issuance to the Company’s management. On July 19, 2010, the Company paid a dividend to holders of its outstanding 7% preferred stock in the form of 10,780 additional shares of 7% preferred stock.
For further information on the Senior ABL Facility and the Senior Notes, see Note 7. “Debt” below. For further information on our common stock, 7% preferred stock and warrants, see Note 12. “Capital Stock” below.
F-64
Table of Contents
NOTES TO CONDENSED CONSOLIDATED FINANCIAL STATEMENTS—(Continued)
(Unaudited)
(Dollar amounts in thousands except per share amounts)
Satisfaction of Debtor-in-Possession Financing
In connection with the commencement of the Chapter 11 Cases and the Canadian Proceedings, the Company entered into debtor-in-possession financing arrangements. On the Effective Date, all remaining amounts outstanding under the Company’s debtor-in-possession financing arrangement were repaid using proceeds of the Debtors’ exit financing. For additional information on these financing arrangements, see Note 7. “Debt” below.
Cancellation of Certain Prepetition Obligations
Under the Plan of Reorganization, the Company’s prepetition equity, debt and certain of its other obligations were cancelled and extinguished as follows:
| • | the Predecessor’s equity interests, including common stock and any options, warrants, calls, subscriptions or other similar rights or other agreements, commitments or outstanding securities obligations, were cancelled and extinguished, and no distributions were made to the Predecessor’s former equity holders; |
| • | the Predecessor’s prepetition debt securities were cancelled and the indentures governing such obligations were terminated (other than for the purposes of allowing holders of the notes to receive distributions under the Plan of Reorganization and allowing the trustees to exercise certain rights); and |
| • | the Predecessor’s prepetition credit agreement was cancelled and terminated, including all agreements related thereto (other than for the purposes of allowing creditors under that facility to receive distributions under the Plan of Reorganization and allowing the administrative agent to exercise certain rights). |
For further information regarding the resolution of certain of the Company’s other prepetition liabilities in accordance with the Plan of Reorganization, see Note 3, “Fresh-Start Accounting — Liabilities Subject to Compromise.”
3. Fresh-Start Accounting
As discussed in Note 2, “Reorganization Under Chapter 11,” the Debtors emerged from Chapter 11 bankruptcy proceedings on May 27, 2010. As a result, the Successor adopted fresh-start accounting as (i) the reorganization value of the Predecessor’s assets immediately prior to the confirmation of the Plan of Reorganization was less than the total of all post-petition liabilities and allowed claims and (ii) the holders of the Predecessor’s existing voting shares immediately prior to the confirmation of the Plan of Reorganization received less than 50% of the voting shares of the emerging entity. Accounting principles generally accepted in the United States (“GAAP”) require the adoption of fresh-start accounting as of the Plan of Reorganization’s confirmation date, or as of a later date when all material conditions precedent to the Plan of Reorganization becoming effective are resolved, which occurred on May 27, 2010. The Company elected to adopt fresh-start accounting as of May 31, 2010 to coincide with the timing of its normal May accounting period close. There were no transactions that occurred from May 28, 2010 through May 31, 2010, that would materially impact the Company’s consolidated financial position, results of operations or cash flows for the 2010 Successor or 2010 Predecessor periods.
Reorganization Value
The Bankruptcy Court confirmed the Plan of Reorganization, which included an enterprise value (or distributable value) of $1,025,000, assuming $50,000 of excess cash, as set forth in the Disclosure Statement. For purposes of the Plan of Reorganization and the Disclosure Statement, the Company and certain unsecured creditors agreed
F-65
Table of Contents
NOTES TO CONDENSED CONSOLIDATED FINANCIAL STATEMENTS—(Continued)
(Unaudited)
(Dollar amounts in thousands except per share amounts)
upon this value. This reorganization value was determined to be a fair and reasonable value and is within the range of values considered by the Bankruptcy Court as part of the confirmation process. The reorganization value reflects a number of factors and assumptions, including the Company’s statements of operations and balance sheets, the Company’s financial projections, the amount of cash to fund operations, current market conditions and a return to more normalized light vehicle production and sales volumes. The range of values considered by the Bankruptcy Court of $975,000 to $1,075,000 was determined using comparable public company trading multiples, precedent transactions analysis and discounted cash flow valuation methodologies.
The comparable public company analysis identified a group of comparable companies giving consideration to lines of business, size, geographic footprint and customer base. The analysis compared the public market implied enterprise value for each comparable public company to its projected earnings before interest, taxes, depreciation and amortization (“EBITDA”). The calculated range of multiples for the comparable companies was used to estimate a range which was applied to the Company’s projected EBITDA to determine a range of enterprise values for the reorganized company or the reorganization value.
Precedent transactions analysis estimates the value of a company by examining public merger and acquisition transactions. An analysis of a company’s transaction value as a multiple of various operating statistics provided industry-wide valuation multiples for companies in similar lines of business to the Debtors. Transaction multiples are calculated based on the purchase price (including any debt assumed) paid to acquire companies that are comparable to the Debtors. Prices paid as a multiple of revenue, EBIT and EBITDA were considered, which were then applied to the Debtors’ key operating statistics to estimate the Enterprise Value, or value to a potential strategic buyer.
The discounted cash flow analysis was based on the Company’s projected financial information, which includes a variety of estimates and assumptions. While the Company considers such estimates and assumptions reasonable, they are inherently subject to uncertainties and to a wide variety of significant business, economic and competitive risks, many of which are beyond the Company’s control and may not materialize. Changes in these estimates and assumptions may have had a significant effect on the determination of the Company’s reorganization value. The discounted cash flow analysis was based on recent automotive industry and specific platform production volume projections developed by both third-party and internal forecasts, as well as commercial, wage and benefit, inflation and discount rate assumptions. Other significant assumptions include terminal value growth rate, terminal value margin rate, future capital expenditures and changes in working capital requirements.
Reorganization Adjustments
The unaudited consolidated financial information gives effect to the following Reorganization Adjustments, the Plan of Reorganization and the implementation of the transactions contemplated by the Plan of Reorganization. These adjustments give effect to the terms of the Plan of Reorganization and certain underlying assumptions, which include, but are not limited to, the below.
| • | The issuance of the Senior Notes, which resulted in cash proceeds of $450,000. |
| • | The issuance of 17.5 million shares of our common stock, including 8.6 million shares offered to holders of the Predecessor’s prepetition senior subordinated notes in connection with the rights offering conducted pursuant to the Plan of Reorganization (the “Rights Offering”), 2.6 million shares to certain of the Debtors’ creditors that agreed to backstop the Rights Offering (the “Backstop Parties”) pursuant to an equity commitment agreement (the “Equity Commitment Agreement”) and 6.3 million shares to certain holders of the Predecessor’s prepetition senior notes and prepetition senior subordinated notes. |
F-66
Table of Contents
NOTES TO CONDENSED CONSOLIDATED FINANCIAL STATEMENTS—(Continued)
(Unaudited)
(Dollar amounts in thousands except per share amounts)
| The Company also issued shares of 7% preferred stock convertible into 4.3 million shares of common stock pursuant to the Equity Commitment Agreement. The Company received cash proceeds of $355,000 in connection with the Rights Offering and Equity Commitment Agreement and also received the full and complete satisfaction, settlement and release of allowed prepetition senior note claims and allowed prepetition senior subordinated note claims for such shares. In addition, the Company also issued warrants to purchase 2.4 million shares of common stock. |
| • | The repayment of $175,000 of liabilities under the Debtors’ Debtor-in-Possession Credit Agreement (the “DIP Credit Agreement”). On the Effective Date, each holder of an allowed DIP claim received, in full and complete satisfaction, settlement and release of and in exchange for such allowed claim against the Debtors, an amount in cash equal to the allowed amount of such claim. |
| • | The repayment of the $639,600, including interest, outstanding under the Predecessor’s prepetition credit agreement in cash. |
| • | The repayment of the $105,200, including interest, outstanding of the Predecessor’s prepetition senior notes in cash. |
| • | The effects of the above reorganization adjustments resulted in a decrease in interest expense, including the amortization of debt issuance costs, resulting from a lower level of debt. |
Adoption of Fresh-Start Accounting
Fresh-start accounting results in a new basis of accounting and reflects the allocation of the Company’s fair value to its underlying assets and liabilities. The Company’s estimates of fair value included in the Successor Company financial statements represent the Company’s best estimates based on independent appraisals and valuations. The Company’s estimates of fair value are inherently subject to significant uncertainties and contingencies beyond the control of the Company. Accordingly, there can be no assurance that the estimates, assumptions, valuations and appraisals will be realized, and actual results could vary materially.
The Company’s reorganization value was allocated to its assets in conformity with ASC 805, “Business Combinations.” The excess reorganization value over the fair value of tangible and identifiable intangible assets was recorded as goodwill. Liabilities existing as of the Effective Date, other than deferred taxes, were recorded at the present value of amounts expected to be paid using appropriate risk adjusted interest rates. Deferred taxes were determined in conformity with applicable income tax accounting standards. Predecessor accumulated depreciation, accumulated amortization, retained deficit, common stock and accumulated other comprehensive loss were eliminated.
F-67
Table of Contents
NOTES TO CONDENSED CONSOLIDATED FINANCIAL STATEMENTS—(Continued)
(Unaudited)
(Dollar amounts in thousands except per share amounts)
The following Fresh-Start Consolidated Balance Sheet illustrates the financial effects on the Company of the implementation of the Plan of Reorganization and the adoption of fresh-start accounting. This Fresh-Start Consolidated Balance Sheet reflects the effects of the consummation of the transactions contemplated in the Plan of Reorganization, including settlement of various liabilities, issuance of certain securities, incurrence of new indebtedness, repayment of old indebtedness and other cash payments.
| Predecessor May 31, 2010 |
Reorganization Adjustments (1) |
Fresh-start Adjustments (9) |
Successor May 31, 2010 |
|||||||||||||
| Assets | ||||||||||||||||
| Current assets: |
||||||||||||||||
| Cash and cash equivalents |
$ | 200,311 | (21,642 | )(2) | — | $ | 178,669 | |||||||||
| Restricted cash |
482,234 | (482,234 | )(2) | — | — | |||||||||||
| Accounts receivable, net |
409,041 | — | — | 409,041 | ||||||||||||
| Inventories, net |
116,248 | — | 8,136 | 124,384 | ||||||||||||
| Prepaid expenses |
26,931 | (1,243 | )(3) | — | 25,688 | |||||||||||
| Other |
36,858 | (68 | )(2) | — | 36,790 | |||||||||||
| Total current assets |
1,271,623 | (505,187 | ) | 8,136 | 774,572 | |||||||||||
| Property, plant and equipment, net |
527,306 | — | 40,665 | 567,971 | ||||||||||||
| Goodwill |
87,728 | — | 48,938 | 136,666 | (8) | |||||||||||
| Intangibles, net |
10,294 | — | 144,711 | 155,005 | ||||||||||||
| Other assets |
125,120 | 4,895 | (3) | (26,721 | ) | 103,294 | ||||||||||
| $ | 2,022,071 | $ | (500,292 | ) | $ | 215,729 | $ | 1,737,508 | ||||||||
| Liabilities and Equity (Deficit) | ||||||||||||||||
| Current liabilities: |
||||||||||||||||
| Debt payable within one year |
$ | 15,335 | — | — | $ | 15,335 | ||||||||||
| Debtor-in-possession financing |
74,813 | (74,813 | )(2) | — | — | |||||||||||
| Accounts payable |
171,886 | 6,763 | (4) | — | 178,649 | |||||||||||
| Payroll liabilities |
94,427 | 374 | (4) | (1,154 | ) | 93,647 | ||||||||||
| Accrued liabilities |
92,426 | 4,232 | (4) | (9,462 | ) | 87,196 | ||||||||||
| Total current liabilities |
448,887 | (63,444 | ) | (10,616 | ) | 374,827 | ||||||||||
| Long-term debt |
458,373 | — | — | 458,373 | ||||||||||||
| Pension benefits |
134,278 | 12,473 | (4) | 21,685 | 168,436 | |||||||||||
| Postretirement benefits other than pensions |
75,198 | — | 4,948 | 80,146 | ||||||||||||
| Deferred tax liabilities |
9,218 | (268 | )(4) | 12,267 | 21,217 | |||||||||||
| Other long-term liabilities |
21,124 | 1,891 | (4) | 7,839 | 30,854 | |||||||||||
| Liabilities subject to compromise |
1,213,781 | (1,213,781 | )(4) | — | — | |||||||||||
| Total liabilities |
2,360,859 | (1,263,129 | ) | 36,123 | 1,133,853 | |||||||||||
| Successor preferred stock |
— | 128,000 | (2)(4) | — | 128,000 | |||||||||||
| Equity (deficit): |
||||||||||||||||
| Successor common stock |
— | 17 | (2)(4)(7) | — | 17 | |||||||||||
| Successor additional paid-in capital |
— | 473,275 | (2)(4)(7) | — | 473,275 | |||||||||||
| Predecessor common stock |
35 | (35 | )(5) | — | — | |||||||||||
| Predecessor additional paid-in capital |
356,560 | (356,560 | )(5) | — | — | |||||||||||
| Accumulated deficit |
(633,481 | ) | 518,130 | (6) | 115,351 | — | ||||||||||
| Accumulated other comprehensive loss |
(62,083 | ) | 10 | (4) | 62,073 | — | ||||||||||
| Total Cooper-Standard Holdings Inc. equity (deficit) |
(338,969 | ) | 634,837 | 177,424 | 473,292 | |||||||||||
| Noncontrolling interests |
181 | — | 2,182 | 2,363 | ||||||||||||
| Total equity (deficit) |
(338,788 | ) | 634,837 | 179,606 | 475,655 | |||||||||||
| Total liabilities and equity (deficit) |
$ | 2,022,071 | $ | (500,292 | ) | $ | 215,729 | $ | 1,737,508 | |||||||
F-68
Table of Contents
NOTES TO CONDENSED CONSOLIDATED FINANCIAL STATEMENTS—(Continued)
(Unaudited)
(Dollar amounts in thousands except per share amounts)
| (1) | Represents amounts recorded as of the Effective Date for the consummation of the Plan of Reorganization, including the settlement of liabilities subject to compromise, the satisfaction of the DIP Credit Agreement, the incurrence of new indebtedness and related cash payments, the issuances of 7% preferred stock and common stock and the cancellation of the Predecessor’s common stock. |
| (2) | This adjustment reflects net cash payments recorded as of the Effective Date. |
| Release of restricted cash (a) |
$ | 482,234 | ||
| Cash received from Rights Offering |
355,000 | |||
| Payment of prepetition bank debt |
(639,646 | ) | ||
| Payment of prepetition senior notes |
(105,227 | ) | ||
| Repayment of DIP Credit Agreement |
(75,777 | ) | ||
| Other |
(38,226 | ) | ||
| Net cash payments |
$ | (21,642 | ) | |
| (a) | Includes proceeds from issuance of long term debt held in restricted cash until the Effective Date. |
| (3) | This adjustment reflects the capitalization of $4,895 of debt issuance costs related to the Senior ABL Facility. |
| (4) | This adjustment reflects the settlement of liabilities subject to compromise (see “Liabilities Subject to Compromise” below). |
| Settlement of liabilities subject to compromise |
$ | (1,213,781 | ) | |
| Liabilities settled by cash (a) |
765,931 | |||
| Issuance of Successor common stock, 7% preferred stock and warrants, net |
258,716 | |||
| Liabilities reinstated |
26,891 | |||
| Gain on settlement of liabilities subject to compromise |
$ | (162,243 | ) | |
| (a) | Cash received from borrowings under the Senior Notes and amounts received from the Rights Offering. |
| (5) | This adjustment reflects the cancellation of the Predecessor’s common stock. |
| (6) | This adjustment reflects the cumulative impact of the Reorganization Adjustments discussed above. |
| Gain on settlement of liabilities subject to compromise |
$ | (162,243 | ) | |
| Cancellation of Predecessor’s common stock |
(356,595 | ) | ||
| Other |
708 | |||
| $ | (518,130 | ) | ||
F-69
Table of Contents
NOTES TO CONDENSED CONSOLIDATED FINANCIAL STATEMENTS—(Continued)
(Unaudited)
(Dollar amounts in thousands except per share amounts)
| (7) | A reconciliation of the reorganization value of the Successor’s common stock as of the Effective Date is shown below: |
| Reorganization value |
$ | 1,025,000 | ||
| Less: Senior Notes |
(450,000 | ) | ||
| Other debt |
(23,708 | ) | ||
| 7% preferred stock |
(128,000 | ) | ||
| Plus: Excess cash |
50,000 | |||
| Reorganization value of Successor’s common stock and warrants |
473,292 | |||
| Less: Fair value of warrants (a) |
20,919 | |||
| Reorganization value of Successor’s common stock |
$ | 452,373 | ||
| Shares outstanding as of May 31, 2010 (b) |
17,489,693 | |||
| Per share value (c) |
$ | 25.87 |
| (a) | For further information on the fair value of the warrants, see Note 12, “Capital Stock.” |
| (b) | Does not include restricted shares issued to management upon emergence that vest over 3-4 years. |
| (c) | The per share value of $25.87 was used to record the issuance of the Successor’s common stock. |
| (8) | A reconciliation of the reorganization value of the Successor’s assets and goodwill is shown below: |
| Reorganization value |
$ | 1,025,000 | ||
| Plus: Liabilities (excluding debt and after giving effect to fresh-start accounting adjustments) |
660,145 | |||
| Fair value of noncontrolling interest |
2,363 | |||
| Excess cash |
50,000 | |||
| Reorganization value of Successor’s assets |
1,737,508 | |||
| Less: Successor’s assets (excluding goodwill and after giving effect to fresh-start accounting adjustments) |
1,600,842 | |||
| Reorganization value of Successor’s assets in excess of fair value - Successor’s goodwill |
$ | 136,666 | ||
F-70
Table of Contents
NOTES TO CONDENSED CONSOLIDATED FINANCIAL STATEMENTS—(Continued)
(Unaudited)
(Dollar amounts in thousands except per share amounts)
| (9) | Represents the adjustment of assets and liabilities to fair value, or other measurement as specified by ASC 805, in conjunction with the adoption of fresh-start accounting. Significant adjustments are summarized below. |
| Elimination of Predecessor’s goodwill |
$ | (87,728 | ) | |
| Successor’s goodwill |
136,666 | |||
| Elimination of Predecessor’s intangible assets |
(10,294 | ) | ||
| Successor’s intangible asset adjustment (a) |
155,005 | |||
| Defined benefit plans adjustment (b) |
(30,680 | ) | ||
| Inventory adjustment (c) |
8,136 | |||
| Property, plant and equipment adjustment (d) |
40,665 | |||
| Investments in non-consolidated affiliates adjustment (e) |
9,021 | |||
| Noncontrolling interest adjustments (e) |
(2,182 | ) | ||
| Elimination of Predecessor’s accumulated other comprehensive loss and other adjustments |
(78,678 | ) | ||
| Pretax income on fresh-start accounting adjustments |
139,931 | |||
| Tax related to fresh-start accounting adjustments (f) |
(24,580 | ) | ||
| Net gain on fresh-start accounting adjustments |
$ | 115,351 | ||
| (a) | Intangible assets – This adjustment reflects the fair value of intangible assets determined as of the Effective Date. For further information on the valuation of intangible assets, see Note 4, “Goodwill and Intangibles.” |
| (b) | Defined benefit plans – This adjustment primarily reflects differences in assumptions, such as the expected return on plan assets and the weighted average discount rate related to the payment of benefit obligations, between the prior measurement date of December 31, 2009 and the Effective Date. The $(30,680) is reflected in the pension benefits $(21,685), postretirement benefits other than pension $(4,948), other assets $(4,701), accrued payroll $(591) and accrued liabilities $1,245 line items on the Fresh-Start Consolidated Balance Sheet. |
| (c) | Inventory – This amount adjusts inventory to fair value as of the Effective Date, which is estimated for finished goods and work-in-process based upon the expected selling price less cost to complete, selling and disposal cost and a normal selling profit. Raw material inventory was recorded at a carrying value as such value approximates the replacement cost. |
| (d) | Property, plant and equipment – This amount adjusts property, plant and equipment to fair value as of the Effective Date, giving consideration to the highest value and best use of these assets. Fair value estimates were based on independent appraisals. Key assumptions used in the appraisals were based on a combination of income, market and cost approaches, as appropriate. |
| (e) | Investments in non-consolidated and noncontrolling interests – These amounts adjust investments in non-consolidated affiliates and noncontrolling interests to their estimated fair values. Estimated fair values were based on internal and external valuations using customary valuation methodologies, including comparable earnings multiples, discounted cash flows and negotiated transaction values. The adjustment to investments in non-consolidated affiliates of $9,021 is included in the other assets line item on the Fresh-Start Consolidated Balance Sheet. |
| (f) | Tax expense – This amount reflects the tax expense related to the fair value adjustments of inventory, property, plant and equipment, intangibles, tooling and investments and is included in the other assets $(17,313), accrued liabilities $5,000 and deferred tax liabilities $(12,267) line items on the Fresh-Start Consolidated Balance Sheet. |
F-71
Table of Contents
NOTES TO CONDENSED CONSOLIDATED FINANCIAL STATEMENTS—(Continued)
(Unaudited)
(Dollar amounts in thousands except per share amounts)
Liabilities Subject to Compromise
Certain prepetition liabilities were subject to compromise under the Plan of Reorganization and were reported at amounts allowed or expected to be allowed by the Bankruptcy Court. Certain of these claims were resolved and satisfied as of the Effective Date. A summary of liabilities subject to compromise reflected in the Predecessor consolidated balance sheet as of May 31, 2010, is shown below:
| Predecessor - May 31, 2010 | ||||
| Short-term borrowings |
$ | 85,503 | ||
| Accounts payable |
8,007 | |||
| Accrued liabilities |
23,433 | |||
| Derivatives |
18,081 | |||
| Debt subject to compromise |
||||
| Prepetition primary credit facility |
520,637 | |||
| Prepetition senior notes |
197,320 | |||
| Prepetition senior subordinated notes |
308,009 | |||
| Accrued interest |
52,791 | |||
| Liabilities subject to compromise |
$ | 1,213,781 | ||
Reorganization Items and Fresh-Start Accounting Adjustments, net
Reorganization items include expenses, gains and losses directly related to the Debtors’ reorganization proceedings. Fresh-start accounting adjustments reflect the impact of adoption of fresh-start accounting. A summary of reorganization items and fresh-start accounting adjustments, net for the Predecessor Period, is shown below:
| Pre-tax reorganization items: |
||||
| Professional and other fees |
$ | 48,701 | ||
| Gain on prepetition settlement |
(49,980 | ) | ||
| Gain on settlement of liabilities subject to compromise |
(162,243 | ) | ||
| Cancellation of Predecessor common stock |
(356,595 | ) | ||
| (520,117 | ) | |||
| Pre-tax fresh-start accounting adjustments |
(139,931 | ) | ||
| Reorganization items and fresh-start accounting adjustments, net |
$ | (660,048 | ) | |
F-72
Table of Contents
NOTES TO CONDENSED CONSOLIDATED FINANCIAL STATEMENTS—(Continued)
(Unaudited)
(Dollar amounts in thousands except per share amounts)
4. Goodwill and Intangibles
The changes in the carrying amount of goodwill by reportable operating segment for the nine months ended September 30, 2010 are summarized as follows:
| North America | International | Total | ||||||||||
| Balance as of January 1, 2010 - Predecessor |
$ | 87,728 | $ | — | $ | 87,728 | ||||||
| Fresh-start accounting adjustments (Note 3) |
28,778 | 20,160 | 48,938 | |||||||||
| Balance as of May 31, 2010 - Successor |
$ | 116,506 | $ | 20,160 | $ | 136,666 | ||||||
| Foreign exchange translation |
87 | 1,718 | 1,805 | |||||||||
| Balance as of September 30, 2010 - Successor |
$ | 116,593 | $ | 21,878 | $ | 138,471 | ||||||
Goodwill is not amortized but is tested annually for impairment, or when events or circumstances indicate that impairment may exist, by reporting units, which are determined in accordance with ASC Topic 350, “Goodwill and Other Intangible Assets.”
The following table presents the Predecessor’s intangible assets and accumulated amortization balances as of December 31, 2009:
| Gross Carrying Amount |
Accumulated Amortization |
Net Carrying Amount |
Amortization Period | |||||||||||
| Developed technology |
$ | 3,335 | $ | (1,479 | ) | $ | 1,856 | 5 to 12 years | ||||||
| Other |
8,986 | (293 | ) | 8,693 | ||||||||||
| Balance at December 31, 2009 - Predecessor |
$ | 12,321 | $ | (1,772 | ) | $ | 10,549 | |||||||
Amortization expense of $194 was recognized for the three months ended September 30, 2009. Amortization expense of $319 and $14,783 was recognized for the five months ended May 31, 2010 and for the nine months ended September 30, 2009, respectively.
In connection with the adoption of fresh-start accounting, the Company, with the assistance of independent appraisal, valued certain intangible assets at their estimated fair value, as of May 31, 2010. The value assigned to developed technology intangibles is based on the royalty savings method, which applies a hypothetical royalty rate to projected revenues attributable to the identified technologies. Royalty rates were determined based on analysis of market information. The customer-based intangible asset includes the Company’s established relationship with its customers and the ability of these customers to generate future economic profits for the Company. A summary of intangible assets as of September 30, 2010 is shown below:
| Gross Carrying Amount |
Accumulated Amortization |
Net Carrying Amount |
Weighted Average Useful Life (Years) |
|||||||||||||
| Customer relationships |
$ | 139,508 | $ | (4,571 | ) | $ | 134,937 | 9.9 | ||||||||
| Developed technology |
9,710 | (542 | ) | 9,168 | 5.9 | |||||||||||
| Other |
8,980 | (51 | ) | 8,929 | ||||||||||||
| Balance at September 30, 2010 - Successor |
$ | 158,198 | $ | (5,164 | ) | $ | 153,034 | 9.4 | ||||||||
F-73
Table of Contents
NOTES TO CONDENSED CONSOLIDATED FINANCIAL STATEMENTS—(Continued)
(Unaudited)
(Dollar amounts in thousands except per share amounts)
Amortization expense totaled $3,842 and $5,106 for the three and four months ended September 30, 2010, respectively. Estimated amortization expense will total approximately $9,000 for the Successor period ending December 31, 2010 and approximately $15,500 for each of the next five years.
5. Restructuring
The Company implemented several restructuring initiatives in prior years in connection with the closure of facilities in North America, Europe and Asia. The Company commenced these initiatives prior to December 31, 2007 and continued to execute the closures through September 30, 2010. The majority of the costs associated with the closures were incurred shortly after the original implementation. However, the Company continues to incur costs related principally to the liquidation of the respective facilities. The total expense incurred for the Predecessor period ending May 31, 2010 and Successor period ending September 30, 2010 amounted to $470 and $222 respectively.
In July 2008, the Company implemented a restructuring action and announced the closure of two manufacturing facilities, one located in Australia and the other located in Germany. Both closures were a result of changes in market demands and volume reductions and are substantially completed as of September 30, 2010. However, the Company will continue to incur costs until the facilities are sold. The estimated total cost of these initiatives is approximately $20,940. The following table summarizes the activity related to these initiatives for the nine months ended September 30, 2010.
| Employee Separation Costs |
Other Exit Costs |
Asset Impairments |
Total | |||||||||||||
| Balance at January 1, 2010 - Predecessor |
$ | 1,443 | $ | 235 | $ | — | $ | 1,678 | ||||||||
| Expense |
(460 | ) | 159 | — | (301 | ) | ||||||||||
| Cash payments |
(724 | ) | (318 | ) | — | (1,042 | ) | |||||||||
| Balance at May 31, 2010 |
$ | 259 | $ | 76 | $ | — | $ | 335 | ||||||||
| Expense |
— | 117 | — | 117 | ||||||||||||
| Cash payments |
(155 | ) | (193 | ) | — | (348 | ) | |||||||||
| Balance at September 30, 2010 - Successor |
$ | 104 | $ | — | $ | — | $ | 104 | ||||||||
F-74
Table of Contents
NOTES TO CONDENSED CONSOLIDATED FINANCIAL STATEMENTS—(Continued)
(Unaudited)
(Dollar amounts in thousands except per share amounts)
During 2008, the Company commenced the initial phase of a reorganization ultimately involving the discontinuation of its global product line operating divisions, formerly called the Body & Chassis Systems division (which included the body sealing and AVS product lines) and the Fluid Systems division, and the establishment of a new operating structure organized on the basis of geographic regions. In the first quarter of 2009, the Company initiated the final phase of the reorganization of its operating structure, formally discontinuing its product line operating divisions and putting into place the new operating divisions based on geographic regions. The estimated cost of this initiative is approximately $26,000. The following table summarizes the activity for this initiative for the nine months ended September 30, 2010:
| Employee Separation Costs |
Other Exit Costs |
Asset Impairments |
Total | |||||||||||||
| Balance at January 1, 2010 - Predecessor |
$ | 7,771 | $ | — | $ | — | $ | 7,771 | ||||||||
| Expense |
(450 | ) | — | — | (450 | ) | ||||||||||
| Cash payments |
(3,297 | ) | — | — | (3,297 | ) | ||||||||||
| Balance at May 31, 2010 |
$ | 4,024 | $ | — | $ | — | $ | 4,024 | ||||||||
| Expense |
(96 | ) | — | — | (96 | ) | ||||||||||
| Cash payments |
(163 | ) | — | — | (163 | ) | ||||||||||
| Balance at September 30, 2010 - Successor |
$ | 3,765 | $ | — | $ | — | $ | 3,765 | ||||||||
The Company commenced several initiatives during 2009. These initiatives related to the reorganization or closure of operating facilities in South America, Europe and Asia Pacific. The estimated total cost associated with these actions amount to $18,900. The following table summarizes the activity for these initiatives for the nine months ended September 30, 2010:
| Employee Separation Costs |
Other Exit Costs |
Asset Impairments |
Total | |||||||||||||
| Balance at January 1, 2010 - Predecessor |
$ | 4,215 | $ | 56 | $ | — | $ | 4,271 | ||||||||
| Expense |
5,168 | 314 | (21 | ) | 5,461 | |||||||||||
| Cash payments |
(2,680 | ) | (347 | ) | 21 | (3,006 | ) | |||||||||
| Balance at May 31, 2010 |
$ | 6,703 | $ | 23 | $ | — | $ | 6,726 | ||||||||
| Expense |
(71 | ) | 842 | — | 771 | |||||||||||
| Cash payments |
(5,479 | ) | (865 | ) | — | (6,344 | ) | |||||||||
| Balance at September 30, 2010 - Successor |
$ | 1,153 | $ | — | $ | — | $ | 1,153 | ||||||||
F-75
Table of Contents
NOTES TO CONDENSED CONSOLIDATED FINANCIAL STATEMENTS—(Continued)
(Unaudited)
(Dollar amounts in thousands except per share amounts)
In the second quarter of 2010, the Company initiated the closure of a facility and the consolidation of two other facilities located in North America. The estimated total costs of these initiatives is $2,100 and are expected to be completed in 2010. The following table summarizes the activity for these initiatives for the nine months ended September 30, 2010:
| Employee Separation Costs |
Other Exit Costs |
Asset Impairments |
Total | |||||||||||||
| Balance at January 1, 2010 - Predecessor |
$ | — | $ | — | $ | — | $ | — | ||||||||
| Expense |
595 | 118 | — | 713 | ||||||||||||
| Cash payments |
(132 | ) | (118 | ) | — | (250 | ) | |||||||||
| Balance at May 31, 2010 |
$ | 463 | $ | — | $ | — | $ | 463 | ||||||||
| Expense |
(83 | ) | 269 | — | 186 | |||||||||||
| Cash payments |
(214 | ) | (269 | ) | — | (483 | ) | |||||||||
| Balance at September 30, 2010 - Successor |
$ | 166 | $ | — | $ | — | $ | 166 | ||||||||
6. Inventories
Inventories are comprised of the following:
| Predecessor | Successor | |||||||||
| December 31, 2009 |
September 30, 2010 |
|||||||||
| Finished goods |
$ | 27,826 | $ | 31,013 | ||||||
| Work in process |
25,616 | 30,330 | ||||||||
| Raw materials and supplies |
58,133 | 62,517 | ||||||||
| $ | 111,575 | $ | 123,860 | |||||||
In connection with the adoption of fresh-start accounting, an $8,136 fair value write-up was recorded at May 31, 2010 in the Predecessor. Such inventory was liquidated as of June 30, 2010 in the Successor and recorded as an increase to cost of products sold.
7. Debt
Outstanding debt consisted of the following at December 31, 2009 and September 30, 2010, respectively:
| Predecessor | Successor | |||||||||
| December 31, 2009 |
September 30, 2010 |
|||||||||
| Senior Notes |
$ | — | $ | 450,000 | ||||||
| DIP Credit Agreement |
175,000 | — | ||||||||
| Other borrowings |
29,263 | 27,033 | ||||||||
| Total debt |
$ | 204,263 | $ | 477,033 | ||||||
| Less: Current portion of long term debt |
(18,204 | ) | (19,166 | ) | ||||||
| DIP Credit Agreement |
(175,000 | ) | — | |||||||
| Total long-term debt |
$ | 11,059 | $ | 457,867 | ||||||
F-76
Table of Contents
NOTES TO CONDENSED CONSOLIDATED FINANCIAL STATEMENTS—(Continued)
(Unaudited)
(Dollar amounts in thousands except per share amounts)
Senior Notes
On May 11, 2010, CSA Escrow Corporation (the “Escrow Issuer”), an indirect wholly-owned non-debtor subsidiary of CSA U.S., issued $450,000 aggregate principal amount of the Senior Notes. On the Effective Date, the Escrow Issuer was merged with and into CSA U.S., with CSA U.S. assuming the obligations under the Senior Notes. Proceeds from the Senior Notes, together with proceeds of the Rights Offering and cash on hand, were used to pay claims under the Predecessor’s prepetition credit agreement, the DIP Credit Agreement and the portion of the Predecessor’s prepetition senior notes payable in cash, in full, together with related fees and expenses.
The Senior Notes are guaranteed, jointly and severally, on a senior unsecured basis, by the Company and all of CSA U.S.’s wholly-owned domestic restricted subsidiaries (collectively, the “obligors”). If CSA U.S. or any of its domestic restricted subsidiaries acquires or creates another wholly-owned domestic restricted subsidiary that guarantees certain debt of CSA U.S. or a guarantor, such newly acquired or created subsidiary will also guarantee the Senior Notes. The Senior Notes bear an interest rate of 8 1/2% and mature on May 1, 2018. Interest is payable semi-annually on May 1 and November 1.
The Senior Notes and the guarantees constitute senior debt of the obligors and (1) rank equally in right of payment with all of the obligors’ existing and future senior debt, (2) rank senior in right of payment to all of the obligors’ existing and future subordinated debt, (3) are effectively subordinated in right of payment to all of the obligors’ existing and future secured indebtedness and secured obligations to the extent of the value of the collateral securing such indebtedness and obligations and (4) are structurally subordinated to all existing and future indebtedness and other liabilities of CSA U.S.’s non-guarantor subsidiaries (other than indebtedness and liabilities owed to CSA U.S. or one of its guarantor subsidiaries).
CSA U.S. has the right to redeem the Senior Notes at the redemption prices set forth below:
| • | on and after May 1, 2014, all or a portion of the Senior Notes may be redeemed at a redemption price of 104.250% of the principal amount thereof if redeemed during the twelve-month period beginning on May 1, 2014, 102.125% of the principal amount thereof if redeemed during the twelve-month period beginning on May 1, 2015, and 100% of the principal amount thereof if redeemed on or after May 1, 2016, plus any accrued and unpaid interest to the redemption date; |
| • | prior to May 1, 2013, up to 35% of the Senior Notes issued under the indenture may be redeemed with the proceeds from certain equity offerings at a redemption price of 108.50% of the principal amount thereof, plus any accrued and unpaid interest to the redemption date; and |
| • | prior to May 1, 2014, all or a portion of the Senior Notes may be redeemed at a price equal to 100% of the principal amount thereof plus a make-whole premium. |
If a change of control occurs, unless CSA U.S. has exercised its right to redeem all of the outstanding Senior Notes through an optional redemption (as described above), each noteholder shall have the right to require that CSA U.S. repurchase such noteholder’s Senior Notes at a purchase price in cash equal to 101% of the principal amount on the date of purchase plus accrued and unpaid interest, if any, to the date of purchase, subject to the right of the noteholders of record on the relevant record date to receive interest due on the relevant interest payment date.
The indenture limits, among other things, the ability of CSA U.S. and its restricted subsidiaries to pay dividends or distributions, repurchase equity, prepay subordinated debt or make certain investments, incur additional debt or issue certain disqualified stock and preferred stock, incur liens, merge or consolidate with another company or
F-77
Table of Contents
NOTES TO CONDENSED CONSOLIDATED FINANCIAL STATEMENTS—(Continued)
(Unaudited)
(Dollar amounts in thousands except per share amounts)
sell all or substantially all of its assets, enter into transactions with affiliates and allow to exist certain restrictions on the ability of the subsidiary guarantors to pay dividends or make other payments to CSA U.S., in each case, subject to exclusions and other customary exceptions. In addition, certain of these covenants will not be applicable during any period of time when the Senior Notes have an investment grade rating. The indenture also contains customary events of default.
Senior ABL Facility
On the Effective Date, the Company, CSA U.S., CSA Canada (together with CSA U.S., the “Borrowers”) and certain subsidiaries of CSA U.S. entered into the Senior ABL Facility with certain lenders, Bank of America, N.A., as agent (the “Agent”), for such lenders, Deutsche Bank Trust Company Americas, as syndication agent, and Banc of America Securities LLC, Deutsche Bank Securities Inc., UBS Securities LLC and Barclays Capital, as joint lead arrangers and bookrunners. The Senior ABL Facility provides for an aggregate revolving loan availability of up to $125,000, subject to borrowing base availability, including a $45,000 letter of credit sub-facility and a $20,000 swing line sub-facility. The Senior ABL Facility also provides for an uncommitted $25,000 incremental loan facility, for a potential total Senior ABL Facility of $150,000 (if requested by the Borrowers and the lenders agree to fund such increase). No consent of any lender (other than those participating in the increase) is required to effect any such increase. As of September 30, 2010, no amounts were drawn under the Senior ABL Facility, but there was approximately $36,300 of letters of credit outstanding.
Any borrowings under the Senior ABL Facility will mature, and the commitments of the lenders under the Senior ABL Facility will terminate, on May 27, 2014. Proceeds from the Senior ABL Facility may be used by the Borrowers to pay certain unsecured claims, administrative expenses and administrative claims as contemplated by the Plan of Reorganization, to issue commercial and standby letters of credit, to finance ongoing working capital needs and for general corporate purposes. Loan (and letter of credit) availability under the Senior ABL facility is subject to a borrowing base, which at any time is limited to the lesser of: (A) the maximum facility amount (subject to certain adjustments) and (B) (i) up to 85% of eligible accounts receivable; plus (ii) up to the lesser of 70% of eligible inventory or 85% of the appraised net orderly liquidation value of eligible inventory; minus reserves established by the Agent. The accounts receivable portion of the borrowing base is subject to certain formulaic limitations (including concentration limits). The inventory portion of the borrowing base is limited to eligible inventory, as determined by an independent appraisal. The borrowing base is also subject to certain reserves, which are established by the Agent (which may include changes to the advance rates indicated above). Loan availability under the Senior ABL Facility is apportioned, as follows: $100,000 to CSA U.S. and $25,000 to CSA Canada.
The obligations of CSA U.S. under the Senior ABL Facility and cash management arrangements and interest rate, foreign currency or commodity swaps entered into by the Company, in each case with the lenders and their affiliates (collectively “Additional ABL Secured Obligations”), are guaranteed on a senior secured basis by the Company and all of our U.S. subsidiaries (other than CS Automotive LLC), and the obligations of CSA Canada under the Senior ABL Facility and Additional ABL Secured Obligations of CSA Canada and its Canadian subsidiaries are guaranteed on a senior secured basis by the Company, all of the Canadian subsidiaries of CSA Canada and all of the Company’s U.S. subsidiaries. CSA U.S. guarantees the Additional ABL Secured Obligations of its subsidiaries and CSA Canada guarantees the Additional ABL Secured Obligations of its Canadian subsidiaries. The obligations under the Senior ABL Facility and related guarantees are secured by a first priority lien on all of each Borrower’s and each guarantor’s existing and future personal property consisting of accounts receivable, payment intangibles, inventory, documents, instruments, chattel paper and investment property, certain money, deposit accounts and securities accounts and certain related assets and proceeds of the foregoing.
F-78
Table of Contents
NOTES TO CONDENSED CONSOLIDATED FINANCIAL STATEMENTS—(Continued)
(Unaudited)
(Dollar amounts in thousands except per share amounts)
Borrowings under the Senior ABL Facility bear interest at a rate equal to, at the Borrowers’ option:
| • | in the case of borrowings by the U.S. Borrower, LIBOR or the base rate plus, in each case, an applicable margin; or |
| • | in the case of borrowings by the Canadian Borrower, BA rate, Canadian prime rate or Canadian base rate plus, in each case, an applicable margin. |
The initial applicable margin is 3.5% with respect to the LIBOR or BA-based borrowings and 2.5% with respect to base rate, Canadian prime rate and Canadian base rate borrowings. The applicable margin is subject, in each case, to quarterly performance pricing adjustments commencing six months after the closing date.
In addition to paying interest on outstanding principal under the Senior ABL Facility, the Borrowers are required to pay a fee in respect of committed but unutilized commitments equal to 0.50% per annum when usage of the Senior ABL Facility (as apportioned between the U.S. and Canadian facilities) is greater than 50% and 0.75% per annum when usage of the Senior ABL Facility is equal to or less than 50%. The Borrowers are also required to pay a fee on outstanding letters of credit under the Senior ABL Facility at a rate equal to the applicable margin in respect of LIBOR and BA-based borrowings plus a fronting fee at a rate of 0.125% per annum to the issuer of such letters of credit, together with customary issuance and other letter of credit fees. The Senior ABL Facility also requires the payment of customary agency and administrative fees.
The Borrowers are able to voluntarily reduce the unutilized portion of the commitment amount and repay outstanding loans, in each case, in whole or in part, at any time without premium or penalty (other than customary breakage and related reemployment costs with respect to repayments of LIBOR-based borrowings).
The Senior ABL Facility includes affirmative and negative covenants that will impose substantial restrictions on the Company’s financial and business operations, including our ability to incur and secure debt, make investments, sell assets, pay dividends or make acquisitions. The Senior ABL Facility also includes a requirement to maintain a monthly fixed charge coverage ratio of no less than 1.1 to 1.0 when availability under the Senior ABL Facility is less than specified levels. The Senior ABL Facility also contains various events of default that are customary for comparable facilities.
Prepetition Debt
The filing of the Chapter 11 Cases by the Debtors on August 3, 2009 constituted a default or otherwise triggered repayment obligations under substantially all prepetition debt obligations of the Debtors, and as a result, the loan commitments of the lenders under the Predecessor’s prepetition credit agreement were terminated and all principal and accrued and unpaid interest outstanding under the prepetition credit agreement and the Predecessor’s prepetition notes accelerated and became due and payable (subject to the automatic stay under Chapter 11). As of the date of the filing of the Chapter 11 Cases, approximately $608,000 of principal and accrued and unpaid interest was outstanding under the Predecessor’s prepetition credit agreement, approximately $208,800 of principal and accrued and unpaid interest was outstanding under the Predecessor’s prepetition 7% senior notes due 2012 and approximately $329,900 of principal and accrued and unpaid interest was outstanding under the Predecessor’s prepetition 8 3/8% senior subordinated notes due 2014. Approximately $639,600 of claims under the Predecessor’s prepetition credit agreement were paid in full in cash on the Effective Date with proceeds of the Company’s exit financing and obligations under the Predecessor’s prepetition credit agreement were cancelled. Holders of the Predecessor’s prepetition senior notes were paid in full in cash on the Effective Date, except that certain of the noteholders received a distribution of common stock in lieu of the cash payment for certain of their prepetition senior note claims. Holders of the prepetition senior subordinated notes were
F-79
Table of Contents
NOTES TO CONDENSED CONSOLIDATED FINANCIAL STATEMENTS—(Continued)
(Unaudited)
(Dollar amounts in thousands except per share amounts)
issued 8% of our outstanding common stock and warrants to purchase, in the aggregate, 3% of our outstanding common stock (in each case, assuming the conversion of our 7% preferred stock). Obligations under both the Predecessor’s prepetition senior notes and prepetition senior subordinated notes were cancelled.
DIP Credit Agreement
On August 5, 2009, the Bankruptcy Court entered an interim order approving debtor-in-possession financing on an interim basis. Pursuant to this interim order, the Predecessor entered into a Debtor-In-Possession Credit Agreement, dated as of August 5, 2009 (the “Initial DIP Credit Agreement”), among the Company, CSA U.S., and CSA Canada, various lenders party thereto, Deutsche Bank Trust Company Americas, as administrative agent and collateral agent, Banc of America Securities LLC, General Electric Capital Corporation and UBS Securities LLC, as co-syndication agents, Deutsche Bank Trust Company Americas, as documentation agent, Deutsche Bank Securities Inc. and General Electric Capital Corporation, as joint lead arrangers and book runners, and Banc of America Securities LLC and UBS Securities LLC, as co-arrangers. The Predecessor received final approval of the Initial DIP Credit Agreement from the Bankruptcy Court on September 1, 2009. The Predecessor received approval of the Initial DIP Credit Agreement from the Canadian Court on August 6, 2009. The Initial DIP Credit Agreement was amended on August 31, 2009 and September 11, 2009. Both amendments primarily updated some post-closing non-U.S. collateral delivery requirements. In addition, on December 2, 2009, Metzeler Automotive Profile Systems GmbH, a German limited liability company (the “German Borrower” and together with CSA U.S. and CSA Canada, the “DIP Borrowers”), became an additional borrower under the Initial DIP Credit Agreement. Under the Initial DIP Credit Agreement, the DIP Borrowers borrowed an aggregate of $175,000 principal amount of superpriority senior secured term loans in order to finance their operating, working capital and other general corporate needs (including the payment of fees and expenses in accordance with the orders of the Bankruptcy Court and the Canadian Court authorizing such borrowings). The Initial DIP Credit Agreement also provided for an ability to incur up to an aggregate of $25,000 in uncommitted incremental debt.
In order to refinance the Initial DIP Credit Agreement on terms more favorable to the Predecessor, on December 18, 2009 the Predecessor entered the DIP Credit Agreement, among the Company, the DIP Borrowers, various lenders party thereto, Deutsche Bank Trust Company Americas, as the administrative agent (in such capacity, the “DIP Agent”), collateral agent and documentation agent, and Deutsche Bank Securities Inc., as syndication agent, sole lead arranger and book runner. Under the DIP Credit Agreement, the lenders party thereto committed to provide superpriority senior secured term loans to the DIP Borrowers in an aggregate principal amount of up to $175,000 (the “DIP Facility”), subject to certain conditions. The DIP Credit Agreement also provided for an additional uncommitted $25,000 incremental facility, for a total DIP Facility of up to $200,000.
The Predecessor prepaid $25,000 of the borrowings under the DIP Credit Agreement on each of January 29, 2010, March 26, 2010, April 20, 2010, and May 18, 2010. In addition, the Company repaid $188 on March 31, 2010. The remaining balance was repaid on the Effective Date, at which time the DIP Credit Agreement was cancelled and terminated, including all agreements related thereto.
F-80
Table of Contents
NOTES TO CONDENSED CONSOLIDATED FINANCIAL STATEMENTS—(Continued)
(Unaudited)
(Dollar amounts in thousands except per share amounts)
8. Pension and Postretirement Benefits other than Pensions
The following tables disclose the amount of net periodic benefit costs for the three and nine months ended September 30, 2009 and 2010 for the Company’s defined benefit plans and other postretirement benefit plans:
| Pension Benefits | ||||||||||||||||||||||||||
| Predecessor | Successor | |||||||||||||||||||||||||
| Three Months
Ended September 30, 2009 |
Three Months Ended September 30, 2010 |
|||||||||||||||||||||||||
| U.S. | Non-U.S. | U.S. | Non-U.S. | |||||||||||||||||||||||
| Service cost |
|
$ | 707 | $ | 686 | $ | 560 | $ | 599 | |||||||||||||||||
| Interest cost |
|
3,787 | 1,841 | 3,846 | 1,706 | |||||||||||||||||||||
| Expected return on plan assets |
|
(3,280 | ) | (776 | ) | (3,694 | ) | (871 | ) | |||||||||||||||||
| Amortization of prior service cost and recognized actuarial loss |
|
960 | 52 | — | — | |||||||||||||||||||||
| Net periodic benefit cost |
|
$ | 2,174 | $ | 1,803 | $ | 712 | $ | 1,434 | |||||||||||||||||
| Pension Benefits | ||||||||||||||||||||||||||
| Predecessor | Successor | |||||||||||||||||||||||||
| Nine Months Ended September 30, 2009 |
Five Months Ended May 31, 2010 |
Four Months Ended September 30, 2010 |
||||||||||||||||||||||||
| U.S. | Non-U.S. | U.S. | Non-U.S. | U.S. | Non-U.S. | |||||||||||||||||||||
| Service cost |
$ | 2,120 | $ | 1,961 | $ | 1,002 | $ | 893 | $ | 747 | $ | 791 | ||||||||||||||
| Interest cost |
11,360 | 5,247 | 6,278 | 2,871 | 5,128 | 2,256 | ||||||||||||||||||||
| Expected return on plan assets |
(9,839 | ) | (2,190 | ) | (6,050 | ) | (1,460 | ) | (4,925 | ) | (1,159 | ) | ||||||||||||||
| Amortization of prior service cost and recognized actuarial loss |
2,881 | 149 | 1,467 | 70 | — | — | ||||||||||||||||||||
| Curtailment cost |
68 | — | — | — | — | — | ||||||||||||||||||||
| Net periodic benefit cost |
$ | 6,590 | $ | 5,167 | $ | 2,697 | $ | 2,374 | $ | 950 | $ | 1,888 | ||||||||||||||
| Other Postretirement Benefits | ||||||||||||||||||||||||||
| Predecessor | Successor | Predecessor | Successor | |||||||||||||||||||||||
| Three Months Ended September 30, |
Nine Months Ended September 30, 2009 |
Five Months Ended May 31, 2010 |
Four Months Ended September 30, 2010 |
|||||||||||||||||||||||
| 2009 | 2010 | |||||||||||||||||||||||||
| Service cost |
$ | 442 | $ | 433 | $ | 1,307 | $ | 638 | $ | 577 | ||||||||||||||||
| Interest cost |
1,079 | 1,025 | 3,201 | 1,701 | 1,367 | |||||||||||||||||||||
| Amortization of prior service credit and recognized actuarial gain |
(823 | ) | — | (2,466 | ) | (1,395 | ) | — | ||||||||||||||||||
| Other |
40 | 21 | 120 | 35 | 28 | |||||||||||||||||||||
| Net periodic benefit cost |
$ | 738 | $ | 1,479 | $ | 2,162 | $ | 979 | $ | 1,972 | ||||||||||||||||
F-81
Table of Contents
NOTES TO CONDENSED CONSOLIDATED FINANCIAL STATEMENTS—(Continued)
(Unaudited)
(Dollar amounts in thousands except per share amounts)
9. Income Taxes
Under ASC Topic 270, “Interim Reporting,” the Company is required to determine its effective tax rate each quarter based upon its estimated annual effective tax rate. The Company is also required to record the tax impact of certain unusual or infrequently occurring items, including changes in judgment about valuation allowances and effects of changes in tax laws or rates, in the interim period in which they occur. In addition, jurisdictions with a projected loss for the year where no tax benefit can be recognized are excluded from the estimated annual effective tax rate.
The effective tax rate for the five month Predecessor period ended May 31, 2010 was 6%. The effective tax rate for the three and four month Successor periods ended September 30, 2010 was 18% and 17%, respectively. The effective tax rate for the three and nine month periods ended September 30, 2009 was 26% and 7%, respectively. The income tax rate for the five month Predecessor period ended May 31, 2010 and the three and four month Successor periods ended September 30, 2010 varies from statutory rates due to the impact of deferred taxes recorded on fresh-start and reorganization adjustments, income taxes on foreign earnings, the impact of valuation allowances in the U.S. and foreign jurisdictions, tax credits, income tax incentives, withholding taxes and other permanent items. Further, the Company’s current and future provision for income taxes will be significantly impacted by the recognition of valuation allowances in certain countries, particularly the United States. The Company intends to maintain these allowances until it is more likely than not that the deferred tax assets will be realized. Accordingly, income taxes are impacted by the U.S. valuation allowance and the mix of earnings among jurisdictions.
On June 23, 2009, a U.S. and Canadian bi-lateral Advanced Pricing Arrangement (“APA”) with the Company was completed and signed. The settlement of the bi-lateral APA resulted in income tax refunds to CSA Canada for the years 2000 through 2007 totaling approximately CAD $88,000. Under the terms of the Stock Purchase Agreement with Cooper Tire and Rubber Company dated September 16, 2004, Cooper Tire and Rubber Company had a claim against the Company for the amount of tax refunds received by CSA Canada relating to the years 2000 through 2004. On July 27, 2009, CSA Canada received approximately CAD $80,000, which represented the federal portion of the expected refunds plus interest.
The Company, CSA U.S. and CSA Canada (collectively, the “Defendants”) were named as defendants in an adversary proceeding (Case No. 09-52014 (PJW)) initiated by Cooper Tire & Rubber Company and Cooper Tire Rubber & Company UK Limited (together, “CTR”) in the Bankruptcy Court on August 19, 2009 (the “CTR Adversary Proceeding”). CTR’s complaint had sought a declaratory judgment that CTR was entitled to a portion of the CAD $80,000 tax refund received by CSA Canada from the Canadian government on July 27, 2009 and a portion of all future refunds received by CSA Canada, in each case relating to the period prior to the Company’s 2004 Acquisition. CTR also sought imposition of a resulting trust or, in the alternative, a constructive trust in favor of CTR and turnover of the portion of the Canadian income tax refunds attributable to the years 2000 through 2004. In connection with the CTR Adversary Proceedings, the Defendants, CTR and the Official Committee of Unsecured Creditors appointed in the Chapter 11 Cases entered into an Agreement Concerning Terms and Conditions of a Compromise and Settlement, dated March 17, 2010 (the “CTR Settlement Agreement”). Under the terms of the CTR Settlement Agreement, CTR agreed to, among other things, dismiss its complaint in the Bankruptcy Court with prejudice and claim no further entitlement to the tax refunds. The Defendants agreed to, among other things, (i) pay CTR approximately $17,600 in cash and (ii) to obtain a release of CTR’s obligations in connection with a guarantee of one of the Company’s leases or, alternatively, provide a letter of credit in favor of CTR in the initial amount of $7,000 (but declining by $1,000 per year for seven years) to reimburse CTR for any amounts that it is required to pay the Company’s landlord on account of such guarantee. The Defendants and CTR have also granted general mutual releases to each other with respect to
F-82
Table of Contents
NOTES TO CONDENSED CONSOLIDATED FINANCIAL STATEMENTS—(Continued)
(Unaudited)
(Dollar amounts in thousands except per share amounts)
claims and liabilities under the purchase agreement governing the Company’s 2004 acquisition and other claims and liabilities, subject to certain exceptions relating to certain continuing indemnification obligations. On April 15, 2010, the Bankruptcy Court issued an order approving the CTR Settlement Agreement. In May 2010, the Company received approximately CAD $33,000 of the remaining tax refund and related interest from Canada.
10. Comprehensive Income (Loss) and Equity (Deficit)
On an annual basis, disclosure of comprehensive income is incorporated into the statement of stockholders’ equity, which is not presented on a quarterly basis. The components of comprehensive income (loss), net of related tax, are as follows:
| Predecessor | Successor | |||||||||||||||||||||||||||||||||||||
| Three Months Ended September 30, 2009 |
Three Months Ended September 30, 2010 |
|||||||||||||||||||||||||||||||||||||
| Total | Cooper- Standard Holdings Inc. |
Non- controlling Interest |
Total | Cooper- Standard Holdings Inc. |
Non- controlling Interest |
|||||||||||||||||||||||||||||||||
| Net income (loss) (1) |
|
$ | 10,666 | $ | 10,847 | $ | (181 | ) | $ | 20,845 | $ | 20,833 | $ | 12 | ||||||||||||||||||||||||
| Currency translation adjustment |
|
23,029 | 23,037 | (8 | ) | 45,989 | 45,968 | 21 | ||||||||||||||||||||||||||||||
| Pension and other postretirement benefits, net of tax |
|
500 | 500 | — | — | — | — | |||||||||||||||||||||||||||||||
| Fair value change of derivatives, net of tax |
|
(58 | ) | (58 | ) | — | 151 | 151 | — | |||||||||||||||||||||||||||||
| Comprehensive income (loss): |
|
$ | 34,137 | $ | 34,326 | $ | (189 | ) | $ | 66,985 | $ | 66,952 | $ | 33 | ||||||||||||||||||||||||
| Predecessor | Successor | |||||||||||||||||||||||||||||||||||||
| Nine Months Ended September 30, 2009 |
Five Months Ended May 31, 2010 |
Four Months Ended September 30, 2010 |
||||||||||||||||||||||||||||||||||||
| Total | Cooper- Standard Holdings Inc. |
Non- controlling Interest |
Total | Cooper- Standard Holdings Inc. |
Non- controlling Interest |
Total | Cooper- Standard Holdings Inc. |
Non- controlling Interest |
||||||||||||||||||||||||||||||
| Net income (loss) (1) |
$ | (393,955 | ) | $ | (393,459 | ) | $ | (496 | ) | $ | 636,609 | $ | 636,287 | $ | 322 | $ | 25,785 | $ | 25,763 | $ | 22 | |||||||||||||||||
| Currency translation adjustment |
26,112 | 26,076 | 36 | (31,075 | ) | (31,092 | ) | 17 | 42,953 | 42,937 | 16 | |||||||||||||||||||||||||||
| Pension and other postretirement benefits, net of tax |
786 | 786 | — | 126 | 126 | — | — | — | — | |||||||||||||||||||||||||||||
| Fair value change of derivatives, net of tax |
4,867 | 4,867 | — | (81 | ) | (81 | ) | — | 206 | 206 | — | |||||||||||||||||||||||||||
| Comprehensive income (loss): |
$ | (362,190 | ) | $ | (361,730 | ) | $ | (460 | ) | $ | 605,579 | $ | 605,240 | $ | 339 | $ | 68,944 | $ | 68,906 | $ | 38 | |||||||||||||||||
F-83
Table of Contents
NOTES TO CONDENSED CONSOLIDATED FINANCIAL STATEMENTS—(Continued)
(Unaudited)
(Dollar amounts in thousands except per share amounts)
The following table summarizes the Company’s equity (deficit) activity for the nine months ended September 30, 2010:
| Cooper-Standard Holdings Inc. |
Noncontrolling Interest |
Total
Equity (Deficit) |
||||||||||
| Equity (deficit) at January 1, 2010 - Predecessor |
$ | (310,964 | ) | $ | 4,464 | $ | (306,500 | ) | ||||
| Net income |
636,287 | 322 | 636,609 | |||||||||
| Other comprehensive income (loss) |
(31,047 | ) | 17 | (31,030 | ) | |||||||
| Sale of non-controlling interest |
— | (1,844 | ) | (1,844 | ) | |||||||
| Stock-based compensation |
245 | — | 245 | |||||||||
| Reorganization and fresh start adjustments |
(294,521 | ) | (596 | ) | (295,117 | ) | ||||||
| Equity at May 31, 2010 - Predecessor |
$ | — | $ | 2,363 | $ | 2,363 | ||||||
| Issuance of 17,489,693 shares of common stock and 2,419,753 warrants in connection with emergence from bankruptcy |
473,292 | — | 473,292 | |||||||||
| Equity at June 1, 2010 - Successor |
$ | 473,292 | $ | 2,363 | $ | 475,655 | ||||||
| Net income (1) |
25,763 | 22 | 25,785 | |||||||||
| Preferred stock dividends |
(2,892 | ) | — | (2,892 | ) | |||||||
| Other comprehensive income |
43,143 | 16 | 43,159 | |||||||||
| Stock-based compensation |
3,066 | — | 3,066 | |||||||||
| Equity at September 30, 2010 - Successor |
$ | 542,372 | $ | 2,401 | $ | 544,773 | ||||||
| (1) | Net income attributable to redeemable noncontrolling shareholders interest recorded in other long-term liabilities amounted to $164 for the three and four months ended September 30, 2010. |
F-84
Table of Contents
NOTES TO CONDENSED CONSOLIDATED FINANCIAL STATEMENTS—(Continued)
(Unaudited)
(Dollar amounts in thousands except per share amounts)
11. Net Income Per Share Attributable to Cooper-Standard Holdings Inc.
Basic net income per share attributable to Cooper-Standard Holdings Inc. was computed using the two-class method by dividing net income attributable to Cooper-Standard Holdings Inc., after deducting dividends on the Company’s 7% preferred stock and undistributed earnings allocated to participating securities, by the average number of common shares outstanding during the period. The Company’s preferred shares outstanding are considered participating securities. A summary of information used to compute basic net income per share attributable to Cooper-Standard Holdings Inc. is shown below:
| Successor | Successor | |||||||
| Three Months Ended September 30, 2010 |
Four Months Ended September 30, 2010 |
|||||||
| Net Income attributable to Cooper-Standard Holdings Inc. |
$ | 20,833 | $ | 25,763 | ||||
| Less: Preferred stock dividends (paid or unpaid) |
(1,970 | ) | (2,892 | ) | ||||
| Less: Undistributed earnings allocated to participating securities |
(3,747 | ) | (4,543 | ) | ||||
| Net income available to Cooper-Standard Holdings Inc. common stockholders |
$ | 15,116 | $ | 18,328 | ||||
| Average shares of common stock outstanding |
17,489,693 | 17,489,693 | ||||||
| Basic net income per share attibutable to Cooper-Standard Holdings Inc. |
$ | 0.86 | $ | 1.05 | ||||
Diluted net income per share attributable to Cooper-Standard Holdings Inc. was computed using the treasury stock method dividing net income attributable to Cooper-Standard Holdings Inc. by the average number of shares of common stock outstanding, including the dilutive effect of common stock equivalents, using the average share price during the period. Diluted net income per share attributable to Cooper-Standard Holdings Inc. computed using the two-class method was anti-dilutive. A summary of information used to compute diluted net income per share attributable to Cooper-Standard Holdings Inc. is shown below:
| Successor | Successor | |||||||
| Three Months Ended September 30, 2010 |
Four Months Ended September 30, 2010 |
|||||||
| Net income available to Cooper-Standard Holdings Inc. common stockholders |
$ | 15,116 | $ | 18,328 | ||||
| Average common shares outstanding |
17,489,693 | 17,489,693 | ||||||
| Dilutive effect of: |
||||||||
| Common restricted stock |
263,527 | 251,820 | ||||||
| Preferred restricted stock |
66,537 | 64,397 | ||||||
| Warrants |
478,677 | 467,665 | ||||||
| Average dilutive shares of common stock outstanding |
18,298,434 | 18,273,575 | ||||||
| Diluted net income per share attibutable to Cooper-Standard Holdings Inc. |
$ | 0.83 | $ | 1.00 | ||||
F-85
Table of Contents
NOTES TO CONDENSED CONSOLIDATED FINANCIAL STATEMENTS—(Continued)
(Unaudited)
(Dollar amounts in thousands except per share amounts)
The effect of certain common stock equivalents, including convertible preferred stock and options were excluded from the computation of weighted average diluted shares outstanding for the three months ended September 30, 2010, and the four months ended September 30, 2010, respectively, as inclusion would have resulted in antidilution. A summary of these preferred shares (as if converted), and options are shown below:
| Successor | Successor | |||||||
| Three Months Ended September 30, 2010 |
Four Months Ended September 30, 2010 |
|||||||
| Number of Options |
838,952 | 838,952 | ||||||
| Exercise price |
$ | 25.52 | $ | 25.52 | ||||
| Preferred shares, as if converted |
4,335,188 | 4,335,188 | ||||||
| Preferred dividends and undistributed earnings allocated to participating securities that would be added back in the diluted calculation. |
$ | 5,717 | $ | 7,435 | ||||
12. Capital Stock
Common Stock
The Company is authorized to issue up to 190,000,000 shares of common stock, par value $0.001 per share. As of November 5, 2010, an aggregate of 18,376,112 shares of its common stock were issued and outstanding.
All shares of common stock vote as one class, except as otherwise provided by law. Each share of common stock carries one vote on the record date for the determination of the stockholders entitled to vote.
Each share of common stock is entitled to any dividends to be declared on a record date on or after the issue date of the common stock, except, however, that for so long as any shares of 7% preferred stock are outstanding, dividends may not be declared or paid on common stock (unless paid in common stock) unless the full cumulative preferred dividends on the 7% preferred stock have been paid and, in the case of a cash dividend, the Company shall have redeemed all shares of 7% preferred stock previously issued as a dividend paid in kind to holders of 7% preferred stock (“Additional Preferred Shares”) and subsequently tendered in an offer by the Company to purchase such Additional Preferred Shares.
Holders of common stock are not entitled to preemptive rights, and no redemption or sinking fund provisions are applicable to common stock. All outstanding shares of common stock are, and any shares of common stock to be issued upon the conversion of the 7% preferred stock or exercise of warrants will be, fully paid and non-assessable.
In the event of liquidation, dissolution or winding up, holders of common stock are entitled to share ratably in proportion to their shareholding in the Company assets, if any, remaining after the payment of all the Company’s debts and liabilities, subject to any liquidation preference on any outstanding preference shares.
Warrants
An aggregate of 2,419,753 warrants have been issued and 2,419,753 shares of common stock are issuable upon exercise of the warrants. The warrants are exercisable into shares of common stock at an exercise price of $27.33 per share (subject to adjustment in accordance with anti-dilution protections) or on a cashless basis whereby for each warrant exercised its holder will receive a number of shares of common stock equal to (i) the “closing sale
F-86
Table of Contents
NOTES TO CONDENSED CONSOLIDATED FINANCIAL STATEMENTS—(Continued)
(Unaudited)
(Dollar amounts in thousands except per share amounts)
price” (as defined in the Warrant Agreement that the Company entered into with Computershare Inc. and Computershare Trust Company, N.A. on May 28, 2010) minus the exercise price (in each case as of the exercise date), divided by (ii) such “closing sale price.” The warrants may be exercised at any time during the period beginning on the Effective Date and ending at the close of business on the 90-month anniversary of the Effective Date, or November 2017.
The warrants are subject to certain anti-dilution protection, including in the case of, among others, stock splits, stock dividends and distributions, tender or exchange offers, rights plans and certain issuances of common stock or derivatives. Warrant holders do not have the rights or privileges of holders of common stock, including voting rights, until they exercise their warrants and receive shares of common stock. After the issuance of shares of common stock upon exercise of the warrants, each holder will be entitled to one vote for each share held of record on all matters to be voted on by stockholders.
No fractional shares will be issued upon exercise of warrants. If a holder exercises warrants and would be entitled to receive a fractional interest of a share, the Company will pay cash valued at the closing sale price of the common stock on the exercise date.
Preferred Stock
The Company is authorized to issue up to 10,000,000 shares of preferred stock, par value $0.001 per share. The Company has designated 2,000,000 shares of its authorized preferred stock as 7% cumulative participating convertible preferred stock, par value $0.001 per share, of which 1,052,444 are issued and outstanding as of November 5, 2010. The 7% preferred stock ranks senior to the common stock and all other classes or series of its capital stock, except for any other class or series, the terms of which expressly provide that it ranks on a parity with the 7% preferred stock. In the event of its liquidation, winding-up or dissolution, holders of 7% preferred stock are entitled to priority in payments from the Company in an amount equal to the greater of (x) the stated value of the 7% preferred stock plus accrued and unpaid cumulative preferred dividends and (y) the conversion value of the 7% preferred stock.
Holders of 7% preferred stock are entitled to receive, when, as and if declared by the Company’s board of directors, out of funds legally available for the payment of dividends, cumulative preferred dividends on a quarterly basis at the rate of 7% per year. Dividends may be paid in cash or “in-kind” with additional shares of 7% preferred stock at the option of the Company. In addition, shares of 7% preferred stock are entitled to receive dividends to the same extent and on the same basis as dividends with respect to the common stock determined, when, as and if declared by its board of directors, out of funds legally available for the payment of dividends, in accordance with the number of shares of common stock issuable upon conversion of the 7% preferred stock at the time such dividend is declared. For so long as any shares of 7% preferred stock are outstanding, dividends may not be declared or paid on the common stock (unless paid in common stock) and the Company may not acquire any common stock unless the full cumulative preferred dividends have been paid and, in the case of a cash dividend on or cash acquisition of the common stock, unless the Company has redeemed all shares of 7% preferred stock tendered in an offer to purchase such shares.
Shares of 7% preferred stock are convertible at any time into shares of common stock at the option of the holders. The initial and current conversion price of the 7% preferred stock is $23.30574 per share of common stock, subject to certain adjustments, including, among others, stock splits and reclassifications, stock dividends and distributions, tender or exchange offers, reorganization events, rights plans and certain issuances of common stock or derivatives. The number of shares of common stock delivered upon conversion is equal to the number obtained by dividing (i) the sum of the stated value and all accrued and unpaid cumulative dividends by (ii) the conversion price.
F-87
Table of Contents
NOTES TO CONDENSED CONSOLIDATED FINANCIAL STATEMENTS—(Continued)
(Unaudited)
(Dollar amounts in thousands except per share amounts)
The Company may convert the 7% preferred stock at its option, for the number of shares of common stock as provided in the preceding paragraph, at any time after the third anniversary of the Effective Date if (i) the closing sale price of the common stock exceeded 155% of the conversion price of the 7% preferred stock for each of 30 consecutive trading days within the 45-day period prior to the notification by the Company to the holders of the 7% preferred stock of its exercise of the conversion right, (ii) its common stock has been listed on the New York Stock Exchange (the “NYSE”) or the NASDAQ Global Select Market or the NASDAQ Global Market (collectively “NASDAQ”) and has been registered pursuant to section 12 of the Exchange Act, and (iii) a registration statement covering resales of the common stock issuable upon conversion of the 7% preferred stock has been declared effective prior to the date of notice and will remain available for resales for at least 60 days after the conversion date, subject to certain exceptions.
The Company may cause the conversion of all shares of 7% preferred stock into shares of common stock immediately prior to the consummation of an underwritten initial public offering of the common stock if (i) the holders of two-thirds of the then outstanding shares of 7% preferred stock approve the conversion and (ii) the common stock has been listed on the NYSE or NASDAQ and has been registered pursuant to section 12 of the Exchange Act.
On or within 30 days after receipt of a notice from the Company of certain events that constitute a change of control or involve a “cash transaction” (as defined below), the holders of 7% preferred stock may require the Company to redeem all or a portion of their 7% preferred stock at the greater of the stated value of the 7% preferred stock plus accrued and unpaid cumulative preferred dividends or the value of the shares of the common stock into which such shares of 7% preferred stock are then convertible. If a “cash transaction” occurs prior to the fifth anniversary of our emergence from bankruptcy, holders of 7% preferred stock will be entitled to receive cash equal to the greater of (i), in the case of a “cash transaction” that occurs prior to the first anniversary of our emergence from bankruptcy, the stated value of the 7% preferred stock plus accrued and unpaid cumulative preferred dividends both multiplied by 1.175, after the first anniversary and prior to the fifth anniversary of our emergence from bankruptcy, the stated value of the 7% preferred stock plus accrued and unpaid cumulative preferred dividends both multiplied by 1.125 and, thereafter, the stated value of the 7% preferred stock plus accrued and unpaid cumulative preferred dividends and (ii) the conversion value of the 7% preferred stock as of such date. “Cash transaction” means a merger, consolidation, share exchange or other similar transaction or a sale, lease or other transfer in one transaction or a series of related transactions of all or substantially all of its consolidated assets in which all of the common stock is converted into the right to receive cash.
From and after the sixth anniversary of the Effective Date, the Company may, at its option, redeem shares of 7% preferred stock at any time, in whole or in part, for cash at the greater of (x) the stated value of the 7% preferred stock plus accrued and unpaid cumulative dividends (which value will be multiplied by 1.125 if the redemption occurs prior to the seventh anniversary of its emergence from bankruptcy) and (y) 75% of the conversion value of the 7% preferred stock as of the second trading day prior to the redemption date. If 75% of the conversion value of the 7% preferred stock is greater than the amount in (x) above, the Company may redeem the shares of 7% preferred stock in part for cash equal to the redemption value of the 7% preferred stock and in part for shares of common stock valued as of the second trading day prior to the redemption date equal to the difference between the redemption value of the 7% preferred stock and 75% of the conversion value of the 7% preferred stock. In order for the Company to elect to exercise this redemption right, a registration statement covering resales of the common stock issuable upon redemption of the 7% preferred stock must have been declared effective prior to the date of notice and must remain available for resales for at least 60 days after the redemption date, subject to certain exceptions. In addition, in order for the Company to exercise this redemption right, all cumulative preferred dividends and all participating dividends must have been paid for all past dividend periods.
F-88
Table of Contents
NOTES TO CONDENSED CONSOLIDATED FINANCIAL STATEMENTS—(Continued)
(Unaudited)
(Dollar amounts in thousands except per share amounts)
Each share of 7% preferred stock carries one vote for each share of common stock into which such share of 7% preferred stock may be converted on the record date for the determination of the stockholders entitled to vote and will be entitled to vote on any matter upon which shares of the common stock are entitled to vote, voting together with the common stock and not as a separate class. In addition, the holders of two-thirds of the outstanding 7% preferred stock are required to approve certain actions, including:
| • | changes to the Company’s certificate of incorporation or the certificate of designations of the 7% preferred stock that are adverse to the rights of the 7% preferred stock; |
| • | changes of the 7% preferred stock (whether by merger, consolidation, reclassification or otherwise) into cash, securities or other property (except in accordance with the certificate of designations) or, in the case of a merger or consolidation involving the Company in which it is not the surviving entity, the 7% preferred stock may be exchanged for an equivalent number of shares of preferred stock of the surviving or resulting entity with substantially the same terms as the 7% preferred stock; |
| • | any issuance of shares of 7% preferred stock (other than the shares of 7% preferred stock issued at the Effective Date and additional shares issued as “in-kind” dividends); provided, however, that any issuance of shares of 7% preferred stock that are not offered to the existing holders of 7% preferred stock on a pro rata basis relative to their holdings on the same terms as offered to other participants in the issuance shall require the approval of each holder of 7% preferred stock; |
| • | the creation, authorization, issuance or increase in the amount of any equity security that ranks equally with or senior to the 7% preferred stock with respect to dividend rights, rights of redemption or rights of liquidation, dissolution or winding-up including the Company; and |
| • | the conversion of the shares of 7% preferred stock into shares of common stock immediately prior to the consummation of its initial underwritten public offering. |
The following table summarizes the Company’s 7% preferred stock activity for the four months ended September 30, 2010:
| Successor | ||||
| 7% Preferred Stock |
||||
| Preferred Stock at June 1, 2010 |
$ | 128,000 | ||
| Stock-based compensation |
520 | |||
| Preferred stock dividends |
1,419 | |||
| Preferred Stock at September 30, 2010 - Successor |
$ | 129,939 | ||
On July 19, 2010, the Company paid a dividend to holders of its outstanding 7% preferred stock in the form of 10,780 additional shares of 7% preferred stock.
13. Stock-Based Compensation
The Company measures stock-based compensation expense at fair value in accordance with the provisions of GAAP and recognizes such expense over the vesting period of the stock-based employee awards.
Predecessor
Prior to the Effective Date, the Company established the 2004 Cooper-Standard Holdings Inc. Stock Incentive Plan (“Stock Incentive Plan”), which permitted the granting of nonqualified and incentive stock options, stock appreciation rights, restricted stock and other stock-based awards to employees and directors. On the Effective
F-89
Table of Contents
NOTES TO CONDENSED CONSOLIDATED FINANCIAL STATEMENTS—(Continued)
(Unaudited)
(Dollar amounts in thousands except per share amounts)
Date, outstanding awards under the Stock Incentive Plan were cancelled in accordance with the terms of the Plan of Reorganization. Total compensation expense recognized under these plans amounted to $245 for the five months ended May 31, 2010.
Successor
On the Effective Date, the Company adopted the 2010 Cooper-Standard Holdings Inc. Management Incentive Plan (the “Management Incentive Plan”) that was filed with the Bankruptcy Court on May 5, 2010 as part of the supplement to the Plan of Reorganization. The total number of shares authorized to be issued under the Management Incentive Plan as the Initial Grant Awards are as follows: (1) 4% of the common stock (or 757,896 shares of common stock, plus, subject to realized dilution on the warrants, an additional 104,075 shares of common stock) to be granted as restricted stock; (2) 4% of the 7% preferred stock (initially convertible into 178,771 shares of common stock) to be granted as restricted 7% preferred stock; and (3) 3% of the equity (or 702,509 shares of common stock, plus, subject to realized dilution on the warrants, an additional 78,057 shares of common stock) to be granted as stock options. On the day after the Effective Date, the Company issued to certain of its directors and Oak Hill Advisors L.P. or its affiliates, 26,448 shares of common stock as restricted stock and 58,386 options to purchase shares of common stock. The Company also reserved 780,566 shares of common stock for future issuance to the Company’s management.
The total number of shares which may be issued under the Management Incentive Plan as the Future Grant Awards, to be issued incrementally, are 3% of the equity (or 702,509 shares of common stock, plus, subject to realized dilution on the warrants, 78,057 shares of common stock). The issuance of shares or the payment of cash upon the exercise of an award or in consideration of the cancellation or termination of an award will reduce the total number of shares available under the Management Incentive Plan, as applicable. Shares which are subject to awards which terminate or lapse without the payment of consideration may be granted again under the Management Incentive Plan.
The compensation expense related to stock options and restricted stock granted to key employees and directors of the Company in connection with the Company’s emergence from bankruptcy, which is qualified below, does not represent payments actually made to these employees. Rather, the amounts represent the non-cash compensation expense recognized by the Company in connection with these awards for financial reporting purposes. The actual value of these awards to the recipients will depend on the trading price of the Company’s stock when the awards vest.
Stock Options. On the Effective Date, 780,566 options to purchase common stock were issued, and on the day after the Effective Date, 58,386 options were granted, all with an exercise price of $25.52. The weighted average fair value of these options is $11.42 as of September 30, 2010. All options were outstanding as of September 30, 2010, and no options were cancelled, forfeited, exercised or vested. Stock option awards are granted at the fair market value of the Company’s stock price at the date of the grant and have a 10 year term. The stock option grants vest over three or four years from the date of grant. Total compensation expense recognized for stock options amounted to $562 and $835 for the three and four months ended September 30, 2010, respectively. As of September 30, 2010, unrecognized compensation expense for stock options amounted to $8,639.
F-90
Table of Contents
NOTES TO CONDENSED CONSOLIDATED FINANCIAL STATEMENTS—(Continued)
(Unaudited)
(Dollar amounts in thousands except per share amounts)
The Company uses expected volatility of similar entities to develop the expected volatility. The expected option life was calculated using the simplified method. The risk free rate is based on the U.S. Treasury zero-coupon issues with a term equal to the expected option life on the date the stock options were granted. Fair value of the shares that are accounted for under ASC Topic 718 was estimated at the date of the grant using the Black-Scholes option pricing model and the following weighted average assumptions:
| 2010 | ||||
| Expected volatility |
40.00 | % | ||
| Dividend yield |
0.00 | % | ||
| Expected option life – years |
6.25 | |||
| Risk-free rate |
3.40 | % | ||
Restricted Common Shares. On the Effective Date, 861,971 restricted shares of common stock were granted, and on the day after the Effective Date, 26,448 restricted shares were granted. All restricted shares of common stock were outstanding as of September 30, 2010 and no restricted shares of common stock were cancelled, forfeited or vested. The fair value of the restricted shares of common stock is determined based on the closing sales price of the common stock on the date of grant. The weighted average grant date fair value of these shares is $25.52. The restricted shares of common stock vest over three and four years. Total compensation expense recognized for restricted shares of common stock amounted to $1,763 and $2,232 for the three and four months ended September 30, 2010, respectively. As of September 30, 2010, unrecognized compensation expense for restricted shares of common stock amounted to $20,328.
Restricted Preferred Stock. On the Effective Date, 41,664 restricted preferred stock shares were granted, and they vest over three or four years from the date of grant. On July 19, 2010, the Company paid a stock dividend of 435 restricted preferred shares. The fair value of the restricted preferred stock is determined based on the fair market value of the 7% preferred stock on the date of grant. As of September 30, 2010, there were 42,099 restricted preferred stock shares outstanding, which are convertible into 180,637 shares of common stock. The weighted average grant date fair value of these shares is $127.77. No restricted preferred stock shares were cancelled, forfeited or converted during the three months ended September 30, 2010. Total compensation expense recognized for restricted preferred stock totaled $418 and $520 for the three and four months ended September 30, 2010, respectively. As of September 30, 2010, unrecognized compensation expense for restricted preferred stock amounted to $4,804.
F-91
Table of Contents
NOTES TO CONDENSED CONSOLIDATED FINANCIAL STATEMENTS—(Continued)
(Unaudited)
(Dollar amounts in thousands except per share amounts)
14. Other Income (Expense)
The components of other income (expense) are as follows:
| Predecessor | Successor | |||||||||||||
| Three Months Ended September 30, 2009 |
Three Months Ended September 30, 2010 |
|||||||||||||
| Foreign currency gains |
$ | 6,290 | $ | 5,380 | ||||||||||
| Interest rate swaps |
(323 | ) | — | |||||||||||
| Loss on sale of receivables |
(37 | ) | (239 | ) | ||||||||||
| Miscellaneous income |
— | 313 | ||||||||||||
| Other income |
$ | 5,930 | $ | 5,454 | ||||||||||
| Predecessor | Successor | |||||||||||||
| Nine Months Ended September 30, 2009 |
Five Months Ended May 31, 2010 |
Four Months Ended September 30, 2010 |
||||||||||||
| Foreign currency gains (losses) |
$ | 7,838 | $ | (20,779 | ) | $ | 5,031 | |||||||
| Gain on debt repurchase |
9,096 | — | — | |||||||||||
| Interest rate swaps |
(2,414 | ) | — | — | ||||||||||
| Loss on sale of receivables |
(841 | ) | (377 | ) | (320 | ) | ||||||||
| Miscellaneous income |
— | — | 313 | |||||||||||
| Other income (expense) |
$ | 13,679 | $ | (21,156 | ) | $ | 5,024 | |||||||
15. Related Party Transactions
Sales to NISCO, a 50% owned joint venture, totaled $7,129 and $6,590 for the three months ended September 30, 2010 and 2009, respectively. Sales to NISCO totaled $12,273 and $9,530 for the five months ended May, 31, 2010 and four months ended September 30, 2010, respectively. Sales to NISCO totaled $15,297 for the nine months ended September 30, 2009.
Purchases of material from Guyoung Technology Co. Ltd, a Korean corporation of which the Company owns approximately 20% of the common stock, totaled $1,394 and $1,852 for the three months ended September 30, 2010 and 2009, respectively. Purchases of material from Guyoung Technology Co. Ltd totaled $4,052 and $2,291 for the five months ended May 31, 2010 and four months ended September 30, 2010, respectively. Purchases of material from Guyoung Technology Co. Ltd totaled $2,489 for the nine months ended September 30, 2009.
F-92
Table of Contents
NOTES TO CONDENSED CONSOLIDATED FINANCIAL STATEMENTS—(Continued)
(Unaudited)
(Dollar amounts in thousands except per share amounts)
16. Business Segments
The Company has two reportable segments, North America and International (comprising all of the Company’s operations outside of North America). The Company evaluates segment performance based on segment profit before tax. The following table details information on the Company’s business segments:
| Predecessor | Successor | |||||||||||||
| Three Months Ended September 30, 2009 |
Three Months Ended September 30, 2010 |
|||||||||||||
| Sales to external customers |
||||||||||||||
| North America |
$ | 251,700 | $ | 316,585 | ||||||||||
| International |
266,142 | 269,065 | ||||||||||||
| Consolidated |
$ | 517,842 | $ | 585,650 | ||||||||||
| Intersegment sales |
||||||||||||||
| North America |
$ | 1,598 | $ | 1,156 | ||||||||||
| International |
1,441 | 2,064 | ||||||||||||
| Eliminations and other |
(3,039 | ) | (3,220 | ) | ||||||||||
| Consolidated |
$ | — | $ | — | ||||||||||
| Segment profit (loss) |
||||||||||||||
| North America |
$ | 20,036 | $ | 29,122 | ||||||||||
| International |
(5,597 | ) | (3,670 | ) | ||||||||||
| Income before income taxes |
$ | 14,439 | $ | 25,452 | ||||||||||
| Predecessor | Successor | |||||||||||||
| Nine Months Ended September 30, 2009 |
Five Months Ended May 31, 2010 |
Four Months Ended September 30, 2010 |
||||||||||||
| Sales to external customers |
||||||||||||||
| North America |
$ | 632,234 | $ | 508,738 | $ | 432,981 | ||||||||
| International |
735,422 | 500,390 | 368,311 | |||||||||||
| Consolidated |
$ | 1,367,656 | $ | 1,009,128 | $ | 801,292 | ||||||||
| Intersegment sales |
||||||||||||||
| North America |
$ | 3,325 | $ | 1,757 | $ | 1,665 | ||||||||
| International |
4,101 | 3,206 | 2,560 | |||||||||||
| Eliminations and other |
(7,426 | ) | (4,963 | ) | (4,225 | ) | ||||||||
| Consolidated |
$ | — | $ | — | $ | — | ||||||||
| Segment profit (loss) |
||||||||||||||
| North America |
$ | (259,702 | ) | $ | 590,121 | $ | 37,255 | |||||||
| International |
(165,592 | ) | 86,428 | (5,954 | ) | |||||||||
| Income (loss) before income taxes |
$ | (425,294 | ) | $ | 676,549 | $ | 31,301 | |||||||
F-93
Table of Contents
NOTES TO CONDENSED CONSOLIDATED FINANCIAL STATEMENTS—(Continued)
(Unaudited)
(Dollar amounts in thousands except per share amounts)
| Predecessor | Successor | |||||||||
| December 31, 2009 |
September 30, 2010 |
|||||||||
| Segment assets |
||||||||||
| North America |
$ | 694,442 | $ | 789,218 | ||||||
| International |
877,971 | 891,888 | ||||||||
| Eliminations and other |
164,994 | 181,352 | ||||||||
| Consolidated |
$ | 1,737,407 | $ | 1,862,458 | ||||||
Restructuring costs included in segment profit for North America totaled $197 and $87 for the three months ended September 30, 2010 and 2009, respectively. International restructuring costs totaled $621and $4,370 for the three months ended September 30, 2010 and 2009, respectively. Eliminations and other totaled $0 and $(79) for the three months ended September 30, 2010 and 2009, respectively.
Restructuring costs included in segment profit for North America totaled $851 and $340 for the five months ended May 31, 2010 and four months ended September 30, 2010, respectively and $9,608 for the nine months ended September 30, 2009. International restructuring costs totaled $5,042 and $860 for the five months ended May 31, 2010 and four months ended September 30, 2010, respectively and $21,279 for the nine months ended September 30, 2009. Eliminations and other totaled $0 for the five months ended May 31, 2010 and four months ended September 30, 2010 and $1,984 for the nine months ended September 30, 2009.
17. Financial Instruments
Fair values of the Predecessor’s prepetition senior notes and prepetition senior subordinated notes approximated $256,106 at December 31, 2009, based on quoted market prices, compared to the recorded values totaling $505,300. Fair values of the Predecessor’s term loans approximated $512,828 at December 31, 2009, based on quoted market prices, compared to the recorded values totaling $520,637. As a result of the adoption of fresh-start accounting, all remaining amounts recorded related to the Predecessor’s prepetition senior notes, prepetition senior subordinated notes, and term loans were eliminated. See Note 3, “Fresh-Start Accounting.”
Fair values of the Debtors’ DIP financing approximated $177,188 at December 31, 2009, based on quoted market prices, compared to the recorded value totaling $175,000. Upon the Company’s emergence from bankruptcy, the DIP financing was repaid.
Fair values of the Senior Notes approximated $465,750 at September 30, 2010, based on quoted market prices, compared to the recorded value of $450,000.
The Company uses derivative financial instruments, including forwards and swap contracts to manage its exposures to fluctuations in foreign exchange, interest rates and commodity prices. For a fair value hedge, both the effective and ineffective, if significant, portions are recorded in earnings and reflected in the consolidated statement of operations. For a cash flow hedge, the effective portion of the change in the fair value of the derivative is recorded in accumulated other comprehensive income (loss) in the consolidated balance sheet. The ineffective portion, if significant, is recorded in other income or expense. When the underlying hedged transaction is realized or the hedged transaction is no longer probable, the gain or loss included in accumulated other comprehensive income (loss) is recorded in earnings and reflected in the consolidated statement of operations on the same line as the gain or loss on the hedged item attributable to the hedged risk.
F-94
Table of Contents
NOTES TO CONDENSED CONSOLIDATED FINANCIAL STATEMENTS—(Continued)
(Unaudited)
(Dollar amounts in thousands except per share amounts)
The Company formally documents its hedge relationships, including the identification of the hedging instruments and the hedged items, as well as its risk management objectives and strategies for undertaking the cash flow hedges. The Company also formally assesses whether a cash flow hedge is highly effective in offsetting changes in the cash flows of the hedged item. Derivatives are recorded at fair value in other current assets, accrued liabilities and other long-term liabilities.
Derivative Instruments and Hedging Activities
The Predecessor’s failure to make the scheduled interest payments on its prepetition senior notes and prepetition senior subordinated notes and the expiration of the applicable 30-day period on July 16, 2009 constituted a “cross-default” under the Company’s ISDA Agreements in the names of CSA U.S., CSA Canada and Cooper-Standard Automotive International Holdings B.V., with its various senior lenders as counterparties. As a result, the counterparties to certain outstanding derivative contracts under these ISDA Agreements elected to exercise their option of early termination under such contracts. Certain interest rate, foreign exchange and commodity swap derivatives that were designated under ASC 815 as cash flow hedges were terminated for the purposes of ASC 815 as a result of the failure to make the interest payment and in anticipation of the termination events. The values of these terminated derivatives, totaling $18,081, were classified as liabilities subject to compromise and were repaid upon emergence from bankruptcy.
Cash Flow Hedges
Forward foreign exchange contracts – The Company enters into forward contracts to hedge currency risk of the U.S. Dollar against the Mexican Peso, Canadian Dollar and the Euro against the Czech Koruna, Polish Zloty and U.S. Dollar. The forward contracts are used to mitigate the potential volatility to earnings and cash flow arising from changes in currency exchange rates that impact the Company’s foreign currency transactions. The gain or loss on the forward contracts is reported as a component of other comprehensive income (loss) (“OCI”) and reclassified into earnings in the same period or periods during which the hedged transaction affects earnings. The amounts reclassified from accumulated other comprehensive income (loss) (“AOCI”) into cost of products sold were $52 and $79 for the three months ended September 30, 2010 and 2009, respectively. Amounts reclassified from AOCI into cost of products sold were $126 and $96 for the five months ended May 31, 2010, and four months ended September 30, 2010, respectively. Amounts reclassified from AOCI into cost of products sold were $(141) for the nine months ended September 30, 2009.
A summary of the outstanding contracts and the respective notional amounts is below:
| Notional Amount | Notional Amount (local currency) |
|||||||||||
| Mexican peso |
USD | 4,950 | 63,372 | |||||||||
| United States Dollar |
CAD | 4,959 | 4,800 | |||||||||
| Czech Koruna |
EUR | 1,133 | 28,000 | |||||||||
| Polish Zloty |
EUR | 1,063 | 4,250 | |||||||||
| United States Dollar |
EUR | 1,597 | 2,075 | |||||||||
F-95
Table of Contents
NOTES TO CONDENSED CONSOLIDATED FINANCIAL STATEMENTS—(Continued)
(Unaudited)
(Dollar amounts in thousands except per share amounts)
At September 30, 2010, the fair value before taxes of the Company’s forward exchange contracts and the accounts in the condensed consolidated balance sheet in which the fair value amounts are included are shown below:
| September 30, 2010 | ||||
| Asset/(liability) | ||||
| Other current assets |
$ | 80 | ||
| Accrued liabilities |
(12 | ) | ||
| $ | 68 | |||
Interest rate swaps – The Company has an interest rate swap contract to manage cash flow fluctuations of variable rate debt due to changes in market interest rates. This contract, which fixes the interest payment of a certain variable rate debt instrument, is accounted for as a cash flow hedge. As of September 30, 2010, the USD notional amount of this contract was $6,789. At September 30, 2010, the fair value before taxes of the Company’s interest rate swap contract was $363 and is recorded in accrued liabilities and other long-term liabilities in the Company’s consolidated balance sheet with the offset reflected in AOCI, net of deferred taxes. The amounts reclassified from AOCI into interest expense for this swap was $61 for the three months ended September 30, 2010 and 2009. The amounts reclassified from AOCI into interest expense for this swap were $102 and $81 for the five months ended May 31, 2010 and four months ended September 30, 2010, respectively. The amounts reclassified from AOCI into interest expense for this swap were $70 for the nine months ended September 30, 2009. The amount to be reclassified in the next twelve months is expected to be approximately $201. The maturity date of this interest rate swap contract is September 2013.
As a result of the adoption of fresh-start accounting, all remaining amounts recorded in accumulated other comprehensive income (loss) related to forward foreign exchange contracts and interest rate swaps were eliminated. See Note 3, “Fresh-Start Accounting”.
Fair Value Measurements
ASC 820 clarifies that fair value is an exit price, representing the amount that would be received to sell an asset or paid to transfer a liability in an orderly transaction between market participants. As such, fair value is a market-based measurement that should be determined based upon assumptions that market participants would use in pricing an asset or liability. As a basis for considering such assumptions, ASC 820 establishes a three-tier fair value hierarchy, which prioritizes the inputs used in measuring fair value as follows:
Level 1: Observable inputs, such as quoted prices in active markets;
Level 2: Inputs, other than quoted prices in active markets, that are observable either directly or indirectly; and
Level 3: Unobservable inputs in which there is little or no market data, which require the reporting entity to develop its own assumptions.
F-96
Table of Contents
NOTES TO CONDENSED CONSOLIDATED FINANCIAL STATEMENTS—(Continued)
(Unaudited)
(Dollar amounts in thousands except per share amounts)
Estimates of the fair value of foreign currency and commodity derivative instruments are determined using exchange traded prices and rates. The Company also considers the risk of non-performance in the estimation of fair value and includes an adjustment for non-performance risk in the measure of fair value of derivative instruments. In certain instances where market data is not available, the Company uses management judgment to develop assumptions that are used to determine fair value. Fair value measurements and the fair value hierarchy level for the Company’s liabilities measured or disclosed at fair value on a recurring basis as of September 30, 2010, are shown below:
| Contract |
Asset (Liability) |
Level 1 | Level 2 | Level 3 | ||||||||||||
| Interest rate swap |
$ | (363 | ) | $ | — | $ | — | $ | (363 | ) | ||||||
| Forward foreign exchange contract |
68 | — | — | 68 | ||||||||||||
| Total |
$ | (295 | ) | $ | — | $ | — | $ | (295 | ) | ||||||
A reconciliation of changes in assets and liabilities related to derivative instruments measured at fair value using the market and income approach adjusted for our and our counterparty’s credit risks for the nine months ended September 30, 2010, is shown below:
| Beginning Balance as of January 1, 2010 - Predecessor |
$ | 406 | ||
| Total (gains) or losses (realized or unrealized) included in earnings (or changes in net liabilities) |
228 | |||
| Included in other comprehensive income |
87 | |||
| Purchases, issuances and settlements |
(228 | ) | ||
| Balance as of May 31, 2010 |
$ | 493 | ||
| Total (gains) or losses (realized or unrealized) included in earnings (or changes in net liabilities) |
177 | |||
| Included in other comprehensive income |
(198 | ) | ||
| Purchases, issuances and settlements |
(177 | ) | ||
| Ending Balance as of September 30, 2010 - Successor |
$ | 295 | ||
| The amount of total (gains) or losses for the period included in earnings (or changes in net liabilities) attributable to the change in unrealized (gains) or losses relating to assets still held at the reporting date |
$ | — | ||
(Gains) and losses (realized and unrealized) included in earnings (or changes in net liabilities) for the period (above) are reported in cost of products sold and other income (expense):
| Predecessor | Successor | |||||||
| Five Months Ended May 31, 2010 |
Four Months Ended September 30, 2010 |
|||||||
| Total (gains) or losses included in earnings (or changes in net liabilities) for the period (above) |
$ | 228 | $ | 177 | ||||
| Change in unrealized (gains) or losses relating to assets still held at the reporting date |
— | — | ||||||
F-97
Table of Contents
NOTES TO CONDENSED CONSOLIDATED FINANCIAL STATEMENTS—(Continued)
(Unaudited)
(Dollar amounts in thousands except per share amounts)
Items measured at fair value on a non-recurring basis
In addition to items that are measured at fair value on a recurring basis, the Company measures certain assets and liabilities at fair value on a non-recurring basis, which are not included in the table above. As these non-recurring fair value measurements are generally determined using unobservable inputs, these fair value measurements are classified within Level 3 of the fair value hierarchy. For further information on assets and liabilities measured at fair value on a non-recurring basis, see Note 3, “Fresh-Start Accounting,” and Note 5, “Restructuring.”
18. Accounts Receivable Factoring
As a part of its working capital management, the Company sells certain receivables through third party financial institutions without recourse. The amount sold varies each month based on the amount of underlying receivables and cash flow needs of the Company. At September 30, 2010 and 2009, the Company had $39,040 and $33,428, respectively, of receivables outstanding under receivable transfer agreements entered into by various locations. For the four months ended September 30, 2010 and five months ended May 31, 2010, total accounts receivables factored was $31,510 and $40,592, respectively. The Company incurred a loss on the sale of receivables of $239 and $23 for the three months ended September 30, 2010 and 2009, respectively. Losses incurred on the sale of receivables were $377 and $320 for the five months ended May 31, 2010 and four months ended September 30, 2010, respectively and $573 for the nine months ended September 30, 2009; these amounts are recorded in other income (expense) in the consolidated statements of operations. The Company continues to service the receivables for one of the locations. These are permitted transactions under the Company’s credit agreement. The Company is also pursuing similar arrangements in various locations.
19. Subsequent Events
In preparing these financial statements, the Company has evaluated events and transactions for potential recognition or disclosure through the date the financial statements were issued.
F-98
Table of Contents
Cooper-Standard Holdings Inc.
17,210,676 Shares of Common Stock
1,010,345 Shares of 7% Cumulative Participating Convertible Preferred Stock
Warrants to Purchase 1,693,827 Shares of Common Stock
Prospectus
Table of Contents
PART II
INFORMATION NOT REQUIRED IN PROSPECTUS
| Item 13. | Other Expenses of Issuance and Distribution |
The following table sets forth the costs and expenses, if any, payable by us relating to the sale of securities being registered. The selling security holders are responsible for any expenses incurred by them for brokerage, accounting, tax, or legal or other services incurred by the selling security holders in disposing of the securities. All amounts are estimates except the SEC registration fee.
| SEC registration fee |
$ | 35,335 | ||
| Legal fees and expenses |
250,000 | |||
| Accounting fees and expenses |
200,000 | |||
| Printing fees and expenses |
90,000 | |||
| Total |
$ | 575,335 | ||
| Item 14. | Indemnification of Directors and Officers |
Section 145 of the Delaware General Corporation Law, or the DGCL, permits a Delaware corporation to indemnify its officers, directors and other corporate agents to the extent and under the circumstances set forth therein. Our certificate of incorporation and bylaws provide that we will indemnify any person who was or is a party or is threatened to be made a party to any threatened, pending or completed action, suit or proceeding whether civil, criminal, administrative or investigative, by reason of the fact that he is or was our director or officer, or is or was serving at our request as a director, officer, employee or agent of another corporation, partnership, joint venture, trust or other enterprise, in accordance with provisions corresponding to Section 145 of the Delaware General Corporation Law. These indemnification provisions may be sufficiently broad to permit indemnification of the registrant’s executive officers and directors for liabilities, including reimbursement of expenses incurred, arising under the Securities Act.
Pursuant to Section 102(b)(7) of the Delaware General Corporation Law, our certificate of incorporation eliminates the personal liability of a director to us or our stockholders for monetary damages for a breach of fiduciary duty as a director, except for liabilities arising:
| • | from any breach of the director’s duty of loyalty to us or our stockholders; |
| • | from acts or omissions not in good faith or which involve intentional misconduct or a knowing violation of law; |
| • | under Section 174 of the Delaware General Corporation Law; and |
| • | from any transaction from which the director derived an improper personal benefit. |
The above discussion of Section 145 of the Delaware General Corporation Law and of our certificate of incorporation and bylaws is not intended to be exhaustive and is respectively qualified in its entirety by Section 145 of the Delaware General Corporation Law, our certificate of incorporation and our bylaws.
As permitted by Section 145 of the Delaware General Corporation Law, we carry primary and excess insurance policies insuring our directors and officers against certain liabilities they may incur in their capacity as directors and officers. Under the policies, the insurer, on our behalf, may also pay amounts for which we granted indemnification to our directors and officers.
Our certificate of incorporation provides that our directors shall not be personally liable to us or our stockholders for monetary damages for breach of fiduciary duty as a director, except to the extent such exemption from
II-1
Table of Contents
liability or limitation thereof is not permitted by the Delaware General Corporation Law. If the DGCL is amended to authorize corporate action further eliminating or limiting the liability of directors, then the liability of our directors will be eliminated or limited to the fullest extent permitted by the DGCL, as so amended. Our bylaws provide for the same indemnification for our directors and officers.
Our bylaws provide that expenses (including attorneys’ fees) incurred by a Covered Person in defending, testifying or otherwise participating in any proceeding for which such officer or director may be entitled to indemnification hereunder shall be paid by us in advance of the final disposition of such proceeding upon receipt of an undertaking by or on behalf of such Covered Person to repay such amount if it shall ultimately be determined that he or she is not entitled to be indemnified by us as authorized by the bylaws.
The indemnification provided by our bylaws is not deemed to be exclusive of any other right to which a person seeking indemnification or advancement of expenses may be entitled under applicable law, our certificate of incorporation, our bylaws, an agreement, a vote of stockholders or disinterested directors or otherwise, as to action taken in another capacity while holding his or her office or position, and will continue as to a person who has ceased to be a Covered Person and will inure to the benefit of his or her heirs, executors and administrators.
Our bylaws provide that we may maintain insurance, at our expense, to protect ourselves and/or any director, officer, employee or agent of ours or another corporation, partnership, joint venture, trust or other enterprise against any expense, liability or loss, whether or not we would have the power to indemnify such person against such expense, liability or loss under the DGCL.
| Item 15. | Recent Sales of Unregistered Securities |
Equity Securities
In connection with our emergence from bankruptcy, on May 27, 2010, the effective date of our plan of reorganization, all then existing shares of our common stock were cancelled and we issued new equity securities comprised of 18,351,664 shares of new common stock, 1,041,666 shares of 7% preferred stock, 2,419,753 warrants to purchase common stock and 780,566 options to purchase common stock. On May 28, 2010, we issued 26,448 shares of common stock and 58,386 options to purchase common stock. These issuances are described below.
Of the 18,351,664 shares of common stock issued on May 27, 2010,
| • | we issued 6,308,020 shares of common stock to the holders of our prepetition senior notes and prepetition senior subordinated notes in exchange for claims relating to our prepetition senior subordinated notes and a portion of our prepetition senior notes in reliance on the exemption from registration under the Securities Act afforded by Section 1145 of the Bankruptcy Code; |
| • | we issued 8,623,491 shares of common stock to holders of our prepetition senior subordinated notes pursuant to the rights offering conducted pursuant to our plan of reorganization for an aggregate purchase price of $185.7 million in reliance on the exemption from registration under the Securities Act afforded by Section 4(2) of the Securities Act; |
| • | we issued 2,558,182 shares of common stock to certain holders of our prepetition senior notes and prepetition senior subordinated notes that agreed to backstop our rights offering pursuant to a commitment agreement we entered into on April 19, 2010, or the Backstop Parties, for an aggregate purchase price of $55.1 million in reliance on the exemption from registration under the Securities Act afforded by Section 4(2) of the Securities Act; and |
| • | we granted as restricted stock 757,896 shares, plus an additional 104,075 shares that may be reduced subject to realized dilution on the warrants, to officers and key employees in reliance on the exemptions from registration under the Securities Act afforded by Section 4(2) of the Securities Act and Rule 701 promulgated thereunder. |
II-2
Table of Contents
Of the 1,041,666 shares of 7% preferred stock issued on May 27, 2010,
| • | we issued 1,000,000 shares to the Backstop Parties for an aggregate purchase price of $100.0 million in reliance on the exemption from registration under the Securities Act afforded by Section 4(2) of the Securities Act; and |
| • | we granted as restricted stock 41,666 shares to officers and key employees in reliance on the exemptions from registration under the Securities Act afforded by Section 4(2) of the Securities Act and Rule 701 promulgated thereunder. |
Of the 2,419,753 warrants issued on May 27, 2010,
| • | we issued 725,926 warrants to purchase our common stock to holders of our prepetition senior subordinated notes in exchange for claims relating to our prepetition senior subordinated notes in reliance on the exemption from registration under the Securities Act afforded by Section 1145 of the Bankruptcy Code; and |
| • | we issued 1,693,827 warrants to the Backstop Parties in consideration for their agreement to backstop the rights offering conducted pursuant to our plan of reorganization in reliance on the exemption from registration under the Securities Act afforded by Section 4(2) of the Securities Act. |
On May 27, 2010, we granted 702,509 options to purchase shares of common stock, plus an additional 78,057 options to purchase shares of common stock that may be reduced subject to realized dilution on the warrants, to officers and key employees in reliance on the exemptions from registration under the Securities Act afforded by Section 4(2) of the Securities Act and Rule 701 promulgated thereunder.
On May 28, 2010, we granted 26,448 shares of common stock and 58,386 options to purchase shares of common stock to non-employee directors and an affiliate of a non-employee director in reliance on the exemptions from registration under the Securities Act afforded by Section 4(2) of the Securities Act and Rule 701 promulgated thereunder.
On July 19, 2010, we paid a dividend to holders of our outstanding 7% preferred stock in the form of 10,780 additional shares of 7% preferred stock in reliance on the exemptions from registration under the Securities Act afforded by Section 4(2) of the Securities Act and Rule 701 promulgated thereunder.
Debt Securities
In connection with our emergence from bankruptcy on May 27, 2010, on May 11, 2010, CSA Escrow Corporation, an indirect wholly-owned subsidiary of ours, issued $450 million aggregate principal amount of 8½% senior notes due 2018 at a price of 100% of their face value resulting in $450 million of gross proceeds, the net proceeds of which were used to repay outstanding indebtedness under our debtor-in-possession credit facility and our prepetition credit facility, a portion of our prepetition senior notes and certain other bankruptcy claims and to make other payments in connection with our emergence. CSA Escrow Corporation merged with and into Cooper-Standard Holdings Inc. on May 27, 2010 in connection with our emergence from bankruptcy. The initial purchasers for the senior notes issued on May 11, 1010 were Deutsche Bank Securities Inc., Banc of America Securities LLC, Barclays Capital Inc. and UBS Securities LLC. The senior notes were offered and sold to qualified institutional buyers pursuant to Rule 144A under the Securities Act and to non-U.S. investors outside the United States in compliance with Regulation S of the Securities Act.
| Item 16. | Exhibits and Financial Statement Schedules |
The exhibits to this registration statement are listed on the Exhibit Index beginning on page II-8 hereof, which is incorporated by reference in this Item 16.
II-3
Table of Contents
| Item 17. | Undertakings |
The undersigned registrant hereby undertakes:
(1) To file, during any period in which offers or sales are being made, a post-effective amendment to this registration statement:
(a) To include any prospectus required by section 10(a)(3) of the Securities Act;
(b) To reflect in the prospectus any facts or events arising after the effective date of the registration statement (or the most recent post-effective amendment thereof) which, individually or in the aggregate, represent a fundamental change in the information set forth in the registration statement. Notwithstanding the foregoing, any increase or decrease in volume of securities offered (if the total dollar value of securities offered would not exceed that which was registered) and any deviation from the low or high end of the estimated maximum offering range may be reflected in the form of prospectus filed with the Securities and Exchange Commission, or the SEC, pursuant to Rule 424(b) if, in the aggregate, the changes in volume and price represent no more than a 20% change in the maximum aggregate offering price set forth in the “Calculation of Registration Fee” table in the effective registration statement.
(c) To include any material information with respect to the plan of distribution not previously disclosed in the registration statement or any material change to such information in the registration statement.
(2) That, for the purpose of determining any liability under the Securities Act, each such post-effective amendment shall be deemed to be a new registration statement relating to the securities offered therein, and the offering of such securities at that time shall be deemed to be the initial bona fide offering thereof.
(3) To remove from registration by means of a post-effective amendment any of the securities being registered which remain unsold at the termination of the offering.
(4) That, for the purpose of determining liability under the Securities Act to any purchaser if the registrant is subject to Rule 430C, each prospectus filed pursuant to Rule 424(b) as part of a registration statement relating to an offering, other than registration statements relying on Rule 430B or other than prospectuses filed in reliance on Rule 430A, shall be deemed to be part of and included in the registration statement as of the date it is first used after effectiveness. Provided, however, that no statement made in a registration statement or prospectus that is part of the registration statement or made in a document incorporated or deemed incorporated by reference into the registration statement or prospectus that is part of the registration statement will, as to a purchaser with a time of contract of sale prior to such first use, supersede or modify any statement that was made in the registration statement or prospectus that was part of the registration statement or made in any such document immediately prior to such date of first use.
(5) That, for the purpose of determining liability of the registrant under the Securities Act to any purchaser in the initial distribution of the securities the undersigned registrant undertakes that in a primary offering of securities of the undersigned registrant pursuant to this registration statement, regardless of the underwriting method used to sell the securities to the purchaser, if the securities are offered or sold to such purchaser by means of any of the following communications, the undersigned registrant will be a seller to the purchaser and will be considered to offer or sell such securities to such purchaser:
(a) Any preliminary prospectus or prospectus of the undersigned registrant relating to the offering required to be filed pursuant to Rule 424;
(b) Any free writing prospectus relating to the offering prepared by or on behalf of the undersigned registrant or used or referred to by the undersigned registrant;
(c) The portion of any other free writing prospectus relating to the offering containing material information about the undersigned registrant or its securities provided by or on behalf of the undersigned registrant; and
(d) Any other communication that is an offer in the offering made by the undersigned registrant to the purchaser.
II-4
Table of Contents
(6) Insofar as indemnification for liabilities arising under the Securities Act of 1933 may be permitted to directors, officers and controlling persons of the registrant pursuant to the foregoing provisions, or otherwise, the registrant has been advised that in the opinion of the SEC such indemnification is against public policy as expressed in the Act, and is, therefore, unenforceable. In the event that a claim for indemnification against such liabilities (other than the payment by the registrant of expenses incurred or paid by a director, officer or controlling person of the registrant in the successful defense of any action, suit or proceeding) is asserted by such director, officer or controlling person in connection with the securities being registered, the registrant will, unless in the opinion of its counsel the matter has been settled by controlling precedent, submit to a court of appropriate jurisdiction the question whether such indemnification by it is against public policy as expressed in the Act and will be governed by the final adjudication of such issue.
II-5
Table of Contents
SIGNATURES
Pursuant to the requirements of the Securities Act of 1933, as amended, the registrant has duly caused this registration statement to be signed on its behalf by the undersigned, thereunto duly authorized, in the City of Novi, State of Michigan, on November 15, 2010.
| COOPER-STANDARD HOLDINGS INC. | ||
| By: |
/s/ James S. McElya | |
| Name: |
James S. McElya | |
| Title: |
Chairman, Director and Chief Executive Officer | |
Pursuant to the requirements of the Securities Act, this registration statement has been signed by the following persons in the capacities indicated on November 15, 2010.
| Signatures |
Title | |
| /s/ James S. McElya James S. McElya |
Chairman, Director and Chief Executive Officer (Principal Executive Officer) | |
| /s/ Allen J. Campbell Allen J. Campbell |
Vice President and (Principal Financial Officer) | |
| /s/ Helen T. Yantz Helen T. Yantz |
Vice President and (Principal Accounting Officer) | |
| * Glenn R. August |
Director | |
| * Orlando A. Bustos |
Director | |
| * Larry Jutte |
Director | |
| * David J. Mastrocola |
Director | |
| * Stephen A. Van Oss |
Director | |
| * Kenneth L. Way |
Director | |
| *By: | /s/ Timothy W. Hefferon | |
| Timothy W. Hefferon, as attorney-in-fact for the persons indicated | ||
II-6
Table of Contents
Index to Exhibits
| Exhibit No. |
Description of Exhibit | |
| 2.1* | Debtors’ Second Amended Joint Chapter 11 Plan of Reorganization, dated March 26, 2010 (incorporated by reference to Exhibit 2.1 to the Company’s Current Report on Form 8-K dated May 24, 2010). | |
| 3.1* | Third Amended and Restated Certificate of Incorporation of Cooper-Standard Holdings Inc., dated May 27, 2010. | |
| 3.2* | Amended and Restated Bylaws of Cooper-Standard Holdings Inc. | |
| 3.3* | Cooper-Standard Holdings Inc. Certificate of Designations 7% Cumulative Participating Convertible Preferred Stock | |
| 4.1* | Indenture, 8 1/2% Senior Notes due 2018, dated as of May 11, 2010, between CSA Escrow Corporation and U.S. Bank National Association, as trustee. | |
| 4.2* | Supplemental Indenture, Senior Notes due 2018, dated as of May 27, 2010, among CSA U.S., the Company, the subsidiaries of CSA U.S. set forth on the signature page thereto and U.S. Bank National Association, as trustee under the indenture (incorporated by reference to Exhibit 4.1 to the Company’s Current Report on Form 8-K dated June 3, 2010). | |
| 4.3* | Registration Rights Agreement, dated as of May 11, 2010, by and among CSA Escrow Corporation and Deutsche Bank Securities Inc. | |
| 4.4* | Joinder to Registration Rights Agreement, dated May 27, 2010 (incorporated by reference to Exhibit 4.2 to the Company’s Current Report on Form 8-K dated June 3, 2010). | |
| 4.5* | Registration Rights Agreement, dated as of May 27, 2010, by and among the Company, the Backstop Purchasers and the other holders party thereto (incorporated by reference to Exhibit 4.3 to the Company’s Current Report on Form 8-K dated June 3, 2010). | |
| 4.6* | Warrant Agreement, dated as of May 27, 2010, between the Company and Computershare Inc. and Computershare Trust Company, N.A., collectively as Warrant Agent (incorporated by reference to Exhibit 4.4 to the Company’s Current Report on Form 8-K dated June 3, 2010). | |
| 4.7* | Form of 8 1/2% Senior Notes due 2018 (included in exhibit 4.1). | |
| 5.1* | Opinion of Fried, Frank, Harris, Shriver & Jacobson LLP. | |
| 10.1* | Loan and Security Agreement, dated as of May 27, 2010, among the Company, CSA U.S., CSA Canada, the other guarantors party thereto, certain financial institutions as lenders and Bank of America, N.A., as Agent (incorporated by reference to Exhibit 10.1 to the Company’s Current Report on Form 8-K dated June 3, 2010). | |
| 10.2* | Escrow Agreement, dated as of May 11, 2010, by and among CSA Escrow Corporation, Cooper-Standard Automotive Inc., U.S. Bank National Association, as trustee, and U.S. Bank National Association, as escrow agent. | |
| 10.3* | Stock and Asset Purchase Agreement, dated as of December 4, 2005, between ITT Industries, Inc. and Cooper-Standard Automotive Inc. (incorporated by reference to Exhibit 10.1 to the Company’s Current Report on Form 8-K dated December 8, 2005). | |
| 10.4* | First Amendment to the Stock and Asset Purchase Agreement dated February 6, 2006 between Cooper-Standard Automotive Inc. and ITT Industries, Inc. (incorporated by reference to Exhibit 10.1 to the Company’s Current Report on Form 8-K dated February 10, 2006). | |
| 10.5* | Sale and Purchase Agreement, dated and notarized on June 9 and June 10, 2007, by and between Automotive Sealing Systems S.A., Cooper-Standard Automotive Inc. and CSA Germany GmbH & Co. KG (incorporated by reference to Exhibit 10.1 to the Company’s Current Report on Form 8-K dated June 14, 2007). | |
| 10.6*† | Fourth Amended and Restated Employment Agreement, dated July 1, 2008, by and among Cooper-Standard Automotive Inc. and James S. McElya (incorporated by reference to Exhibit 10.18 to the Company’s Annual Report on Form 10-K for the fiscal year ended December 31, 2008). | |
II-8
Table of Contents
| Exhibit No. |
Description of Exhibit | |
| 10.7*† | Executive Put Option Agreement, dated December 19, 2007, by and among Cooper-Standard Holdings Inc., Cypress Merchant Banking Partners II L.P., Cypress Merchant Banking II C.V., 55th Street Partners II L.P., Cypress Side-by-Side LLC, GS Capital Partners 2000, L.P., GS Capital Partners 2000 Offshore, L.P., GS Capital Partners 2000 GmbH & Co. Beteiligungs KG, GS Capital Partners 2000, L.P. and James S. McElya (incorporated by reference to Exhibit 10.26 to the Company’s Annual Report on Form 10-K for the fiscal year ended December 31, 2007). | |
| 10.8*† | Employment Agreement, dated as of July 1, 2008, by and among Cooper-Standard Automotive Inc. and Edward A. Hasler (incorporated by reference to Exhibit 10.21 to the Company’s Annual Report on Form 10-K for the fiscal year ended December 31, 2008). | |
| 10.9*† | Employment Agreement, dated as of January 1, 2009, by and among Cooper-Standard Automotive Inc. and Allen J. Campbell (incorporated by reference to Exhibit 10.23 to the Company’s Annual Report on Form 10-K for the fiscal year ended December 31, 2008). | |
| 10.10*† | Employment Agreement, dated as of January 1, 2009, by and among Cooper-Standard Automotive Inc. and Keith D. Stephenson (incorporated by reference to Exhibit 10.25 to the Company’s Annual Report on Form 10-K for the fiscal year ended December 31, 2008). | |
| 10.11*† | Cooper-Standard Automotive Inc. Change of Control Severance Pay Plan, as Amended and Restated Effective July 1, 2008 (incorporated by reference to Exhibit 10.30 to the Company’s Annual Report on Form 10-K for the fiscal year ended December 31, 2008). | |
| 10.12*† | 2004 Cooper-Standard Holdings Inc. Stock Incentive Plan, as Amended and Restated Effective November 1, 2007 (incorporated by reference to Exhibit 10.31 to the Company’s Annual Report on Form 10-K for the fiscal year ended December 31, 2007). | |
| 10.13*† | Form of Nonqualified Stock Option Agreement (incorporated by reference to Exhibit 10.32 to the Company’s Annual Report on Form 10-K for the fiscal year ended December 31, 2008). | |
| 10.14*† | Cooper-Standard Automotive Inc. Deferred Compensation Plan, Effective January 1, 2005 with Amendments through December 31, 2008 (incorporated by reference to Exhibit 10.33 to the Company’s Annual Report on Form 10-K for the fiscal year ended December 31, 2008). | |
| 10.15*† | Cooper-Standard Automotive Inc. Pre-2005 Executive Deferred Compensation Plan, as Amended and Restated Effective January 1, 2005 (incorporated by reference to Exhibit 10.34 to the Company’s Annual Report on Form 10-K for the fiscal year ended December 31, 2006). | |
| 10.16*† | Cooper-Standard Automotive Inc. Nonqualified Supplementary Benefit Plan, Amended and Restated as of January 1, 2009 (incorporated by reference to Exhibit 10.35 to the Company’s Annual Report on Form 10-K for the fiscal year ended December 31, 2008). | |
| 10.17*† | Cooper-Standard Automotive Inc. Long-Term Incentive Plan (incorporated by reference to Exhibit 10.36 to the Company’s Annual Report on Form 10-K for the fiscal year ended December 31, 2006). | |
| 10.18* | Limited Liability Company Agreement of Nishikawa Standard Company LLC, dated as of January 1, 2008 (incorporated by reference to Exhibit 10.39 to the Company’s Annual Report on Form 10-K for the fiscal year ended December 31, 2008). | |
| 10.19* | Commitment Agreement, dated as of March 19, 2010, between Cooper-Standard Holdings Inc and certain backstop parties (incorporated by reference to Exhibit 10.49 to the Company’s Annual Report on Form 10-K for the fiscal year ended December 31, 2009). | |
| 10.20*† | Employment agreement, dated as of January 1, 2009, by and between Cooper-Standard Automotive Inc. and Michael C. Verwilst (incorporated by reference to Exhibit 10.50 to the Company’s Annual Report on Form 10-K for the fiscal year ended December 31, 2009). | |
II-9
Table of Contents
| Exhibit No. |
Description of Exhibit | |
| 10.21*† | Agreement and General Release, dated as of March 31, 2009, by and among Cooper-Standard Holdings Inc., Cooper-Standard Automotive Inc. and Larry J. Beard (incorporated by reference to Exhibit 10.51 to the Company’s Annual Report on Form 10-K for the fiscal year ended December 31, 2009). | |
| 10.22* | Director Nomination Agreement, made as of May 27, 2010, among the Company and Barclays Capital, Inc. (incorporated by reference to Exhibit 10.2 to the Company’s Current Report on Form 8-K dated June 3, 2010). | |
| 10.23* | Director Nomination Agreement, made as of May 27, 2010, among the Company and Silver Point Capital, L.P., on behalf of its affiliates and related funds (incorporated by reference to Exhibit 10.3 to the Company’s Current Report on Form 8-K dated June 3, 2010). | |
| 10.24* | Director Nomination Agreement, made as of May 27, 2010, among the Company and Oak Hill Advisors L.P., on behalf of certain funds and separate accounts that it manages (incorporated by reference to Exhibit 10.4 to the Company’s Current Report on Form 8-K dated June 3, 2010). | |
| 10.25* | Director Nomination Agreement, made as of May 27, 2010, among the Company and Capital Research and Management Company, as investment advisor to certain funds it manages, TCW Shared Opportunity Fund IV, L.P., TCW Shared Opportunity Fund IVB, L.P., TCW Shared Opportunity Fund V, L.P., TD High Yield Income Fund, and Lord, Abbett & Co. LLC, as investment manager on behalf of multiple clients (incorporated by reference to Exhibit 10.5 to the Company’s Current Report on Form 8-K dated June 3, 2010). | |
| 10.26*† | 2010 Cooper-Standard Holdings Inc. Management Incentive Plan (incorporated by reference to Exhibit 10.6 to the Company’s Current Report on Form 8-K dated June 3, 2010). | |
| 10.27*† | Form of 2010 Cooper-Standard Holdings Inc. Management Incentive Plan Nonqualified Stock Option Agreement for key employees (incorporated by reference to Exhibit 10.7 to the Company’s Current Report on Form 8-K dated June 3, 2010). | |
| 10.28*† | Form of 2010 Cooper-Standard Holdings Inc. Management Incentive Plan Restricted Stock Award Agreement for key employees (incorporated by reference to Exhibit 10.8 to the Company’s Current Report on Form 8-K dated June 3, 2010). | |
| 10.29*† | Form of 2010 Cooper-Standard Holdings Inc. Management Incentive Plan Nonqualified Stock Option Agreement for directors (incorporated by reference to Exhibit 10.9 to the Company’s Current Report on Form 8-K dated June 3, 2010). | |
| 10.30*† | Form of 2010 Cooper-Standard Holdings Inc. Management Incentive Plan Restricted Stock Award Agreement for directors (incorporated by reference to Exhibit 10.10 to the Company’s Current Report on Form 8-K dated June 3, 2010). | |
| 10.31* | Settlement Agreement, dated as of March 17, 2010 (incorporated by reference to Exhibit 10.2 to the Company’s Quarterly Report on Form 10-Q for the quarterly period ended March 31, 2010). | |
| 12.1 | Computation of Ratio of Earnings to Combined Fixed Charges and Preferred Stock Dividends. | |
| 21.1* | List of Subsidiaries (incorporated by reference to Exhibit 21.1 to the Company’s Annual Report on Form 10-K for the fiscal year ended December 31, 2009). | |
| 23.1 | Consent of Ernst & Young LLP, Independent Registered Public Accounting Firm. | |
| 23.2* | Consent of Fried, Frank, Harris, Shriver & Jacobson LLP (included in Exhibit 5.1). | |
| 24.1* | Powers of Attorney (included on signature page). | |
| * | Previously filed. |
| † | Management contracts and compensation plans or arrangements. |
II-10