Attached files
UNITED STATES
SECURITIES AND EXCHANGE COMMISSION
Washington, D.C. 20549
FORM 10-Q
[Mark One]
|
x
|
QUARTERLY REPORT PURSUANT TO SECTION 13 OR 15(d) OF THE
|
|
SECURITIES EXCHANGE ACT OF 1934
|
For the quarterly period ended September 30, 2010
OR
|
o
|
TRANSITION REPORT PURSUANT TO SECTION 13 OR 15(d) OF THE
|
|
SECURITIES EXCHANGE ACT OF 1934
|
For the transition period from ____________ to ____________
Commission File Number: 000-53159
United Development Funding III, L.P.
(Exact Name of Registrant as Specified in Its Charter)
|
Delaware
|
20-3269195
|
|
|
(State or other jurisdiction of incorporation or organization)
|
(I.R.S. Employer Identification No.)
|
1301 Municipal Way, Suite 100, Grapevine, Texas 76051
(Address of principal executive offices)
(Zip Code)
Registrant’s telephone number, including area code: (214) 370-8960
N/A
(Former name, former address and former fiscal year, if changed since last report)
Indicate by check mark whether the Registrant: (1) has filed all reports required to be filed by Section 13 or 15(d) of the Securities Exchange Act of 1934 during the preceding 12 months (or for such shorter period that the Registrant was required to file such reports) and (2) has been subject to such filing requirements for the past 90 days. Yes x No o
Indicate by check mark whether the registrant has submitted electronically and posted on its corporate Web site, if any, every Interactive Data File required to be submitted and posted pursuant to Rule 405 of Regulation S-T (§232.405 of this chapter) during the preceding 12 months (or for such shorter period that the registrant was required to submit and post such files). Yes o No o
Indicate by check mark whether the Registrant is a large accelerated filer, an accelerated filer, a non-accelerated filer, or a smaller reporting company. See the definitions of “large accelerated filer,” “accelerated filer” and “smaller reporting company” in Rule 12b-2 of the Exchange Act.
Large accelerated filer o Accelerated filer o
Non-accelerated filer x (Do not check if a smaller reporting company) Smaller reporting company o
Indicate by check mark whether the Registrant is a shell company (as defined in Rule 12b-2 of the Exchange Act).
Yes o No x
As of November 15, 2010, the Registrant had 17,690,300 units of limited partnership interest outstanding.
UNITED DEVELOPMENT FUNDING III, L.P.
FORM 10-Q
Quarter Ended September 30, 2010
|
Page
|
||
|
PART I
|
||
|
FINANCIAL INFORMATION
|
||
|
Item 1.
|
Financial Statements.
|
|
|
Balance Sheets as of September 30, 2010 (Unaudited) and December 31, 2009 (Audited)
|
3
|
|
|
Statements of Operations for the three and nine months ended September 30, 2010 and 2009 (Unaudited)
|
4
|
|
|
Statements of Cash Flows for the nine months ended September 30, 2010 and 2009 (Unaudited)
|
5
|
|
|
Notes to Financial Statements (Unaudited)
|
6
|
|
|
Item 2.
|
Management’s Discussion and Analysis of Financial Condition and Results of Operations.
|
19
|
|
Item 3.
|
Quantitative and Qualitative Disclosures About Market Risk.
|
34
|
|
Item 4.
|
Controls and Procedures.
|
35
|
|
PART II
|
||
|
OTHER INFORMATION
|
||
|
Item 1.
|
Legal Proceedings.
|
36
|
|
Item 1A.
|
Risk Factors.
|
36
|
|
Item 2.
|
Unregistered Sales of Equity Securities and Use of Proceeds.
|
36
|
|
Item 3.
|
Defaults Upon Senior Securities.
|
37
|
|
Item 4.
|
[Removed and Reserved]
|
37
|
|
Item 5.
|
Other Information.
|
37
|
|
Item 6.
|
Exhibits.
|
37
|
|
Signatures.
|
38
|
2
PART I
FINANCIAL INFORMATION
UNITED DEVELOPMENT FUNDING III, L.P.
|
September 30, 2010 (Unaudited)
|
December 31, 2009 (Audited)
|
|||||||
|
Assets
|
||||||||
|
Cash and cash equivalents
|
$ | 676,412 | $ | 5,563,407 | ||||
|
Restricted cash
|
2,237,759 | 2,220,339 | ||||||
|
Accrued interest receivable
|
9,269,928 | 7,812,935 | ||||||
|
Accrued interest receivable – related party
|
699,086 | 2,168,201 | ||||||
|
Mortgage notes receivable, net
|
214,676,103 | 202,437,145 | ||||||
|
Mortgage notes receivable – related party, net
|
55,536,532 | 51,973,747 | ||||||
|
Participation interest – related party
|
57,890,742 | 54,726,000 | ||||||
|
Other assets
|
298,492 | 375,376 | ||||||
|
Total assets
|
$ | 341,285,054 | $ | 327,277,150 | ||||
|
Liabilities and Partners’ Capital
|
||||||||
|
Liabilities:
|
||||||||
|
Accounts payable
|
$ | 123,288 | $ | 127,396 | ||||
|
Accrued liabilities
|
183,860 | 103,156 | ||||||
|
Accrued liabilities – related party
|
3,549,051 | 3,003,890 | ||||||
|
Distributions payable
|
1,816,757 | - | ||||||
|
Line-of-credit
|
15,000,000 | 15,000,000 | ||||||
|
Total liabilities
|
20,672,956 | 18,234,442 | ||||||
|
Commitments and contingencies
|
||||||||
|
Partners’ Capital:
|
||||||||
|
Limited partners’ capital: 22,500,000 units authorized; 17,644,182 units issued and outstanding at September 30, 2010 and 17,232,540 units issued and outstanding at December 31, 2009
|
320,233,665 | 308,995,330 | ||||||
|
General partner’s capital
|
378,433 | 47,378 | ||||||
|
Total partners’ capital
|
320,612,098 | 309,042,708 | ||||||
|
Total liabilities and partners’ capital
|
$ | 341,285,054 | $ | 327,277,150 | ||||
See accompanying notes to financial statements (unaudited).
3
UNITED DEVELOPMENT FUNDING III, L.P.
(Unaudited)
|
Three Months Ended
|
Nine Months Ended
|
|||||||||||||||
|
September 30,
|
September 30,
|
|||||||||||||||
|
2010
|
2009
|
2010
|
2009
|
|||||||||||||
|
Revenues:
|
||||||||||||||||
|
Interest income
|
$ | 8,202,195 | $ | 6,957,216 | $ | 23,894,144 | $ | 20,383,634 | ||||||||
|
Interest income – related party
|
3,616,522 | 3,712,619 | 10,752,030 | 10,076,786 | ||||||||||||
|
Credit enhancement fees – related party
|
220,967 | 61,342 | 243,282 | 76,753 | ||||||||||||
|
Mortgage and transaction service revenues
|
512,478 | 444,964 | 1,370,302 | 1,904,240 | ||||||||||||
|
Total revenues
|
12,552,162 | 11,176,141 | 36,259,758 | 32,441,413 | ||||||||||||
|
Expenses:
|
||||||||||||||||
|
Interest expense
|
378,082 | 32,877 | 1,121,918 | 32,877 | ||||||||||||
|
Loan loss reserve
|
87,568 | 107,631 | 319,134 | 307,677 | ||||||||||||
|
General and administrative
|
976,352 | 985,031 | 3,087,014 | 2,507,410 | ||||||||||||
|
Total expenses
|
1,442,002 | 1,125,539 | 4,528,066 | 2,847,964 | ||||||||||||
|
Net income
|
$ | 11,110,160 | $ | 10,050,602 | $ | 31,731,692 | $ | 29,593,449 | ||||||||
|
Earnings allocated to limited partners
|
$ | 9,956,886 | $ | 9,007,313 | $ | 28,437,831 | $ | 26,521,545 | ||||||||
|
Earnings per limited partnership unit, basic and diluted
|
$ | 0.57 | $ | 0.53 | $ | 1.63 | $ | 1.60 | ||||||||
|
Weighted average limited partnership units outstanding
|
17,560,810 | 17,007,588 | 17,424,928 | 16,619,177 | ||||||||||||
|
Distributions per weighted average limited partnership units outstanding
|
$ | 0.49 | $ | 0.49 | $ | 1.46 | $ | 1.44 | ||||||||
See accompanying notes to financial statements (unaudited).
4
UNITED DEVELOPMENT FUNDING III, L.P.
(Unaudited)
|
Nine Months Ended
|
||||||||
|
September 30,
|
||||||||
|
2010
|
2009
|
|||||||
|
Operating Activities
|
||||||||
|
Net income
|
$ | 31,731,692 | $ | 29,593,449 | ||||
|
Adjustments to reconcile net income to net cash provided by operating activities:
|
||||||||
|
Provision for loan losses
|
319,134 | 307,677 | ||||||
|
Amortization
|
264,215 | 41,753 | ||||||
|
Changes in operating assets and liabilities:
|
||||||||
|
Accrued interest receivable
|
(1,456,993 | ) | (7,376,112 | ) | ||||
|
Accrued interest receivable – related party
|
1,469,115 | 598,311 | ||||||
|
Other assets
|
(187,331 | ) | (521,310 | ) | ||||
|
Accounts payable
|
(4,108 | ) | 32,877 | |||||
|
Accrued liabilities
|
80,704 | (285,972 | ) | |||||
|
Net cash provided by operating activities
|
32,216,428 | 22,390,673 | ||||||
|
Investing Activities
|
||||||||
|
Investments in mortgage notes receivable
|
(28,566,444 | ) | (57,087,011 | ) | ||||
|
Investments in mortgage notes receivable – related party
|
(4,307,744 | ) | (36,750,609 | ) | ||||
|
Investments in participation interest – related party
|
(7,942,736 | ) | (13,282,405 | ) | ||||
|
Receipts from mortgage notes receivable
|
16,008,352 | 29,279,144 | ||||||
|
Receipts from mortgage notes receivable – related party
|
744,959 | 30,703,467 | ||||||
|
Receipts from participation interest – related party
|
4,777,994 | - | ||||||
|
Net cash used in investing activities
|
(19,285,619 | ) | (47,137,414 | ) | ||||
|
Financing Activities
|
||||||||
|
Net proceeds from line-of-credit
|
- | 15,000,000 | ||||||
|
Limited partner contributions
|
6,341 | 35,370,572 | ||||||
|
Limited partner distributions
|
(25,438,674 | ) | (23,921,770 | ) | ||||
|
Limited partner distribution reinvestment
|
8,714,189 | 9,164,534 | ||||||
|
Limited partner redemption
|
(481,352 | ) | (2,852,502 | ) | ||||
|
General partner distributions
|
(2,962,806 | ) | (2,995,943 | ) | ||||
|
General partner distributions payable
|
1,816,757 | - | ||||||
|
Escrow payable
|
- | (517,190 | ) | |||||
|
Restricted cash
|
(17,420 | ) | (1,006,544 | ) | ||||
|
Payments of offering costs
|
- | (4,280,361 | ) | |||||
|
Deferred offering costs
|
- | 612,292 | ||||||
|
Accrued liabilities – related party
|
545,161 | (80,903 | ) | |||||
|
Net cash (used in) provided by financing activities
|
(17,817,804 | ) | 24,492,185 | |||||
|
Net decrease in cash and cash equivalents
|
(4,886,995 | ) | (254,556 | ) | ||||
|
Cash and cash equivalents at beginning of period
|
5,563,407 | 15,505,910 | ||||||
|
Cash and cash equivalents at end of period
|
$ | 676,412 | $ | 15,251,354 | ||||
See accompanying notes to financial statements (unaudited).
5
A. Nature of Business
United Development Funding III, L.P. (which may be referred to as the “Partnership,” “we,” “us,” “our” or “UDF III”) was organized on June 13, 2005 as a Delaware limited partnership. Our principal business purpose is to originate, acquire, service, and otherwise manage, either alone or in association with others, a diversified portfolio of mortgage loans that are secured by real property or equity interests that hold real property already subject to other mortgages (including mortgage loans that are not first in priority and participation interests in mortgage loans) and to issue or acquire an interest in credit enhancements to borrowers, such as guarantees or letters of credit. We concentrate on making development loans to single-family lot developers who sell their lots to national and regional home builders, as well as making loans to entities created by home builders in conjunction with our general partner or affiliates of our general partner for the acquisition of property and development of residential lots. We seek to make or acquire loans primarily with respect to projects where the completed subdivision will consist of homes at or below the median price of the U.S. housing market. Our offices are located in Grapevine, Texas.
Our general partner is UMTH Land Development, L.P. (“Land Development”), a Delaware limited partnership that is responsible for our overall management, conduct, and operation. Our general partner has authority to act on our behalf in all matters respecting us, our business and our property. Our limited partners shall take no part in the management of our business or transact any business for us and shall have no power to sign for or bind us; provided, however, that our limited partners, by a majority vote and without the concurrence of our general partner, have the right to: (a) amend the Second Amended and Restated Agreement of Limited Partnership, as amended (the “Partnership Agreement”), governing the Partnership, (b) dissolve the Partnership, (c) remove our general partner or any successor general partner, (d) elect a new general partner, and (e) approve or disapprove a transaction entailing the sale of all or substantially all of the real properties acquired by the Partnership.
B. Basis of Presentation
The accompanying unaudited financial statements were prepared in accordance with accounting principles generally accepted in the United States of America (“GAAP”) for interim financial information, with the instructions to Form 10-Q and with Regulation S-X. They do not include all information and footnotes required by GAAP for complete financial statements. However, except as disclosed herein, there has been no material change to the information disclosed in our Annual Report on Form 10-K for the year ended December 31, 2009, which was filed with the Securities and Exchange Commission. The accompanying interim unaudited financial statements should be read in conjunction with the financial statements filed in our Annual Report on Form 10-K for the year ended December 31, 2009, which was filed with the Securities and Exchange Commission. In the opinion of management, the accompanying unaudited financial statements include all adjustments, consisting solely of normal recurring adjustments, considered necessary to present fairly our financial position as of September 30, 2010, operating results for the three and nine months ended September 30, 2010 and 2009 and cash flows for the nine months ended September 30, 2010 and 2009. Operating results and cash flows for the nine months ended September 30, 2010 are not necessarily indicative of the results that may be expected for the year ending December 31, 2010.
Allowance for Loan Losses
The allowance for loan losses is our estimate of incurred losses in our portfolio of mortgage notes receivable, mortgage notes receivable – related party and participation interest – related party. We periodically perform a detailed review of our portfolio of mortgage notes and other loans to determine if impairment has occurred and to assess the adequacy of the allowance for loan losses. We charge additions to the allowance for loan losses to current period earnings through a provision for loan losses. Amounts determined to be uncollectible are charged directly against (and decrease) the allowance for loan losses (“charged off”), while amounts recovered on previously charged off amounts increase the allowance for loan losses. The following table summarizes the changes in the reserve for loan losses during the nine months ended September 30, 2010 and the year ended December 31, 2009:
|
September 30, 2010
|
December 31, 2009
|
|||||||
|
Balance, beginning of year
|
$ | 3,860,300 | $ | 317,500 | ||||
|
Provision for loan losses
|
319,100 | 3,420,300 | ||||||
|
Interest income suspended
|
33,500 | 122,500 | ||||||
|
Balance, end of period
|
$ | 4,212,900 | $ | 3,860,300 | ||||
6
Fair Value of Financial Instruments
In accordance with the reporting requirements of the Financial Accounting Standards Board (“FASB”) Accounting Standards Codification (“ASC”) 825-10, Financial Instruments-Fair Value, we calculate the fair value of our assets and liabilities that qualify as financial instruments under this statement and include this information in the notes to the financial statements when the fair value is different than the carrying value of those financial instruments. The estimated fair value of cash equivalents, restricted cash, accrued interest receivable, accounts payable, accrued liabilities, and line-of-credit approximates the carrying amounts due to the relatively short maturity of these instruments. The estimated fair value of mortgage notes receivable approximates the carrying amount since they bear interest at the market rate.
Impact of Recently Issued Accounting Standards
In December 2007, the FASB issued Statement of Financial Accounting Standards (“SFAS”) 141R, Business Combinations, currently within the scope of ASC 805-10. ASC 805-10 modifies the accounting and disclosure requirements for business combinations and broadens the scope of the previous standard to apply to all transactions in which one entity obtains control over another business. In addition, it establishes new accounting and reporting standards for non-controlling interests in subsidiaries. The Partnership’s adoption of this guidance on January 1, 2009 has not had a material impact on the Partnership’s financial condition or results of operations.
In February 2008, the FASB issued FASB Staff Position (“FSP”) 157-2, Effective Date of FASB Statement No. 157, currently within the scope of ASC 820-10. The effective date of ASC 820-10 for all nonfinancial assets and nonfinancial liabilities, except for items recognized or disclosed at fair value in the financial statements on a recurring basis (at least annually), was delayed until the beginning of the first quarter 2009. Application of ASC 820-10 did not have a material impact on the Partnership’s results of operations and financial condition upon adoption on January 1, 2009.
In April 2009, the FASB issued FSP 107-1 and Accounting Principles Board Opinion 28-1, Interim Disclosures about Fair Value of Financial Instruments, currently within the scope of ASC 825-10. ASC 825-10 requires disclosures about the fair value of financial instruments whenever a public company issues financial information for interim reporting periods. ASC 825-10 is effective for interim reporting periods ending after June 15, 2009. The Partnership adopted this staff position upon its issuance, and it had no material impact on its financial statements.
In June 2009, the FASB issued SFAS 168, The FASB Accounting Standards Codification and the Hierarchy of Generally Accepted Accounting Principles, currently within the scope of ASC 105-10. ASC 105-10 identifies the ASC as the authoritative source of GAAP. The ASC does not change how the Partnership accounts for its transactions or the nature of related disclosures made. Rather, the ASC results in changes to how the Partnership references accounting standards within its reports. Rules and interpretive releases of the Securities and Exchange Commission under federal securities laws are also sources of authoritative GAAP for Securities and Exchange Commission registrants. This guidance is effective for financial statements issued for interim and annual periods ending after September 15, 2009, and the Partnership adopted the provisions of this guidance as of September 30, 2009. The Partnership’s adoption of this guidance did not have a material impact on its financial statements.
Reclassification
Certain prior year amounts have been reclassified to conform to current presentation.
7
C. Registration Statement
On May 15, 2006, a public offering of our units of limited partnership interest (the “Offering”) pursuant to a Registration Statement on Form S-11 (File No. 333-127891) was declared effective under the Securities Act of 1933, as amended. The Offering, at the time of such effectiveness, covered up to 12,500,000 units of limited partnership interest to be issued in the primary offering at a price of $20 per unit and up to 5,000,000 units of limited partnership interest to be issued pursuant to our distribution reinvestment plan (the “DRIP”) for $20 per unit. We had the right to reallocate the units of limited partnership interest we were offering between the primary offering and our DRIP, and pursuant to Supplement No. 8 to our prospectus regarding the Offering, which was filed with the Securities and Exchange Commission on September 4, 2008, we reallocated the units being offered to 16,250,000 units offered pursuant to the primary offering and 1,250,000 units offered pursuant to the DRIP. Pursuant to Supplement No. 11 to our prospectus regarding the Offering, which was filed with the Securities and Exchange Commission on March 6, 2009, we further reallocated the units being offered to 16,500,000 units offered pursuant to the primary offering and 1,000,000 units offered pursuant to the DRIP. The primary offering component of the Offering was terminated on April 23, 2009. We extended the offering of our units of limited partnership interest pursuant to our DRIP until the earlier of the sale of all units of limited partnership interest being offered pursuant to our DRIP or May 15, 2010; provided, however, that our general partner was permitted to terminate the offering of units pursuant to our DRIP at any earlier time.
On June 9, 2009, we held a Special Meeting of our limited partners as of April 13, 2009, at which our limited partners approved three proposals to amend certain provisions of our Partnership Agreement for the purpose of making available additional units of limited partnership interest for sale pursuant to an Amended and Restated Distribution Reinvestment Plan. On June 12, 2009, we registered 5,000,000 additional units to be offered pursuant to our Amended and Restated Distribution Reinvestment Plan in a Registration Statement on Form S-3 (File No. 333-159939) (“Secondary DRIP”). As such, we ceased offering units under the DRIP portion of the Offering as of July 21, 2009 and concurrently commenced our offering of units pursuant to the Secondary DRIP, which is currently ongoing.
D. Line-of-Credit
On September 21, 2009, the Partnership entered into a Loan and Security Agreement (the “Loan Agreement”) with Wesley J. Brockhoeft (the “Lender”) pursuant to which the Lender has provided the Partnership with a revolving credit facility in the maximum principal amount of $15 million (the “Credit Facility”). The interest rate on the Credit Facility is equal to 10% per annum. Accrued interest on the outstanding principal amount of the Credit Facility is payable monthly. The Credit Facility is secured by a first priority lien on all of the Partnership’s existing and future assets. In consideration of the Lender originating the Credit Facility, the Partnership paid the Lender an origination fee in the amount of $300,000. On June 21, 2010, the Partnership entered into the First Amendment to Loan and Security Agreement (the “Amended Loan Agreement”). Pursuant to the Amended Loan Agreement, the maturity date on the Credit Facility was extended to June 21, 2012. The Amended Loan Agreement also permitted the Partnership’s existing and future assets to secure our guaranty of a $15 million loan (the “UDF I – Brockhoeft Loan”) from the Lender, as agent for a group of lenders, to United Development Funding, L.P., an affiliated Delaware limited partnership (“UDF I”), and provided for cross-default of the Credit Facility with the UDF I – Brockhoeft Loan. In consideration for amending the loan, the Partnership paid the Lender an amendment fee in the amount of $150,000. On September 30, 2010, $15 million in principal was outstanding under the Credit Facility.
The Partnership’s eligibility to borrow up to $15 million under the Amended Loan Agreement is determined pursuant to a borrowing base. The borrowing base is equal to (a) the lesser of (i) up to 50% of the aggregate principal amount outstanding under the Partnership’s eligible notes, (ii) up to 50% of the face amount of the Partnership’s eligible notes, or (iii) 40% of the appraised value of the real property subject to the liens securing the Partnership’s eligible notes; minus (b) any reserves required by the Lender. Eligible notes are those promissory notes which are secured by first liens, meet certain other criteria established by the Lender, and are otherwise approved by the Lender for inclusion in the borrowing base. The Amended Loan Agreement requires the Partnership to make various representations to the Lender and to comply with various covenants and agreements, including, without limitation, maintaining at least $30 million in eligible notes, maintaining an adjusted tangible net worth of no less than $250 million, maintaining its current line of business, operating its business in accordance with applicable laws, providing the Lender with information, financial statements and reports, and not permitting a change of control to occur.
8
If a default occurs under the Credit Facility, the Lender may declare the Credit Facility to be due and payable immediately. A default may occur under the Credit Facility in various circumstances including, without limitation, if (i) the Partnership fails to pay amounts due to the Lender when due under the Amended Loan Agreement, (ii) the Partnership fails to comply with its covenants and agreements with the Lender, (iii) the Partnership defaults under obligations for money borrowed in excess of $500,000, (iv) the Lender deems itself insecure or determines that a material adverse effect with respect to the Credit Facility, the Partnership, or the Credit Facility collateral has occurred, (v) a criminal action is filed against the Partnership under a federal or state racketeering statute, (vi) a bankruptcy action is filed with respect to the Partnership, (vii) the Partnership conceals, removes, or permits to be concealed or removed, any of its assets with the intent to hinder, delay or defraud the Lender or its other creditors, or (viii) the Amended Loan Agreement or other loan documents are terminated, become void or unenforceable, or any security interest issued in connection with the Credit Facility ceases to be a valid and perfected first priority security interest in any portion of the Credit Facility collateral. In such event, the Lender may exercise any rights or remedies it may have, including, without limitation, increasing the interest rate to 12% per annum, prohibiting distributions to be made to the Partnership’s partners, and foreclosure of the Partnership’s assets. Any such event may materially impair the Partnership’s ability to conduct its business.
The Partnership intends to utilize the Credit Facility as transitory indebtedness to provide liquidity and to reduce and avoid the need for large idle cash reserves, including usage to fund identified investments pending receipt of proceeds from the partial or full repayment of loans. The Partnership intends to use the Credit Facility as a Partnership portfolio administration tool and not to provide long-term or permanent leverage on Partnership investments. Proceeds from the operations of the Partnership will be used to repay the Credit Facility.
As of September 30, 2010, we had issued an aggregate of 17,644,182 units of limited partnership interest in the Offering, DRIP and Secondary DRIP, consisting of 16,499,994 units issued to our limited partners pursuant to the primary offering in exchange for gross proceeds of approximately $330.3 million (approximately $290.7 million, net of costs associated with the Offering), 716,260 units of limited partnership interest issued to our limited partners pursuant to our DRIP in exchange for gross proceeds of approximately $14.3 million, and 746,165 units of limited partnership interest issued to our limited partners pursuant to our Secondary DRIP in exchange for gross proceeds of approximately $14.9 million, less 318,237 units of limited partnership interest that we had repurchased pursuant to our unit redemption program for approximately $6.4 million.
As of December 31, 2009, we had issued an aggregate of 17,232,540 units of limited partnership interest in the Offering, DRIP and Secondary DRIP, consisting of 16,499,994 units issued to our limited partners pursuant to the primary offering in exchange for gross proceeds of approximately $330.3 million (approximately $290.7 million, net of costs associated with the Offering), 716,260 units of limited partnership interest issued to our limited partners pursuant to the DRIP in exchange for gross proceeds of approximately $14.3 million, and 310,456 units of limited partnership interest issued to our limited partners pursuant to the Secondary DRIP in exchange for gross proceeds of approximately $6.2 million, less 294,170 units of limited partnership interest that we had repurchased pursuant to our unit redemption program for approximately $5.9 million.
In addition to the monthly DRIP and Secondary DRIP distributions, we also distributed approximately $16.7 million and $20.0 million in cash during the nine months ended September 30, 2010 and the twelve months ended December 31, 2009, respectively. Aggregate monthly distributions (including cash and Secondary DRIP) for the nine months ended September 30, 2010 were approximately $25.4 million.
F. Commitments and Contingencies
In February 2009, the Partnership deposited $1.5 million into a money market account (the “Deposit Account”) with LegacyTexas Bank (“LegacyTexas”) for the purpose of providing collateral to LegacyTexas for the benefit of UMTH Lending Company, L.P. (“UMTH Lending”), a Delaware limited partnership and an affiliate of the Partnership’s general partner. The Partnership provided LegacyTexas a security interest in the Deposit Account as further collateral for a loan (the “UMTH Lending Loan”) obtained by UMTH Lending from LegacyTexas. In consideration of the Partnership providing the Deposit Account as collateral for the UMTH Lending Loan, UMTH Lending agreed to pay the Partnership a fee equal to 3% per annum of the amount outstanding in the Deposit Account for each year that the Deposit Account secures the UMTH Lending Loan. This Deposit Account is included as restricted cash on our balance sheet. These fees are included in credit enhancement fees – related party income revenue.
9
In August 2009, the Partnership entered into a guaranty (the “UDF III Guaranty”) for the benefit of Texas Capital Bank, National Association (“Texas Capital”), or its permitted successors and assigns pursuant to which the Partnership guaranteed the repayment of up to $5 million owed to Texas Capital with respect to that certain promissory note between UMT Home Finance, L.P. (“UMT Home Finance”), a Delaware limited partnership, and Texas Capital. UMT Home Finance is a wholly owned subsidiary of United Mortgage Trust (“UMT”), a Maryland real estate investment trust. An affiliate of the Partnership’s general partner serves as the advisor to UMT. In connection with the UDF III Guaranty, the Partnership entered into a letter agreement with UMT Home Finance which provides for UMT Home Finance to pay the Partnership annually, in advance, an amount equal to 1% of the maximum exposure of the Partnership under the UDF III Guaranty (i.e., $50,000 per annum). These fees are included in credit enhancement fees – related party income revenue.
In March 2010, the Partnership entered into a guaranty (the “Resort Island Guaranty”) for the benefit of the Bank of Las Colinas (“BOLC”) pursuant to which the Partnership guaranteed the repayment of up to $925,000 owed to BOLC with respect to a loan between UDFLOF Resort Island, L.P. (“UDFLOF Resort Island”), a Delaware limited partnership, and BOLC. UDFLOF Resort Island is a wholly owned subsidiary of United Development Funding Land Opportunity Fund, L.P. (“UDF LOF”), a Delaware limited partnership. The Partnership’s general partner is an affiliate of UDF LOF. In connection with the Resort Island Guaranty, the Partnership entered into a letter agreement with UDFLOF Resort Island which provides for UDFLOF Resort Island to pay the Partnership a guaranty fee equal to 1% of the maximum exposure (i.e., $9,250) of the Partnership under the guaranty, which was paid to the Partnership upon the execution of the guaranty and is included in credit enhancement fees – related party income revenue.
In April 2010, the Partnership entered into a guaranty (the “UDF IV HF Guaranty”) for the benefit of Community Trust Bank of Texas (“CTB”) pursuant to which the Partnership guaranteed the repayment of up to $6 million owed to CTB with respect to a revolving line of credit loan between UDF IV Home Finance, L.P. (“UDF IV Home Finance”), a Delaware limited partnership, and CTB. UDF IV Home Finance is a wholly owned subsidiary of United Development Funding IV (“UDF IV”), a Maryland real estate investment trust. The Partnership’s general partner serves as the asset manager for UDF IV. In connection with the UDF IV HF Guaranty, the Partnership entered into a letter agreement with UDF IV Home Finance which provides for UDF IV Home Finance to pay the Partnership an annual credit enhancement fee equal to 1% of the maximum loan amount (i.e., $60,000 per annum). The fee is to be paid in 12 equal monthly installments and is included in credit enhancement fees – related party income revenue.
In April 2010, the Partnership entered into a guaranty (the “UMT 15th Street Guaranty”) for the benefit of CTB pursuant to which the Partnership guaranteed the repayment of up to $1.6 million owed to CTB with respect to a loan between UMT 15th Street, L.P. (“UMT 15th Street”), a Delaware limited partnership, and CTB. UMT 15th Street is a wholly owned subsidiary of UMT. An affiliate of the Partnership’s general partner serves as the advisor to UMT. In connection with the UMT 15th Street Guaranty, the Partnership entered into a letter agreement with UMT 15th Street which provides for UMT 15th Street to pay the Partnership a monthly credit enhancement fee equal to one-twelfth of 1% of the outstanding principal balance on the loan at the end of the month.
In June 2010, UDF I obtained the $15 million UDF I – Brockhoeft Loan from the Lender, as agent for a group of lenders. As security for the UDF I – Brockhoeft Loan, the Partnership provided the Lender with a guaranty of repayment on the UDF I – Brockhoeft Loan, which is secured by a lien on all of the Partnership’s existing and future assets. In consideration of the Partnership’s secured guaranty, commencing July 31, 2010, UDF I agreed to pay the Partnership a monthly fee equal to 3% per annum of the outstanding balance of the UDF I – Brockhoeft Loan. These fees are included in credit enhancement fees – related party income revenue.
In August 2010, the Partnership entered into a guaranty (the “UDF IV Acquisitions Guaranty”) for the benefit of CTB pursuant to which the Partnership guaranteed the repayment of up to $8 million owed to CTB with respect to a revolving line of credit loan between UDF IV Acquisitions, L.P. (“UDF IV Acquisitions”), a Delaware limited partnership, and CTB. UDF IV Acquisitions is a wholly owned subsidiary of UDF IV. The Partnership’s general partner serves as the asset manager for UDF IV. In connection with the UDF IV Acquisitions Guaranty, the Partnership entered into a letter agreement with UDF IV Acquisitions which provides for UDF IV Acquisitions to pay the Partnership a monthly credit enhancement fee equal to one-twelfth of 1% of the outstanding principal balance on the revolving line of credit at the end of the month. This fee is included in credit enhancement fees – related party income revenue.
10
As of September 30, 2010, the Partnership had 14 outstanding guarantees, including: (1) 11 limited repayment guarantees with total credit risk to the Partnership of approximately $48.9 million, of which approximately $39.9 million had been borrowed against by the debtor; and (2) 3 letters of credit issued on behalf of borrowers with total credit risk to the Partnership of approximately $2.6 million, of which approximately $2.2 million had been borrowed against by the debtors.
As of December 31, 2009, the Partnership had eight outstanding guarantees, including: (1) five limited repayment guarantees with total credit risk to the Partnership of approximately $12.4 million, of which approximately $9.7 million had been borrowed against by the debtor; and (2) three letters of credit issued on behalf of borrowers with total credit risk to the Partnership of approximately $2.6 million, of which approximately $2.2 million had been borrowed against by the debtors.
As of September 30, 2010, we had originated 56 loans, including 22 loans that have been repaid in full by the respective borrower, totaling approximately $432.5 million. We had approximately $44.2 million of commitments to be funded under the terms of mortgage notes receivable, including approximately $26.9 million of commitments for mortgage notes receivable – related party and $2.9 million for participation interest – related party.
As of December 31, 2009, we had originated 55 loans, including 18 loans that have been repaid in full by the respective borrower, totaling approximately $430 million. We had approximately $50.9 million of commitments to be funded under the terms of mortgage notes receivable, including approximately $27.2 million of commitments for mortgage notes receivable – related party and $6.2 million for participation interest – related party.
G. Unit Redemption Program
Limited partners who have held their units for at least one year may request that the Partnership repurchase their units. A limited partner wishing to have units repurchased must mail or deliver in writing a request to the Partnership indicating such desire. Prior to October 15, 2010, the purchase price of repurchased units, except as described below for redemptions upon the death of a limited partner, was equal to (i) 92% of the purchase price actually paid for any units held less than two years, (ii) 94% of the purchase price actually paid for any units held for at least two years but less than three years, (iii) 96% of the purchase price actually paid for any units held for at least three years but less than four years, (iv) 98% of the purchase price actually paid for any units held for at least four years but less than five years, and (v) the lesser of the purchase price actually paid for any units held at least five years or the then-current fair market value of the units, as determined by the most recent annual valuation of units. The purchase price for units redeemed upon the death of a limited partner was the lesser of (i) the price such limited partner actually paid for the units or (2) $20 per unit; provided, however, that the aggregate annual redemptions for all deceased limited partners was not to exceed 1% of units outstanding in the preceding 12-month period.
Effective October 15, 2010, except as described below for redemptions upon the death of a limited partner, the purchase price for the redeemed units, for the period beginning after a limited partner has held the units for a period of one year, will be (i) 92% of the Estimated Unit Value (as defined below) for any units held less than two years, (ii) 94% of the Estimated Unit Value for any units held for at least two years but less than three years, (iii) 96% of the Estimated Unit Value for any units held at least three years but less than four years, (iv) 98% of the Estimated Unit Value for any units held at least four years but less than five years; and (v) 100% of the Estimated Unit Value for any units held at least five years. The price the Partnership will pay for redeemed units will be offset by any net proceeds from capital transactions previously distributed to the redeeming limited partner in respect of such units as a return of his or her capital contributions. In addition, effective October 15, 2010, the purchase price for units redeemed upon the death of a limited partner will be 100% of the Estimated Unit Value, with the aggregate annual number of units redeemed upon death of a limited partner not to exceed 1% of units outstanding in the preceding twelve-month period. The price the Partnership will pay for units redeemed upon the death of a limited partner will be offset by any net proceeds from capital transactions previously distributed to the deceased limited partner, or his or her estate, in respect of such units as a return of capital contributions. For purposes of establishing the redemption price per unit, “Estimated Unit Value” shall mean the most recently disclosed reasonable estimated value of the Partnership’s units of limited partnership interest as determined by the general partner of the Partnership. On October 22, 2010, the general partner of the Partnership determined the Estimated Unit Value to be $20.00 per unit, which will be used as the Estimated Unit Value until such time as the general partner of the Partnership provides a new estimated value of the Partnership’s units of limited partnership interest.
11
The Partnership intends to redeem units on a quarterly basis and will not redeem in excess of 5% of the weighted average number of units outstanding during the 12-month period immediately prior to the date of redemption. Our general partner reserves the right in its sole discretion at any time and from time to time to (1) waive the one-year holding period in the event of the death or bankruptcy of a limited partner or other exigent circumstances, (2) reject any request for redemption, (3) change the purchase price for redemptions, or (4) terminate, suspend and/or reestablish our unit redemption program. Our general partner will determine from time to time whether the Partnership has sufficient excess cash from operations to repurchase units. Generally, the cash available for redemption will be limited to 1% of the operating cash flow from the previous fiscal year, plus any net proceeds from the DRIP and Secondary DRIP. If the funds set aside for the unit redemption program are not sufficient to accommodate all requests, at such time, if any, when sufficient funds become available, pending requests will be honored among all requesting limited partners as follows: first, pro rata as to redemptions upon the death or disability of a limited partner; next, pro rata as to limited partners who demonstrate, in the discretion of our general partner, another involuntary exigent circumstance, such as bankruptcy; and, finally, pro rata as to all other redemption requests, if any, until all other requests for redemption have been met. Effective June 30, 2009, in order to conserve cash and in response to increasing requests for redemptions, we have limited our redemptions primarily to those requested as a result of death, disability and exigent circumstances, to the extent our general partner determines there are sufficient funds to redeem units.
H. Related Party Transactions
Our general partner, Land Development, and certain of its affiliates receive fees in connection with the Offering and in connection with the acquisition and management of our assets. Land Development also receives reimbursement of certain costs of the Partnership.
We paid Land Development up to 1.5% of the gross offering proceeds (excluding proceeds from our DRIP and Secondary DRIP) for reimbursement of organization and offering expenses.
We pay Land Development an acquisition and origination fee (“placement fee”) of 3% of the net amount available for investment in mortgages for fees and expenses associated with the selection and origination of mortgages, including, but not limited to, legal fees and expenses, travel and communications expenses, costs of appraisals, accounting fees and expenses, and title insurance funded by us. Such fees are amortized into expense on a straight line basis.
We also reimbursed Land Development up to 0.5% of the gross offering proceeds for expenses related to bona fide due diligence expenses incurred by unaffiliated selling group members and paid by us through Land Development (except that no such due diligence expenses were or are paid with respect to sales under the DRIP or Secondary DRIP).
We paid wholesaling fees of up to 1.2% of the gross offering proceeds (excluding proceeds from sales under the DRIP and Secondary DRIP) to IMS Securities, Inc., an unaffiliated third party. From such amount, IMS Securities, Inc. reallowed up to 1% of the gross offering proceeds to wholesalers that were employed by an affiliate of our general partner. We reimbursed our general partner for such wholesaling fees paid by our general partner on behalf of the Partnership.
Land Development currently receives a promotional interest equal to 10% of cash available for distribution prior to the return to our limited partners of all of their capital contributions plus an 8% annual cumulative (non-compounded) return on their net capital contributions. After our limited partners receive a return of their net capital contributions and an 8% annual cumulative (non-compounded) return on their net capital contributions, Land Development will receive a subordinated promotional interest equal to 15% of remaining cash available for distribution (including net proceeds from a capital transaction or pro rata portion thereof).
Land Development receives a carried interest, which is an equity interest in us to participate in all distributions, other than distributions attributable to its promotional interest of cash available for distribution and net proceeds from a capital transaction. If Land Development enters into commitments to investments in mortgages in excess of 82% of the gross offering proceeds, it will be entitled to a carried interest equal to (a) 1% for the first 2.5% of commitments to investments in mortgages above 82% of the gross offering proceeds (or if commitments to investments in mortgages are above 82% but no more than 84.5%, 1% multiplied by the fractional amount of commitments to investments in mortgages above 82%), (b) 1% for the next 2% of additional commitments to investments in mortgages above 84.5% of the gross offering proceeds (or if commitments to investments in mortgages are above 84.5% but no more than 86.5%, 1% multiplied by the fractional amount of commitments to investments in mortgages above 84.5%) and (c) 1% for each additional 1% of additional commitments to investments in mortgages above 86.5% of the gross offering proceeds (or a fractional percentage equal to the fractional amount of any 1% of additional commitments to investments in mortgages).
12
For services rendered in connection with the servicing of our loans, we pay a monthly mortgage servicing fee to Land Development equal to one-twelfth of 0.25% of our aggregate outstanding development mortgage notes receivable balance as of the last day of the month. Such fees are included in general and administrative expenses.
UMTH Funding Services, L.P. (“Funding Services”), an affiliate of Land Development, received 0.8% of the gross offering proceeds (excluding proceeds from sales under our DRIP or Secondary DRIP) as a marketing support fee for marketing and promotional services provided to selling group members. An additional marketing support fee was paid directly to unaffiliated participating selected dealers in an amount determined in the sole discretion of Land Development, but which did not exceed 1% of the gross offering proceeds (excluding proceeds from sales under our DRIP or Secondary DRIP).
During 2009, Funding Services was reimbursed for operating expenses incurred in assisting Land Development in our management. Effective January 1, 2010, we began reimbursing UMTH General Services, L.P. (“General Services”), an affiliate of Land Development, instead of Funding Services, for operating expenses incurred by General Services in assisting Land Development in our management.
The chart below summarizes the approximate payments of related party fees and reimbursements associated with the Offering and origination and management of our assets for the nine months ended September 30, 2010 and 2009:
|
For the Nine Months Ended
|
||||||
|
Payee
|
Purpose
|
September 30, 2010
|
September 30, 2009
|
|||
|
Land Development
|
||||||
|
Organization & Offering Expenses
|
$ -
|
$ 533,000
|
||||
|
Due Diligence Fees
|
-
|
178,000
|
||||
|
Wholesaler Reimbursement
|
-
|
127,000
|
||||
|
Acquisition & Origination Expenses and Fees
|
231,000
|
1,195,000
|
||||
|
Promotional Interest
|
2,600,000
|
2,612,000
|
||||
|
Carried Interest
|
380,000
|
384,000
|
||||
|
Mortgage Servicing Fee
|
605,000
|
524,000
|
||||
|
Funding Services
|
||||||
|
Marketing Support Fees
|
-
|
360,000
|
||||
|
Operating Expense Reimbursement
|
-
|
702,000
|
||||
|
General Services
|
||||||
|
Operating Expense Reimbursement
|
336,000
|
-
|
||||
In January 2007, we originated a secured promissory note to OU Land Acquisition II, L.P., a Texas limited partnership and wholly owned subsidiary of UDF I, in the principal amount of approximately $1.6 million, and in connection therewith, as required by our Partnership Agreement and the NASAA Mortgage Program Guidelines, we obtained an opinion from an independent advisor stating that such loan is fair and at least as reasonable to us as a transaction with an unaffiliated party in similar circumstances. In July 2009, such note was paid in full. Such secured promissory note, which bore interest at a rate of 15% per annum, was collateralized by a second lien deed of trust on approximately 101 acres of land located in Texas and was payable on June 14, 2010. For the three and nine months ended September 30, 2009, we had recognized approximately $6,000 and $150,000, respectively, of interest income – related party related to such note. We did not recognize any interest income – related party on such note for the three and nine months ended September 30, 2010.
In September 2007, we originated a secured promissory note to UDF PM, LLC, a Texas limited liability company and wholly-owned subsidiary of UDF I, in the principal amount of approximately $6.4 million, and in connection therewith, as required by our Partnership Agreement and the NASAA Mortgage Program Guidelines, we obtained an opinion from an independent advisor stating that such loan is fair and at least as reasonable to us as a transaction with an unaffiliated party in similar circumstances. Such secured promissory note, which bears an interest rate of 15% per annum, is collateralized by a second lien deed of trust on approximately 335 finished lots and 15 acres of land located in Texas and matured on September 4, 2010, but remains outstanding as of September 30, 2010. For the three months ended September 30, 2010 and 2009, we had recognized approximately $289,000 and $238,000, respectively, of interest income – related party related to such note. For the nine months ended September 30, 2010 and 2009, we had recognized approximately $828,000 and $523,000, respectively, of interest income – related party related to such note.
13
In November 2007, we originated a secured promissory note to United Development Funding X, L.P. (“UDF X”), a Delaware limited partnership and wholly-owned subsidiary of our general partner, in the principal amount of approximately $70 million, and in connection therewith, as required by our Partnership Agreement and the NASAA Mortgage Program Guidelines, we obtained an opinion from an independent advisor stating that such loan is fair and at least as reasonable to us as a transaction with an unaffiliated party in similar circumstances. In August 2008, we amended this secured promissory note to reduce the commitment amount to $25 million. Such secured promissory note, which bears an interest rate of 15% per annum, is collateralized by a pledge of 100% of the ownership interests in UDF X and is payable on November 11, 2012. For the three months ended September 30, 2010 and 2009, we had recognized approximately $876,000 and $940,000, respectively, of interest income – related party related to such note. For the nine months ended September 30, 2010 and 2009, we had recognized approximately $2.6 million and $2.0 million, respectively, of interest income – related party related to such note.
In August 2008, we originated a secured revolving line of credit to UDF LOF in the principal amount of up to $25 million, pursuant to a Secured Line of Credit Promissory Note (the “UDF LOF Note”). The UDF LOF Note, which bears interest at a base rate equal to 15% per annum, is secured by a lien of all of UDF LOF’s existing and future acquired assets and is payable on August 20, 2011. In connection therewith, as required by our Partnership Agreement and the NASAA Mortgage Program Guidelines, we obtained an opinion from an independent advisor stating that the UDF LOF Note is fair and at least as reasonable to us as a transaction with an unaffiliated party in similar circumstances. In January 2010, the balance of the UDF LOF Note was paid in full, although UDF LOF still has the ability to draw on the UDF LOF Note until it matures. We did not recognize any interest income – related party related to the UDF LOF Note for the three months ended September 30, 2010. For the three months ended September 30, 2009, we recognized approximately $290,000 of interest income – related party related to the UDF LOF Note. For the nine months ended September 30, 2010 and 2009, we recognized approximately $0 and $1.4 million, respectively, of interest income – related party related to the UDF LOF Note.
In August 2008, we originated a secured promissory note with Buffington Capital Homes, Ltd. (“Buffington Capital”), a Texas limited partnership, in the principal amount of $2.5 million (the “Buffington Capital Lot Inventory Loan”). Effective November 30, 2009, Buffington Capital merged into Buffington Signature Homes, LLC (“Buffington Signature”), a Texas limited liability company, whereby Buffington Signature was the surviving entity following the merger. Buffington Homebuilding Group, LTD. (“Buffington Homebuilding Group”), a Texas limited partnership, is the sole member of Buffington Signature and Land Development has a minority partner interest in Buffington Homebuilding Group. In connection with the Buffington Capital Lot Inventory Loan, as required by our Partnership Agreement and the NASAA Mortgage Program Guidelines, we obtained an opinion from an independent advisor stating that the Buffington Capital Lot Inventory Loan is fair and at least as reasonable to us as a transaction with an unaffiliated party in similar circumstances. The Buffington Capital Lot Inventory Loan, which bears interest at the lower of 14% per annum or the highest rate allowed by law, is secured by a first lien on finished lot inventory that is owned and controlled by Buffington Signature. Buffington Signature’s payment and performance is guaranteed by Buffington Land, Ltd. (“Buffington Land”), an unaffiliated Texas limited partnership, and is payable on August 12, 2011, pursuant to the Extension Agreement and Second Amendment to Loan Agreement entered into in August 2010.
In August 2008, we originated a secured promissory note with Buffington Texas Classic Homes, Ltd. (“Buffington Classic”), a Texas limited partnership, in the principal amount of $2 million (the “Buffington Classic Lot Inventory Loan”). Effective November 30, 2009, Buffington Classic merged into Buffington Texas Classic Homes, LLC (“Buffington Texas Classic”), a Texas limited liability company, whereby Buffington Texas Classic was the surviving entity following the merger. Buffington Homebuilding Group is the sole member of Buffington Texas Classic and Land Development has a minority partner interest in Buffington Homebuilding Group. In connection with the Buffington Classic Lot Inventory Loan, as required by our Partnership Agreement and the NASAA Mortgage Program Guidelines, we obtained an opinion from an independent advisor stating that the Buffington Classic Lot Inventory Loan is fair and at least as reasonable to us as a transaction with an unaffiliated party in similar circumstances. The Buffington Classic Lot Inventory Loan, which bears interest at the lower of 14% per annum or the highest rate allowed by law, is secured by a first lien on finished lot inventory that is owned and controlled by Buffington Texas Classic. Buffington Texas Classic’s payment and performance is guaranteed by Buffington Land and is payable on August 21, 2011, pursuant to the Extension Agreement and Second Amendment to Loan Agreement entered into in August 2010.
14
In March 2010, the Partnership entered into two participation agreements (collectively, the “Buffington Participation Agreements”) with UDF IV, pursuant to which the Partnership sold a 100% participation interest in the Buffington Capital Lot Inventory Loan and the Buffington Classic Lot Inventory Loan (collectively, the “Lot Inventory Loans”) to UDF IV. Pursuant to the Buffington Participation Agreements, UDF IV will participate in the Lot Inventory Loans by funding the Partnership’s lending obligations under the Lot Inventory Loans up to an aggregate maximum amount of $4.5 million. The Buffington Participation Agreements give UDF IV the right to receive repayment of all principal and accrued interest relating to amounts funded by UDF IV under the Buffington Participation Agreements. The interest rate for the Lot Inventory Loans is the lower of 14% per annum or the highest rate allowed by law. The amount due to UDF IV under the Buffington Participation Agreements is paid as Buffington Signature and Buffington Texas Classic (collectively, “Buff Homes”) repay the Lot Inventory Loans. For each loan originated to it, Buff Homes is required to pay interest monthly and to repay the principal advanced to it no later than 12 months following the origination of the loan. The Lot Inventory Loans mature in August 2011.
The Partnership is required to purchase back the UDF IV participation interest in the Lot Inventory Loans (i) upon a foreclosure of the Partnership’s assets by its lenders, (ii) upon the maturity of the Lot Inventory Loans, or (iii) at any time upon 30 days prior written notice from UDF IV. In such event, the purchase price paid to UDF IV will be equal to the outstanding principal amount of the Lot Inventory Loans on the date of termination, together with all accrued interest due thereon, plus any other amounts due to UDF IV under the Buffington Participation Agreements.
The Partnership will continue to manage and control the Lot Inventory Loans while UDF IV owns a participation interest in the Lot Inventory Loans. Pursuant to the Buffington Participation Agreements, UDF IV has appointed the Partnership as its agent to act on behalf of UDF IV with respect to all aspects of the Lot Inventory Loans; however, the Partnership must obtain consent from UDF IV for any modification or amendment of the Lot Inventory Loans, the acceleration of the Lot Inventory Loans and the enforcement of the rights and remedies available to the holder of the Lot Inventory Loans.
For the three months ended September 30, 2010, we did not recognize any interest income – related party (net of interest owed to UDF IV pursuant to the Buffington Participation Agreements) related to the Buffington Capital Lot Inventory Loan. For the three months ended September 30, 2009, we recognized approximately $26,000 of interest income – related party related to the Buffington Capital Lot Inventory Loan. For the nine months ended September 30, 2010 and 2009, we recognized approximately $16,000 and $111,000, respectively, of interest income – related party (net of interest owed to UDF IV pursuant to the Buffington Participation Agreements) related to the Buffington Capital Lot Inventory Loan. For the three months ended September 30, 2010, we did not recognize any interest income – related party (net of interest owed to UDF IV pursuant to the Buffington Participation Agreements) related to the Buffington Classic Lot Inventory Loan. For the three months ended September 30, 2009, we recognized approximately $29,000 of interest income – related party related to the Buffington Classic Lot Inventory Loan. For the nine months ended September 30, 2010 and 2009, we recognized approximately $10,000 and $74,000, respectively, of interest income – related party (net of interest owed to UDF IV pursuant to the Buffington Participation Agreements) related to the Buffington Classic Lot Inventory Loan.
15
In September 2008, we originated an additional secured promissory note with Buffington Classic, in the principal amount of approximately $290,000. In connection therewith, as required by our Partnership Agreement and the NASAA Mortgage Program Guidelines, we obtained an opinion from an independent advisor stating that such note is fair and at least as reasonable to us as a transaction with an unaffiliated party in similar circumstances. We provided a letter of credit on behalf of Buffington Classic in the amount of approximately $290,000, which was terminated in September 2009. If the letter of credit was drawn upon, then an amount equal to the drawn amount would have been automatically advanced under the secured promissory note. Such secured note bore interest at 14% per annum and represented a 12-month note period with two 12-month renewal options. Prior to the termination of the letter of credit, no amount had been drawn upon such note; thus, no interest income – related party was recognized for the three or nine months ended September 30, 2010 or 2009 related to such note.
In September 2008, we entered into an Economic Interest Participation Agreement with UMT pursuant to which the Partnership purchased (i) an economic interest in a $45 million revolving credit facility (the “UMT Loan”) from UMT to UDF I and (ii) a purchase option to acquire a full ownership participation interest in the UMT Loan (the “Option”). In connection therewith, as required by our Partnership Agreement and the NASAA Mortgage Program Guidelines, we obtained an opinion from an independent advisor stating that the Economic Interest Participation Agreement is fair and at least as reasonable to us as a transaction with an unaffiliated party in similar circumstances. The UMT Loan was subsequently amended to $60 million as evidenced by a Third Amended and Restated Secured Line of Credit Promissory Note dated as of August 17, 2009 (the “UMT Note”). The UMT Loan matures on December 31, 2010, as evidenced by the Loan Extension Agreement and First Amendment to Third Amended and Restated Secured Line of Credit Promissory Note dated December 31, 2009. The UMT Loan is secured by a security interest in the assets of UDF I including UDF I’s land development loans and equity investments pursuant to the First Amended and Restated Security Agreement dated as of September 30, 2004, executed by UDF I in favor of UMT (the “Security Agreement”).
Pursuant to the Economic Interest Participation Agreement, each time UDF I requests an advance of principal under the UMT Note, we will fund the required amount to UMT for application to its funding obligation to UDF I under the UMT Loan, and our economic interest in the UMT Loan increases proportionately. Our economic interest in the UMT Loan gives us the right to receive payment from UMT of principal and accrued interest relating to amounts funded by us to UMT which are applied towards UMT’s funding obligations to UDF I under the UMT Loan. We may abate our funding obligations under the Economic Interest Participation Agreement at any time for a period of up to twelve months by giving UMT notice of the abatement.
The Option gives us the right to convert our economic interest into a full ownership participation interest in the UMT Loan at any time by giving written notice to UMT and paying an exercise price of $100. The participation interest includes all rights incidental to ownership of the UMT Note and the Security Agreement, including participation in the management and control of the UMT Loan. UMT will continue to manage and control the UMT Loan while we own an economic interest in the UMT Loan. If we exercise our Option and acquire a participation interest in the UMT Loan, UMT will serve as the loan administrator but both UMT and we will participate in the control and management of the UMT Loan. The UMT Note matures on December 31, 2010. The purpose of the UMT Loan is to finance UDF I’s investments in real estate development projects. The UMT Loan interest rate is the lower of 14% per annum or the highest rate allowed by law. UDF I may use the UMT Loan proceeds to finance indebtedness associated with the acquisition of any assets and to seek income that qualifies under the Real Estate Investment Trust provisions of the Internal Revenue Code of 1986, as amended, to the extent such indebtedness, including indebtedness financed by funds advanced under the UMT Loan and indebtedness financed by funds advanced from any other source, including senior debt, is no less than 68% of the appraised value of all subordinate loans and equity interests for land development and/or land acquisition owned by UDF I and 75% for first lien secured loans for land development and/or acquisitions owned by UDF I. For the three months ended September 30, 2010 and 2009, we recognized approximately $1.8 million and $1.6 million, respectively, of interest income – related party related to this Economic Interest Participation Agreement. For the nine months ended September 30, 2010 and 2009, we recognized approximately $5.3 million and $4.6 million, respectively, of interest income – related party related to this Economic Interest Participation Agreement.
16
The UMT Loan is subordinate to the UDF I – Brockhoeft loan. As of September 30, 2010 and December 31, 2009, approximately $57.9 million and $54.7 million, respectively, in assets related to the Economic Interest Participation Agreement is included in participation interest – related party.
Effective December 2008, the Partnership modified a secured promissory note in the principal amount of approximately $8.1 million that it had originated with UDF I in December 2006 in the principal amount of approximately $6.9 million. In connection with the origination of such promissory note, and as required by our Partnership Agreement and the NASAA Mortgage Program Guidelines, we obtained an opinion from an independent advisor stating that such loan is fair and at least as reasonable to us as a transaction with an unaffiliated party in similar circumstances. UDF I’s obligations under such note are secured by a first lien deed of trust filed on 190 undeveloped, entitled single-family home lots located in Thornton, Colorado. Such note bore interest at a base rate equal to 12% per annum and interest payments were due monthly. Such note matured on June 30, 2009, but remains outstanding as of September 30, 2010. For the three months ended September 30, 2010 and 2009, we had recognized approximately $312,000 and $277,000, respectively, of interest income – related party related to such note. For the nine months ended September 30, 2010 and 2009, we had recognized approximately $895,000 and $770,000, respectively, of interest income – related party related to such note.
In February 2009, the Partnership established the Deposit Account at LegacyTexas (as discussed in Note F). The fees paid to the Partnership by UMTH Lending in connection therewith are included in our credit enhancement fees – related party income account and are approximately $11,000 for each of the three months ended September 30, 2010 and 2009 and approximately $34,000 and $27,000 for the nine months ended September 30, 2010 and 2009, respectively.
In May 2009, UDF Northpointe, LLC, an unaffiliated third party, assigned its obligations associated with its promissory note and its interests in the related collateral by special warranty deed to UDF Northpointe II, LP (“Northpointe II”), a wholly owned subsidiary of UDF I. Concurrent with this assignment, UDF Northpointe, LLC entered into a contract for deed with Northpointe II whereby UDF Northpointe, LLC agreed to make payments to Northpointe II for all debt service payments in consideration for Northpointe II transferring ownership and possession of the collateral back to UDF Northpointe, LLC. For the three months ended September 30, 2010 and 2009, we had recognized approximately $283,000 and $229,000, respectively, of interest income – related party related to such note. For the nine months ended September 30, 2010 and 2009, we had recognized approximately $797,000 and $373,000, respectively, of interest income – related party related to such note.
In July 2009, we originated a secured promissory note to OU Land Acquisitions, LP, a Texas limited partnership and wholly-owned subsidiary of UDF I (“OU Land”), in the principal amount of approximately $2.0 million, and in connection therewith, as required by our Partnership Agreement and the NASAA Mortgage Program Guidelines, we obtained an opinion from an independent advisor stating that such loan is fair and at least as reasonable to us as a transaction with an unaffiliated party in similar circumstances. Such secured promissory note, which bears an interest rate of 15% per annum, is collateralized by a second lien on 56 acres of land located in Houston, Texas, and matured on June 14, 2010, but remains outstanding as of September 30, 2010. For the three months ended September 30, 2010 and September 30, 2009, we had recognized approximately $96,000 and $74,000, respectively, of interest income – related party related to such note. For the nine months ended September 30, 2010 and September 30, 2009, we had recognized approximately $273,000 and $74,000, respectively, of interest income – related party related to such note.
In September 2009, the Partnership entered into the $15 million Credit Facility (as discussed in Note D). In conjunction with the Credit Facility, the Partnership paid Funding Services a debt placement fee equal to 1% ($150,000) of the Credit Facility, which is being amortized over the term of the Credit Facility.
In December 2008, the Partnership entered into a loan participation agreement (the “UMT BL Participation Agreement”) with UMT, pursuant to which UMT purchased a participation interest in a finished lot loan (the “BL Loan”) from the Partnership to Buffington Land. In January 2010, the Partnership entered into a second loan participation agreement (the “UDF IV BL Participation Agreement”) with UDF IV, pursuant to which UDF IV purchased a participation interest in the BL Loan. The BL Loan is evidenced and was initially secured by a first lien deed of trust recorded against approximately 67 finished residential lots in the Bridges at Bear Creek residential subdivision in the City of Austin, Travis County, Texas, a promissory note, assignments of certain lot sale contracts and earnest money, and other loan documents.
17
Pursuant to both the UMT BL Participation Agreement and the UDF IV BL Participation Agreement, UMT and UDF IV are each entitled to receive their proportionate share of the outstanding principal amount of the BL Loan (based on the purchase prices of their respective interests), plus their proportionate share of accrued interest thereon (collectively, the “BL Participation Interests”). UMT and UDF IV have no obligations to advance funds to Buffington Land under the BL Loan or to increase their respective participation interests in the BL Loan. The interest rate under the BL Loan is the lower of 14% per annum or the highest rate allowed by law. The BL Participation Interests are repaid as Buffington repays the BL Loan. Buffington Land is required to pay interest monthly and to repay a portion of principal upon the sale of residential lots covered by the deed of trust. The BL Loan is due and payable in full on June 30, 2011.
On April 9, 2010, the Partnership entered into an Agent – Participant Agreement with UDF IV (the “Agent Agreement”). In accordance with the Agent Agreement, the Partnership will continue to manage and control the BL Loan and each of UMT and UDF IV has appointed the Partnership as its agent to act on its behalf with respect to all aspects of the BL Loan, provided that, pursuant to the Agent Agreement, UDF IV retains approval rights in connection with any material decisions pertaining to the administration and services of the loan and, with respect to any material modification to the loan and in the event that the loan becomes non-performing, UDF IV shall have effective control over the remedies relating to the enforcement of the loan, including ultimate control of the foreclosure process. As of September 30, 2010, UMT’s participation interest had been repaid and UDF IV owned a 100% participation interest in the BL Loan.
Effective June 30, 2010, the Partnership entered into two additional participation agreements with UDF IV (collectively, the “UDF IV Travis Ranch Participation Agreements”).
Under the first of the UDF IV Travis Ranch Participation Agreements, UDF IV purchased a participation interest in a finished lot loan made by the Partnership to CTMGT Travis Ranch II, LLC, an unaffiliated entity (the “TR II Finished Lot Loan”). The TR II Finished Lot Loan was initially secured by a subordinate, second lien deed of trust recorded against approximately 288 finished residential lots in the Travis Ranch residential subdivision located in Kaufman County, Texas. The TR II Finished Lot Loan is guaranteed by the limited liability company owners of the borrower and by the principal of the borrower.
UDF IV is entitled to receive repayment of 100% of its outstanding principal amount on the TR II Finished Lot Loan, plus its proportionate share of accrued interest thereon, over time as the borrower repays the loan. UDF IV has no obligation to increase its participation interest in the TR II Finished Lot Loan. The interest rate under the TR II Finished Lot Loan is the lower of 15% or the highest rate allowed by law.
Under the second of the UDF IV Travis Ranch Participation Agreements, UDF IV purchased a participation interest in a “paper” lot loan from the Partnership to CTMGT Travis Ranch, LLC, an unaffiliated entity (the “TR Paper Lot Loan”). A “paper” lot is a residential lot shown on a plat that has been accepted by the city or county, but which is currently undeveloped or under development. The borrower owns approximately 1,800 paper lots in the Travis Ranch residential subdivision of Kaufman County, Texas. The TR Paper Lot Loan is secured by a pledge of the equity interests in the borrower instead of a real property lien, effectively subordinating the Paper Lot Loan to all real property liens. The TR Paper Lot Loan is guaranteed by the limited liability company owners of the borrower and by the principal of the borrower.
UDF IV is entitled to receive repayment of 100% of its outstanding principal on the TR Paper Lot Loan, plus its proportionate share of accrued interest thereon, over time as the borrower repays the TR Paper Lot Loan. UDF IV has no obligation to increase its participation interest in the TR Paper Lot Loan. The interest rate under the TR Paper Lot Loan is the lower of 15% or the highest rate allowed by law.
As of September 30, 2010, UDF IV owns a 100% participation interest in both the TR II Finished Lot Loan and TR Paper Lot Loan.
An affiliate of Land Development serves as the advisor to UMT and UDF IV. Land Development serves as the asset manager of UDF I and UDF IV.
18
I. Subsequent Events
In February 2009, the Financial Industry Regulatory Authority (“FINRA”) issued a notice to broker-dealers that sell the units of non-traded real estate direct participation programs, such as the Partnership. This notice informed broker-dealers that they may not report in a customer account statement an estimated unit value that is developed from data more than 18 months old, which in effect requires non-traded direct participation programs to provide broker-dealers with an estimated value per unit of limited partnership interest within 18 months of the completion of their offering stage. The Partnership completed its offering stage in April 2009. Accordingly, to meet FINRA guidelines, on October 22, 2010, Land Development approved an estimated value of the Partnership’s units of limited partnership interest of $20.00 per unit. In making a determination of the estimated value of the Partnership’s units, Land Development assessed the Partnership’s assets, less liabilities, per unit and the execution of the Partnership’s business model set forth in the prospectus regarding the Partnership’s initial public offering of its limited partnership interests. Land Development also engaged an independent firm specializing in the valuation of businesses, partnerships and intellectual property, which derived a range of estimated values per unit using various valuation analyses. The estimated value per unit determined by Land Development is within the range of values derived by the independent firm.
In November 2010, UMTH Lending refinanced the UMTH Lending Loan with United Texas Bank (“UTB”). In conjunction with this refinance, the Partnership deposited $1.5 million into a money market account (the “UTB Deposit Account”) with UTB for the purpose of providing collateral to UTB for the benefit of UMTH Lending. The UTB Deposit Account replaced the Deposit Account previously established with LegacyTexas and discussed in Note F. The Partnership provided UTB a security interest in the UTB Deposit Account as further collateral for a loan (the “UTB-UMTH Lending Loan”) obtained by UMTH Lending from UTB. In consideration of the Partnership providing the UTB Deposit Account as collateral for the UTB-UMTH Lending Loan, UMTH Lending agreed to pay the Partnership a fee equal to 3% per annum of the amount outstanding in the UTB Deposit Account for each year that the UTB Deposit Account secures the UTB-UMTH Lending Loan.
Item 2. Management’s Discussion and Analysis of Financial Condition and Results of Operations.
The following discussion and analysis should be read in conjunction with our accompanying financial statements and the notes thereto:
Forward-Looking Statements
This section of the quarterly report contains forward-looking statements, including discussion and analysis of us, our financial condition, amounts of anticipated cash distributions to our limited partners in the future and other matters. These forward-looking statements are not historical facts but are the intent, belief or current expectations of our management based on their knowledge and understanding of our business and industry. Words such as “may,” “anticipates,” “expects,” “intends,” “plans,” “believes,” “seeks,” “estimates,” “would,” “could,” “should” and variations of these words and similar expressions are intended to identify forward-looking statements. These statements are not guarantees of future performance and are subject to risks, uncertainties and other factors, some of which are beyond our control, are difficult to predict and could cause actual results to differ materially from those expressed or forecasted in the forward-looking statements.
Forward-looking statements that were true at the time made may ultimately prove to be incorrect or false. We caution you not to place undue reliance on forward-looking statements, which reflect our management’s view only as of the date of this Quarterly Report. We undertake no obligation to update or revise forward-looking statements to reflect changed assumptions, the occurrence of unanticipated events or changes to future operating results. Factors that could cause actual results to differ materially from any forward-looking statements made in this Form 10-Q include changes in general economic conditions, changes in real estate conditions, development costs that may exceed estimates, development delays, increases in interest rates, residential lot take down or purchase rates or our borrowers’ inability to sell residential lots, and the potential need to fund development costs not completed by the initial borrower or other capital expenditures out of operating cash flows. The forward-looking statements should be read in light of the risk factors identified in the “Risk Factors” section of our Annual Report on Form 10-K for the year ended December 31, 2009, which was filed with the Securities and Exchange Commission, and the discussion of material trends affecting our business elsewhere in this report.
19
On May 15, 2006, our Registration Statement on Form S-11 (File No. 333-127891), covering the Offering of up to 12,500,000 units of limited partnership interest to be issued in the primary offering at a price of $20 per unit, was declared effective under the Securities Act of 1933, as amended. The Registration Statement on Form S-11 also covered up to 5,000,000 units of limited partnership interest to be issued pursuant to our DRIP for $20 per unit. We had the right to reallocate the units of limited partnership interest we were offering between the primary offering and our DRIP, and pursuant to Supplement No. 8 to our prospectus regarding the Offering, which was filed with the Securities and Exchange Commission on September 4, 2008, we reallocated the units being offered to be 16,250,000 units offered pursuant to the primary offering and 1,250,000 units offered pursuant to the DRIP. Pursuant to Supplement No. 11 to our prospectus regarding the Offering, which was filed with the Securities and Exchange Commission on March 6, 2009, we further reallocated the units being offered to be 16,500,000 units offered pursuant to the primary offering and 1,000,000 units offered pursuant to the DRIP. The primary offering component of the Offering was terminated on April 23, 2009. We extended the offering of our units of limited partnership interest pursuant to our DRIP until the earlier of the sale of all units of limited partnership interest being offered pursuant to our DRIP or May 15, 2010; provided, however, that our general partner was permitted to terminate the offering of units pursuant to our DRIP at any earlier time.
On June 9, 2009, we held a Special Meeting of our limited partners as of April 13, 2009, at which our limited partners approved three proposals to amend certain provisions of our Partnership Agreement for the purpose of making available additional units of limited partnership interest for sale pursuant to an Amended and Restated Distribution Reinvestment Plan. On June 12, 2009, we registered 5,000,000 additional units to be offered pursuant to our Secondary DRIP in a Registration Statement on Form S-3 (File No. 333-159939). As such, we ceased offering units under the DRIP portion of the Offering as of July 21, 2009 and concurrently commenced our offering of units pursuant to the Secondary DRIP, which is currently ongoing.
We will experience a relative decrease in liquidity as available funds are expended in connection with the funding and acquisition of mortgage loans and as amounts that may be drawn under a new credit facility are repaid.
Critical Accounting Policies and Estimates
Management’s discussion and analysis of financial condition and results of operations are based upon our financial statements, which have been prepared in accordance with GAAP. GAAP consists of a set of standards issued by the FASB and other authoritative bodies in the form of FASB Statements, Interpretations, FASB Staff Positions, Emerging Issues Task Force consensuses and American Institute of Certified Public Accountants Statements of Position, among others. The FASB recognized the complexity of its standard-setting process and embarked on a revised process in 2004 that culminated in the release on July 1, 2009 of the ASC. The ASC does not change how the Partnership accounts for its transactions or the nature of related disclosures made. Rather, the ASC results in changes to how the Partnership references accounting standards within its reports. This change was made effective by the FASB for periods ending on or after September 15, 2009. The Partnership has updated references to GAAP in this Quarterly Report on Form 10-Q to reflect the guidance in the ASC. The preparation of these financial statements requires our management to make estimates and assumptions that affect the reported amounts of assets, liabilities, revenues and expenses, and related disclosure of contingent assets and liabilities. On a regular basis, we evaluate these estimates, including investment impairment. These estimates are based on management’s historical industry experience and on various other assumptions that management believes to be reasonable under the circumstances. Actual results may differ from these estimates. We have identified our most critical accounting policies to be the following:
Revenue Recognition
Interest income on mortgage investments (including related party transactions) is recognized over the life of the loan and recorded on the accrual basis. Income recognition is suspended for loans at either the date at which payments become 90 days past due or when, in the opinion of management, a full recovery of income and principal becomes doubtful. Income recognition is resumed when the loan becomes contractually current and performance is demonstrated to be resumed. As of September 30, 2010 and 2009, we were suspending income recognition on one mortgage note receivable.
20
Credit enhancement fee – related party income is generated by fees charged to related third parties for credit enhancements provided to lenders by the Partnership on behalf of the third parties. Income related to credit enhancements is earned as fees are paid, based on the terms of the credit enhancement agreement. As of September 30, 2010, the Partnership was providing six credit enhancements to related parties.
We generate mortgage and transaction service revenues by originating and acquiring mortgage notes receivable and other loans. In accordance with ASC 310-20, Receivables-Nonrefundable Fees and Other Costs (“ASC 310-20”), we defer recognition of income from nonrefundable commitment fees paid by the borrowers and recognize such amount on a straight-line basis over the expected life of such notes. The Partnership also expenses a 3% placement fee paid to the general partner to provide for processing and origination costs (including, but not limited to, legal fees and expenses, travel and communications expenses, costs of appraisals, accounting fees and expenses, and title insurance funded by us) associated with mortgage notes receivable or profit participation interest held by the Partnership on a straight-line basis. As of September 30, 2010 and December 31, 2009, approximately $3.5 million and $3.6 million, respectively, of such net deferred fees have been offset against mortgage notes receivable. Approximately $656,000 and $495,000 of net deferred fees have been offset against mortgage notes receivable – related party as of September 30, 2010 and December 31, 2009, respectively. As of September 30, 2010 and December 31, 2009, approximately $810,000 and $958,000, respectively, of deferred fees are included in participation interest – related party.
Determination of the Allowance for Loan Losses
The allowance for loan losses is our estimate of incurred losses in our portfolio of mortgage notes receivable, mortgage notes receivable – related party and participation interest – related party. We periodically perform a detailed review of our portfolio of mortgage notes and other loans to determine if impairment has occurred and to assess the adequacy of the allowance for loan losses. We charge additions to the allowance for loan losses to current period earnings through a provision for loan losses. Amounts determined to be uncollectible are charged off, while amounts recovered on previously charged off accounts increase the allowance (see Note B to the accompanying financial statements).
Mortgage Notes Receivable and Mortgage Notes Receivable – Related Party
Mortgage notes receivable and mortgage notes receivable – related party are recorded at the lower of cost or estimated net realizable value. The mortgage investments are collateralized by land and related improvements to residential property owned by the borrowers and/or the ownership interests of the borrower. Currently, the mortgage notes receivable have a term ranging from five to 51 months. None of such mortgages are insured or guaranteed by a federally owned or guaranteed mortgage agency. We originate and/or acquire all mortgage notes receivable and intend to hold the mortgage notes receivable for the life of the notes.
Participation Interest – Related Party
Participation interest – related party represents an Economic Interest Participation Agreement with UMT, pursuant to which we purchased (i) an economic interest in the UMT Loan and (ii) a purchase option to acquire a full ownership participation interest in the UMT Loan (see Note H to the accompanying financial statements).
Cash Flow Distributions
Cash available for distributions represents the funds received by us from operations (other than proceeds from a capital transaction or a liquidating distribution), less cash used by us to pay our expenses and debt payments, and amounts set aside to create a retained earnings reserve (currently at 9.5% of our net income; the retained earnings reserve is intended to recover some of the organization and offering expenses incurred in connection with the Offering). Our general partner receives a monthly distribution for promotional and carried interest from the cash available for distributions. Monthly distributions are currently paid to our limited partners at a 9.75% annualized return on a pro rata basis based on the number of days in the Partnership. Retained earnings would contain a surplus if the cash available for distributions less the 9.5% reserve exceeded the monthly distribution to the general and limited partners. Retained earnings would contain a deficit if cash available for distributions less the 9.5% reserve is less than the monthly distribution to general and limited partners. It is the intent of management to monitor and distribute such surplus, if any, on an annual basis. The chart below summarizes the approximate amount of distributions to our general partner and limited partners and the retained earnings deficit as of September 30, 2010 and December 31, 2009:
|
As of
|
As of
|
|||
|
September 30,
|
December 31,
|
|||
|
2010
|
2009
|
|||
|
General Partner
|
$ 9,752,000
|
$ 6,789,000
|
||
|
Limited Partners
|
80,776,000
|
(1)
|
55,337,000
|
(2)
|
|
Retained Earnings Reserve
|
3,774,000
|
844,000
|
||
|
Retained Earnings Deficit
|
(5,498,000)
|
(5,413,000)
|
(1) approximately $51.5 million paid in cash and approximately $29.2 million reinvested in 1,462,425 units of limited partnership interest under the DRIP and Secondary DRIP.
(2) approximately $34.8 million paid in cash and approximately $20.5 million reinvested in 1,026,716 units of limited partnership interest under the DRIP and Secondary DRIP.
21
Results of Operations
The three months ended September 30, 2010 as compared to the three months ended September 30, 2009.
Revenues
Interest income (including related party interest income) for the three months ended September 30, 2010 and 2009 was approximately $11.8 million and $10.7 million, respectively. The increase in interest income for the three months ended September 30, 2010 is primarily the result of our increased mortgage notes receivable portfolio (including related party transactions) and participation interest – related party portfolios of approximately $328.1 million as of September 30, 2010, compared to approximately $299.2 million as of September 30, 2009.
Credit enhancement fees – related party for the three months ended September 30, 2010 and 2009 was approximately $221,000 and $61,000, respectively. The increase was primarily the result of fees earned associated with the guaranty provided on the UDF I – Brockhoeft Loan (discussed in Note F).
Mortgage and transaction service revenues for the three months ended September 30, 2010 and 2009 was approximately $512,000 and $445,000, respectively. This increase was primarily the result of increased commitment fee income on mortgage notes receivable. The Partnership generates mortgage and transaction service revenues by originating and acquiring mortgage notes receivable and other loans. In accordance with ASC 310-20, we defer recognition of income from nonrefundable commitment fees and recognize such income on a straight-line basis over the expected life of such notes.
We expect revenues to increase commensurate with the additional proceeds raised from the offering of units pursuant to the Secondary DRIP, our continued deployment of funds available in a diversified manner to the borrowers and markets in which we have experience and as markets dictate in accordance with economic factors conducive for a stable residential market, and our reinvestment of proceeds from loans that are repaid.
Expenses
Interest expense for the three months ended September 30, 2010 and 2009 was approximately $378,000 and $33,000, respectively. Interest expense represents interest associated with the Credit Facility that we had entered into with Wesley J. Brockhoeft (previously defined as “Lender”) in September 2009. The Credit Facility has been utilized as transitory indebtedness to provide liquidity and to reduce and avoid the need for large idle cash reserves, including usage to fund identified investments pending receipt of proceeds from the partial or full repayment of loans. The Credit Facility has been used as a portfolio administration tool and not to provide long-term or permanent leverage on our investments.
General and administrative expense remained relatively unchanged for the three months ended September 30, 2010 and 2009 at approximately $976,000 and $985,000, respectively.
We expect interest expense and general and administrative expense to increase commensurate with the growth of our portfolio as we continue to deploy funds available in a diversified manner to the borrowers and markets in which we have experience and as markets dictate in accordance with economic factors conducive for a stable residential market, and our reinvestment of proceeds from loans that are repaid.
22
The nine months ended September 30, 2010 as compared to the nine months ended September 30, 2009.
Revenues
Interest income (including related party interest income) for the nine months ended September 30, 2010 and 2009 was approximately $34.6 million and $30.5 million, respectively. The increase in interest income for the nine months ended September 30, 2010 is primarily the result of our increased mortgage notes receivable portfolio (including related party transactions) and participation interest – related party portfolios of approximately $328.1 million as of September 30, 2010, compared to approximately $299.2 million as of September 30, 2009.
Credit enhancement fees – related party for the nine months ended September 30, 2010 and 2009 was approximately $243,000 and $77,000, respectively. The increase was primarily the result of fees earned associated with the guaranty provided on the UDF I – Brockhoeft Loan (discussed in Note F).
Mortgage and transaction service revenues for the nine months ended September 30, 2010 and 2009 were approximately $1.4 million and $1.9 million, respectively. This decrease is primarily the result of deferred fees recognized in the second quarter of 2009 associated with a loan that was paid in full prior to maturity. The Partnership generates mortgage and transaction service revenues by originating and acquiring mortgage notes receivable and other loans. In accordance with ASC 310-20, we defer recognition of income from nonrefundable commitment fees and recognize such income on a straight-line basis over the expected life of such notes.
We expect revenues to increase commensurate with the additional proceeds raised from the offering of units pursuant to the Secondary DRIP, our continued deployment of funds available in a diversified manner to the borrowers and markets in which we have experience and as markets dictate in accordance with economic factors conducive for a stable residential market, and our reinvestment of proceeds from loans that are repaid.
Expenses
Interest expense for the nine months ended September 30, 2010 and 2009 was approximately $1.1 million and $33,000, respectively. Interest expense represents interest associated with the Credit Facility that we entered into with Wesley J. Brockhoeft (previously defined as “Lender”) in September 2009. The Credit Facility has been utilized as transitory indebtedness to provide liquidity and to reduce and avoid the need for large idle cash reserves, including usage to fund identified investments pending receipt of proceeds from the partial or full repayment of loans. The Credit Facility has been used as a portfolio administration tool and not to provide long-term or permanent leverage on our investments.
General and administrative expense for the nine months ended September 30, 2010 and 2009 was approximately $3.1 million and $2.5 million, respectively. The increase in general and administrative expense primarily relates to placement fees, investor relations fees and amortization of debt financing costs associated with the Credit Facility.
We expect interest expense and general and administrative expense to increase commensurate with the growth of our portfolio as we continue to deploy funds available in a diversified manner to the borrowers and markets in which we have experience and as markets dictate in accordance with economic factors conducive for a stable residential market, and our reinvestment of proceeds from loans that are repaid.
23
Cash Flow Analysis
Cash flows provided by operating activities for the nine months ended September 30, 2010 were approximately $32.2 million and were comprised primarily of net income plus an increase in distributions payable. Cash flows provided by operating activities for the nine months ended September 30, 2009 were approximately $22.4 million and were comprised primarily of net income offset with accrued interest receivable (including related party interest receivable).
Cash flows used in investing activities for the nine months ended September 30, 2010 and 2009 were approximately $19.3 million and $47.1 million, respectively, resulting from the origination of mortgage notes receivable (including related party transactions) and participation interest – related party. This decrease is primarily a result of the completion of the primary component of the Offering in April 2009.
Cash flows used in financing activities for the nine months ended September 30, 2010 were approximately $17.8 million, and were primarily the result of distributions to partners. Cash flows provided by financing activities for the nine months ended September 30, 2009 were approximately $24.5 million, and were primarily the result of funds received from the Credit Facility as well as the issuance of limited partnership units, offset with payments of offering costs and distributions to partners.
Our cash and cash equivalents were approximately $676,000 and $15.3 million as of September 30, 2010 and 2009, respectively.
Liquidity and Capital Resources
Our liquidity requirements will be affected by (1) outstanding loan funding obligations, (2) administrative expenses, (3) debt service on senior indebtedness required to preserve our collateral position and (4) obligations under the Credit Facility. We expect that our liquidity will be provided by (1) loan interest, transaction fees and credit enhancement fee payments, (2) loan principal payments, (3) sale of loan pools through securitization and direct sale of loans, (4) proceeds from our Secondary DRIP, and (5) credit lines available to us.
In most cases, loan interest payments will be funded by an interest reserve and are due at the maturity of the loan. Interest reserve accounts are funded with loan proceeds and are intended to provide cash for monthly interest payments until such time that revenue from the sale of land or developed lots is sufficient to meet the debt service obligations. In the event that interest reserves are exhausted prior to realization of sufficient cash from land or lot sales, the borrower may not be able to make the required monthly interest payments and a loan default may occur. Payment defaults and decreasing land and lot sales may result in less liquidity and affect our ability to meet our obligations and make distributions. Limited credit facilities may impact our ability to meet our obligations or expand our loan portfolio when other sources of cash are not sufficient.
We believe that the Partnership will have sufficient liquidity to meet its operating needs for the next twelve months.
Material Trends Affecting Our Business
We believe that the housing market has reached a bottom in its four-year decline and has begun to recover. This recovery likely will be regional in its early stages and will be led by those housing markets with balanced supply, affordable and stable home prices, minimal levels of foreclosures, and strong demand fundamentals. Nationally, we expect the recovery will continue to experience headwinds from weak demand fundamentals, specifically consumer confidence, employment, as well as from the limited availability of bank financing. The national consumer confidence index, which fell to record lows during the economic downturn, has recovered somewhat, but remains close to levels historically associated with recession. Unemployment remains elevated and access to conventional real estate and commercial financing remains limited across most of the country. These factors pose obstacles to a robust recovery on a national scale. However, we expect the recovery will be stronger in markets such as Texas, where consumer confidence is nearly 25 points higher than the national index, where job growth has been steady and significant since the beginning of the year, and where 14% of all homebuilding permits in the country are issued. Currently, 96% of our portfolio resides in the state of Texas, and we intend to invest only in markets that demonstrate similarly sound economic and demand fundamentals – fundamentals that will likely be the drivers of the recovery, with balanced supplies of homes and finished lots. We believe the fact that new single-family home permits, starts, and sales have all risen from their respective lows reflects a continued return of real demand for new homes. However, we anticipate the former bubble markets – principally California, Arizona, Nevada, and Florida – will be slower to recover, as those markets have seen overbuilding and extensive price correction and are experiencing weakened economies and continued foreclosures.
24
From a national perspective, ongoing credit constriction, a less robust economic recovery, and housing price correction has made potential new home purchasers and real estate lenders cautious. As a result of these factors, the national housing market has experienced a protracted decline, and the time necessary to correct the market likely means a corresponding slow recovery for the housing industry.
Nationally, capital constraints at the heart of the credit crisis have reduced the number of real estate lenders able or willing to finance development, construction and the purchase of homes and have increased the number of undercapitalized or failed builders and developers. The number of new homes and finished lots developed also has decreased, which may result in a shortage of new homes and developed lots in select real estate markets in 2010 and more broadly in 2011. We believe this shortage will be most prominent in markets with balanced supply, stable home prices, and that did not participate in the housing bubble. With credit less available and stricter underwriting standards, mortgages to purchase homes have become more difficult to obtain in some markets. To support the secondary residential mortgage market and prevent further deterioration of mortgage lending, the Federal Reserve began an unprecedented program to purchase approximately $1.25 trillion of residential mortgage backed securities between January 5, 2009 and March 31, 2010. This program ended on March 31, 2010, as scheduled by the Federal Reserve. As of the date of this quarterly report, the 30-year fixed-rate single family residential mortgage interest rate remains below the rate that was available at the conclusion of the period of Federal Reserve purchases, near record-lows. We believe that such stability at low rates indicates that the secondary residential mortgage market is operating smoothly independent of the support previously provided by the Federal Reserve. However, any limitations or restrictions on the availability of financing or on the liquidity provided in the secondary residential mortgage market by Government Sponsored Enterprises such as Fannie Mae and Freddie Mac could adversely affect interest rates and mortgage availability, which could cause the number of homebuyers to decrease, which would increase the likelihood of borrowers defaulting on our loans and, consequently, reduce our ability to pay distributions to our limited partners.
Nationally, new single-family home inventory continued to improve in the third quarter of 2010 from the first and second quarters of 2010, while new home sales fell in the immediate aftermath of the expiration of the federal homebuyer tax credit. However, the pace of new home sales increased in each sequential month of the third quarter, leading us to believe that the relative pullback in demand will be short-lived. The national fundamentals that drive home sales are improving in most markets and home affordability remains near record-highs, and we expect the pace of home sales will continue to improve. The U.S. Census Bureau reports that the sales of new single-family residential homes in September 2010 were at a seasonally adjusted annual rate of 307,000 units. This number is down slightly from the second quarter figure of 310,000 and down approximately 18.9% year-over-year from the September 2009 estimate of 391,000. However, year-over-year comparisons are distorted by the effects of the federal homebuyer tax credit and its subsequent extension through June 30, 2010. In September 2009, homebuyers were reacting to an anticipated end of the first-time homebuyer tax credit in November 2009, creating a surge in home closings in the third quarter of 2009. The tax credit was subsequently extended through June 2010, creating a second surge in home purchases at the expense of third quarter 2010 sales figures. The combination of a high volume of home sales in the third quarter of 2009 and the hangover effect on third quarter 2010 sales that followed the expiration of the homebuyer tax credit in June 2010 is likely responsible for the wide disparity in sales figures between September 2009 and September 2010. The seasonally adjusted estimate of new houses for sale at the end of September 2010 was 204,000 – a supply of 8.0 months at the current sales rate. Through much of the downturn, homebuilders reduced their starts and focused on selling existing new home inventory. The number of new homes for sale fell by approximately 48,000 units from September 2009 to September 2010. However, new home inventory fell by just 7,000 units in the third quarter of 2010, which, we believe, indicates that inventory reductions have begun to level off. We believe that, with such reductions and the relative leveling of inventory over more recent quarters, the new home market has been restored to equilibrium in most markets, even at low levels of demand. Further, we believe that what is necessary now to regain prosperity in housing markets is the return of healthy levels of demand.
25
According to the U.S. Census Bureau, new single-family residential home permits and starts fell nationally from 2006 through 2008, as a result and in anticipation of an elevated supply of and decreased demand for new single-family residential homes in that period. Since early 2009, however, single-family permits and starts have improved significantly. Single-family homes authorized by building permits in September 2010 were at a seasonally adjusted annual rate of 405,000 units. While this was a 14.4% decrease year-over-year from the rate of 473,000 in September 2009, it remains 18.1% higher than the low of 343,000 set in January 2009. Single-family home starts for September 2010 stood at a seasonally adjusted annual rate of 452,000 units. This pace represented a year-over-year decrease of 10.8% from the September 2009 estimate of 507,000 units and a 19.7% decline from the peak of 2010 – 563,000 in April 2010 – as home builders adjusted their start rate after the expiration of the homebuyer tax credit. Again, year-over-year figures between September 2009 starts and September 2010 home starts are likely distorted by a surge in new home starts, reflecting homebuilders’ efforts to meet third quarter 2009 demand sparked by the anticipated close of the first-time homebuyer tax credit, as well as the significant reduction in new home starts following the June 2010 expiration of the homebuyer tax credit as builders recalibrated their inventory levels. Even with the reduction in the start rate, the September 2010 pace is still 25.6% higher than the low of 360,000 set in January 2009. Such increases strongly suggest to us that new home inventories are generally in balance and the homebuilding industry now anticipates greater demand for new homes in coming months relative to the demand evident in 2009.
The primary factors affecting new home sales are home price stability, home affordability, and housing demand. Housing supply may affect both new home prices and the demand for new homes. When the supply of new homes exceeds new home demand, new home prices may generally be expected to decline. Declining new home prices may result in diminished new home demand as people postpone a new home purchase until such time as they are comfortable that stable price levels have been reached. Also, home foreclosures cause the inventory of existing homes to increase, which may add additional downward price pressure on home prices and cause potential home purchasers to further delay the purchase of a home until such time as they are comfortable that home prices have stabilized. The converse point is also true and equally important. When new home demand exceeds new home supply, new home prices may generally be expected to increase; and rising new home prices, particularly at or near the bottom of the housing cycle, may result in increased new home demand as people become confident in home prices and accelerate their timing of a new home purchase. Hence, we intend to concentrate our investments in housing markets with affordable and stable home prices, balanced supply, lower incidences of foreclosures, and strong demand fundamentals. These demand fundamentals are generally job growth, the relative strength of the economy and consumer confidence, household formations, and population growth – both immigration and in-migration.
The U.S. Census Bureau forecasts that California, Florida and Texas will account for nearly one-half of the total U.S. population growth between 2000 and 2030 and that the total population of Arizona and Nevada will double during that period. The U.S. Census Bureau projects that between 2000 and 2030 the total populations of Arizona and Nevada will grow from approximately 5 million to more than 10.7 million and from approximately 2 million to nearly 4.3 million, respectively; Florida’s population will grow nearly 80% between 2000 and 2030, from nearly 16 million to nearly 28.7 million; Texas’ population will increase 60% between 2000 and 2030, from nearly 21 million to approximately 33.3 million; and California’s population will grow 37% between 2000 and 2030, from approximately 34 million to nearly 46.5 million.
The Harvard Joint Center for Housing Studies forecasts that an average of between approximately 1.25 million and 1.48 million new households will be formed per year over the next ten years. Likewise, The Homeownership Alliance, a joint project undertaken by the chief economists of Fannie Mae, Freddie Mac, the Independent Community Bankers of America, the National Association of Home Builders, and the National Association of Realtors, has projected that 1.3 million new households will be formed per year over the next decade and approximately 1.8 million housing units per year should be started to meet such new demand, including approximately 1.3 million new single family homes per year based on the estimation of the Homeownership Alliance that 72% of all housing units built will be single family residences.
26
While housing woes have beleaguered the national economy, Texas housing markets have held up as some of the best in the country, and Texas is the largest homebuilding market in the country based on the U.S. Census Bureau’s measurements of housing permits and starts. We intend to focus our initial investment portfolio in Texas as we believe Texas markets, though weakened from their highs in 2007, have remained fairly healthy due to strong demographics, economies, and job growth, balanced housing inventories, stable home prices, and high housing affordability ratios. Texas did not experience the dramatic price appreciation (and subsequent depreciation) that states such as California, Florida, Arizona, and Nevada experienced. The following graph, created with data from the Federal Housing Finance Agency’s (“FHFA”) Purchase Only Price Index, illustrates the declines in home prices nationally, as well as in California, Florida, Arizona, and Nevada over the past few years. Price declines have begun to moderate in those states in recent quarters, though, and California’s home price appreciation has actually turned positive in the last two quarters. Further, the graph illustrates how Texas has maintained home price stability throughout the downturn.
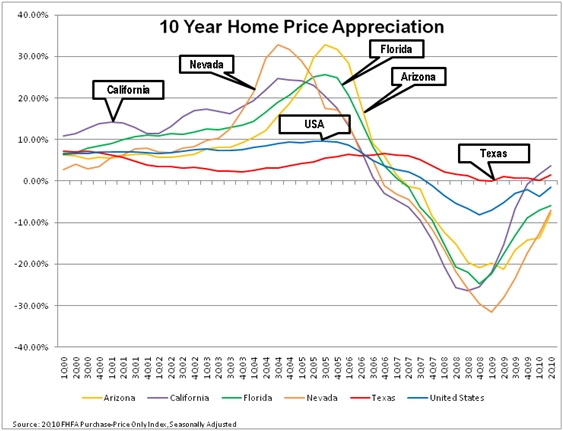
According to numbers publicly released by Residential Strategies, Inc. or Metrostudy, leading providers of primary and secondary market information, the median new home prices for the third quarter of 2010 in the metropolitan areas of Austin, Houston, Dallas, and San Antonio are $212,107, $205,453, $209,482 and $187,932, respectively. These amounts are all below the September 2010 national median sales price of new homes sold of $223,800, according to estimates released jointly by the U.S. Census Bureau and the Department of Housing and Urban Development.
Using the Department of Housing and Urban Development’s estimated 2010 median family income for the respective metropolitan areas of Austin, Houston, Dallas, and San Antonio, the median income earner in those areas has 1.47 times, 1.34 times, 1.37 times, and 1.30 times the income required to qualify for a mortgage to purchase the median priced new home in the respective metropolitan area. These numbers illustrate the high affordability of Texas homes. Our measurement of housing affordability, as referenced above, is determined as the ratio of median family income to the income required to qualify for a 90 percent, 30-year fixed-rate mortgage to purchase the median-priced new home, based on the average interest rate for September and assuming an annual mortgage insurance premium of 80 basis points for private mortgage insurance, plus a cost that includes estimated property taxes and insurance for the home. Using the Department of Housing and Urban Development’s 2010 income data to project an estimated median income for the United States of $64,400 and the September 2010 national median sales prices of new homes sold of $223,800, we conclude that the national median income earner has 1.21 times the income required to qualify for a mortgage loan to purchase the median-priced new home in the United States. This estimation reflects the increase in home affordability in housing markets outside of Texas over the past 36 months, as new home prices in housing markets outside of Texas generally have fallen. Recently, however, such price declines have begun to stabilize, and the September 2010 national median new home price of $223,800 was actually higher than the September 2009 median new home sales price of $216,600, according to the U.S. Census Bureau. We believe that such price stabilization indicates that new home affordability has been restored to the national housing market.
27
Due to the national and global recession, the Texas employment market slowed in the fourth quarter of 2008 through the first three quarters of 2009 until beginning to add jobs again in the fourth quarter of 2009 and into 2010. According to the United States Department of Labor, while Texas shed the jobs associated with the U.S. Census in the third quarter, the state has now added approximately 145,700 jobs in the first nine months of 2010. This job growth is consistent with the Federal Reserve Bank of Dallas’ forecast that Texas may add between 100,000 and 200,000 jobs in 2010. Out of these 145,700 jobs created, 127,900 of them have been in the private sector. Further, Texas has added approximately 550,700 new jobs over the past five years, 420,300 in the private sector, in contrast to a loss of more than four million private sector jobs in the country as a whole. Texas’ unemployment rate was unchanged year-over-year at 8.1% in September 2010 from September 2009, even while adding 19,162 workers to the labor force. Over that time, Texas added approximately 152,800 net new jobs, which was nearly half of the total of all jobs created in the United States in that same 12 month period (344,000). The national unemployment rate fell from September 2009 (9.8%) to September 2010 (9.6%).
The Department of Labor also reports that as of September 2010, the unemployment rate for Austin-Round Rock, Texas was 6.8%, down from 7.2% in September 2009. Dallas-Fort Worth-Arlington, Texas was 7.9%, down from 8.3% a year ago. Houston-Sugar Land-Baytown, Texas was 8.2%, unchanged from a year ago, while San Antonio, Texas was 7.2%, up from 7.1%. Austin added 18,000 jobs year-over-year from September 2009 to September 2010, while Dallas-Fort Worth added 29,200 jobs over that same time period, which were the second and fourth greatest job gains, respectively, of any city in the country over the past 12 months. San Antonio added 5,100 jobs in that time, and Houston added 500 jobs over that same period. Taken together, these four cities have added an estimated net total of 329,600 jobs over the past five years: Austin added 72,400 jobs; Dallas-Fort Worth added 72,100 jobs; Houston added 140,100 jobs; and San Antonio added 45,000 jobs. Of those jobs, 232,700 of them have been created in the private sector.
We believe that Texas cities will continue to be among the first in the country to recover based on employment figures, consumer confidence, gross metropolitan product, and new home demand. According to the Texas Workforce Commission, Texas tends to enter into recessions after the national economy has entered a recession and usually leads among states in the economic recovery. The National Bureau of Economic Research has concluded that the U.S. economy entered into a recession in December 2007, ending an economic expansion that began in November 2001. We believe, based on transitions in the Texas Leading Index as prepared by the Federal Reserve Bank of Dallas, that Texas entered into recession in late Fall 2008, trailing the national recession by nearly a year and emerged from the recession in the late spring of 2009. Further, we believe the Texas economy is leading a national economic recovery. The Texas Leading Index has risen significantly since reaching a low of 100.5 in March 2009 and, as of September 2010, was 115.1, which is nearly 700 basis points higher than one year ago. Further, the Conference’s Board’s October measurement of consumer confidence in Texas is nearly 25 points higher than the national average, and the Texas Comptroller of Public Accounts projects that the Texas economy will grow by 3% in 2010.
The U.S. Census Bureau reported in its 2009 Estimate of Population Change for the period from July 1, 2008 to July 1, 2009 that Texas led the country in population growth during that period. The estimate concluded that Texas’ population grew by 478,012 people, or 2%, a number that was 1.25 times greater than the next closest state in terms of raw population growth, California, and more than 3.57 times the second closest state in terms of raw population growth, North Carolina. The U.S. Census Bureau also reported that among the 15 counties that added the largest number of residents between July 1, 2008 and July 1, 2009, six were in Texas: Harris (Houston), Tarrant (Fort Worth), Bexar (San Antonio), Collin (North Dallas), Dallas (Dallas) and Travis (Austin). In March 2010, the U.S. Census Bureau reported that Texas’ four major metro areas – Austin, Houston, San Antonio, and Dallas-Fort Worth – were among the top 20 in the nation for population growth from 2008 to 2009. Dallas-Fort Worth-Arlington led the nation in numerical population growth with a combined estimated population increase of 146,530. Houston-Sugarland-Baytown was second in the nation with a population increase of 140,784 from July 1, 2008 to July 1, 2009. Austin-Round Rock had an estimated population growth of 50,975 and San Antonio had an estimated population growth of 41,437 over the same period. The percentage increase in population for each of these major Texas cities ranged from 2% to 3.1%.
28
The First Quarter 2010 U.S. Market Risk Index, a study prepared by PMI Mortgage Insurance Co., the U.S. subsidiary of The PMI Group, Inc., which ranks the nation’s 50 largest metropolitan areas through the first quarter of 2010 according to the likelihood that home prices will be lower in two years, reported that Texas cities are among the nation’s best for home price stability. This index analyzes housing price trends, the impact of foreclosure rates, and the consequence of excess housing supply on home prices. The quarterly report projects that there is a 29.1% chance that Dallas/Fort Worth-area home prices will fall during the next two years; a 41.3% chance that Houston-area home prices will fall during the next two years; a 12% chance that San Antonio-area home prices will fall during the next two years; and a 60.1% chance that Austin-area home prices will fall during the next two years. All Texas metropolitan areas included in the report are among the nation’s top 21 least-likely areas to experience a decline in home prices in two years. San Antonio, Texas is ranked the second least-likely; Fort Worth-Arlington, Texas is eighth least-likely; Dallas-Plano-Irving, Texas is ninth least-likely; Houston-Sugar Land-Baytown, Texas is fourteenth least-likely; and the Austin area is ranked the twenty-first least-likely.
In their second quarter Purchase Only Price Index, the FHFA reports that Texas had a home price appreciation of 1.43% between the second quarter of 2009 and the second quarter of 2010, which is better than the national average of -1.60%.
The Texas Comptroller of Public Accounts notes that the rate of foreclosures and defaults in Texas has remained generally stable for the past three years. The national foreclosure tracking service, RealtyTrac, estimates that the Texas September 2010 foreclosure rate is less than half the national average, which is consistent with the Federal Reserve Bank of Dallas’ forecast in its economic letter for the fourth quarter of 2009 that the Texas foreclosure rate will continue to remain below the national average in 2010. We do not expect the four major Texas housing markets to be materially adversely affected by foreclosures and anticipate that home foreclosures will continue to be mostly concentrated in the bubble market states of California, Florida, Arizona, and Nevada. Homebuilding and residential construction employment are likely to remain generally weak for some time, but Texas again will likely continue to outperform the national standards. We believe that Texas’ housing sector is healthier, the cost of living and doing business is lower, and its economy is more dynamic and diverse than the national average.
In contrast to the conditions of many homebuilding markets in the country, new home sales are greater than new home starts in Texas markets, indicating that home builders in Texas continue to focus on preserving a balance between new home demand and new home supply. We believe that home builders and developers in Texas have remained disciplined on new home construction and project development. New home starts are outpaced by new home sales in all four major Texas markets where such data is available: Austin, Dallas-Fort Worth, Houston, and San Antonio. Inventories of finished new homes and total new housing (finished vacant, under construction, and model homes) remain at healthy and balanced levels in all of these major Texas markets. Each major Texas market experienced a rise in the number of months of finished lot inventories as homebuilders reduced the number of new home starts in 2008, causing each major Texas market to reach elevated levels. However, the number of finished lots available in each market has fallen significantly even as the month’s supply has risen and finished lot shortages are beginning to emerge in many desirable submarkets in the major Texas markets. This is a trend that we expect to continue due to the lack of commercial financing for development that has constrained finished lot development over the past 30 months and as new home demand and sales continue, and we believe that such demand and sales will continue to increase, these finished lot shortages will become more pronounced. As of September 2010, Houston has an estimated inventory of finished lots of approximately 34.3 months, Austin has an estimated inventory of finished lots of approximately 46.1 months, San Antonio has an estimated inventory of finished lots of approximately 52.7 months, and Dallas-Fort Worth has an estimated inventory of finished lots of approximately 56.9 months. A 24-28 month supply is considered equilibrium for finished lot supplies.
29
As stated above, the elevation in month’s supply of finished lot inventory in Texas markets owes itself principally to the decrease in the pace of annual starts rather than an increase in the raw number of developed lots, and as the homebuilders begin to increase their pace of home starts, we expect to see the month’s supply of lot inventory rapidly improve. Indeed, the number of finished lots available in each Texas market has been significantly reduced from their peaks. Since peaking in the first quarter of 2008, Houston’s finished lot supply has fallen 23.5% from 73,340 to 56,135 in the third quarter of 2010. San Antonio’s finished lot inventory has fallen 14.3% to 33,937 since peaking at 39,618 in the third quarter of 2008. Austin’s finished lot inventory peaked in the third quarter of 2008 at 31,628, and has fallen 21.2% to 24,936. The finished lot inventory for Dallas-Fort Worth peaked in the first quarter of 2008 at 97,504 lots and has fallen 23.6% to 74,513 lots. Such inventory reduction continued in the third quarter of 2010, as the number of finished lots dropped by more than 800 in Austin, nearly 2,200 lots in Houston, and more than 2,600 lots in Dallas-Fort Worth. San Antonio’s lot supply increased slightly in the third quarter from 33,847 in the second quarter. Annual starts in each of the Austin, San Antonio, Houston, and Dallas-Fort Worth markets are outpacing lot deliveries. With the discipline evident in these markets, we expect to see a continued decline in raw numbers of finished lot inventories in coming quarters as new projects have been significantly reduced. In correlation, we expect to see increased finished lot sales in late 2010 and in 2011 as homebuilders continue to replenish their inventory.
Texas markets continue to be some of the strongest homebuilding markets in the country. The pace of homebuilding in Texas slowed over the past four years as a result of the national economic downturn, but has begun to improve on a year-over-year basis in each major Texas home market: Austin, Dallas-Fort Worth, Houston, and San Antonio. With the exception of Austin, new home starts improved on a year-over-year basis in each of these Texas markets in the quarter ended September 30, 2010. While the decline in housing starts caused the month supply of vacant lot inventory to become elevated from its previously balanced position, it also preserved a balance in housing inventory. Annual new home sales in Austin outpace starts 7,650 versus 6,497, with annual new home sales declining year-over-year by approximately 3.44%. Finished housing inventory fell to a healthy level of 2.7 months, while total new housing inventory (finished vacant, under construction and model homes) fell to a balanced supply of 5.8 months. The generally accepted equilibrium levels for finished housing inventory and total new housing inventory are a 2-to-2.5 month supply and a 6.0 month supply, respectively. Like Austin, San Antonio is also a healthy homebuilding market. Annual new home sales in San Antonio run slightly ahead of starts 8,179 versus 7,725, with annual new home sales declining year-over-year by approximately 3.5%. Finished housing inventory held at a generally healthy level with a 2.7 month supply. Total new housing inventory fell to a balanced 5.9 month supply. Houston, too, is a healthy homebuilding market. Annual new home sales there outpace starts 22,288 versus 19,663, with annual new home sales declining year-over-year by approximately 3%. Finished housing inventory is slightly elevated at a 3.0 month supply while total new housing inventory fell to a healthy 6.0 month supply, respectively. Dallas-Fort Worth is a relatively healthy homebuilding market as well. Annual new home sales in Dallas-Fort Worth outpace starts 17,264 versus 15,706, with annual new home sales declining year-over-year by approximately 4.7%. Finished housing inventory fell slightly to a 2.9 month supply, while total new housing inventory fell to a 6.2 month supply, respectively, each measurement generally healthy. All numbers are as released by Residential Strategies, Inc. or Metrostudy, leading providers of primary and secondary market information.
The Real Estate Center at Texas A&M University has reported that existing housing inventory levels have become slightly elevated, most likely because residents in these markets are becoming more comfortable putting their homes up for sale as sales of existing homes were healthy in Texas markets through the third quarter. In September 2010, the number of months of home inventory for sale in Austin, Houston, Dallas, Fort Worth, and Lubbock was 6.8 months, 7.9 months, 7.2 months, 7.3 months, and 7.3 months, respectively. San Antonio’s inventory is more elevated with an 8.2 month supply of homes for sale. Like new home inventory, a 6-month supply of inventory is considered a balanced market with more than 6 months of inventory generally being considered a buyer’s market and less than 6 months of inventory generally being considered a seller’s market. Through September 2010, the number of existing homes sold in (a) Austin was 15,595, essentially unchanged year-over-year; (b) San Antonio was 14,368, up 3% year-over-year; (c) Houston was 43,918, down 2% year-over-year, (d) Dallas was 33,089, down 4% year-over-year, (e) Fort Worth was 6,388, up 1% year-over-year, and (f) Lubbock was 2,271, down 9% year-over-year. As home prices increase, we expect more sellers to enter the market, believing that prices will continue to increase.
In managing and understanding the markets and submarkets in which we make loans, we monitor the fundamentals of supply and demand. We track the economic fundamentals in each of the respective markets, analyzing demographics, household formation, population growth, employment, migration, immigration, and housing affordability. We also watch movements in home prices and the presence of market disruption activity, such as investor or speculator activity that can create a false impression of demand and result in an oversupply of homes in a market. Further, we study new home starts, new home closings, finished home inventories, finished lot inventories, existing home sales, existing home prices, foreclosures, absorption, prices with respect to new and existing home sales, finished lots and land, and the presence of sales incentives, discounts, or both, in a market.
30
Generally, the residential homebuilding industry is cyclical and highly sensitive to changes in broader economic conditions, such as levels of employment, consumer confidence, income, availability of financing for acquisition, construction, and permanent mortgages, interest rate levels, and demand for housing. The condition of the resale market for used homes, including foreclosed homes, also has an impact on new home sales. In general, housing demand is adversely affected by increases in interest rates, housing costs, and unemployment and by decreases in the availability of mortgage financing or in consumer confidence, which can occur for numerous reasons, including increases in energy costs, interest rates, housing costs, and unemployment.
We face a risk of loss resulting from deterioration in the value of the land purchased by the developer with the proceeds of loans from us, a diminution of the site improvement and similar reimbursements used to repay loans made by us, and a decrease in the sales price of the single-family residential lots developed with the proceeds of loans from us. Deterioration in the value of the land, a diminution of the site improvement and similar reimbursements, and a decrease in the sales price of the residential lots can occur in cases where the developer pays too much for the land to be developed, the developer is unable or unwilling to develop the land in accordance with the assumptions required to generate sufficient income to repay the loans made by us, or is unable to sell the residential lots to home builders at a price that allows the developer to generate sufficient income to repay the loans made by us.
Our general partner actively monitors the markets and submarkets in which we make loans, including mortgage markets, homebuilding economies, the supply and demand for homes, finished lots, and land and housing affordability to mitigate such risks. Our general partner also actively manages our loan portfolio in the context of events occurring with respect to the loan and in the market and submarket in which we made the loan. We anticipate that there may be defaults on development loans made by us and that we will take action with respect to such defaults at any such time that we determine it prudent to do so, including such time as we determine it prudent to maintain and protect the value of the collateral securing a loan by originating another development loan to another developer with respect to the same project to maintain and protect the value of the collateral securing our initial loan.
We face a risk of loss resulting from adverse changes in interest rates. Changes in interest rates may affect both demand for our real estate finance products and the rate of interest on the loans we make. In most instances, the loans we make will be junior in the right of repayment to senior lenders, who will provide loans representing 70% to 80% of total project costs. As senior lender interest rates available to our borrowers increase, demand for our mortgage loans may decrease, and vice versa.
Developers to whom we make mortgage loans use the proceeds of such loans to develop raw real estate into residential home lots. The developers obtain the money to repay these development loans by selling the residential home lots to home builders or individuals who will build single-family residences on the lots, receiving qualifying site improvement reimbursements, and by obtaining replacement financing from other lenders. If interest rates increase, the demand for single-family residences may decrease. Also, if mortgage financing underwriting criteria become stricter, demand for single-family residences may decrease. In such an interest rate and/or mortgage financing climate, developers may be unable to generate sufficient income from the resale of single-family residential lots to repay loans from us, and developers’ costs of funds obtained from lenders in addition to us may increase as well. If credit markets deteriorate, developers may not be able to obtain replacement financing from other lenders. Accordingly, increases in single-family mortgage interest rates, decreases in the availability of mortgage financing, or decreases in the availability of replacement financing could increase the number of defaults on development loans made by us.
31
Our general partner is not aware of any material trends or uncertainties, favorable or unfavorable, other than national economic conditions affecting real estate and interest rates generally, that it reasonably anticipates to have a material impact on either the income to be derived from our investments in mortgage loans or entities that make mortgage loans, other than those referred to in this Quarterly Report on Form 10-Q. The disruption of mortgage markets, in combination with a significant amount of negative national press discussing constriction in mortgage markets and the poor condition of the national housing industry, including declining home prices, have made potential new home purchasers and real estate lenders very cautious. The failure of highly respected financial institutions, significant volatility in equity markets around the world, unprecedented administrative and legislative actions in the United States, and actions taken by central banks around the globe to stabilize the economy have further caused many prospective home purchasers to postpone their purchases. In summary, we believe there is a general lack of urgency to purchase homes in these times of economic uncertainty. We believe that this has further slowed the sales of new homes and expect that this will result in a slowing of the sales of finished lots developed in certain markets; however, we do not anticipate the prices of those lots changing materially. We also expect that the decrease in the availability of replacement financing may increase the number of defaults on development loans made by us or extend the time period anticipated for the repayment of our loans.
Off-Balance Sheet Arrangements
In August 2009, the Partnership entered into the UDF III Guaranty for the benefit of Texas Capital, or its permitted successors and assigns, by which the Partnership guaranteed the repayment of up to $5 million owed to Texas Capital with respect to that certain promissory note between UMT Home Finance and Texas Capital. UMT Home Finance is a wholly owned subsidiary of UMT. An affiliate of the Partnership’s general partner serves as the advisor to UMT. In connection with the UDF III Guaranty, the Partnership entered into a letter agreement with UMT Home Finance which provides for UMT Home Finance to pay the Partnership annually, in advance, an amount equal to 1% of the maximum exposure of the Partnership under the UDF III Guaranty (i.e., $50,000 per annum). These fees are included in our credit enhancement fees – related party income account.
In March 2010, the Partnership entered into the Resort Island Guaranty for the benefit of BOLC pursuant to which the Partnership guaranteed the repayment of up to $925,000 owed to BOLC with respect to a loan between UDFLOF Resort Island and BOLC. UDFLOF Resort Island is a wholly owned subsidiary of UDF LOF. The Partnership’s general partner is an affiliate of UDF LOF. In connection with the Resort Island Guaranty, the Partnership entered into a letter agreement with UDFLOF Resort Island which provides for UDFLOF Resort Island to pay the Partnership a guaranty fee equal to 1% of the maximum exposure (i.e., $9,250) of the Partnership under the guaranty, which was paid to the Partnership upon the execution of the guaranty and is included in credit enhancement fees – related party income revenue.
In April 2010, the Partnership entered into the UDF IV HF Guaranty for the benefit of CTB pursuant to which the Partnership guaranteed the repayment of up to $6 million owed to CTB with respect to a revolving line of credit loan between UDF IV Home Finance and CTB. UDF IV Home Finance is a wholly owned subsidiary of UDF IV. The Partnership’s general partner serves as the asset manager for UDF IV. In connection with the UDF IV HF Guaranty, the Partnership entered into a letter agreement with UDF IV Home Finance which provides for UDF IV Home Finance to pay the Partnership an annual credit enhancement fee equal to 1% of the maximum loan amount (i.e., $60,000 per annum). The fee is to be paid in 12 equal monthly installments and is included in credit enhancement fees – related party income revenue.
In April 2010, the Partnership entered into the UMT 15th Street Guaranty for the benefit of CTB pursuant to which the Partnership guaranteed the repayment of up to $1.6 million owed to CTB with respect to a loan between UMT 15th Street and CTB. UMT 15th Street is a wholly owned subsidiary of UMT. An affiliate of the Partnership’s general partner serves as the advisor to UMT. In connection with the UMT 15th Street Guaranty, the Partnership entered into a letter agreement with UMT 15th Street which provides for UMT 15th Street to pay the Partnership a monthly credit enhancement fee equal to one-twelfth of 1% of the outstanding principal balance on the loan at the end of the month.
In June 2010, UDF I obtained the $15 million UDF I – Brockhoeft Loan from the Lender, as agent for a group of lenders. As security for the UDF I – Brockhoeft Loan, the Partnership provided the Lender with a guaranty of repayment on the UDF I – Brockhoeft Loan, which is secured by a lien on all of the Partnership’s existing and future assets. In consideration of the Partnership’s secured guaranty, commencing July 31, 2010, UDF I agreed to pay the Partnership a monthly fee equal to 3% per annum of the outstanding balance of the UDF I – Brockhoeft Loan. These fees are included in credit enhancement fees – related party income revenue.
32
In August 2010, the Partnership entered into the UDF IV Acquisitions Guaranty for the benefit of CTB pursuant to which the Partnership guaranteed the repayment of up to $8 million owed to CTB with respect to a revolving line of credit loan between UDF IV Acquisitions and CTB. UDF IV Acquisitions is a wholly owned subsidiary of UDF IV. The Partnership’s general partner serves as the asset manager for UDF IV. In connection with the UDF IV Acquisitions Guaranty, the Partnership entered into a letter agreement with UDF IV Acquisitions which provides for UDF IV Acquisitions to pay the Partnership a monthly credit enhancement fee equal to one-twelfth of 1% of the outstanding principal balance on the revolving line of credit at the end of the month. This fee is included in credit enhancement fees – related party income revenue.
The Partnership from time to time enters into guarantees of debtor’s borrowings and provides credit enhancements for the benefit of senior lenders in connection with the Partnership’s debtors and investments in partnerships (collectively referred to as “guarantees”) and accounts for such guarantees in accordance with ASC 460-10, Guarantees.
Guarantees generally have fixed expiration dates or other termination clauses and may require payment of a fee by the debtor. A guarantee involves, to varying degrees, elements of credit risk in excess of the amount recognized in the consolidated balance sheets. The Partnership’s exposure to credit loss in the event of non-performance by the other party to the instrument is represented by the contractual notional amount of the guarantee.
As of September 30, 2010, the Partnership had 14 outstanding guarantees, including: (1) 11 limited repayment guarantees with total credit risk to the Partnership of approximately $48.9 million, of which approximately $39.9 million had been borrowed against by the debtor; and (2) three letters of credit issued on behalf of borrowers with total credit risk to the Partnership of approximately $2.6 million, of which approximately $2.2 million had been borrowed against by the debtors.
As of December 31, 2009, the Partnership had eight outstanding guarantees, including: (1) five limited repayment guarantees with total credit risk to the Partnership of approximately $12.4 million, of which approximately $9.7 million had been borrowed against by the debtor and (2) three letters of credit issued on behalf of borrowers with total credit risk to the Partnership of approximately $2.6 million, of which approximately $2.2 million had been borrowed against by the debtors.
To date, the Partnership has not incurred losses from guarantees entered into, and the debt that is guaranteed is also collateralized by real estate. The value of such real estate may or may not be sufficient to settle such obligations if liquidated.
Contractual Obligations
As of September 30, 2010, we had originated 56 loans, including 22 loans that have been repaid in full by the respective borrower, totaling approximately $432.5 million. We have approximately $44.2 million of commitments to be funded under the terms of mortgage notes receivable, including approximately $26.9 million of commitments for mortgage notes receivable – related party and $2.9 million for participation interest – related party.
As of December 31, 2009, we had originated 55 loans, including 18 loans that have been repaid in full by the respective borrower, totaling approximately $430 million. We have approximately $50.9 million of commitments to be funded under the terms of mortgage notes receivable, including approximately $27.2 million of commitments for mortgage notes receivable – related party and $6.2 million for participation interest – related party.
The Partnership has no other outstanding debt or contingent payment obligations, other than approximately $51.5 million of certain loan guarantees or letters of credit discussed above in “– Off-Balance Sheet Arrangements,” that we may be obligated to make to or for the benefit of third-party lenders.
33
Subsequent Events
In February 2009, the Financial Industry Regulatory Authority (“FINRA”) issued a notice to broker-dealers that sell the units of non-traded real estate direct participation programs, such as the Partnership. This notice informed broker-dealers that they may not report in a customer account statement an estimated unit value that is developed from data more than 18 months old, which in effect requires non-traded direct participation programs to provide broker-dealers with an estimated value per unit of limited partnership interest within 18 months of the completion of their offering stage. The Partnership completed its offering stage in April 2009. Accordingly, to meet FINRA guidelines, on October 22, 2010, Land Development approved an estimated value of the Partnership’s units of limited partnership interest of $20.00 per unit. In making a determination of the estimated value of the Partnership’s units, Land Development assessed the Partnership’s assets, less liabilities, per unit and the execution of the Partnership’s business model set forth in the prospectus regarding the Partnership’s initial public offering of its limited partnership interests. Land Development also engaged an independent firm specializing in the valuation of businesses, partnerships and intellectual property, which derived a range of estimated values per unit using various valuation analyses. The estimated value per unit determined by Land Development is within the range of values derived by the independent firm.
In November 2010, the Partnership deposited $1.5 million into the UTB Deposit Account with UTB for the purpose of providing collateral to UTB for the benefit of UMTH Lending. The Partnership provided UTB a security interest in the UTB Deposit Account as further collateral for the UTB-UMTH Lending Loan obtained by UMTH Lending from UTB. In consideration of the Partnership providing the UTB Deposit Account as collateral for the UTB-UMTH Lending Loan, UMTH Lending agreed to pay the Partnership a fee equal to 3% per annum of the amount outstanding in the UTB Deposit Account for each year that the UTB Deposit Account secures the UTB-UMTH Lending Loan.
Item 3. Quantitative and Qualitative Disclosures About Market Risk.
Market risk is the exposure to loss resulting from adverse changes in market prices, interest rates, foreign currency exchange rates, commodity prices and equity prices. A significant market risk to which we are exposed is interest rate risk, which is sensitive to many factors, including governmental monetary and tax policies, domestic and international economic and political considerations, and other factors beyond our control. Changes in interest rates may impact both demand for our real estate finance products and the rate of interest on the loans we make. Another significant market risk is the market price of finished lots. The market price of finished lots is driven by the demand for new single-family homes and the supply of unsold homes and finished lots in a market. The change in one or both of these factors can have a material impact on the cash realized by our borrowers and resulting collectability of our loans and interest.
Demand for our mortgage loans and the amount of interest we collect with respect to such loans depends on the ability of borrowers of real estate development loans to sell single-family lots developed with the proceeds of the loans to home builders.
The single-family lot and residential homebuilding market is highly sensitive to changes in interest rate levels. As interest rates available to borrowers increase, demand for mortgage loans decreases, and as interest rates available to borrowers decrease, demand for mortgage loans increases. Housing demand is also adversely affected by increases in housing prices and unemployment and by decreases in the availability of mortgage financing. In addition, from time to time, there are various proposals for changes in the federal income tax laws, some of which would remove or limit the deduction for home mortgage interest. If effective mortgage interest rates increase and/or the ability or willingness of prospective buyers to purchase new homes is adversely affected, the demand for new homes may also be negatively affected. As a consequence, demand for and the performance of our real estate finance products may also be adversely impacted.
As of September 30, 2010 and December 31, 2009, our mortgage notes receivable of approximately $214.7 million and $202.4 million, respectively, mortgage notes receivable – related party of approximately $55.5 million and $52.0 million, respectively, and participation interest – related party of approximately $57.9 million and $54.7 million, respectively, were all at fixed interest rates, and thus, such mortgage notes receivable are not subject to change in future earnings, fair values or cash flows.
34
We seek to mitigate our single-family lot and residential homebuilding market risk by closely monitoring economic, project market, and homebuilding fundamentals. We review a variety of data and forecast sources, including: public reports of home builders, mortgage originators and real estate finance companies; financial statements of developers; project appraisals; proprietary reports on primary and secondary housing market data, including land, finished lot, and new home inventory and prices and concessions, if any; and information provided by government agencies, the Federal Reserve Bank, the National Association of Home Builders, the National Association of Realtors, public and private universities, corporate debt rating agencies, and institutional investment banks regarding the homebuilding industry and the prices of and supply and demand for single-family residential homes.
In addition, we further seek to mitigate our single-family lot and residential homebuilding market risk by assigning an asset manager to each mortgage note. This asset manager is responsible for monitoring the progress and performance of the borrower and the project as well as assessing the status of the marketplace and value of our collateral securing repayment of our mortgage loan.
See the “Management’s Discussion and Analysis of Financial Condition and Results of Operations” section of this Form 10-Q for further discussion regarding our exposure to market risks.
Item 4. Controls and Procedures.
Evaluation of Disclosure Controls and Procedures
As required by Rule 13a-15(b) and Rule 15d-15(b) under the Securities Exchange Act of 1934, as amended (the “Exchange Act”), the management of Land Development, our general partner, including its principal executive officer and principal financial officer, evaluated, as of September 30, 2010, the effectiveness of our disclosure controls and procedures as defined in Exchange Act Rule 13a-15(e) and Rule 15d-15(e). Based on that evaluation, the principal executive officer and the principal financial officer of our general partner concluded that our disclosure controls and procedures, as of September 30, 2010, were effective for the purpose of ensuring that information required to be disclosed by us in this report is recorded, processed, summarized and reported within the time periods specified by the rules and forms of the Exchange Act and is accumulated and communicated to management, including the principal executive officer and the principal financial officer of our general partner, as appropriate to allow timely decisions regarding required disclosures.
We believe, however, that a controls system, no matter how well designed and operated, can only provide reasonable assurance, and not absolute assurance, that the objectives of the controls system are met, and an evaluation of controls can provide only reasonable assurance, and not absolute assurance, that all control issues and instances of fraud or error, if any, within a partnership have been detected.
Changes in Internal Control over Financial Reporting
There have been no changes in our internal controls over financial reporting that occurred during the three months ended September 30, 2010 that have materially affected, or are reasonably likely to materially affect, our internal control over financial reporting.
35
OTHER INFORMATION
We are not a party to, and none of our assets are subject to, any material pending legal proceedings.
There have been no material changes from the risk factors set forth in our Annual Report on Form 10-K for the year ended December 31, 2009, as filed with the Securities and Exchange Commission.
Use of Proceeds from Registered Securities
On May 15, 2006, our Registration Statement on Form S-11 (Registration No. 333-127891), covering a public offering of up to 12,500,000 units of limited partnership interest to be issued in the primary offering at a price of $20 per unit, was declared effective under the Securities Act of 1933, as amended. The Registration Statement also covered up to 5,000,000 units of limited partnership interest to be issued pursuant to our DRIP for $20 per unit. We had the right to reallocate the units of limited partnership interest we were offering between the primary offering and our DRIP, and pursuant to Supplement No. 8 to our prospectus regarding the Offering, which was filed with the Securities and Exchange Commission on September 4, 2008, we reallocated the units being offered to be 16,250,000 units offered pursuant to the primary offering and 1,250,000 units offered pursuant to the DRIP. Pursuant to Supplement No. 11 to our prospectus regarding the Offering, which was filed with the Securities and Exchange Commission on March 6, 2009, we further reallocated the units being offered to be 16,500,000 units offered pursuant to the primary offering and 1,000,000 units offered pursuant to the DRIP. The aggregate offering price for the units was $350 million. The primary offering component of the Offering was terminated on April 23, 2009. We extended the offering of our units of limited partnership interest pursuant to our DRIP until the earlier of the sale of all units of limited partnership interest being offered pursuant to our DRIP or May 15, 2010; provided, however, that our general partner was permitted to terminate the offering of units pursuant to our DRIP at any earlier time.
On June 9, 2009, we held a Special Meeting of our limited partners as of April 13, 2009, at which our limited partners approved three proposals to amend certain provisions of our Partnership Agreement for the purpose of making available additional units of limited partnership interest for sale pursuant to an Amended and Restated Distribution Reinvestment Plan. On June 12, 2009, we registered 5,000,000 additional units to be offered pursuant to our Secondary DRIP in a Registration Statement on Form S-3 (File No. 333-159939). As such, we ceased offering units under the DRIP portion of the Offering as of July 21, 2009 and concurrently commenced our offering of units pursuant to the Secondary DRIP, which is currently ongoing.
As of September 30, 2010, we had issued an aggregate of 17,644,182 units of limited partnership interest in the Offering, DRIP and Secondary DRIP, consisting of 16,499,994 units issued to our limited partners pursuant to our primary offering in exchange for gross proceeds of approximately $330.3 million, 716,260 units of limited partnership interest issued to limited partners pursuant to our DRIP in exchange for gross proceeds of approximately $14.3 million and 746,165 units of limited partnership interest issued to limited partners pursuant to our Secondary DRIP in exchange for gross proceeds of approximately $14.9 million, less 318,237 units of limited partnership interest that we have repurchased pursuant to our unit redemption program for approximately $6.4 million. The net offering proceeds to us, after deducting approximately $39.6 million of offering costs, are approximately $290.7 million. Of the offering costs, approximately $11.2 million was paid to our general partner or affiliates of our general partner for organization and offering expenses and $28.4 million was paid to non-affiliates for selling commissions and other offering fees. As of September 30, 2010, we had originated 56 loans, including 22 loans that have been repaid in full by the respective borrower, totaling approximately $432.5 million. We have approximately $44.2 million of commitments to be funded under the terms of mortgage notes receivable, including approximately $26.9 million of commitments for mortgage notes receivable – related party and $2.9 million for participation interest – related party. As of September 30, 2010, we have paid our general partner approximately $9.5 million for acquisition and origination fee expenses associated with the mortgage notes receivable.
36
Unregistered Sales of Equity Securities
During the three months ended September 30, 2010, we did not sell any equity securities that were not registered or otherwise exempt under the Securities Act of 1933, as amended.
Purchases of Equity Securities by the Partnership and Affiliated Purchasers
No units of limited partnership interest were purchased by or on behalf of the Partnership or any affiliated purchaser during the three months ended September 30, 2010.
Item 3. Defaults Upon Senior Securities.
None.
Item 4. [Removed and Reserved]
Item 5. Other Information.
None.
Item 6. Exhibits.
The exhibits filed in response to Item 601 of Regulation S-K are listed on the Index to Exhibits attached hereto.
37
SIGNATURES
Pursuant to the requirements of the Securities Exchange Act of 1934, the registrant has duly caused this report to be signed on its behalf by the undersigned thereunto duly authorized.
United Development Funding III, L.P.
By: UMTH Land Development, L.P.
Its General Partner
Dated: November 15, 2010 By: /s/ Hollis M. Greenlaw
Hollis M. Greenlaw
Chief Executive Officer, and President and Chief Executive Officer of UMT Services, Inc., sole general partner of UMTH Land Development, L.P.
(Principal Executive Officer)
By: /s/ Cara D. Obert
Cara D. Obert
Chief Financial Officer
(Principal Financial Officer)
38
Index to Exhibits
Exhibit Number Description
|
3.1
|
Second Amended and Restated Agreement of Limited Partnership of Registrant (previously filed in and incorporated by reference to Exhibit B to prospectus dated May 15, 2006, filed pursuant to Rule 424(b)(3) on May 18, 2006)
|
|
3.2
|
Certificate of Limited Partnership of Registrant (previously filed in and incorporated by reference to Registrant’s Registration Statement on Form S-11, Commission File No. 333-127891, filed on August 26, 2005)
|
|
3.3
|
First Amendment to Second Amended and Restated Agreement of Limited Partnership of Registrant (previously filed in and incorporated by reference to Exhibit B to Supplement No. 12 to prospectus dated May 15, 2006, contained within Post-Effective Amendment No. 4 to Registrant’s Registration Statement on Form S-11, Commission File No. 333-127891, filed on May 12, 2009)
|
|
4.1
|
Subscription Agreement (previously filed in and incorporated by reference to Exhibit C to Supplement No. 12 to prospectus dated May 15, 2006, contained within Post-Effective Amendment No. 4 to Registrant’s Registration Statement on Form S-11, Commission File No. 333-127891, filed on May 12, 2009)
|
|
4.2
|
Amended and Restated Distribution Reinvestment Plan (previously filed in and incorporated by reference to Registrant’s Registration Statement on Form S-3, Commission File No. 333-159939, filed on June 12, 2009)
|
|
31.1
|
Rule 13a-14(a)/15d-14(a) Certification of Principal Executive Officer (filed herewith)
|
|
31.2
|
Rule 13a-14(a)/15d-14(a) Certification of Principal Financial Officer (filed herewith)
|
|
32.1*
|
Section 1350 Certifications (furnished herewith)
|
|
|
|
*
|
In accordance with Item 601(b)(32) of Regulation S-K, this Exhibit is not deemed “filed” for purposes of Section 18 of the Exchange Act or otherwise subject to the liabilities of that section. Such certifications will not be deemed incorporated by reference into any filing under the Securities Act of 1933, as amended, or the Exchange Act, except to the extent that the registrant specifically incorporates it by reference.
|