Attached files
| file | filename |
|---|---|
| 8-K - ESSEX PROPERTY TRUST 8-K 11-15-2010 - ESSEX PROPERTY TRUST, INC. | form8k.htm |
Exhibit 99.1
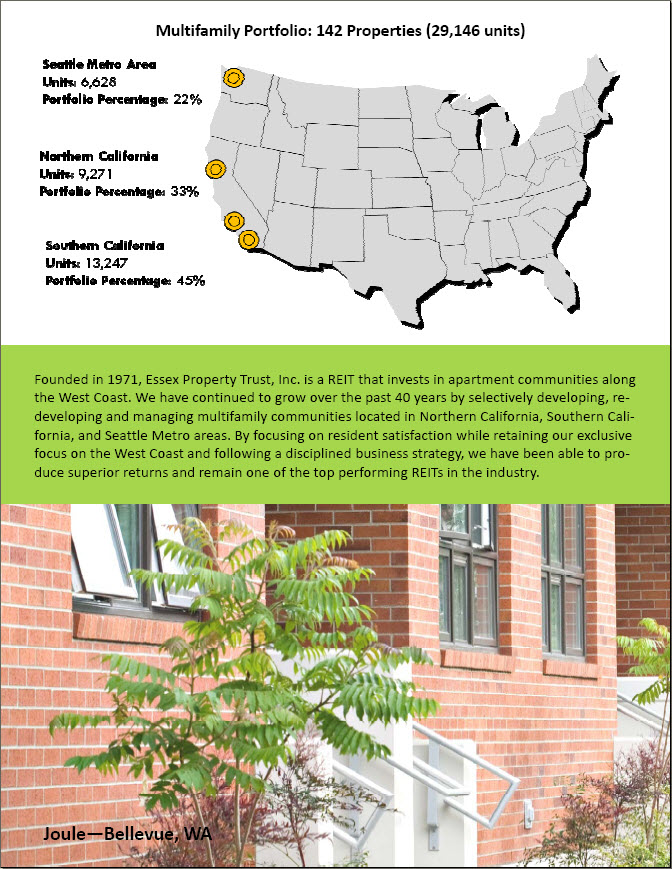
Founded in 1971, Essex Property Trust, Inc. is a REIT that invests in apartment communities along the West Coast. We have continued to grow over the past 40 years by selectively developing, redeveloping and managing multifamily communities located in Northern California, Southern California, and Seattle Metro areas. By focusing on resident satisfaction while retaining our exclusive focus on the West Coast and following a disciplined business strategy, we have been able to produce superior returns and remain one of the top performing REITs in the industry. Joule—Bellevue, WA Multifamily Portfolio: 142 Properties (29,146 units)
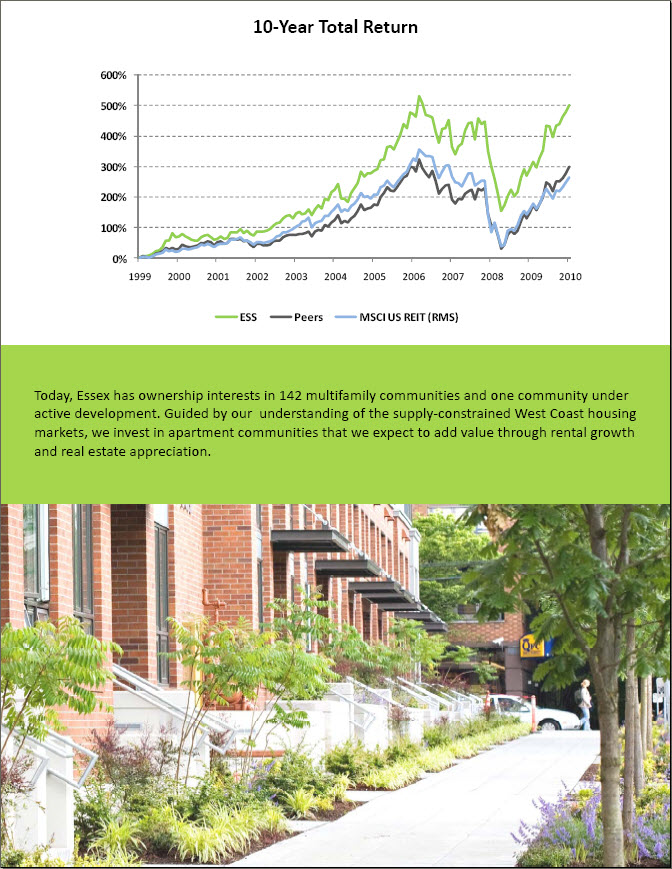
Today, Essex has ownership interests in 142 multifamily communities and one community under active development. Guided by our understanding of the supply‐constrained West Coast housing markets, we invest in apartment communities that we expect to add value through rental growth and real estate appreciation. 0% 100% 200% 300% 400% 500% 600% 1999 2000 2001 2002 2003 2004 2005 2006 2007 2008 2009 2010 ESS Peers MSCI US REIT (RMS) 10‐Year Total Return
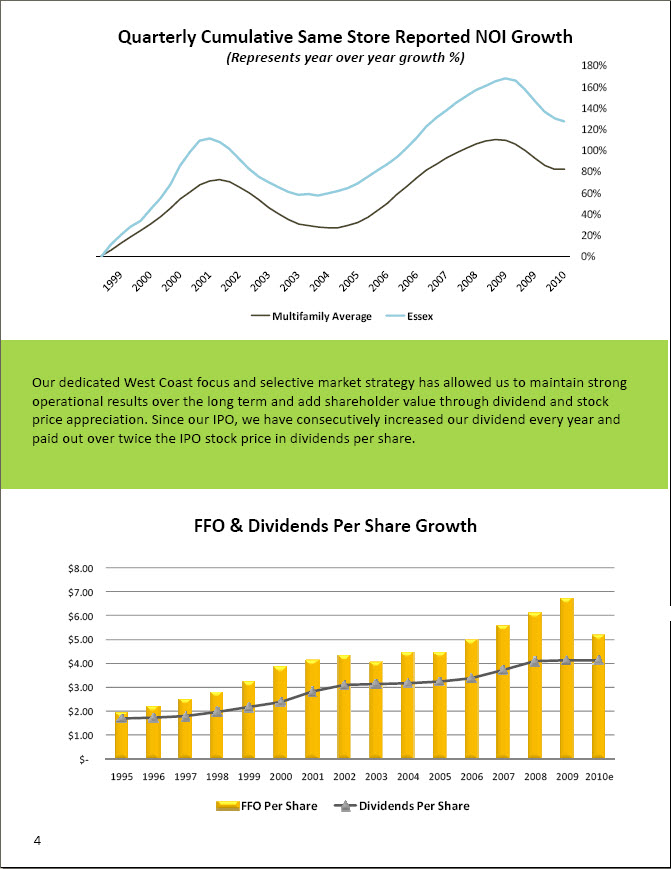
Our dedicated West Coast focus and selective market strategy has allowed us to maintain strong operational results over the long term and add shareholder value through dividend and stock price appreciation. Since our IPO, we have consecutively increased our dividend every year and paid out over twice the IPO stock price in dividends per share. 0% 20% 40% 60% 80% 100% 120% 140% 160% 180% Multifamily Average Essex FFO & Dividends Per Share Growth $‐ $1.00 $2.00 $3.00 $4.00 $5.00 $6.00 $7.00 $8.00 1995 1996 1997 1998 1999 2000 2001 2002 2003 2004 2005 2006 2007 2008 2009 2010e FFO Per Share Dividends Per Share Quarterly Cumulative Same Store Reported NOI Growth (Represents year over year growth %)
Axis 2300—Irvine, CA
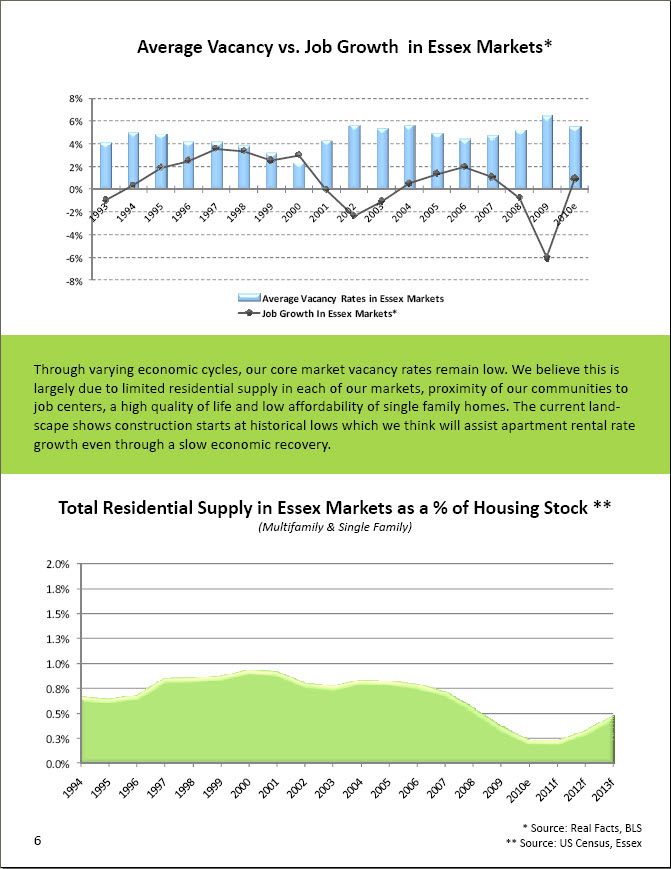
Through varying economic cycles, our core market vacancy rates remain low. We believe this is largely due to limited residential supply in each of our markets, proximity of our communities to job centers, a high quality of life and low affordability of single family homes. The current landscape shows construction starts at historical lows which we think will assist apartment rental rate growth even through a slow economic recovery. 0.0% 0.3% 0.5% 0.8% 1.0% 1.3% 1.5% 1.8% 2.0% Total Residential Supply in Essex Markets as a % of Housing Stock ** (Multifamily & Single Family) * Source: Real Facts, BLS ** Source: US Census, Essex Average Vacancy vs. Job Growth in Essex Markets* ‐8% ‐6% ‐4% ‐2% 0% 2% 4% 6% 8% Average Vacancy Rates in Essex Markets Job Growth In Essex Markets*
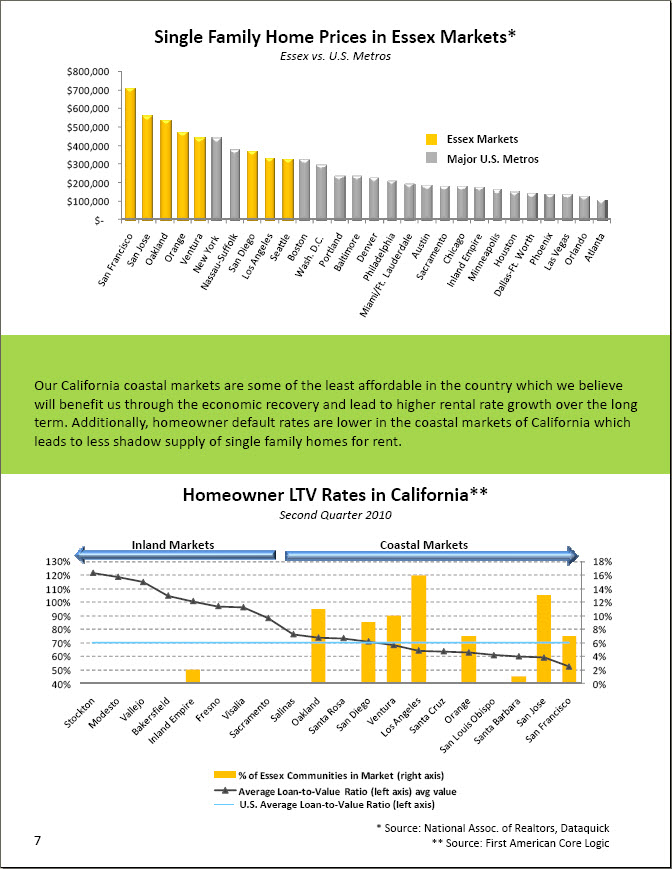
0% 2% 4% 6% 8% 10% 12% 14% 16% 18% 40% 50% 60% 70% 80% 90% 100% 110% 120% 130% % of Essex Communities in Market (right axis) Average Loan‐to‐Value Ratio (left axis) avg value $‐ $100,000 $200,000 $300,000 $400,000 $500,000 $600,000 $700,000 $800,000 Inland Markets Coastal Markets Our California coastal markets are some of the least affordable in the country which we believe will benefit us through the economic recovery and lead to higher rental rate growth over the long term. Additionally, homeowner default rates are lower in the coastal markets of California which leads to less shadow supply of single family homes for rent. * Source: National Assoc. of Realtors, Dataquick ** Source: First American Core Logic Essex Markets Major U.S. Metros Homeowner LTV Rates in California** Second Quarter 2010 Single Family Home Prices in Essex Markets* Essex vs. U.S. Metros U.S. Average Loan‐to‐Value Ratio (left axis)
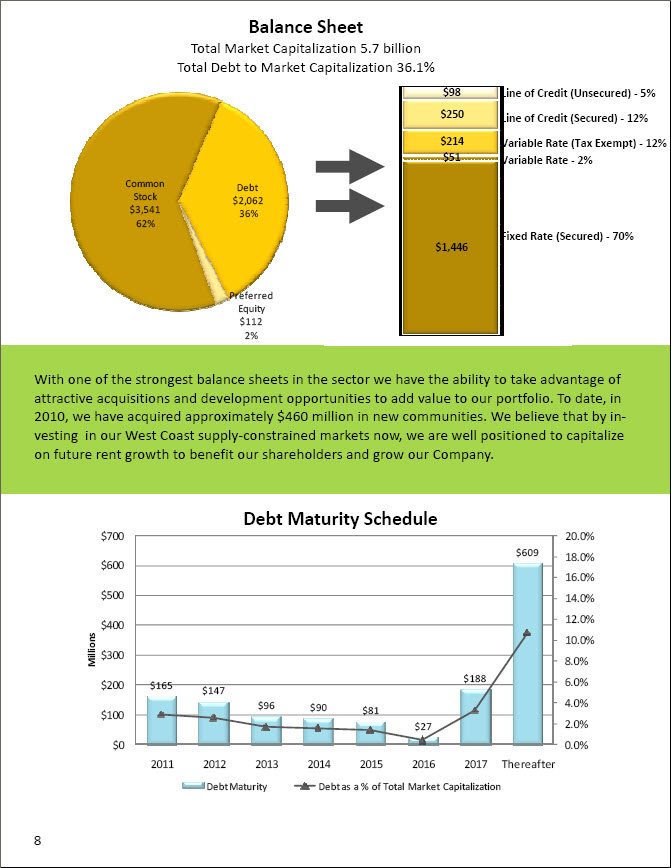
Common Stock $3,541 62% Debt $2,062 36% Preferred Equity $112 2% With one of the strongest balance sheets in the sector we have the ability to take advantage of attractive acquisitions and development opportunities to add value to our portfolio. To date, in 2010, we have acquired approximately $460 million in new communities. We believe that by investing in our West Coast supply‐constrained markets now, we are well positioned to capitalize on future rent growth to benefit our shareholders and grow our Company. $1,446 $51 $214 $250 $98 Line of Credit (Unsecured) ‐ 5% Line of Credit (Secured) ‐ 12% Variable Rate (Tax Exempt) ‐ 12% Variable Rate ‐ 2% Fixed Rate (Secured) ‐ 70% Balance Sheet Total Market Capitalization 5.7 billion Total Debt to Market Capitalization 36.1% $165 $147 $96 $90 $81 $27 $188 $609 0.0% 2.0% 4.0% 6.0% 8.0% 10.0% 12.0% 14.0% 16.0% 18.0% 20.0% $0 $100 $200 $300 $400 $500 $600 $700 2011 2012 2013 2014 2015 2016 2017 Thereafter Millions Debt Maturity Debt as a % of Total Market Capitalization Debt Maturity Schedule
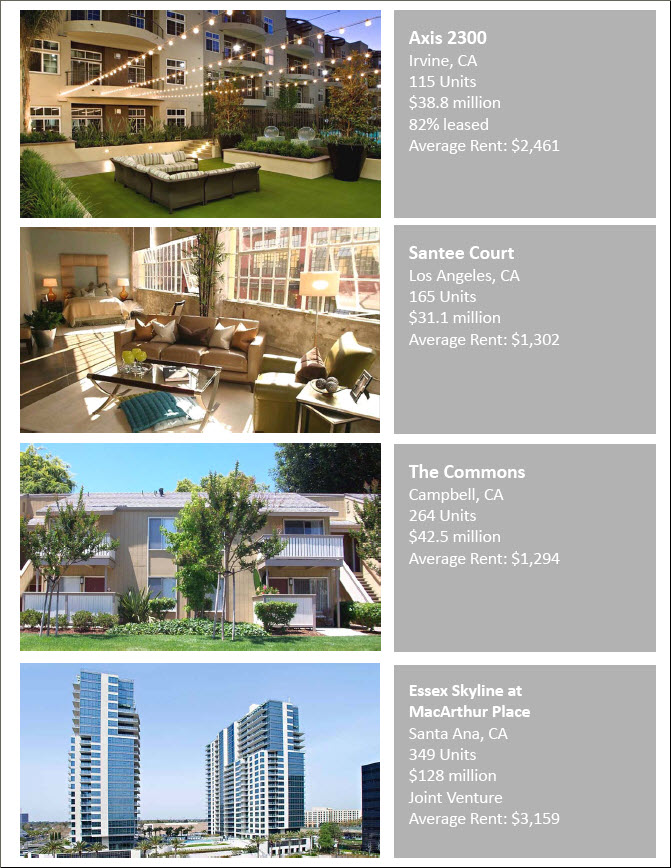
Axis 2300 Irvine, CA 115 Units $38.8 million 82% leased Average Rent: $2,461 Santee Court Los Angeles, CA 165 Units $31.1 million Average Rent: $1,302 The Commons Campbell, CA 264 Units $42.5 million Average Rent: $1,294 Essex Skyline at MacArthur Place Santa Ana, CA 349 Units $128 million Joint Venture Average Rent: $3,159
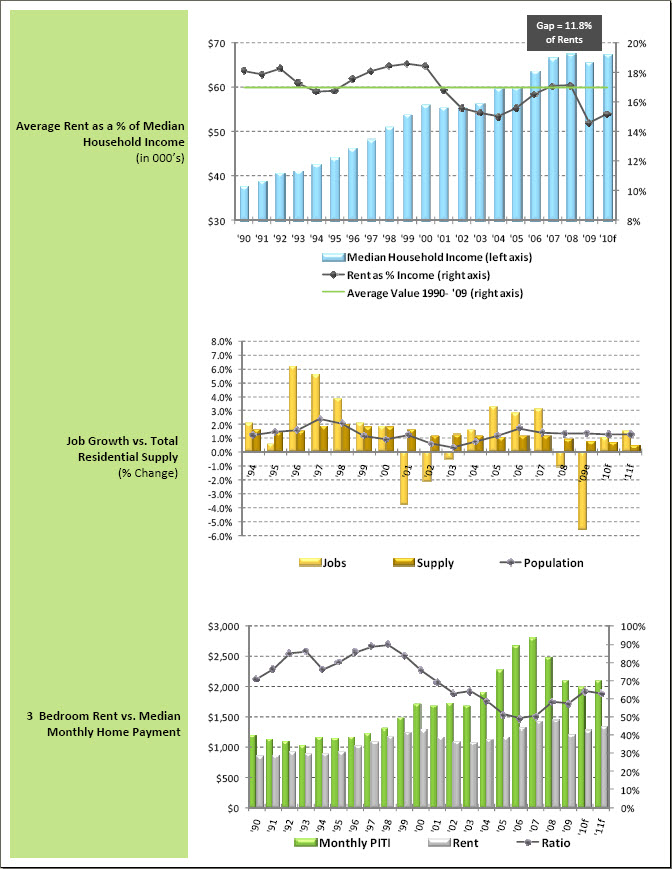
8% 10% 12% 14% 16% 18% 20% $30 $40 $50 $60 $70 '90 '91 '92 '93 '94 '95 '96 '97 '98 '99 '00 '01 '02 '03 '04 '05 '06 '07 '08 '09 '10f Median Household Income (left axis) Rent as % Income (right axis) Average Value 1990‐ '09 (right axis) Average Rent as a % of Median Household Income (in 000’s) Job Growth vs. Total Residential Supply (% Change) 3 Bedroom Rent vs. Median Monthly Home Payment ‐6.0% ‐5.0% ‐4.0% ‐3.0% ‐2.0% ‐1.0% 0.0% 1.0% 2.0% 3.0% 4.0% 5.0% 6.0% 7.0% 8.0% Jobs Supply Population 0% 10% 20% 30% 40% 50% 60% 70% 80% 90% 100% $0 $500 $1,000 $1,500 $2,000 $2,500 $3,000 Monthly PITI Rent Ratio Gap = 11.8% of Rents
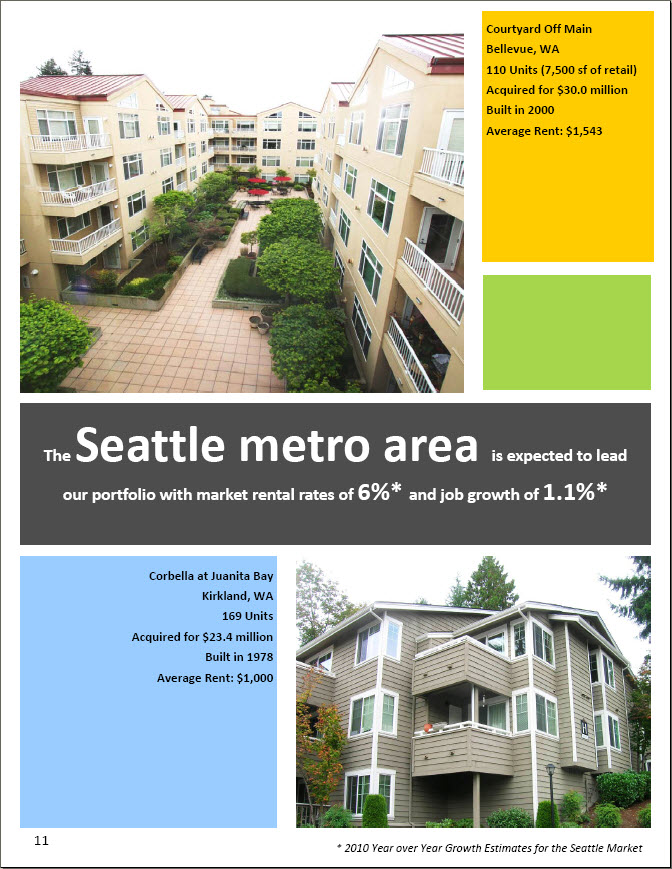
The Seattle metro area is expected to lead our portfolio with market rental rates of 6%* and job growth of 1.1%* Courtyard Off Main Bellevue, WA 110 Units (7,500 sf of retail) Acquired for $30.0 million Built in 2000 Average Rent: $1,543 Corbella at Juanita Bay Kirkland, WA 169 Units Acquired for $23.4 million Built in 1978 Average Rent: $1,000 * 2010 Year over Year Growth Estimates for the Seattle Market
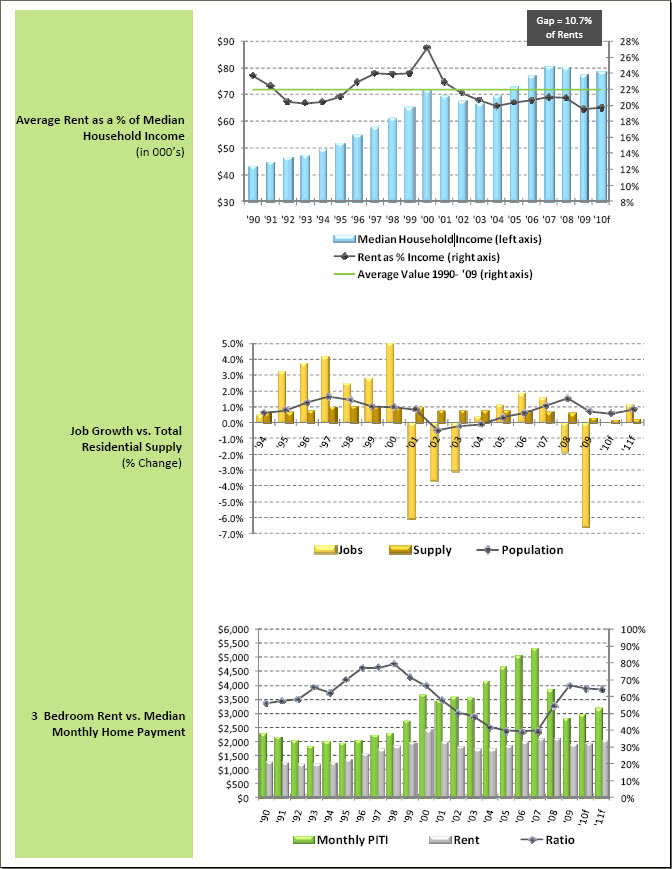
8% 10% 12% 14% 16% 18% 20% 22% 24% 26% 28% $30 $40 $50 $60 $70 $80 $90 '90 '91 '92 '93 '94 '95 '96 '97 '98 '99 '00 '01 '02 '03 '04 '05 '06 '07 '08 '09 '10f Median Household Income (left axis) Rent as % Income (right axis) Average Value 1990‐ '09 (right axis) Average Rent as a % of Median Household Income (in 000’s) Job Growth vs. Total Residential Supply (% Change) 3 Bedroom Rent vs. Median Monthly Home Payment ‐7.0% ‐6.0% ‐5.0% ‐4.0% ‐3.0% ‐2.0% ‐1.0% 0.0% 1.0% 2.0% 3.0% 4.0% 5.0% Jobs Supply Population 0% 10% 20% 30% 40% 50% 60% 70% 80% 90% 100% $0 $500 $1,000 $1,500 $2,000 $2,500 $3,000 $3,500 $4,000 $4,500 $5,000 $5,500 $6,000 Monthly PITI Rent Ratio Gap = 10.7% of Rents
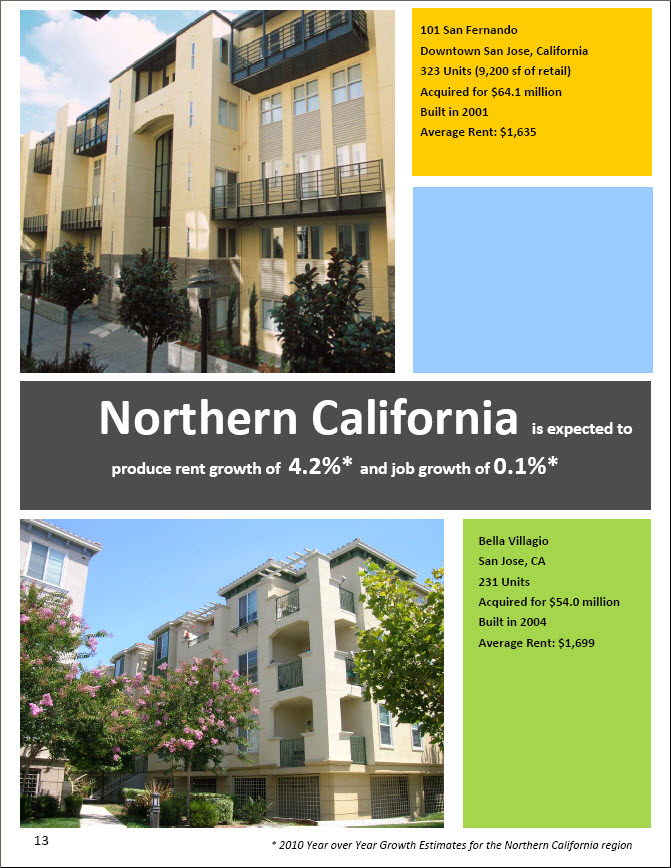
101 San Fernando Downtown San Jose, California 323 Units (9,200 sf of retail) Acquired for $64.1 million Built in 2001 Average Rent: $1,635 Northern California is expected to produce rent growth of 4.2%* and job growth of 0.1%* Bella Villagio San Jose, CA 231 Units Acquired for $54.0 million Built in 2004 Average Rent: $1,699 * 2010 Year over Year Growth Estimates for the Northern California region
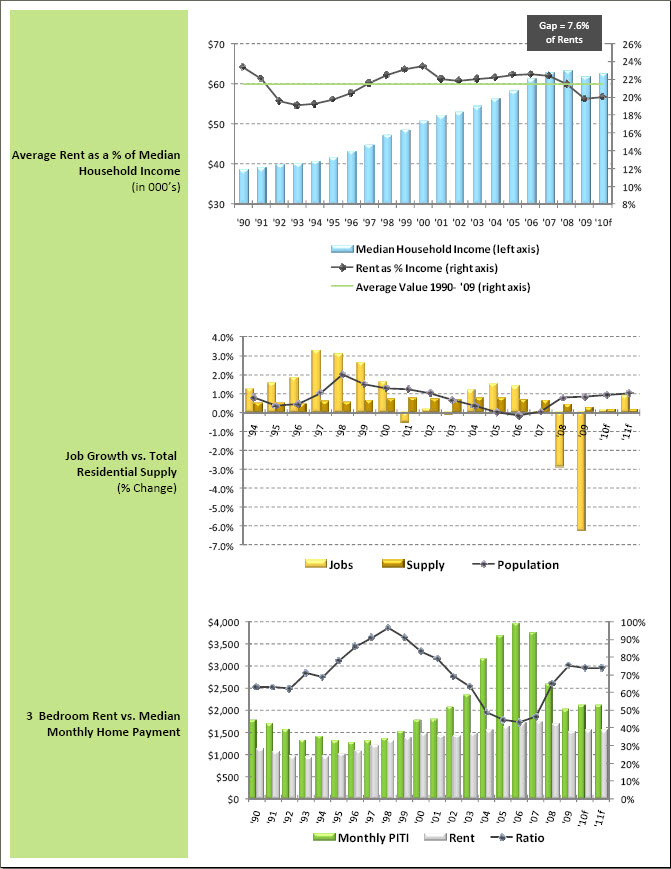
8% 10% 12% 14% 16% 18% 20% 22% 24% 26% $30 $40 $50 $60 $70 '90 '91 '92 '93 '94 '95 '96 '97 '98 '99 '00 '01 '02 '03 '04 '05 '06 '07 '08 '09 '10f Median Household Income (left axis) Rent as % Income (right axis) Average Value 1990‐ '09 (right axis) Average Rent as a % of Median Household Income (in 000’s) Job Growth vs. Total Residential Supply (% Change) 3 Bedroom Rent vs. Median Monthly Home Payment ‐7.0% ‐6.0% ‐5.0% ‐4.0% ‐3.0% ‐2.0% ‐1.0% 0.0% 1.0% 2.0% 3.0% 4.0% Jobs Supply Population 0% 10% 20% 30% 40% 50% 60% 70% 80% 90% 100% $0 $500 $1,000 $1,500 $2,000 $2,500 $3,000 $3,500 $4,000 Monthly PITI Rent Ratio Gap = 7.6% of Rents
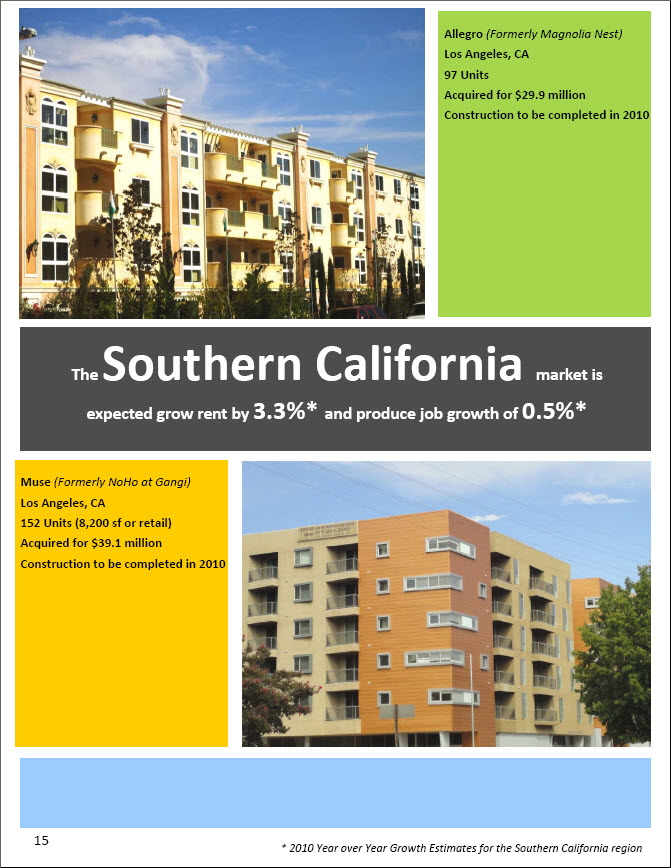
The Southern California market is expected grow rent by 3.3%* and produce job growth of 0.5%* Muse (Formerly NoHo at Gangi) Los Angeles, CA 152 Units (8,200 sf or retail) Acquired for $39.1 million Construction to be completed in 2010 Allegro (Formerly Magnolia Nest) Los Angeles, CA 97 Units Acquired for $29.9 million Construction to be completed in 2010 * 2010 Year over Year Growth Estimates for the Southern California region