Attached files
| file | filename |
|---|---|
| 8-K - CURRENT REPORT - CHART INDUSTRIES INC | d8k.htm |
 Chart 2010
Investment Highlights Exhibit 99.1 |
| Disclosure
Forward-Looking
Statements:
This
presentation
includes
“forward-looking
statements”
within
the
meaning
of
the
Private Securities Litigation Reform Act of 1995. The use of words such as
“may”, “might”, “should”, “will”,
“expect”,
“plan”,
“anticipate”,
“believe”,
“estimate”,
“project”,
“forecast”,
“outlook”,
“intend”,
“future”,
“potential”
or
“continue”, and other similar expressions are intended to identify
forward-looking statements. All of these forward-looking
statements
are
based
on
estimates
and
assumptions
by
our
management
as
of
the
date
of
this
presentation that, although we believe to be reasonable, are inherently uncertain.
Forward-looking statements involve risks and uncertainties that could
cause the Company’s actual results or circumstances to differ
materially from those expressed or implied by forward-looking statements.
These risks and uncertainties include, among others, the following: the
cyclicality of the markets that the Company serves and the vulnerability of
those markets to economic downturns; the negative impacts of the recent global economic and financial crisis;
a delay, significant reduction in or loss of purchases by large customers;
fluctuations in energy prices and changes in government energy policy;
uncertainties associated with pending legislation initiatives relating to the
use of natural gas as a transportation fuel; competition; our reliance on key
suppliers and potential supplier failures or defects; the modification or
cancellation of orders in our backlog; the impact of the financial distress of
third parties; changes in government healthcare regulations and reimbursement
policies; general economic, political, business and market risks associated
with the Company's global operations; fluctuations in foreign currency
exchange and interest rates; potential future charges to income associated with potential impairment of
the Company’s significant goodwill and other intangibles; the Company's
ability to successfully manage its costs, core business resources and
growth, including its ability to successfully acquire and integrate new product lines
or
businesses
and
manage
operational
expansions;
the
loss
of
key
employees
and
deterioration
of
labor
and
employee relations; the pricing and availability of raw materials; the Company's
ability to manage its fixed-price contract exposure; the regulation of
our products by the U.S. Food & Drug Administration and other
governmental authorities; additional liabilities related to taxes; the costs of
compliance with environmental, health and
safety
laws,
and
potential
liabilities
under
these
laws;
the
impact
of
hurricanes
and
other
severe
weather;
litigation
and
disputes
involving
the
Company,
including
product
liability,
contract,
warranty,
pension,
intellectual
property and employment claims; volatility and fluctuation in the price of the
Company’s stock; and risks associated with our indebtedness. For a
discussion of these and additional risks that could cause actual results
to
differ
from
those
described
in
the
forward-looking
statements,
see
disclosure
under
Item
1A.
“Risk
Factors”
in
the Company’s most recent Annual Report on Form 10-K and other recent
filings with the Securities and Exchange
Commission,
which
should
be
reviewed
carefully.
Please
consider
the
Company’s
forward-looking
statements in light of these risks. Any forward-looking statement
speaks only as of its date. We undertake no obligation to publicly update or
revise any forward-looking statement, whether as a result of new information,
future events or otherwise, except as required by law.
1 |
 2
Technology
leader
-
energy
industry
is
the
largest
end-user
of
Chart’s
products
Leading
position
-
#1
or
#2
in
all
primary
markets
served
Global
footprint
–
operations
on
four
continents
with
about
2,800
employees
Worldwide
earnings
–
approximately
60%
of
sales
derived
from
outside
the
U.S.
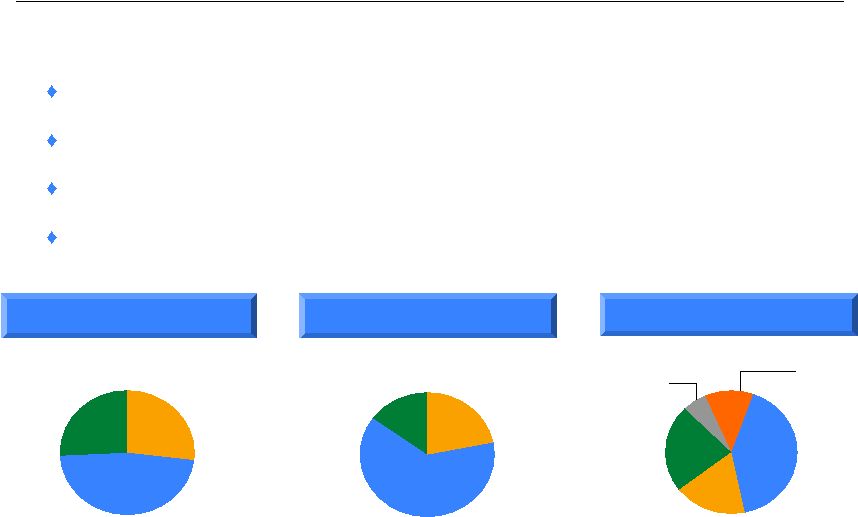
Company Overview
Chart Industries is a leading provider of highly engineered cryogenic
equipment for the hydrocarbon, industrial gas, and biomedical markets.
Asia
23%
U.S.
41%
Americas
(Non-US)
6%
RoW
12%
Europe
18%
Sales by Segment *
Energy
63%
BioMedical
15%
General
Industrial
22%
Sales by Region **
Sales by End-User **
Energy &
Chemicals
27%
Distribution
& Storage
47%
BioMedical
26%
* TTM ending 09/30/2010
** Based on 2009 data |
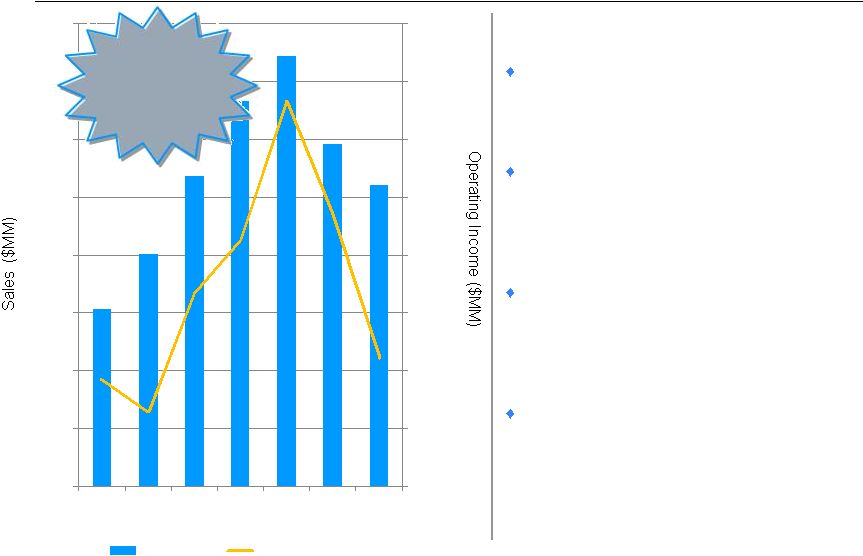 Strong Track Record of Successful Execution
3
0
20
40
60
80
100
120
140
160
0
100
200
300
400
500
600
700
800
2004
2005
2006
2007
2008
2009
TTM
9/30/2010
Sales
Operating Income
(1) Included in 2005 are non-recurring costs of $26.5
million for the acquisition of Chart Industries by First Reserve.
(1)
During last growth cycle Company leveraged
its flexible manufacturing platform resulting in
operating income growth that outpaced sales
Flexible cost structure and good execution
allowed for aggressive response to economic
downturn resulting in higher operating income
level than last cycle low point
Lean initiatives and improving performance
continue to drive favorable earnings and cash
generation, resulting in strong balance sheet
with significant liquidity
Similar or higher growth, leveraged by
acquisitions, expected to occur again during
the next growth cycle anticipated to begin in
the second half of 2011
Last Growth
Cycle CAGR
(2004-2008)
Sales 25%
Oper. Inc. 38% |
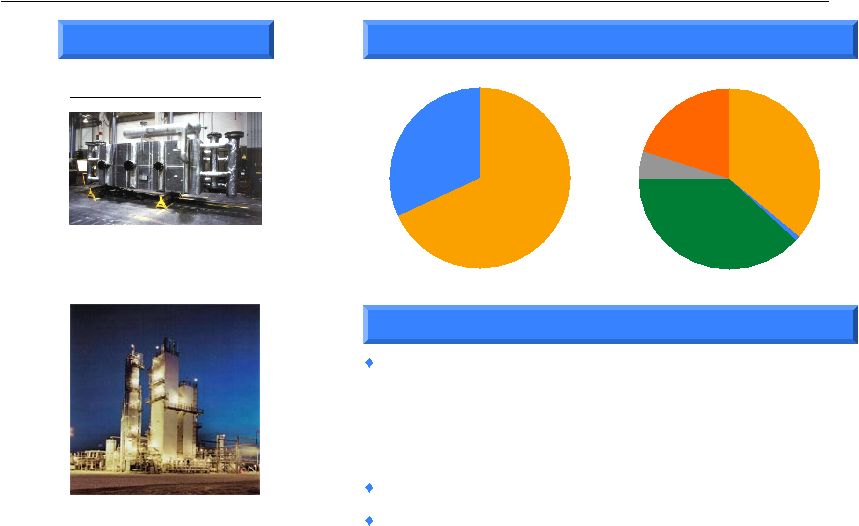 Energy & Chemicals (E&C) Segment Overview
4
Heat Exchanger
Cold Box
Production
Heat
Exchangers
68%
Cold Boxes and
LNG VIP
32%
Sales by Product / Region *
Highlights
Technology
leader
-
providing
heat
exchangers
and
cold
boxes critical to LNG, Olefin petrochemicals, natural gas
processing and industrial gas markets
–
Separation, liquefaction and purification of hydrocarbon and
industrial gases
Market leader –
leading market positions worldwide
Manufacturing
leader
-
one
of
three
global
suppliers
of
mission-critical LNG and LNG liquefaction equipment
Selected Products
Americas
(Non-US)
5%
RoW
20%
Asia
38%
U.S.
36%
Europe
1%
* Based on 2009 data |
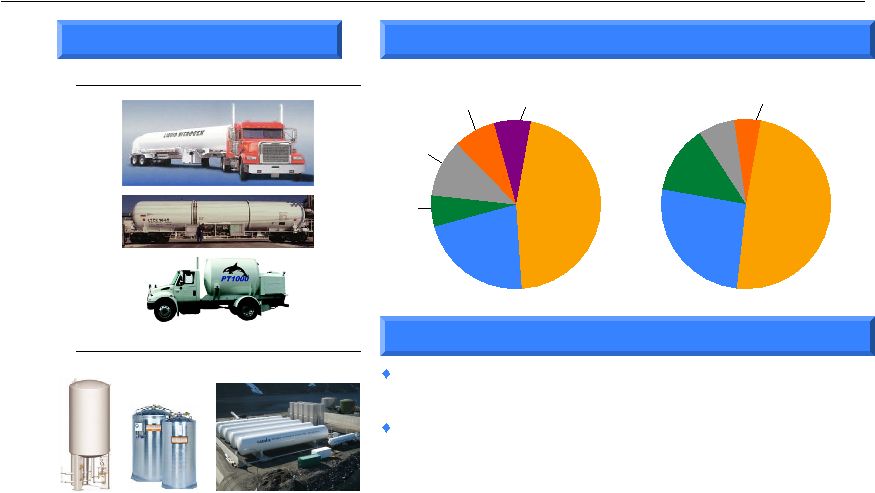 Distribution & Storage (D&S) Segment Overview
5
Sales by Product / Region *
Highlights
Balanced
customer
base
-
46%of
segment
sales
derived
from products used in energy applications
Strategic
footprint
–
manufacturing
located
near
growing
end
markets and lower-cost countries
–
Positioned to capitalize on strong expected growth in Asia and
Eastern Europe
–
Continued investment in key global manufacturing facilities
Bulk
MicroBulk
Distribution
Storage
Satellite
LNG Storage
Bulk Storage
Systems
46%
Packaged Gas
Systems
22%
VIP, Systems
and Components
6%
Parts, Repair and On-
Site Service
11%
Beverage Liquid
CO
2
Systems
8%
LNG Terminals
and Vehicle Fuel
Systems 7%
Americas
(Non-US)
7%
RoW
5%
Asia
13%
U.S.
49%
Europe
26%
* Based on 2009 data
Selected Products |
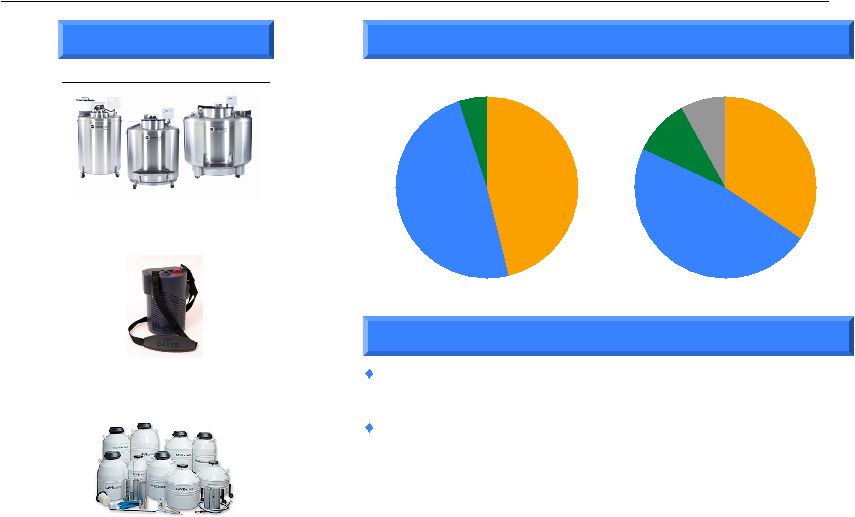 BioMedical
Segment Overview
6
Sales by Product / Region *
Highlights
Strong growth -
increases in oxygen respiratory therapy and
biomedical research, led by international markets, expected
Robust end markets include:
–
Home healthcare and nursing homes
–
Hospitals and long-term care
–
Biomedical and pharmaceutical research
–
Animal breeding
Portable Oxygen
Lab Storage
Stainless
Steel
Freezer
End-Use Consumption
Respiratory
Therapy
Systems
46%
Other
5%
Biological
Storage
Systems
49%
Americas
(Non-US)
9%
U.S.
34%
Europe
47%
Asia
10%
* Based on 2009 data
Selected Products |
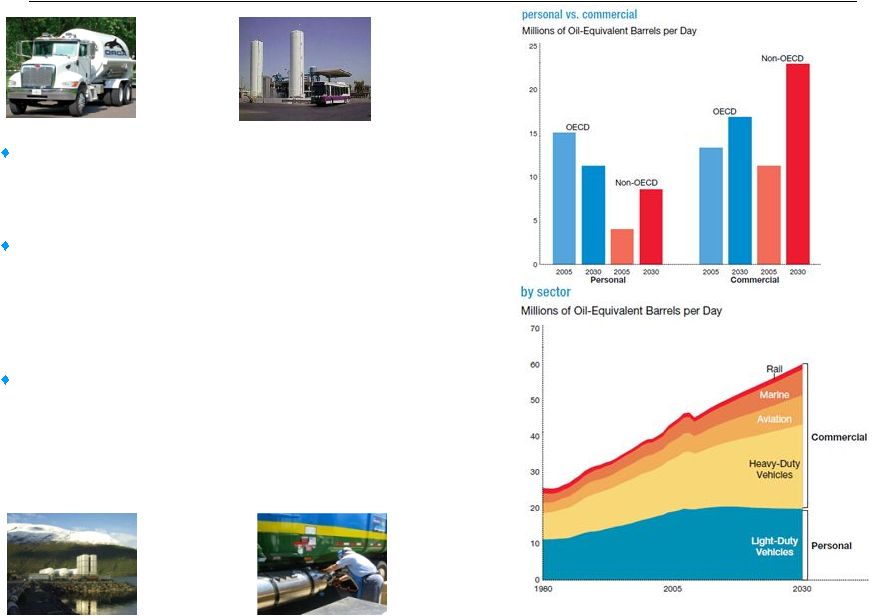
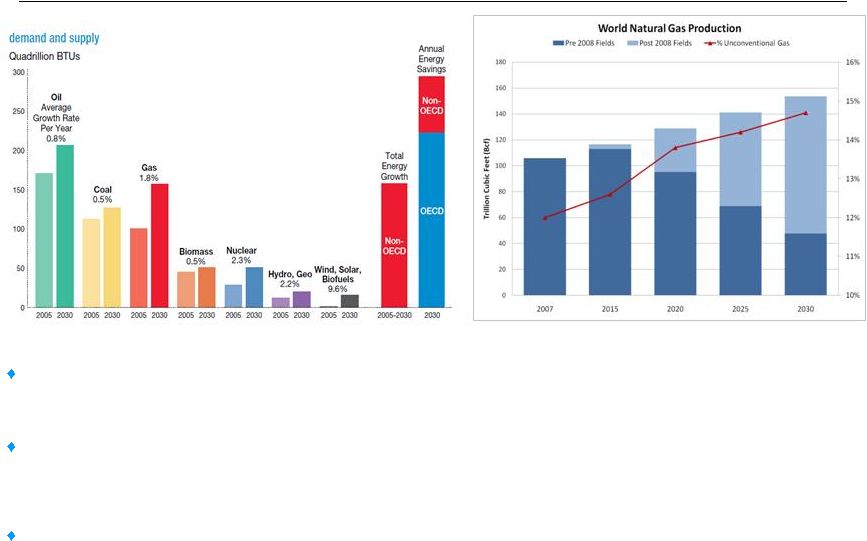 7
Growing
industry
-
natural
gas
demand
is
expected
to
continue
to
grow
at
a
pace
faster
than
coal
and
oil, and will be heavily weighted towards emerging economies, which is expected to
drive demand for Chart’s products.
Natural gas
expansion
-
U.S.
natural
gas
processing
is
expected
to
rise
due
to
the
production
of
unconventional gas. World primary demand for natural gas expands on average
by 1.5% per year with the
biggest
increases
in
the
Middle
East,
China
and
India.
(Source:
International
Energy
Agency
–
World
Energy
Outlook 2009, Reference Scenario)
LNG
growth
leader
-
“Global
gas
demand
is
likely
to
rise
by
25%,
while
the
use
of
LNG
is
set
to
surge
by
40%
by
2020.”
(Source:
ExxonMobil
quoted
at
CWC
World
LNG
Summit,
Barcelona
–
December
2009)
Global Natural Gas Production and Demand
Source:
ExxonMobil
–
Outlook
for
Energy,
A
View
to
2030 |
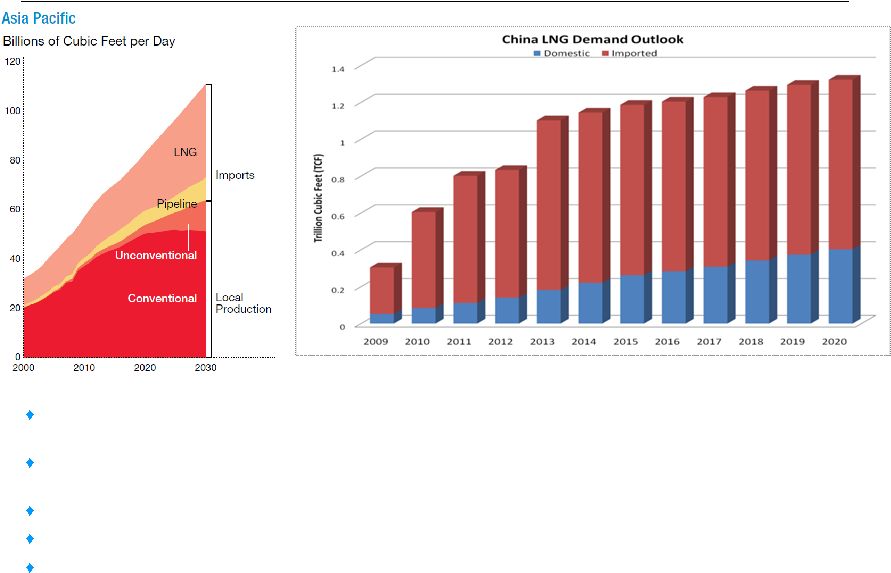 8
Dramatic
increase
in
imported
LNG
in
China
has
already
begun
and
is
expected
to
accelerate,
with
China
aggressively investing in LNG infrastructure, including LNG transportation and
storage equipment China’s
twelfth
5-year
plan
(2011
-
2015)
mandates
an
increase
of
gas
as
a
percentage
of
energy
consumption
from less than 4% to over 8% (compared to over 20% for the U.S.)
Chart E&C is major supplier of key liquefier technology and components for
domestic and imported production China road transit authority expects to add
2 million new gas fueled vehicles, with 2/3 being LNG Lack
of
pipeline
infrastructure
in
China
requires
“virtual
pipeline”
with
LNG,
and
Chart
D&S
equipment
(e.g.,
storage, transportation, etc.) can fill this gap
China
LNG
Demand
Outlook
Source: Company Estimates
Source:
ExxonMobil
–
Outlook
for
Energy,
A
View
to
2030 |
 9
Natural
gas
penetration
–
increasing
as
a
viable
energy
source and transportation fuel due to its high energy density,
lower costs and low emissions
Broad
product
offering
-
Chart
provides
products
and
solutions for the full LNG value chain: LNG liquefiers,
transportation equipment, terminal storage equipment and
vehicle tanks for both on-road and off-road heavy duty
vehicles and marine applications
Favorable
environment
-
Congress
likely
to
move
on
energy
bill initiatives, which could significantly boost natural gas
vehicle adoption in U.S. and drive a multi-year build-out of
LNG production, storage and distribution infrastructure and
creating additional market opportunities for Chart
LNG
“Virtual
Pipeline”
and
Transportation
Fuel
Source: ExxonMobil –
Outlook for Energy, A View to 2030 |
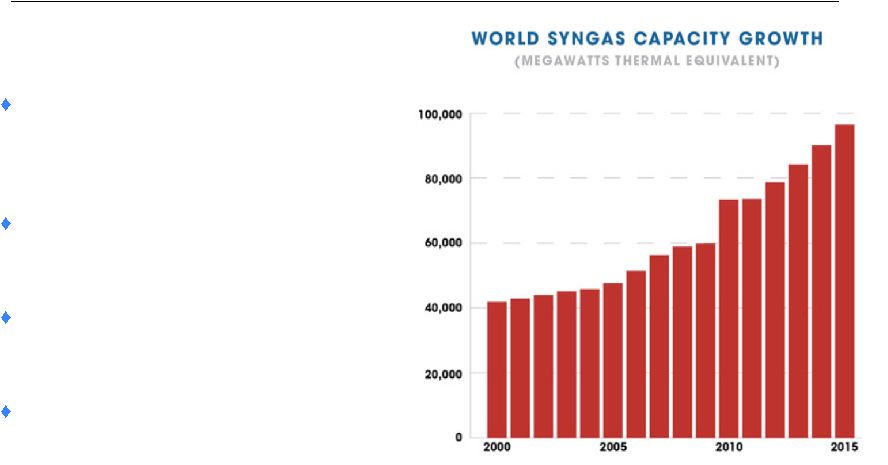 Organic Growth Opportunities –
E&C
10
Significant exposure to expected
global energy demand growth,
especially in emerging economies
North American Natural Gas
processing
Small-mid and base load LNG global
projects
Environmental legislation and
alternative energy opportunities
Source: Gasification Technologies Council |
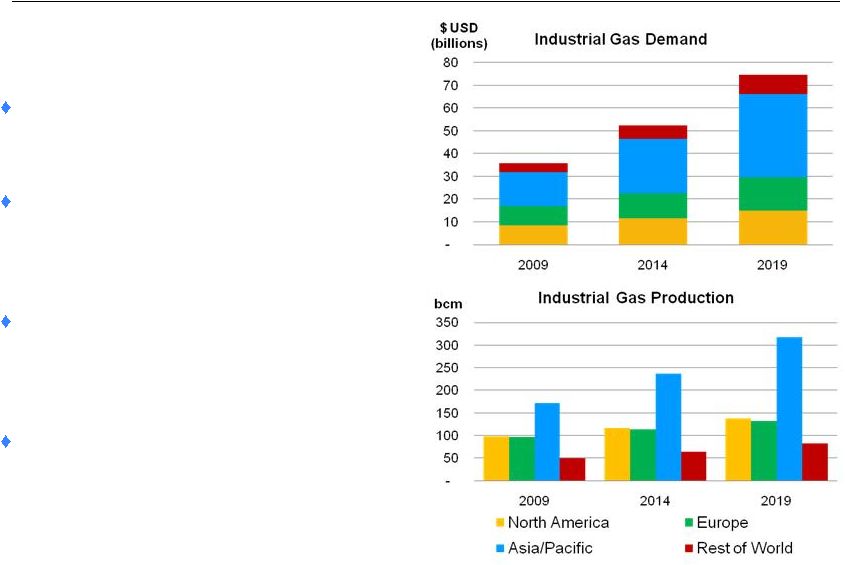 Organic Growth Opportunities –
D&S
11
Global relationships with major industrial
gas companies and distributors
World demand for industrial gases is
forecast to increase 8% annually to over
$52 billion in 2014 *
Supply of equipment for LNG virtual
pipeline, and fuel tanks for heavy duty
vehicles and marine transportation
Expanding aftermarket business
* Source: Freedonia
Group Inc, August 2010 "World Industrial Gases"
|
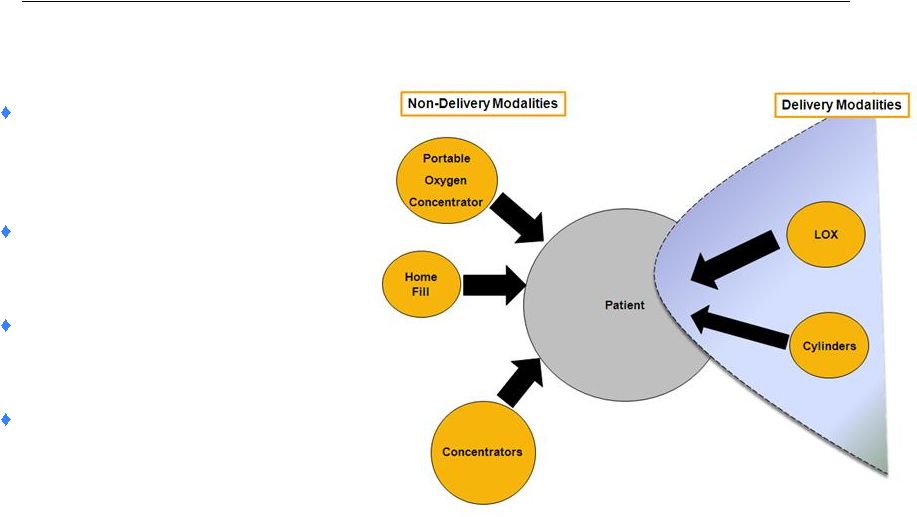 Organic Growth Opportunities–
BioMedical
Oxygen respiratory therapy growth
with aging demographics, especially
in emerging markets
Expansion of product portfolio to
non-delivery modalities
Increasing biological research
expenditures
New product development
12 |
 M&A Growth Initiatives
13
Invested $78 million in seven acquisitions completed over the past five years adding
over $150 million in sales with all acquisitions being accretive to
earnings Current economic environment continues to provide acquisition
opportunities for Chart, especially with its strong balance sheet and more
than adequate liquidity Target acquisition criteria (variation possible where
fit is right) Companies with high growth potential, industry leadership
potential and/or a proven business model that can be leveraged on
Chart’s global platform Current platforms for equipment supply:
Complements to cryogenics, industrial gas, LNG and LNG fueling, natural
gas processing, air separation, hydrocarbon processing, heat exchange, low
temperature storage or respiratory therapy
New business platforms for equipment supply
•
Energy
Segments:
Natural
gas
processing,
enhanced
oil
and
gas
recovery,
steam
methane reforming for
hydrogen production, efficient electrical energy generation and CNG fueling
•
Industrial
Gas
Segments:
•
Other Segments:
Two experienced senior professionals added in corporate development to focus on growth
Gas
generation
and
liquefaction,
CO
2
,
food
and
beverage
and
gas
distribution
Healthcare,
water
treatment,
compact
heat
exchangers,
and
gas
compression |
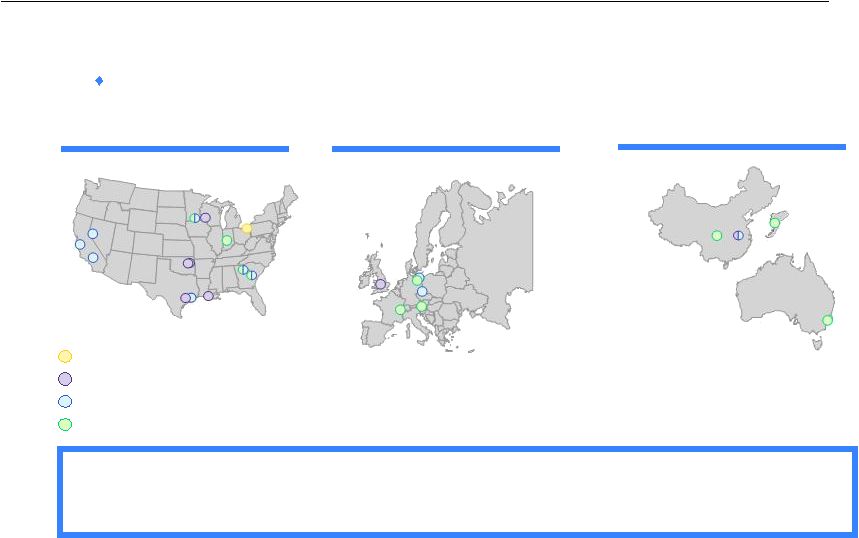 Global Manufacturing and Distribution Platform
14
Operating
leverage
provides
the
flexibility
to
expand
and
reduce
capacity
as
needed with minimal capital expenditures
Manufacturing facilities are strategically located in lower-cost countries
and near centers of demand
Energy & Chemicals
Distribution & Storage
BioMedical
Total:
Manufacturing:
Europe
Asia-Pacific
14
9
6
2
4
2
North America
Corporate |
 Summary of Investment Highlights
Positioned for continued significant growth as markets continue to recover
–
Substantial organic growth expected, especially in China and across Asian markets
–
New product development taking advantage of leading proprietary technology and
designs –
Strong track record of maximizing operating efficiencies and growth
–
Continued
inorganic
growth
initiatives
with
continued
strategic,
accretive
acquisition
activity
Flexible Manufacturing Platform
–
Ability to rapidly adjust production as demand fluctuates
–
Necessary
capacity
expansion
or
contraction
is
easily
attainable
without
significant
spend
Very strong balance sheet
–
Improved net debt position, but will continue to optimize capital structure
–
Substantial
free
cash
flow
growth
and
liquidity,
especially
with
new
senior
credit
facility
Very stable business model
–
Attractive industry with long-term customer relationships
–
Solid platform with worldwide presence and leading market positions in all
segments 15
Chart represents a unique investment opportunity to capitalize on the return of
strong growth in the markets it serves |