Attached files
| file | filename |
|---|---|
| 8-K - FORM 8-K - ALLSCRIPTS HEALTHCARE SOLUTIONS, INC. | d8k.htm |
 Investor
Presentation November 2010
Exhibit 99.1
1 |
 2
| Copyright ©
2010 Allscripts Healthcare Solutions, Inc.
A Connected Community of Health
Forward Looking Statements
This presentation contains forward-looking statements within the meaning of the
federal securities laws. Statements regarding future events or developments, our
future performance, as well as management's expectations, beliefs, intentions, plans, estimates
or projections relating to the future are forward-looking statements with the meaning
of these laws. These forward-looking statements are subject to a number of
risks and uncertainties, some of which are outlined below. As a result, no assurances can be
given that any of the events anticipated by the forward-looking statements will
transpire or occur, or if any of them do so, what impact they will have on our
results of operations or financial condition. Such risks, uncertainties and other factors include, among
other things: the possibility that the expected synergies, efficiencies and cost savings
of the merger with Eclipsys Corporation ("Eclipsys") will not be realized,
or will not be realized within the expected time period; potential difficulties or delays in achieving
platform and product integration and the connection and movement of data among hospitals,
physicians, patients and others; the risk that the Allscripts and Eclipsys
businesses will not be integrated successfully; competition within the industries in which we
operate; failure to achieve certification under the Health Information Technology for
Economic and Clinical Health Act could result in increased development costs, a
breach of some customer obligations and could put us at a competitive disadvantage in the
marketplace; the volume and timing of systems sales and installations, the length of sales
cycles and the installation process and the possibility that our products will not
achieve or sustain market acceptance; the timing, cost and success or failure of new
product and service introductions, development and product upgrade releases; competitive
pressures including product offerings, pricing and promotional activities; our
ability to establish and maintain strategic relationships; undetected errors or similar
problems in our software products; the outcome of any legal proceeding that has been or
may be instituted against us; compliance with existing laws, regulations and
industry initiatives and future changes in laws or regulations in the healthcare industry, including
possible regulation of our software by the U.S. Food and Drug Administration; the
possibility of product-related liabilities; our ability to attract and retain
qualified personnel; the implementation and speed of acceptance of the electronic record provisions
of the American Recovery and Reinvestment Act of 2009; maintaining our intellectual
property rights and litigation involving intellectual property rights; risks
related to third-party suppliers and our ability to obtain, use or successfully integrate third-party
licensed technology; and breach of our security by third parties. See our Annual Report on
Form 10-K for the fiscal year ended May 31, 2010 and other public filings with
the SEC for a further discussion of these and other risks and uncertainties applicable to
our business. The statements herein speak only as of their date and we undertake no duty
to update any forward-looking statement whether as a result of new information,
future events or changes in expectations. |
 3
|
 4
| Copyright ©
2010 Allscripts Healthcare Solutions, Inc.
A Connected Community of Health
Allscripts Corporate Snapshot
Our Clients
>
•
180,000 Providers
•
150,000 Physician Practices
•
1,500 Hospitals
•
10,000 Post Acute Facilities
•
27,000 Clinicians In Patients’
Homes Every Day
Our Company
•
5,500 Employees
•
$1.2BB LTM Pro Forma Revenue
•
Facilities in 24 States,
Canada, India, the Middle East
and The Philippines
•
1 Complete Set of Solutions
> |
 5
| Copyright ©
2010 Allscripts Healthcare Solutions, Inc.
A Connected Community of Health
Investment Highlights
Leading healthcare IT company with the broadest set of capabilities across every
venue of care including physicians, hospitals, post-acute and homecare
The most utilized clinical solutions enabling health care providers to fully capitalize
on the $30BB federal stimulus program
Leadership in technology and innovation uniquely positions Allscripts to
aggressively compete for the $43BB healthcare IT solutions market
A highly attractive financial profile
with high recurring revenue, significant
operating leverage and cost synergy opportunities and strong free cash flow
Proven
and
experienced
“industrial
strength”
management
team
>
>
>
>
> |
 6
| Copyright ©
2010 Allscripts Healthcare Solutions, Inc.
A Connected Community of Health
The Time is NOW
•
Quality Issues
•
Medical Errors / Safety
Concerns
•
Rising Cost
•
Significant Waste
A National
Problem
•
$43BB Opportunity
•
$30BB in Stimulus
Funding
•
~15% Penetration in
Physician Practices
•
Rise of the Employed
Physicians
•
Hospitals Driving
Adoption
A Market that
is Ready
We are at the
beginning
of
what we
expect will be the
single fastest
transformation of any
industry in US history
A Significant
Opportunity
>
> |
 7
| Copyright ©
2010 Allscripts Healthcare Solutions, Inc.
A Connected Community of Health
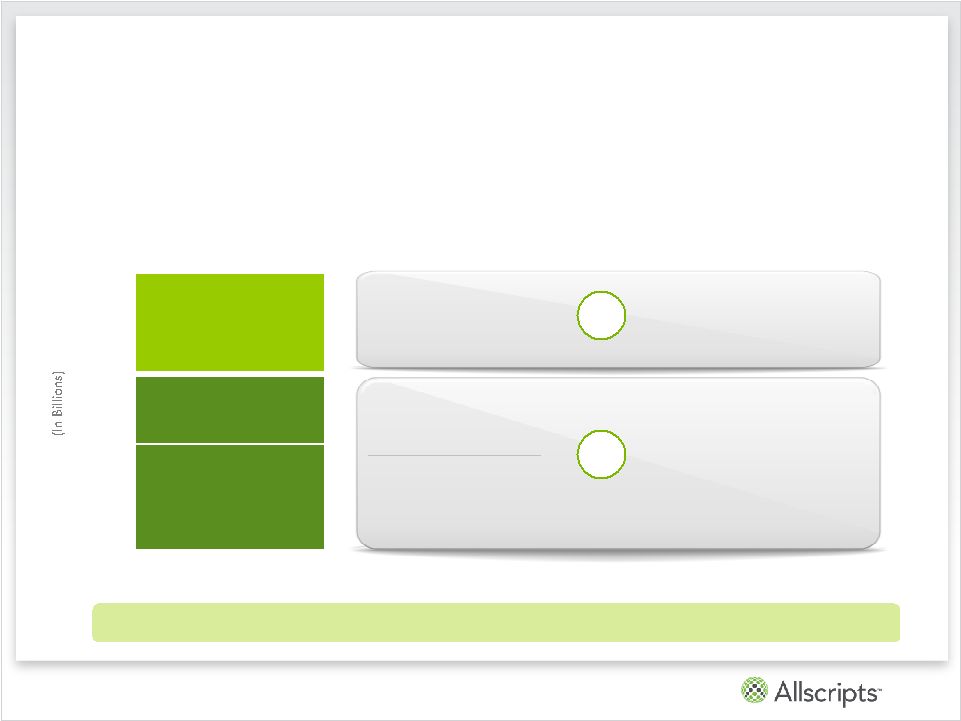
Addressing the Entire Market Opportunity
Acute/Ambulatory EHR Opportunity 2010-2014 = ~$43BB
Source: McKinsey & Company
Pre-Merger Allscripts Opportunity
(Ambulatory Stand-Alone)
Pre-Merger Eclipsys Opportunity
(Acute Stand-Alone)
Legacy
Addressable
Market:
Stand-Alone
New
Addressable
Market:
Integrated
Market Segment Seeking
an Integrated/Complete
Solution Across Hospitals
and Physician Practices
$16BB
$10BB
$17BB
>
>
Well
positioned
to
aggressively
compete
in
the
$16BB
(~35%)
integrated
market
$45
$40
$35
$30
$25
$20
$15
$10
$5
$0 |
 8
| Copyright ©
2010 Allscripts Healthcare Solutions, Inc.
A Connected Community of Health
Ambulatory Market Potential
Practice Size
Total # of Practices
EHR Penetration
(FY09/10)
1-3 Physicians
163,000
~13%
4-9 Physician
27,000
~22%
10-25 Physicians
8,000
~33%
26+ Physicians
2,000
~50%
Total
200,000
~15%
Source: SK&A = SK&A Information Services which sells databases for sales and
marketing success in healthcare industry |
 9
| Copyright ©
2010 Allscripts Healthcare Solutions, Inc.
A Connected Community of Health
(1)
~20% estimate based on number of ambulatory physicians; penetration as a
percentage of number of physician practices is ~11% (2)
Hospitals >200 beds
December
2013
Incentive
Program Begins
January
2011
ARRA
Announced
Q1
2009
Final Rules
Issued
July
2010
Increased Certainty for Widespread
EHR Adoption
Physician
Penetration
(1)
~20%
70% of Funding Used
Source: National Center for Health Statistics
400 -
600 Hospitals
Will Replace Clinical
Systems
(2)
TODAY |
 10
| Copyright ©
2010 Allscripts Healthcare Solutions, Inc.
A Connected Community of Health
Allscripts: Competitive Differentiation
•
The Largest Network with a
Client Base of 180,000
Physicians, 1,500 Hospitals
and 10,000 Post Acute Care
Providers
•
The Unique Ability to Truly
Connect a Community
•
One Patient Record Across
an Organization and the
Community –
One Source of
Truth
One
Network.
The largest connected
network in the nation…
and in your community.
One
Platform.
Open, flexible, and
innovative to help you
connect inside and
outside your
organization.
One
Patient.
A complete portfolio
that delivers a single
patient
record across
your community.
•
Comprehensive, Integrated
Solutions for all Settings
•
Rapid Implementation Approach
to Attain “Meaningful Use”
•
A Track Record of Innovation
with a ‘Future State’
Clinical/Financial Informatics
Capability
•
Common Microsoft platform and
a shared ‘open architecture’
approach, simplifying the
connection to third-party
applications across every care
setting |
 11
| Copyright ©
2010 Allscripts Healthcare Solutions, Inc.
A Connected Community of Health
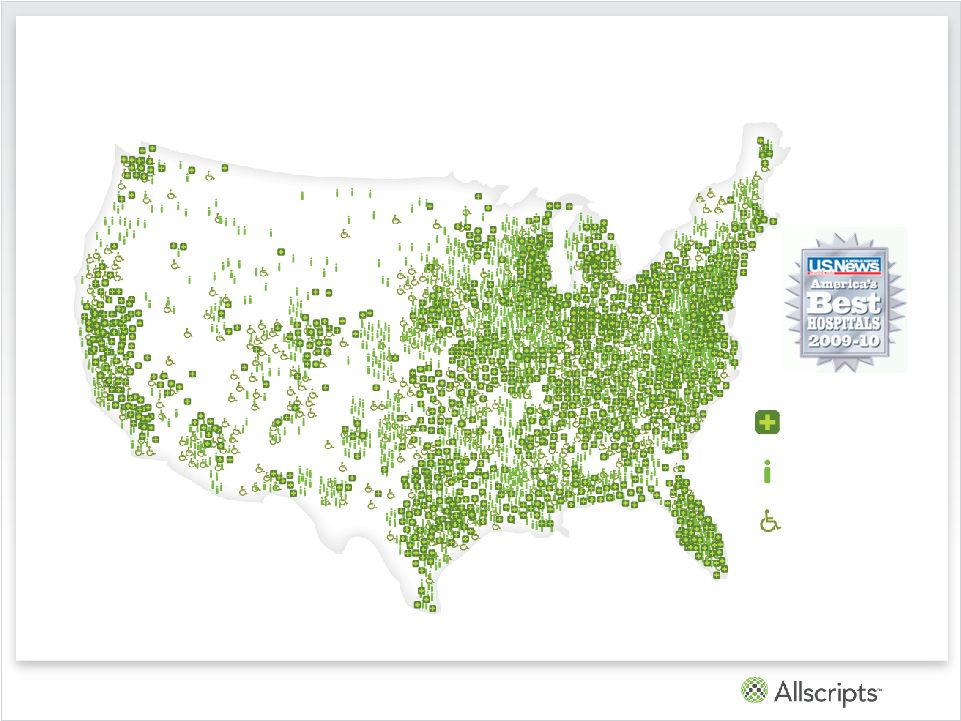
Hospitals
Physician Practices
Post Acute Facilities &
Agencies
•
The ‘Hub’:
Over 1,500 Hospitals including 40%
of “America’s Best Hospitals”
as Clients
•
The ‘Spokes’:
Over 180,000 MDs and 10,000
Post Acute Care Organizations are Connected
to other Practices, Patients, Pharmacies, Payors,
Clinical Labs and Hospitals
One Network:
The Largest Community in the Nation |
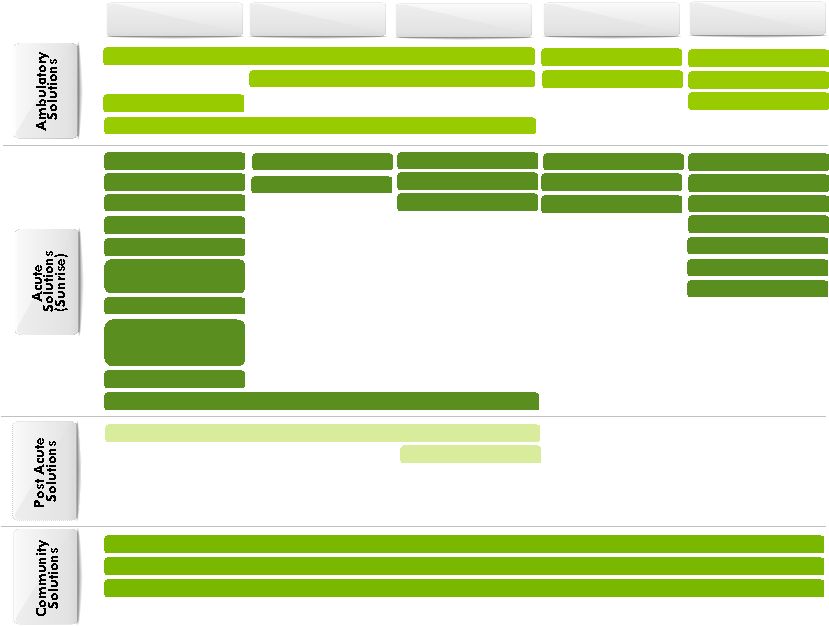 One
Platform: A Complete, Integrated Solutions Portfolio
Clinical
Financial
Administrative
Analytics
Services
Community Exchange
Community Record
Helios
Electronic Health Record
ePrescribe
Payerpath
CQS
Management Consulting
Academy Education
Analytics
Practice Management
Homecare / Hospice
Referral Management
Ready
Care Management
Remote Hosting
Patient Financials
EPSi
Outsourcing
Access Management
Consulting
Record Manager
Network & Desktop
Patient Flow
Financial Manager
Clinical Analytics
Pharmacy
Emergency Care
Laboratory
Knowledge-Based
Charting
Knowledge-Based
Medication
Administration
Acute Content
Clinical Manager
Radiology
Enterprise Identifier
Education
Acute Care
Implementation
Identity & Eligibility |
 13
| Copyright ©
2010 Allscripts Healthcare Solutions, Inc.
A Connected Community of Health
One Patient:
Critical Patient Data Flows Freely
Acute Solutions
(Sunrise)
Ambulatory
Solutions
Post Acute
Solutions
Patient Records
Labs
Prescriptions
X-Rays
Referrals
Results
Orders |
 14
| Copyright ©
2010 Allscripts Healthcare Solutions, Inc.
A Connected Community of Health
Proven Management Team
19+ Yrs
CFO
Bill Davis
20+ Yrs
Chief Client Officer
Laurie McGraw
25+ Yrs
President, Product Strategy &
Development
John Gomez
20+ Yrs
EVP, Culture and Talent
Diane Adams
30+ Yrs
Chairman
Phil Pead
25+ Yrs
COO
Eileen McPartland
20+ Yrs
SVP Sales
Steve Lalonde
Executive
Position
Experience
Glen Tullman
CEO
30+ Yrs
Lee Shapiro
President
30+ Yrs
Management team with a track record of operational execution, strong financial performance,
integrating acquisitions and driving shareholder value
|
 15
| Copyright ©
2010 Allscripts Healthcare Solutions, Inc.
A Connected Community of Health
Financial Highlights
Significant Growth
Operating Leverage
Revenue Visibility
•
Backlog of $2.6BB on 9/30/2010
•
High recurring revenue model
•
Investments (e.g., READY, Upgrade Enablement Center, Sunrise 5.5, Helios)
accelerate implementations
•
Industry leading footprint–large, diverse client base
•
Annualized R&D investments of ~$154MM as of the third quarter 2010, or
approximately 12% of non-GAAP revenue
•
Significant benefits from Project DRIVE initiatives, merger-related cost
synergies
•
Allscripts Distribution Network
•
Strong free cash flow
•
Third quarter 2010 non-GAAP revenue of $329MM, up 12%
•
Consolidated third quarter 2010 bookings of $216MM
•
Third quarter 2010 non-GAAP net income of $37MM, up 21%
•
ARRA stimulus program creates long-tailed demand curve
Note:
Please
see
reconciliation
and
footnotes
in
appendix
to
this
presentation
regarding
non-GAAP
financial
measures.
Information
also
available
at
http://investor.allscripts.com |
 16
| Copyright ©
2010 Allscripts Healthcare Solutions, Inc.
A Connected Community of Health
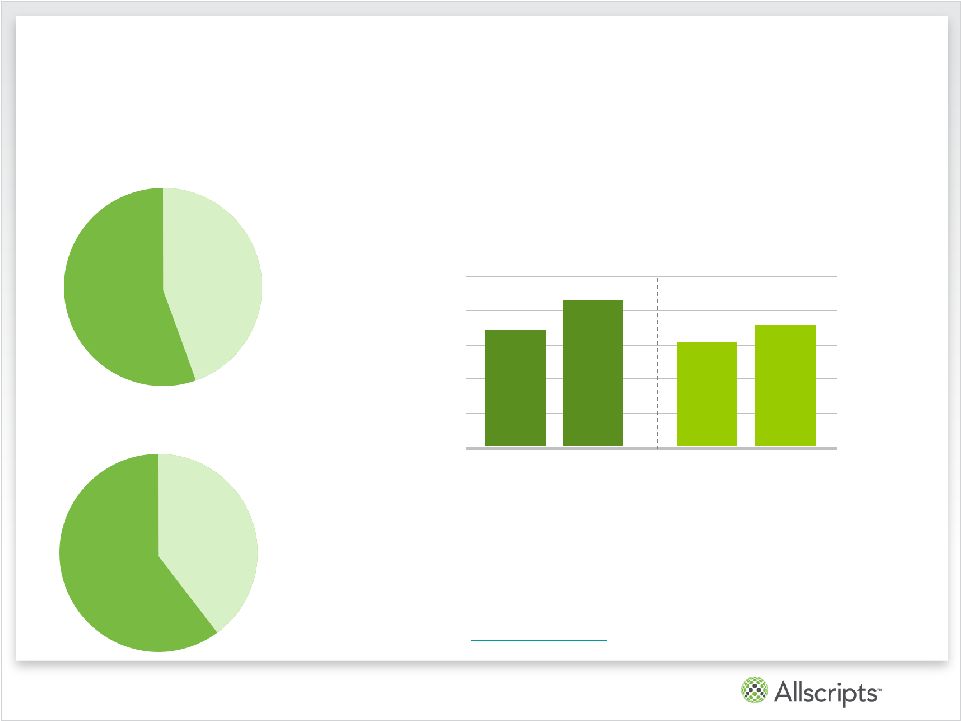
Historical Consolidated Performance
Combined Non-GAAP Net Income ($millions)
Combined Non-GAAP Net Income ($millions)
Non-GAAP Revenue
CY 2009: $1,188MM
Non-GAAP Revenue
CY 2009: $1,188MM
Non-GAAP Revenue
9 Months 2010: $963MM
Non-GAAP Revenue
9 Months 2010: $963MM
Allscripts
56%
Eclipsys
44%
Allscripts
58%
Eclipsys
42%
$106
$128
$0
$30
$60
$90
$120
$150
CY2008
CY2009
9 Months
2009
$106
$128
$94
$109
9 Months
2010
Note: Please see reconciliation and footnotes in appendix to
this presentation regarding non-GAAP financial measures.
Information
also
available
at
http://investor.allscripts.com |
 17
| Copyright ©
2010 Allscripts Healthcare Solutions, Inc.
A Connected Community of Health
Significant Key Cost Synergies
Projected Cost Synergies Over Three Years
•
Duplicate management
structure
•
Duplicate public company
costs
•
Duplicate backend office
and system integration
•
Marketing
Key Cost
Synergy Drivers
CY2011
~$25MM
~$35MM
~$40MM
CY2012
CY2013 &
Beyond |
 18
| Copyright ©
2010 Allscripts Healthcare Solutions, Inc.
A Connected Community of Health
Revenue Synergy Opportunity of $1.25BB
Incremental Revenue Opportunity
$16BB Integrated Market Provides Additional Opportunity
Sunrise Clinical Manager,
Patient Flow, EPSi
Sell Eclipsys
Solutions to Allscripts
Acute Care Base
ECLIPSYS
Care Management, Emergency
Department, Homecare,
Ambulatory Solutions
Sell Allscripts
Solutions to Eclipsys
Acute Care Base
ALLSCRIPTS
Total
~$430MM
~$820MM
~$1,250MM
=
+ |
 19
| Copyright ©
2010 Allscripts Healthcare Solutions, Inc.
A Connected Community of Health
Non-GAAP
Revenue
Q4 2010
Non-GAAP
Operating
Margin
Non-GAAP
Net Income
Non-GAAP Financial Outlook(1)
($ in millions; except per share amounts)
$332 -
$337
(1)
Guidance
provided
by
the
company
in
a
press
release
on
November
8,
2010
Note:
Please
see
reconciliation
and
footnotes
in
appendix
to
this
presentation
regarding
non-GAAP
financial
measures.
Information
also
available
at
http://investor.allscripts.com
CY 2010
19%
$34 -
$36
Non-GAAP
Diluted EPS
$0.18 -
$0.19
$1,295 -
$1,300
19%
$142 -
$144
$0.73 -
$0.74
CY 2011
$1,425 -
$1,450
21%
$167 -
$176
$0.85 -
$0.89
2010 to 2011
Change
10 -
12%
18 -
24%
16 -
22%
-- |
 20
| Copyright ©
2010 Allscripts Healthcare Solutions, Inc.
A Connected Community of Health
Strong Free Cash Flow Generation
1
EBITDA is calculated as net income plus income tax expense, interest expense,
stock-based compensation expense, depreciation & amortization, deferred revenue adjustments,
certain one-time and transaction-related expenses, and non-recurring
losses on the sale of investments minus non-recurring gains on the sale of assets.
Note:
Please
see
reconciliation
and
footnotes
in
appendix
to
this
presentation
regarding
non-GAAP
financial
measures.
Information
also
available
at
http://investor.allscripts.com
•
Reduced debt by
$40MM since merger
closed
•
Required principal
payments over next
12 months total
$23.5MM
•
Borrowing costs
currently <4% with
approximately 60%
at a fixed rate
Capitalization
Actual
9/30/2010
Cash and Marketable Securities
$120
Revolver ($250mm)
60
Term Loan
470
Total Debt
$530
Equity
1,369
Total Capitalization
$1,899
Credit Statistics
LTM EBITDA
(1)
$293
Total
Debt
/
LTM
EBITDA
(1)
1.8x
Debt / Capitalization
27.9% |
 21
|
 22
| Copyright ©
2010 Allscripts Healthcare Solutions, Inc.
A Connected Community of Health
•
GAAP –
non-GAAP revenue and net income reconciliation for the three months ended September
30, 2010 and three months ended August 31, 2009 (Allscripts) and September 30, 2009
(Eclipsys). Appendix: Non-GAAP Reconciliation
8/31/09
9/30/09
Q3 2009
Allscripts
Eclipsys
Additional Int
Exp
(a)
Non-GAAP
Allscripts
Eclipsys
Non-GAAP
Total revenue, as reported
$191.2
$51.2
$0.0
$242.4
$164.9
$125.5
$290.4
Deferred revenue adjustment
0.5
6.7
0.0
7.2
2.6
0.6
3.2
Eclipsys results pre-merger period (7/1/10-8/23/10)
0.0
79.5
0.0
79.5
0.0
0.0
0.0
Total non-GAAP revenue
$191.7
$137.4
$0.0
$329.1
$167.5
$126.1
$293.6
Net income, as reported
$5.4
($4.0)
$0.0
$1.4
$12.9
$3.9
$16.8
Deferred revenue adjustment
0.3
4.0
0.0
4.3
1.5
0.3
1.8
Acquisition-related amortization
3.4
3.0
0.0
6.4
3.5
1.9
5.4
Stock-based compensation expense
4.0
0.0
0.0
4.0
2.0
2.5
4.5
Transaction-related expense
(b)
16.0
5.5
(1.9)
19.6
2.4
0.0
2.4
Restructuring
0.0
0.0
0.0
0.0
0.0
0.7
0.7
ARS Sales
0.0
0.0
0.0
0.0
0.0
0.7
0.7
Tax rate alignment
(1.6)
(0.2)
0.0
(1.8)
(0.1)
0.0
(0.1)
Tax related items
0.0
0.0
0.0
0.0
0.0
(1.7)
(1.7)
Eclipsys results pre-merger period (7/1/10-8/23/10)
0.0
2.9
0.0
2.9
0.0
0.0
0.0
Non-GAAP net income
$27.5
$11.2
($1.9)
$36.8
$22.2
$8.3
$30.5
(a) For illustrative purposes, legacy Allscriptsresults for the three
months ended September 30, 2010 exclude interest expense of approximately $3 million pretax, or $1.9 million on an after-tax basis attributable to the 2010 share repurchase.
This expense is netted out of non-GAAP adjustments for purposes of
calculating non-GAAP net income for the combined company.
(b) Various historical transaction related expenses including
severance, consulting, legal, incremental interest associated with the 2010 share repurchase and other expenses.
Three Months Ended
Three Months Ended 9/30/10 |
 23
| Copyright ©
2010 Allscripts Healthcare Solutions, Inc.
A Connected Community of Health
•
GAAP –
non-GAAP revenue and net income reconciliation for the nine months ended September
30, 2010. Appendix: Non-GAAP Reconciliation
2/28/10
3/31/10
Q1 2010
5/31/10
6/30/10
Q2 2010
Q3 2010
Allscripts
Eclipsys
Non-GAAP
Allscripts
Eclipsys
Non-GAAP
Allscripts
Eclipsys
Int
Exp(a)
Non-GAAP
Allscripts
Eclipsys
Non-GAAP
Total revenue, as reported
$179.9
$128.4
$308.3
$190.3
$134.4
$324.7
$191.2
$51.2
$0.0
$242.4
$561.4
$314.0
$633.0
Deferred revenue adjustment
0.5
0.0
0.5
0.6
0.0
0.6
0.5
6.7
0.0
7.2
1.6
6.7
1.1
Eclipsys results pre-merger period (7/1/10-8/23/10)
0.0
0.0
0.0
0.0
0.0
0.0
0.0
79.5
0.0
79.5
0.0
79.5
0.0
Total non-GAAP revenue
$180.4
$128.4
$308.8
$190.9
$134.4
$325.3
$191.7
$137.4
$0.0
$329.1
$563.0
$400.2
$963.2
Percentages
58%
42%
100%
Net income, as reported
$18.5
$5.4
$23.9
$15.7
$1.6
$17.3
$5.4
($4.0)
$0.0
$1.4
$39.6
$3.0
$41.2
Deferred revenue adjustment
0.3
0.0
0.3
0.4
0.0
0.4
0.3
4.0
0.0
4.3
1.0
4.0
0.7
Acquisition-related amortization
3.5
1.9
5.4
3.5
1.8
5.3
3.4
3.0
0.0
6.4
10.4
6.7
10.7
Stock-based compensation expense
2.6
3.4
6.0
1.7
2.9
4.6
4.0
0.0
0.0
4.0
8.3
6.3
10.6
Transaction-related expense
0.0
0.0
0.0
5.7
2.0
7.7
16.0
5.5
(1.9)
19.6
21.7
7.5
5.8
ARS Sales
0.0
0.0
0.0
0.0
0.9
0.9
0.0
0.0
0.0
0.0
0.0
0.9
0.9
Tax rate alignment
0.7
0.0
0.7
(0.5)
0.0
(0.5)
(1.6)
(0.2)
0.0
(1.8)
-1.4
-0.2
0.2
Eclipsys results pre-merger period (7/1/10-8/23/10)
0.0
0.0
0.0
0.0
0.0
0.0
0.0
2.9
0.0
2.9
0.0
2.9
0.0
Non-GAAP net income
$25.6
$10.7
$36.3
$26.5
$9.2
$35.7
$27.5
$11.2
($1.9)
$36.8
$79.6
$31.2
$108.8
(a) For illustrative purposes, legacy Allscriptsresults for the three
months ended September 30, 2010 exclude interest expense of approximately $3 million pretax, or $1.9 million on an after-tax basis attributable to the 2010 share repurchase.
This expense is netted out of non-GAAP adjustments for purposes of
calculating non-GAAP net income for the combined company. Nine
Months Ended 9/30/2010 2010 Actual Results By Quarter
Three Months Ended
Three Months Ended
Three Months Ended 9/30/10
Non-GAAP Financial Information -
2010 Financial Information
(In millions, except per-share amounts)
(unaudited)
Allscripts
Healthcare Solutions, Inc. |
 24
| Copyright ©
2010 Allscripts Healthcare Solutions, Inc.
A Connected Community of Health
•
GAAP –
non-GAAP net income reconciliation for the nine months ended August 31, 2009
(Allscripts) and September 30, 2009 (Eclipsys).
Appendix: Non-GAAP Reconciliation
2/28/09
3/31/09
Q1 2009
5/31/09
6/30/09
Q2 2009
8/31/09
9/30/09
Q3 2009
8/31/09
9/30/09
Q3 2009
Allscripts
Eclipsys
Non-GAAP
Allscripts
Eclipsys
Non-GAAP
Allscripts
Eclipsys
Non-GAAP
Allscripts
Eclipsys
Non-GAAP
Net income, as reported
$13.3
($0.9)
$12.4
$13.4
($4.1)
$9.3
$12.9
$3.9
$16.8
$39.6
($1.1)
$38.5
Deferred revenue adjustment
1.9
1.0
2.9
1.5
1.8
3.3
1.5
0.3
1.8
4.9
3.1
8.0
Acquisition-related amortization
3.7
2.2
5.9
3.2
1.7
4.9
3.5
1.9
5.4
10.4
5.8
16.2
Stock-based compensation expense
1.3
3.5
4.8
1.4
4.1
5.5
2.0
2.5
4.5
4.7
10.1
14.8
Transaction-related expense
2.1
0.0
2.1
4.1
0.0
4.1
2.4
0.0
2.4
8.6
0.0
8.6
Restructuring
0.0
3.7
3.7
0.0
1.6
1.6
0.0
0.7
0.7
0.0
6.0
6.0
ARS Sales
0.0
0.0
0.0
0.0
0.0
0.0
0.0
0.7
0.7
0.0
0.7
0.7
Tax rate alignment
0.0
0.0
0.0
0.0
0.0
0.0
(0.1)
0.0
(0.1)
(0.1)
0.0
(0.1)
Tax related items
0.0
0.0
0.0
0.0
3.7
3.7
0.0
(1.7)
(1.7)
0.0
2.0
2.0
Elimination of prepackaged medications
(0.6)
0.0
(0.6)
(0.1)
0.0
(0.1)
0.0
0.0
0.0
(0.7)
0.0
(0.7)
Non-GAAP net income
$21.7
$9.5
$31.2
$23.5
$8.8
$32.3
$22.2
$8.3
$30.5
$67.4
$26.6
$94.0
(In millions, except per-share amounts)
(Unaudited)
Three Months Ended
Nine Months Ended
2009 Actual Results By Quarter
Three Months Ended
Three Months Ended
Allscripts
Healthcare Solutions, Inc.
Non-GAAP Financial Information -
2009 Financial Information |
 25
| Copyright ©
2010 Allscripts Healthcare Solutions, Inc.
A Connected Community of Health
•
GAAP
–
non-GAAP
revenue
reconciliation
for
the
twelve
months
ended
November
30,
2009
(Allscripts)
and
twelve months ended December 31, 2009 (Eclipsys).
Appendix: Non-GAAP Reconciliation
Allscripts
Eclipsys
Non-GAAP
Combined
Twelve Months Ended
November 30, 2009
December 31, 2009
Total revenue, as reported
661.1
519.1
1,180.2
Deferred revenue adjustment
9.7
8.0
17.7
Elimination of prepackaged medications
(9.7)
(9.7)
Total non-GAAP revenue
661.1
527.1
1,188.2
|
 26
| Copyright ©
2010 Allscripts Healthcare Solutions, Inc.
A Connected Community of Health
•
GAAP –
non-GAAP net income reconciliation for the twelve months ended November 30, 2008
(Allscripts) and twelve months ended December 31, 2008 (Eclipsys).
Allscripts
Eclipsys
Non-GAAP
Combined
Twelve Months Ended
November 30, 2008
December 31, 2008
Net income, as reported
20.3
99.5
119.8
Deferred revenue adjustment
1.2
-
1.2
Acquisition-related amortization
9.4
4.8
14.2
Stock-based compensation expense
4.8
17.3
22.1
Transaction-related expense
22.7
-
22.7
AHS net income pre-Misys Healthcare merger
8.7
-
8.7
Professional services reorganization
-
1.4
1.4
Elimination of prepackaged medications
(1.9)
-
(1.9)
Non-recurring items
-
0.8
0.8
Valuation allowance
-
(80.0)
(80.0)
Headquarters Relocation
-
3.0
3.0
Derivative Litigation
-
1.3
1.3
Gain on sale of assets
-
(3.2)
(3.2)
In-process R&D charge
-
0.9
0.9
Tax related items
(0.9)
(4.0)
(4.9)
Total non-GAAP net income
64.3
41.6
105.9
Appendix: Non-GAAP Reconciliation |
 27
| Copyright ©
2010 Allscripts Healthcare Solutions, Inc.
A Connected Community of Health
•
GAAP –
non-GAAP net income reconciliation for the twelve months ended November 30, 2009
(Allscripts) and twelve months ended December 31, 2009 (Eclipsys).
Allscripts
Eclipsys
Non-GAAP
Combined
Twelve Months Ended
November 30, 2009
December 31, 2009
Net income, as reported
55.4
2.7
58.1
Deferred revenue adjustment
5.8
4.2
10.0
Acquisition-related amortization
13.9
7.7
21.6
Stock-based compensation expense
7.4
12.4
19.8
Transaction-related expense
9.4
-
9.4
Restructuring
-
6.0
6.0
ARS sales
-
0.7
0.7
Elimination of prepackaged medications
(0.7)
-
(0.7)
Tax related items
-
2.0
2.0
Tax rate alignment
0.3
0.7
1.0
Total non-GAAP net income
91.5
36.4
127.9
Appendix: Non-GAAP Reconciliation |
 28
| Copyright ©
2010 Allscripts Healthcare Solutions, Inc.
A Connected Community of Health
•
GAAP
–
non-GAAP
EBITDA
reconciliation
for
the
12
months
ended
September
30,
2010.
Appendix: Non-GAAP Reconciliation
Allscripts
Eclipsys
Allscripts
LTM
9 mths ended
9 mths ended
3 mths ended
EBITDA
5/31/2010
6/31/2010
9/30/2010
8/31/2010
Net income, as reported
$49,938
$10,858
$1,373
$62,169
Income tax expense
32,611
11,252
(5,879)
37,984
Stock-based compensation expense
11,523
10,789
6,692
29,004
Depreciation & amortization
27,652
39,574
17,145
84,371
Interest expense
1,308
1,158
3,069
5,535
Transaction related/restructuring expenses
10,551
3,449
33,166
47,166
Deferred revenue adjustment
2,465
1,780
7,152
11,397
Gain on Sale of Assets
-
(503)
-
(503)
Loss on sale of investments/ARS
-
1,666
-
1,666
Eclipsys EBITDA results pre-merger period (7/1/10-8/23/10)
-
-
13,910
13,910
EBITDA
$136,048
$80,023
$76,629
$292,700 |
 29
| Copyright ©
2010 Allscripts Healthcare Solutions, Inc.
A Connected Community of Health
Allscripts non-GAAP guidance for the fourth quarter of calendar 2010 assumes the
following adjustments to approximately $314.0 million in GAAP revenue: an
add-back of approximately $21.0 million pretax, in deferred revenue adjustments.
Non-GAAP guidance for the fourth quarter of calendar 2010 assumes the following
adjustments to GAAP operating and net income: add-backs of approximately $18.0 million of acquisition-related amortization; approximately $6.0
million in stock-based compensation expense; approximately $21.0 million in deferred
revenue adjustments; all on a pre-tax basis. Allscripts fourth quarter
2010 non-GAAP net income and diluted earnings per share guidance assumes a 39% tax
rate. Allscripts
non-GAAP
guidance
for
calendar
2010
contemplates
reported
results
for
Allscripts
from
December
1,
2009
through
May
31,
2010
and
July
1,
2010
through December 31, 2010 and the twelve months ended December 31, 2010 for
Eclipsys. Allscripts non-GAAP guidance for calendar 2010 assumes the
following adjustments to approximately $1,267.0 million GAAP revenue: an
add-back of approximately $29.0 million in deferred revenue adjustments,
pretax. Non-GAAP guidance for calendar 2010 assumes the following adjustments to
GAAP operating and net income: approximately $46.0 million of
acquisition-related amortization; approximately $28.0 million in stock-based
compensation expense; approximately $29.0 million in deferred revenue adjustments;
all on a pre-tax basis. Allscripts 2010 non-GAAP net income and diluted earnings per share guidance assumes a 39% tax rate.
Allscripts non-GAAP guidance for calendar 2011 assumes the following adjustments to
approximately $1,418.0 million in GAAP revenue: approximately $20.0 million,
pre-tax in deferred revenue adjustments. Non-GAAP guidance for calendar 2011 assumes the following adjustments to GAAP operating and net
income: approximately $70.0 million of acquisition-related amortization; approximately
$19.0 million in stock-based compensation expense; approximately $20.0 million
in deferred revenue adjustments; all on a pre-tax basis. Allscripts 2011 non-GAAP net income and diluted earnings per share guidance assumes a
38.0%-39.5% tax rate.
Footnotes Regarding Financial Guidance |
 30
| Copyright ©
2010 Allscripts Healthcare Solutions, Inc.
A Connected Community of Health
Allscripts reports its financial results in accordance with generally accepted accounting
principles, or GAAP. To supplement this information, Allscripts presents in this
press release total non-GAAP revenue, gross profit, operating income and net income, including
non-GAAP net income on a per share basis, which are non-GAAP financial measures
under Section 101 of Regulation G under the Securities Exchange Act of 1934, as
amended. Total non-GAAP revenue consists of GAAP revenue as reported and
Eclipsys revenue for periods prior to the August 24, 2010 consummation of the 2010
Merger and adds back the acquisition related deferred revenue adjustment booked for
GAAP purposes. Total non-GAAP gross profit consists of GAAP gross profit as
reported and Eclipsys gross profit for periods prior to the consummation of the
2010 Merger and adds back the acquisition related deferred revenue adjustment
booked for GAAP purposes.
Total non-GAAP operating income consists of GAAP operating income as reported and
Eclipsys operating income for periods prior to the consummation of the 2010 Merger
and adds back the acquisition related deferred revenue adjustment booked for GAAP
purposes and excludes acquisition-related amortization, stock-based compensation expense and
transaction-related expenses. Non-GAAP net income consists of GAAP net income as
reported and includes Eclipsys net income for periods prior to the consummation of
the 2010 Merger, excludes acquisition-related amortization, stock-based compensation expense
and transaction-related expenses, adds back the acquisition related deferred revenue
adjustment, in each case net of any related tax effects.
Management also believes that non-GAAP revenue, gross profit, operating income and net
income and non-GAAP net income on a per share basis provide useful supplemental
information to management and investors regarding the underlying performance of the
company's business operations and facilitates comparisons of the
separate 2010 pre-merger results of legacy Allscripts and legacy
Eclipsys to that of the company's 2010 post-merger results.
Acquisition accounting adjustments made in accordance with GAAP can
make it difficult to make meaningful comparisons of the underlying operations of the
business without considering the non-GAAP adjustments that we have provided and
discussed herein. Management also uses this information internally for forecasting and
budgeting as it believes that the measure is indicative of the company's core operating
results. In addition, the company uses Non- GAAP net income to measure
achievement under the company's cash incentive compensation plans. Note, however,
that non-GAAP revenue, gross profit and net income and non-GAAP net income
on a per share basis are performance measures only, and they do not provide any
measure of the company's cash flow or liquidity. Non-GAAP financial measures are not in accordance with, or an
alternative for, measures of financial performance prepared in accordance with GAAP and
may be different from non-GAAP measures used by other companies. Non-GAAP
measures have limitations in that they do not reflect all of the amounts associated with
Allscripts results of operations as determined in accordance with GAAP. Investors and
potential investors are encouraged to review the reconciliation of non-GAAP
financial measures with GAAP financial measures contained within the attached condensed consolidated
financial statements.
Explanation of Non-GAAP Financial Measures |