Attached files
| file | filename |
|---|---|
| 8-K - DEX ONE CORPORATION 8-K - DEX ONE Corp | a6502466.htm |
| EX-99.1 - EXHIBIT 99.1 - DEX ONE Corp | a6502466-ex991.htm |
Exhibit 99.2

Third Quarter 2010 Results Information Package November 9, 2010
Certain statements contained in this presentation regarding Dex One Corporation’s (the “Company”) future operating results, performance, business plans, prospects, guidance and any other statements not constituting historical fact are “forward-looking statements” subject to the safe harbor created by the Private Securities Litigation Reform Act of 1995. Where possible, the words “believe,” “expect,” “anticipate,” “intend,” “should,” “will,” “would,” “planned,” “estimated,” “potential,” “goal,” “outlook,” “may,” “predicts,” “could,” or the negative of such terms, or other comparable expressions, as they relate to Dex One Corporation or its management, have been used to identify such forward-looking statements. All forward-looking statements reflect only Dex One Corporation’s current beliefs and assumptions with respect to future business plans, prospects, decisions and results, and are based on information currently available to Dex One Corporation. Accordingly, the statements are subject to significant risks, uncertainties and contingencies, which could cause Dex One Corporation’s actual operating results, performance or business plans or prospects to differ materially from those expressed in, or implied by, these statements.Factors that could cause actual results to differ materially from current expectations include risks and other factors described in Dex One Corporation’s publicly available reports filed with the SEC, which contain a discussion of various factors that may affect Dex One Corporation’s business or financial results. Such risks and other factors, which in some instances are beyond Dex One Corporation’s control, include: changes in directory advertising spend and consumer usage; competition and other economic conditions; our ability to generate sufficient cash to service our debt; our ability to comply with the financial covenants contained in our debt agreements and the potential impact to operations and liquidity as a result of restrictive covenants in such debt agreements; our ability to refinance or restructure our debt on reasonable terms and conditions as might be necessary from time to time; increasing interest rates; regulatory and judicial rulings; changes in the Company’s and the Company’s subsidiaries credit ratings; changes in accounting standards; adverse results from litigation, governmental investigations or tax related proceedings or audits; the effect of labor strikes, lock-outs and negotiations; successful realization of the expected benefits of acquisitions, divestitures and joint ventures; the continued enforceability of the commercial agreements with Qwest, CenturyLink and AT&T our reliance on third-party vendors for various services; and other events beyond our control that may result in unexpected adverse operating results. Dex One Corporation is not responsible for updating the information contained in this presentation beyond the published date, or for changes made to this document by wire services or Internet service providers. This presentation is being furnished to the SEC through a Form 8-K. The Company’s Quarterly Report on Form 10-Q for the period ended September 30, 2010 to be filed with the SEC may contain updates to the information included in this presentation.We reference non-GAAP financial measures in this presentation. Please see the appendix for a reconciliation of non-GAAP measures to the most comparable GAAP measures.

Dex One Overview Other Placeholder: Access technologiesDistributing customers’ information across the platforms that consumers use: PrintOnlineMobile Other Placeholder: Stores of valueDeep domain expertise in the realm of local businesses Database of local business information in our marketsStrong connection with local businesses across 28 states maintained by 1,350 marketing consultants
Near-Term Goals & Priorities Other Placeholder: Stem customer lossArrest print declinesExpand the breadth of interactive solutionsEmbrace partnerships to accelerate time to marketFocus on profitable opportunities and make cost reductions a way of life
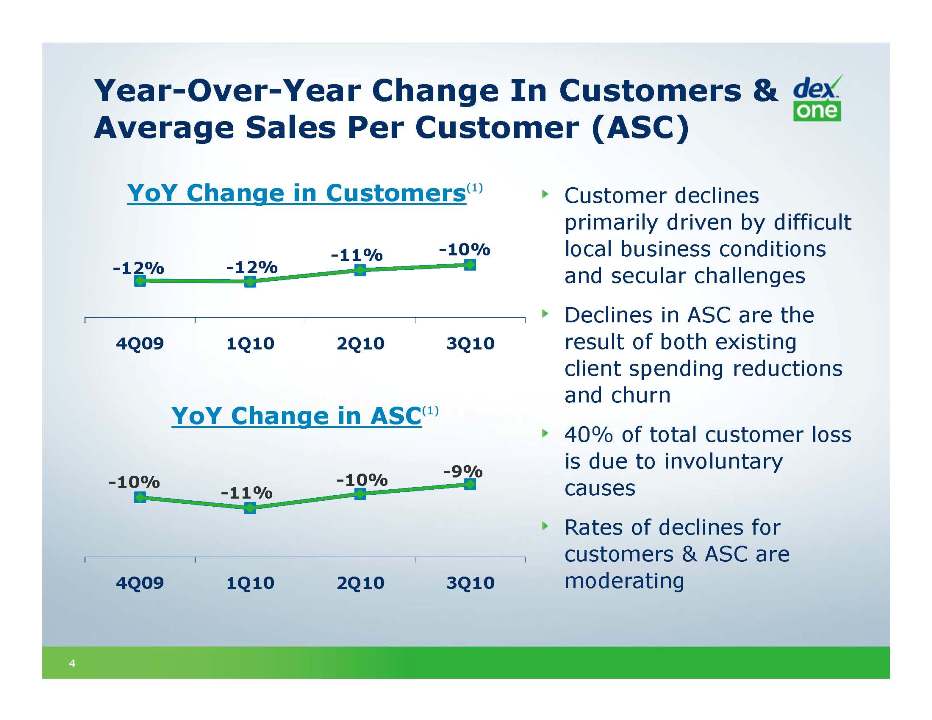
Year-Over-Year Change In Customers & Average Sales Per Customer (ASC) YoY Change in Customers(1) -12% -12% -11% -10% 4Q09 1Q10 2Q10 3Q10 Customer declines primarily driven by difficult local business conditions and secular challengesDeclines in ASC are the result of both existing client spending reductions and churn40% of total customer loss is due to involuntary causesRates of declines for customers & ASC are moderating YoY Change in ASC(1) -10% -11% -10% -9% 4Q09 1Q10 2Q10 3Q10
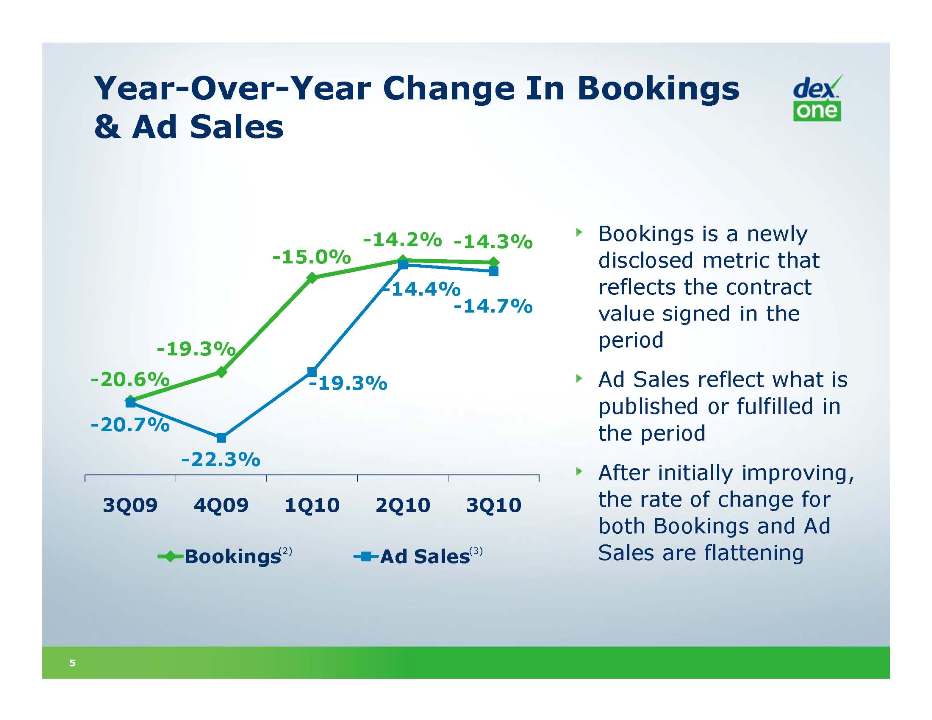
Year-Over-Year Change In Bookings & Ad Sales -20.6% -19.3% -15.0% -14.2% -14.3% -20.7% -22.3% -19.3% -14.4% -14.7% 3Q09 4Q09 1Q10 2Q10 3Q10 Bookings is a newly disclosed metric that reflects the contract value signed in the period Ad Sales reflect what is published or fulfilled in the period After initially improving, the rate of change for both Bookings and Ad Sales are flattening (3) (2)
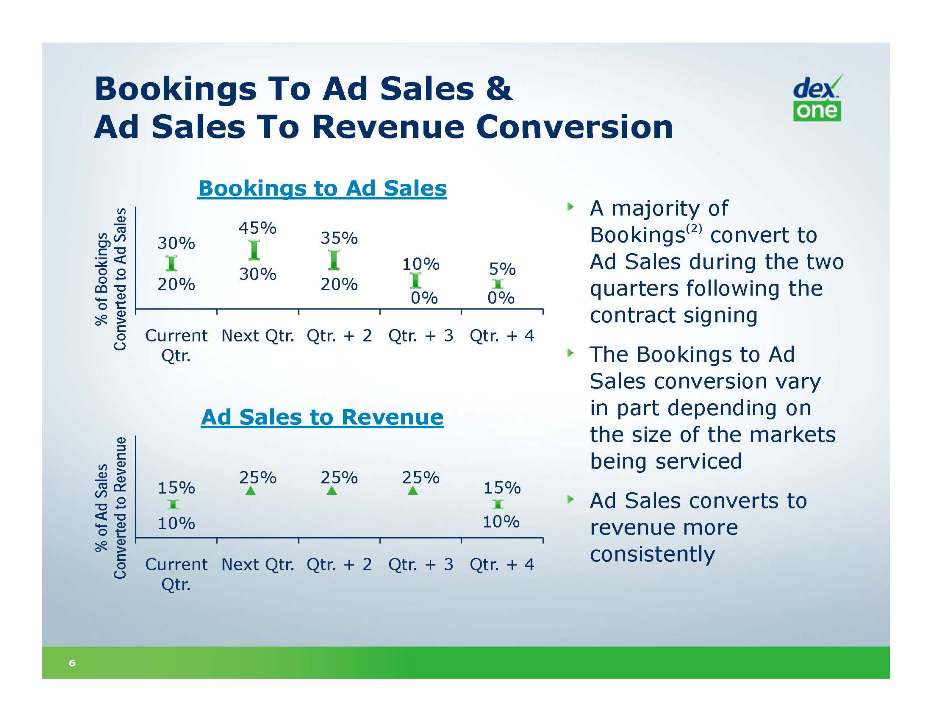
Bookings To Ad Sales & Ad Sales To Revenue Conversion A majority of Bookings(2) convert to Ad Sales during the two quarters following the contract signingThe Bookings to Ad Sales conversion vary in part depending on the size of the markets being serviced Ad Sales converts to revenue more consistently % of BookingsConverted to Ad Sales % of Ad Sales Converted to Revenue 30% 45% 35% 15% 25% 25% 25% 15%
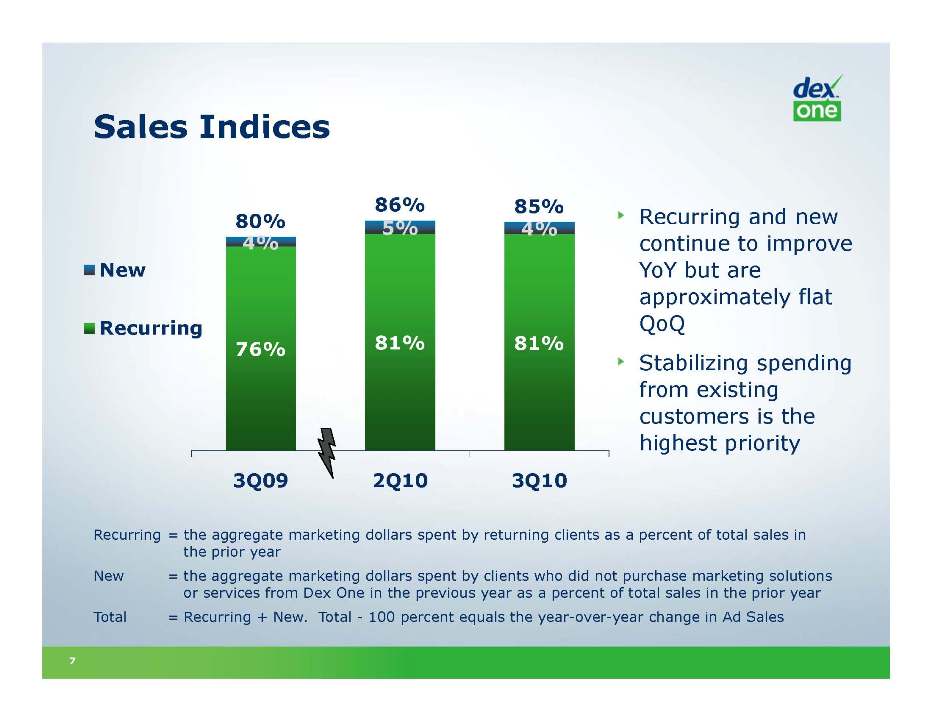
Sales Indices Recurring = the aggregate marketing dollars spent by returning clients as a percent of total sales in the prior year New = the aggregate marketing dollars spent by clients who did not purchase marketing solutions or services from Dex One in the previous year as a percent of total sales in the prior year Total = Recurring + New. Total - 100 percent equals the year-over-year change in Ad Sales Recurring and new continue to improve YoY but are approximately flat QoQ Stabilizing spending from existing customers is the highest priority 80% 86% 85%, 4%, 5% 4%, 76% 81% 81%, 3Q09 2Q10 3Q10
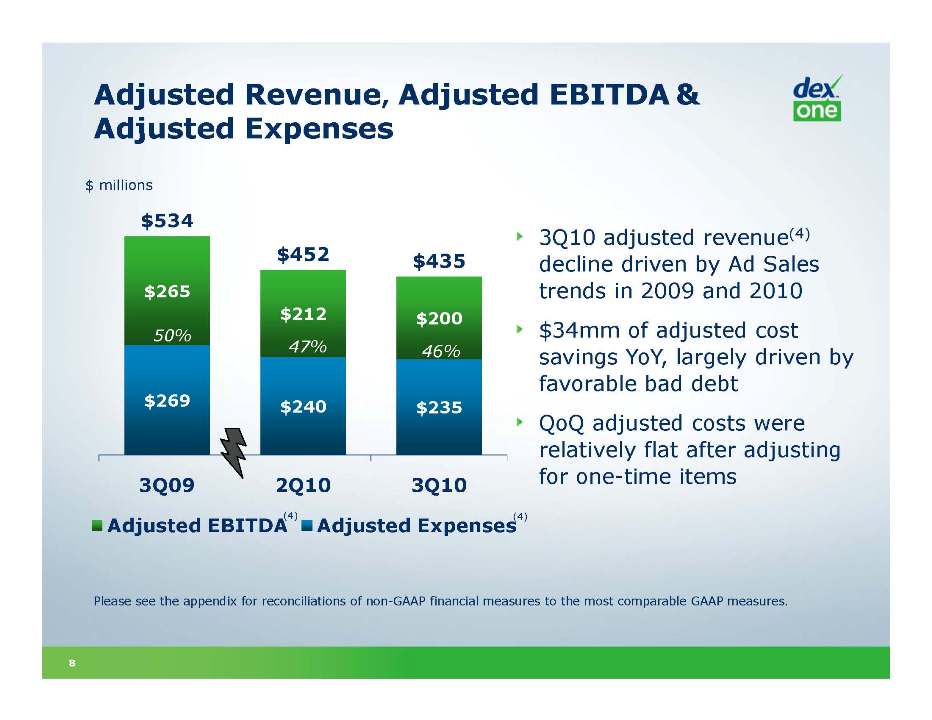
Adjusted Revenue, Adjusted EBITDA & Adjusted Expenses 3Q10 adjusted revenue(4) decline driven by Ad Sales trends in 2009 and 2010$34mm of adjusted cost savings YoY, largely driven by favorable bad debtQoQ adjusted costs were relatively flat after adjusting for one-time items Please see the appendix for reconciliations of non-GAAP financial measures to the most comparable GAAP measures. $534 $452 $435 $265 $212 $200 $269 $240 $235 $ millions 50% 47% 46% (4) (4)
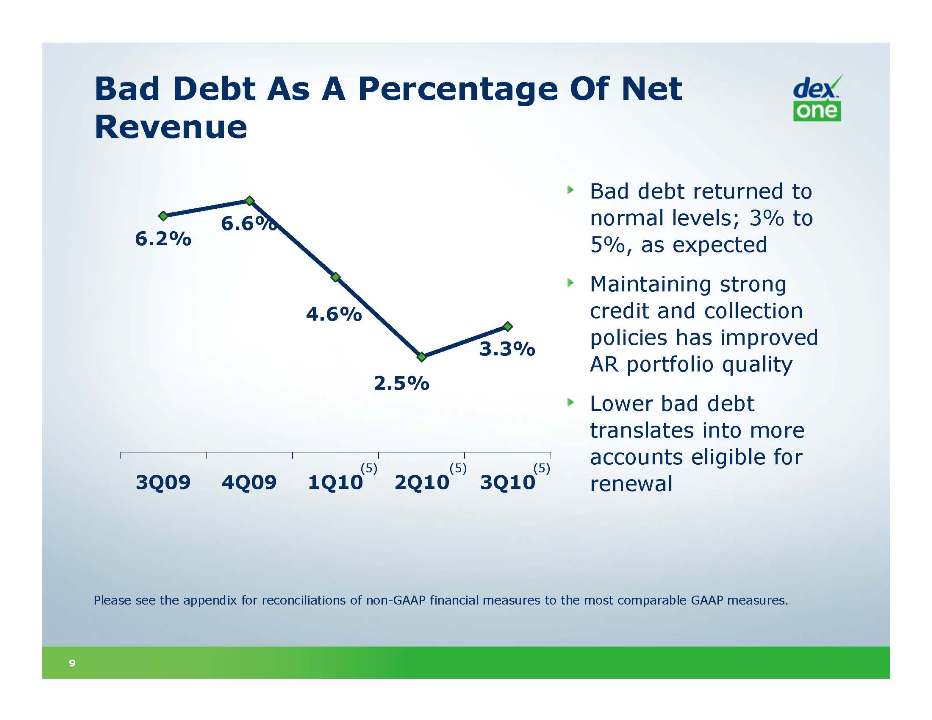
Bad Debt As A Percentage Of Net Revenue Other Placeholder: Bad debt returned to normal levels; 3% to 5%, as expected Maintaining strong credit and collection policies has improved AR portfolio quality Lower bad debt translates into more accounts eligible for renewal Please see the appendix for reconciliations of non-GAAP financial measures to the most comparable GAAP measures. 6.2% 6.6% 4.6% 2.5% 3.3% 3Q09 4Q09 1Q10 2Q10 3Q10 (5) (5) (5)
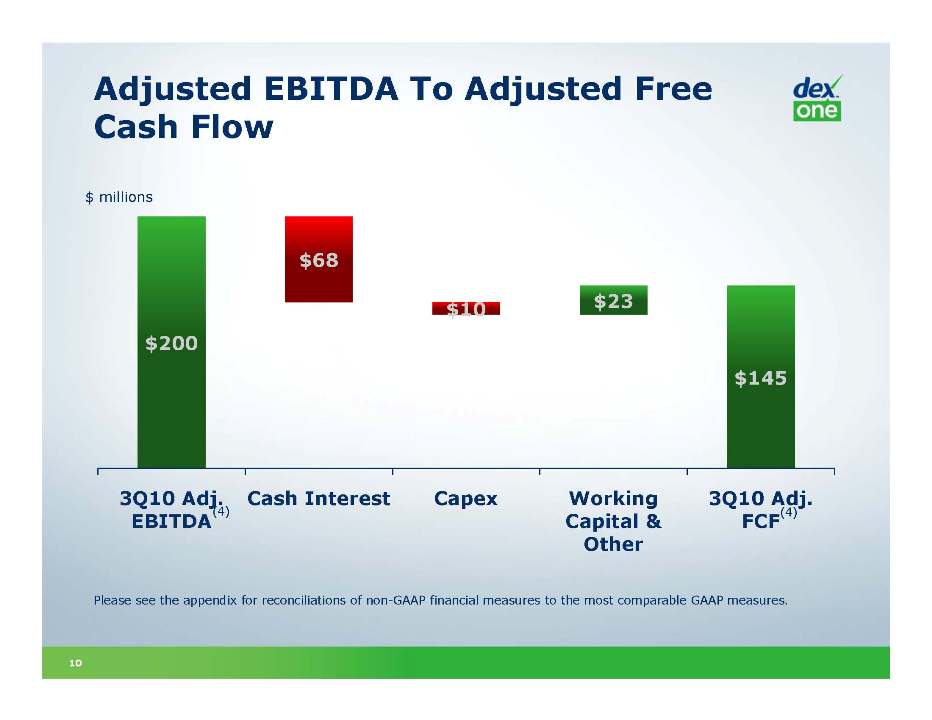
Adjusted EBITDA To Adjusted Free Cash Flow $ millions $200 $68 $10 $23 $145 Please see the appendix for reconciliations of non-GAAP financial measures to the most comparable GAAP measures. $ millions (4) (4)
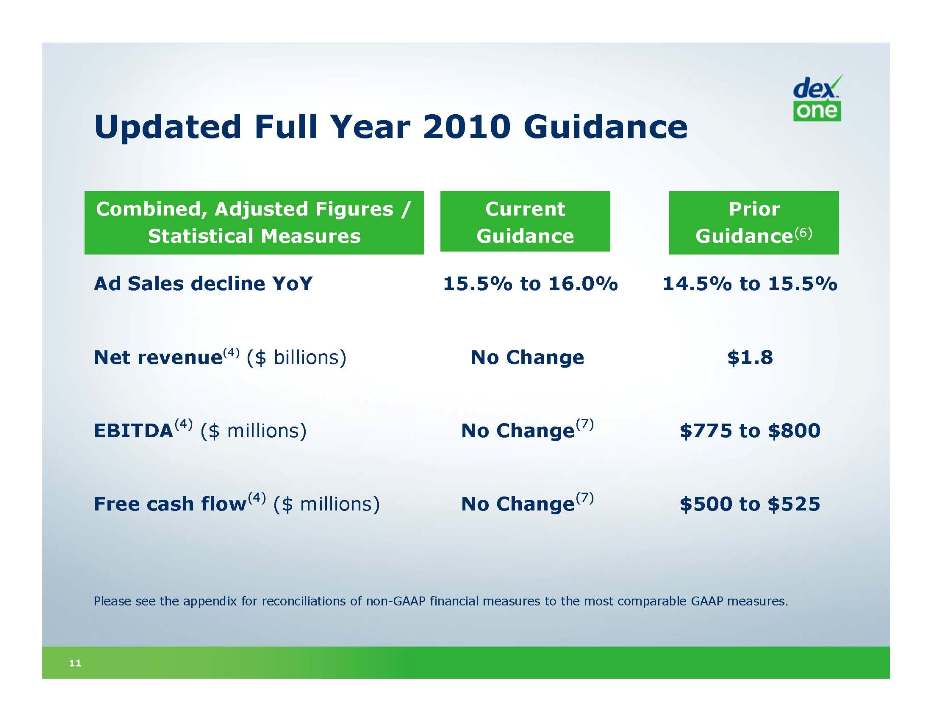
Updated Full Year 2010 Guidance Other Placeholder: 11 Ad Sales decline YoY 15.5% to 16.0% 14.5% to 15.5% Net revenue(4) ($ billions) No Change $1.8 BITDA(4) ($ millions) No Change(7) $775 to $800 Free cash flow(4) ($ millions) No Change(7) $500 to $525 Please see the appendix for reconciliations of non-GAAP financial measures to the most comparable GAAP measures. Prior Guidance(6) Combined, Adjusted Figures / Statistical Measures Current Guidance
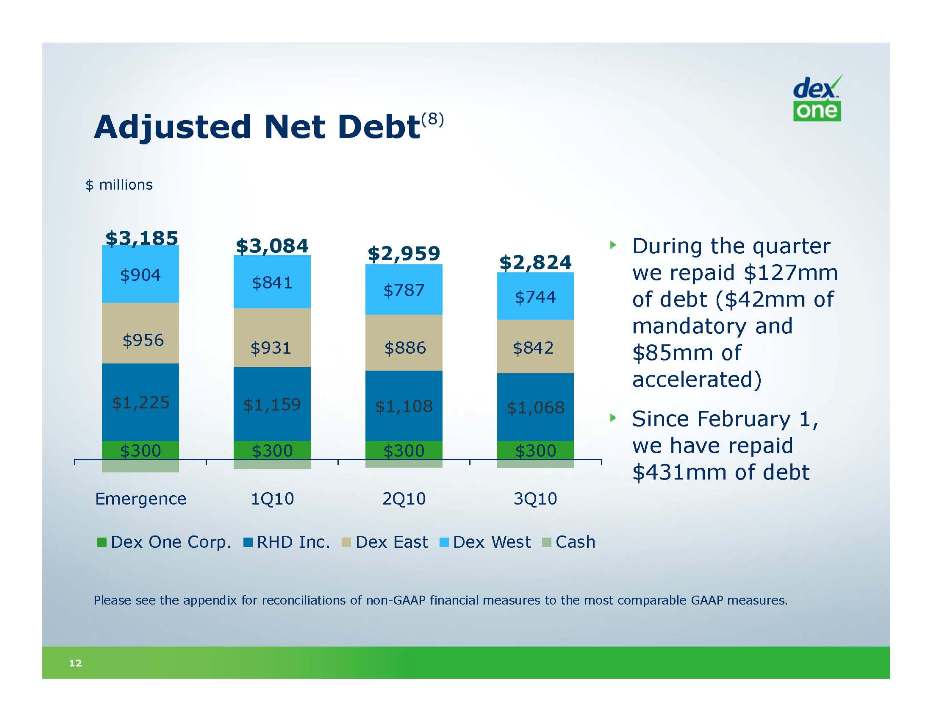
Adjusted Net Debt(8) $ millions During the quarter we repaid $127mm of debt ($42mm of mandatory and $85mm of accelerated)Since February 1, we have repaid $431mm of debt Please see the appendix for reconciliations of non-GAAP financial measures to the most comparable GAAP measures. $3,185 $3,084 $2,959 $2,824 $904 $841 $787 $744 $956 $931 $886 $842
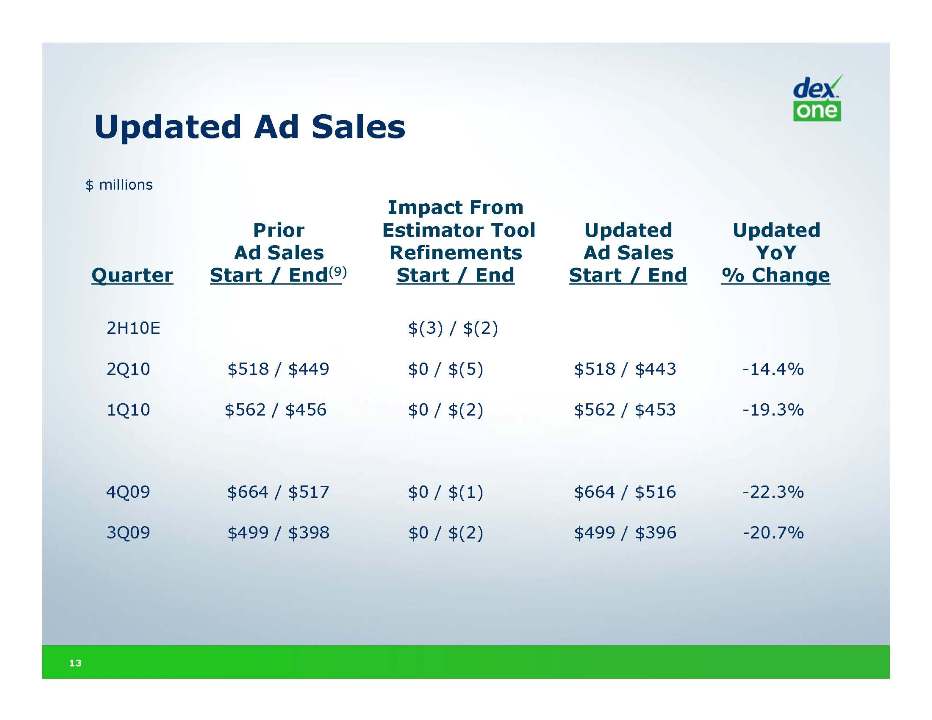
Updated Ad Sales Other Placeholder: 13 Other Placeholder: Impact From Prior Estimator Tool Updated Updated Ad Sales Refinements Ad Sales YoY Quarter Start / End(9) Start / End Start / End % Change 2H10E $(3) / $(2) 2Q10 $518 / $449 $0 / $(5) $518 / $443 -14.4% 1Q10 $562 / $456 $0 / $(2) $562 / $453 -19.3% 4Q09 $664 / $517 $0 / $(1) $664 / $516 -22.3% 3Q09 $499 / $398 $0 / $(2) $499 / $396 -20.7% $ millions
(1) Figures are calculated on a rolling 4 quarter basis and are adjusted to make them comparable across periods. (2) Bookings associated with our local customers represent signed contracts during the period. Bookings associated with our national customers represent what has been published or fulfilled during the period. The year-over-year change in bookings compares current period bookings to the sum of: 1) the value of the contracts (or published / fulfilled value in the case of national customers) that returning customers signed in the prior year and 2) the value of the contracts (or published / fulfilled value in the case of national customers) of customers who did not renew their advertising from the prior period. (3) Ad sales have been updated to reflect refinements in the use of estimating tools supporting a performance-based product trial. Please see slide 13 for more information. (4) Figures represent combined, adjusted or adjusted amounts except for 3Q09 net revenue, which is GAAP. Adjusted figures include the full period and exclude the impact of certain items such as impairment, fresh start accounting and reorganization expenses. (5) 1Q10, 2Q10 and 3Q10 percentages based on adjusted or combined, adjusted net revenue that includes the full quarter and excludes the impact of certain items such as fresh start accounting and reorganization items. (6) Most recently provided on August 5, 2010. (7) Includes restructuring expense or cash costs expected in the fourth quarter of 2010. (8) Represents principal outstanding, which includes the fair value discount. These figures differ from GAAP balances. (9) These figures may not reflect prior disclosures because they have been updated for comparability – primarily related to changes in publication dates including changes that occurred after the period.

Appendix
Key Performance Indicators Other Placeholder: Year-over-year change in customers Customers = cumulative rolling 4 quarter view of clientsYear-over-year change in Advertising Sales per Customer (ASC)ASC = cumulative rolling 4 quarter view of Ad Sales, divided by number of customersYear-over-year change in Bookings Bookings = the contract value signed in the current periodYear-over-year change in Ad Sales Ad Sales = the value distributed in the current periodSales indices The Ad Sales generated in the current period by new and existing customers relative to total Ad Sales in the prior year
GAAP Reconciliations – Fresh Start And Other Adjustments Other Placeholder: 17 Other Placeholder: The Company adopted fresh start accounting and reporting effective February 1, 2010, the Fresh Start Reporting Date. The financial statements as of the Fresh Start Reporting Date will report the results of Dex One with no beginning retained earnings or accumulated deficit. Any presentation of Dex One represents the financial position and results of operations of a new reporting entity and is not comparable to prior periods presented by the Predecessor Company. The financial statements for periods ended prior to the Fresh Start Reporting Date do not include the effect of any changes in our capital structure or changes in the fair value of assets and liabilities as a result of fresh start accounting. As a result of the deferral and amortization method of revenue recognition, recognized advertising revenues reflect the amortization of advertising sales consummated in prior periods as well as in the current period. The adoption of fresh start accounting has a significant impact on the financial position and results of operations of the Company subsequent to the Fresh Start Reporting Date. Fresh start accounting precludes us from recognizing deferred revenue of $175.8 million and $290.9 million and certain deferred expenses of $37.9 million and $62.3 million during the three months ended September 30, 2010 and June 30, 2010, respectively, associated with directories that published prior to the Fresh Start Reporting Date. Thus, our reported results for the three months ended September 30, 2010 and June 30, 2010 are not indicative of our underlying operating and financial performance and are not comparable to any prior period presentation. Accordingly, management has provided a non-GAAP presentation of “Adjusted” results for the three months ended September 30, 2010, and June 30, 2010. Management believes that these non-GAAP financial measures are important indicators of our operations because they exclude items that may not be indicative of, or related to, our core operating results, and provide a better baseline for analyzing our underlying business. Adjusted results adjusts GAAP results of the Company for the three months ended September 30, 2010 and June 30, 2010 to (i) eliminate the fresh start accounting impact on revenue and certain related expenses noted above and (ii) exclude cost-uplift recorded under fresh start accounting of $3.6 million and $3.3 million for the three months ended September 30, 2010, and June 30, 2010, respectively. Deferred directory costs, such as print, paper, distribution and commissions, relate to directories that have not yet been published and have been recorded at fair value, determined as (a) the estimated billable value of the published directory less (b) the expected costs to complete the directory, plus (c) a normal profit margin. This incremental fresh start accounting adjustment to step up the recorded value of the deferred directory costs to fair value is hereby referred to as “cost-uplift.”
GAAP Reconciliations – Fresh Start And Other Adjustments (cont’d) Other Placeholder: Cost-uplift will be amortized over the terms of the applicable directories, not to exceed twelve months. Management believes that the non-GAAP presentation of Adjusted and Combined Adjusted results will help financial statement users better understand the material impact fresh start accounting has on the Company’s results of operations for the three months ended September 30, 2010, and June 30, 2010, respectively, and also offers a non-GAAP normalized comparison to GAAP results of the Predecessor Company for the three months ended September 30, 2009. The non-GAAP Adjusted results are reconciled to the most comparable GAAP measures. While the non-GAAP Adjusted results exclude the effects of fresh start accounting and certain other items, such as goodwill and intangible asset impairment charges during the three months ended September 30, 2010, and June 30, 2010 it must be noted that the non-GAAP Adjusted results are not strictly comparable to the Predecessor Company’s GAAP results for the three months ended September 30, 2009 and should not be treated as such. We strongly encourage investors and stockholders to review our financial statements and publicly filed reports in their entirety and not rely on any single financial measure.
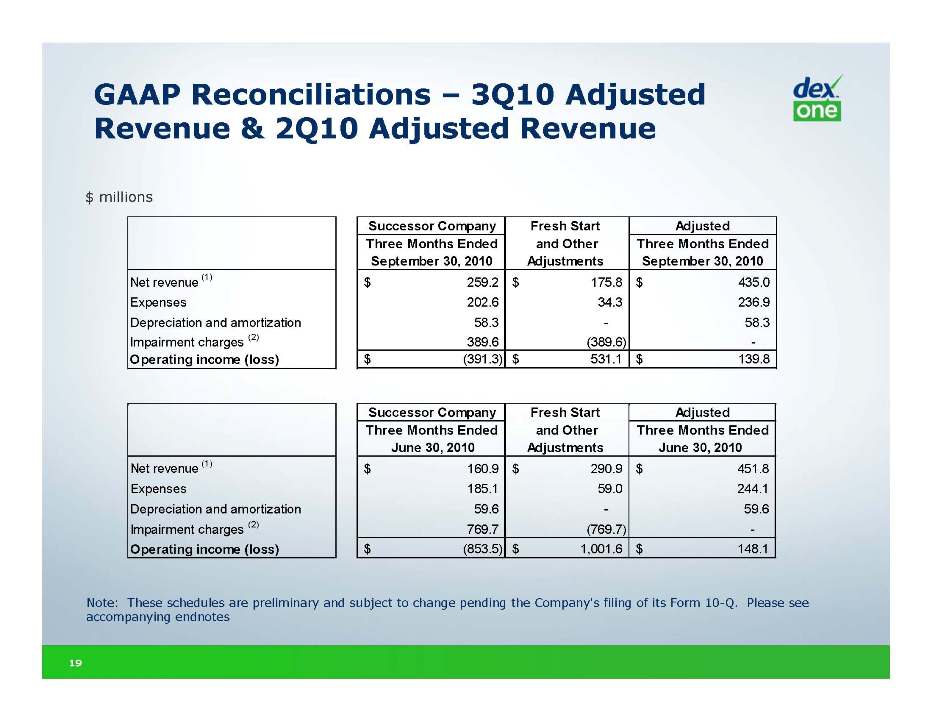
GAAP Reconciliations – 3Q10 Adjusted Revenue & 2Q10 Adjusted Revenue $ millions Note: These schedules are preliminary and subject to change pending the Company's filing of its Form 10-Q. Please see accompanying endnotes
GAAP Reconciliations – 3Q10, 3Q09 & 2Q10 Adjusted EBITDA Other Placeholder: EBITDA and Adjusted EBITDA are not measurements of operating performance computed in accordance with GAAP and should not be considered as a substitute for net income (loss) prepared in conformity with GAAP. In addition, EBITDA may not be comparable to similarly titled measures of other companies. Management believes that these non-GAAP financial measures are important indicators of our operations because they exclude items that may not be indicative of, or related to, our core operating results, and provide a better baseline for analyzing our underlying business. Adjusted EBITDA of the Successor Company for the three months ended September 30, 2010 and June 30, 2010 is determined by adjusting EBITDA (i) to eliminate the fresh start accounting impact on revenue and certain expenses, (ii) to exclude the impact of cost-uplift recorded under fresh start accounting, (iii) to exclude the goodwill and intangible asset impairment charges and (iv) for stock-based compensation expense and long-term incentive program. Adjusted EBITDA of the Predecessor Company for the three months ended September 30, 2009 is determined by adjusting EBITDA for items such as (i) stock-based compensation expense and long-term incentive program, (ii) restructuring costs and (iii) reorganization items, net.
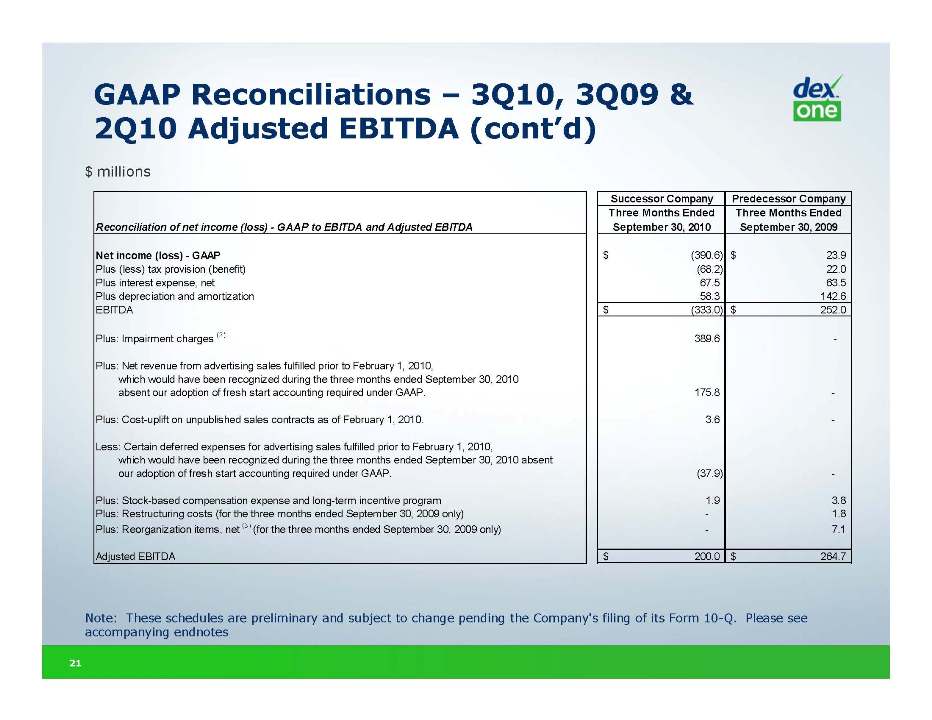
GAAP Reconciliations – 3Q10, 3Q09 & 2Q10 Adjusted EBITDA (cont’d) Other Placeholder: 21 Note: These schedules are preliminary and subject to change pending the Company's filing of its Form 10-Q. Please see accompanying endnotes $ millions
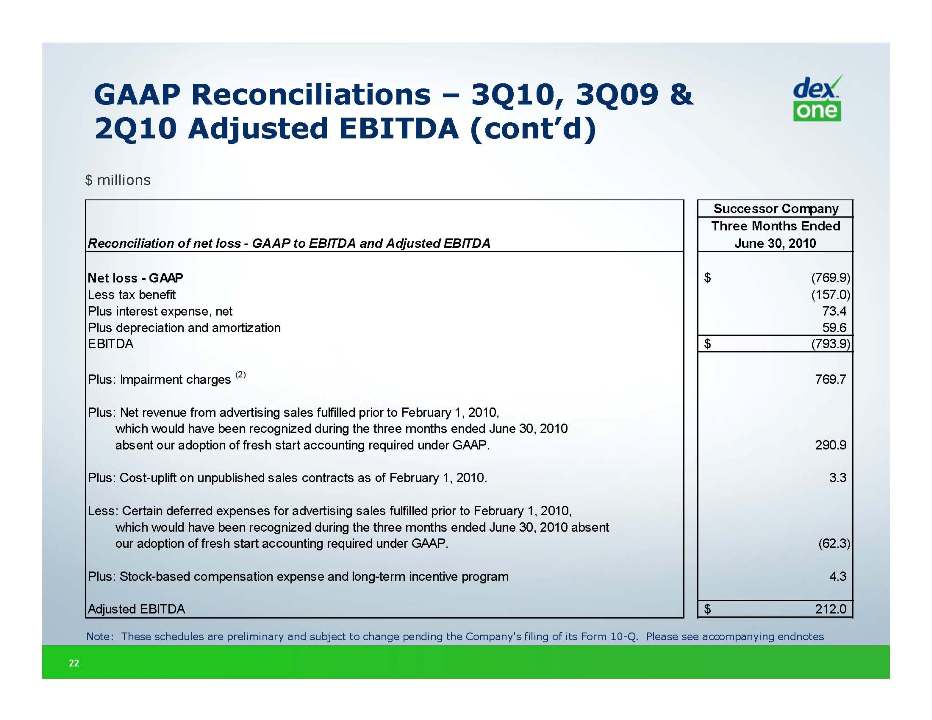
GAAP Reconciliations – 3Q10, 3Q09 & 2Q10 Adjusted EBITDA (cont’d) Other Placeholder: 22 $ millions Note: These schedules are preliminary and subject to change pending the Company's filing of its Form 10-Q. Please see accompanying endnotes
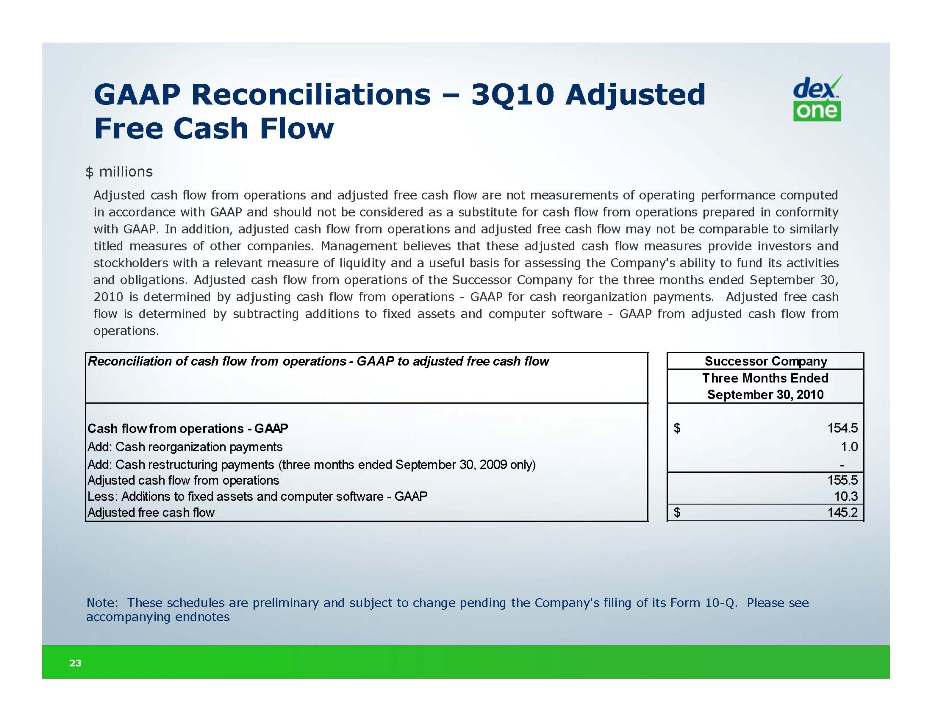
GAAP Reconciliations – 3Q10 Adjusted Free Cash Flow Other Placeholder: 23 $ millions Note: These schedules are preliminary and subject to change pending the Company's filing of its Form 10-Q. Please see accompanying endnotes Adjusted cash flow from operations and adjusted free cash flow are not measurements of operating performance computed in accordance with GAAP and should not be considered as a substitute for cash flow from operations prepared in conformity with GAAP. In addition, adjusted cash flow from operations and adjusted free cash flow may not be comparable to similarly titled measures of other companies. Management believes that these adjusted cash flow measures provide investors and stockholders with a relevant measure of liquidity and a useful basis for assessing the Company's ability to fund its activities and obligations. Adjusted cash flow from operations of the Successor Company for the three months ended September 30, 2010 is determined by adjusting cash flow from operations - GAAP for cash reorganization payments. Adjusted free cash flow is determined by subtracting additions to fixed assets and computer software - GAAP from adjusted cash flow from operations.
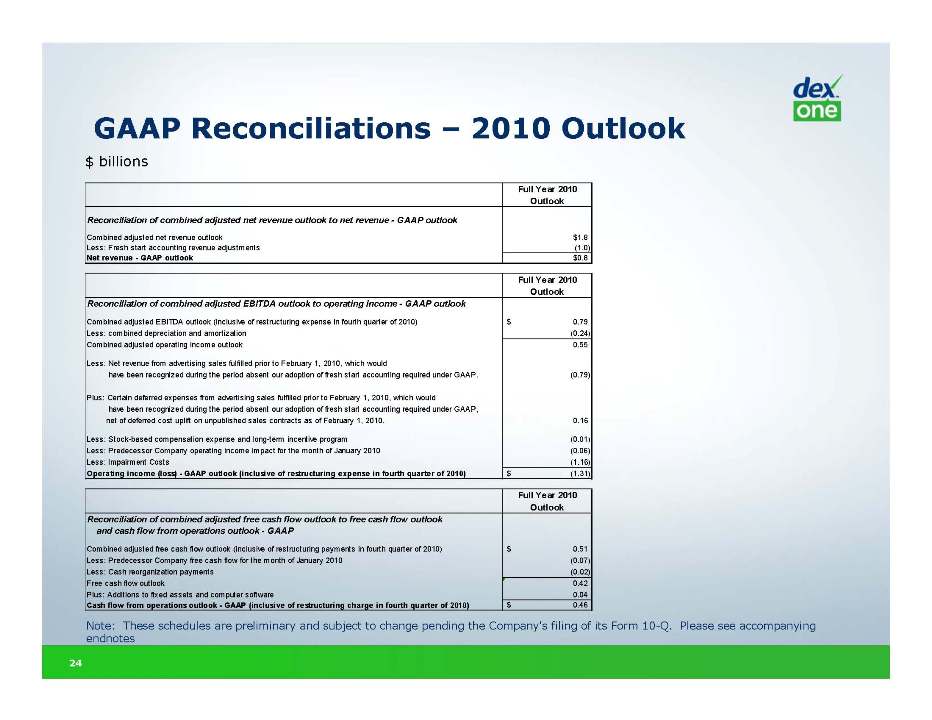
GAAP Reconciliations – 2010 Outlook Other Placeholder: 24 $ billions Note: These schedules are preliminary and subject to change pending the Company's filing of its Form 10-Q. Please see accompanying endnotes
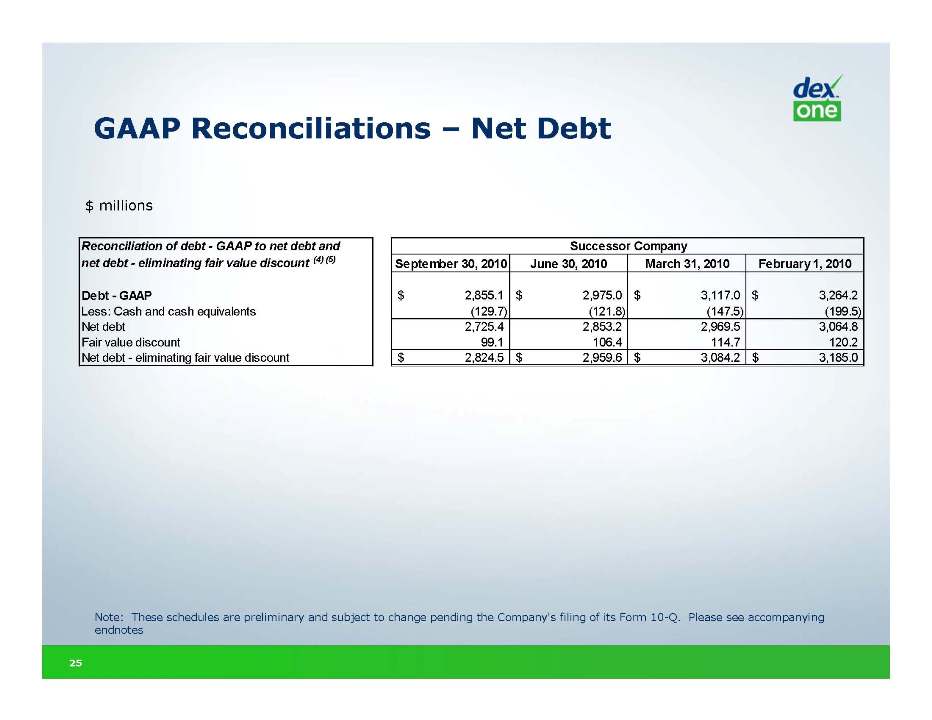
GAAP Reconciliations – Net Debt Other Placeholder: 25 $ millions Note: These schedules are preliminary and subject to change pending the Company's filing of its Form 10-Q. Please see accompanying endnotes

Reconciliation Endnotes Note: These schedules are preliminary and subject to change pending the Company's filing of its Form 10-Q Other Placeholder: Our advertising revenues are earned primarily from the sale of advertising in yellow pages directories we publish, net of sales claims and allowances. Advertising revenues also include revenues for Internet-based advertising products including online directories, such as DexKnows.com and DexNet. Advertising revenues are affected by several factors, including changes in the quantity and size of advertisements, acquisition of new clients, renewal rates of existing clients, premium advertisements sold, changes in advertisement pricing, the introduction of new products, an increase in competition and more fragmentation in the local business search market and general economic factors. Revenues with respect to print advertising and Internet-based advertising products that are sold with print advertising are recognized under the deferral and amortization method. Revenues related to our print advertising are initially deferred when a directory is published and recognized ratably over the directory’s life, which is typically 12 months. Revenues with respect to our advertising products that are non-performance based are recognized ratably over the life of the contract commencing when they are first delivered or fulfilled. Revenues with respect to our advertising products that are performance-based are recognized as the service is delivered or fulfilled.Based upon the decline in the trading value of our debt and equity securities during the three months ended September 30, 2010, among other indicators, the Company concluded that there were indicators of impairment during the three months ended September 30, 2010. In addition, based upon the decline in the trading value of our debt and equity securities during the three months ended June 30, 2010 and the retirement of our Chairman and Chief Executive Officer on May 28, 2010, among other indicators, the Company concluded that there were indicators of impairment during the three months ended June 30, 2010. As a result of identifying indicators of impairment, we performed impairment tests as of September 30, 2010 and June 30, 2010 of our goodwill, definite-lived intangible assets and other long-lived assets in accordance with Accounting Standards Codification ("ASC") 350, Intangibles – Goodwill and Other and ASC 360, Property, Plant and Equipment. The testing results of our definite-lived intangible assets and other long-lived assets resulted in an impairment charge associated with trade names and trademarks, technology, local customer relationships and other from our Business.com reporting unit of $4.3 million and $17.3 million during the three months ended September 30, 2010 and June 30, 2010, respectively, for a total non-goodwill intangible asset impairment charge of $21.6 million during the eight months ended September 30, 2010. The testing results of our goodwill resulted in an impairment charge of $385.3 million and $752.3 million during the three months ended September 30, 2010 and June 30, 2010, respectively, which has been recorded at each of our reporting units. The Company has excluded the goodwill and intangible asset impairment charges from Adjusted and Combined Adjusted Results three months ended September 30, 2010 and June 30, 2010.
Endnotes (cont’d) Note: These schedules are preliminary and subject to change pending the Company's filing of its Form 10-Q Other Placeholder: Reorganization items directly associated with the process of reorganizing the business under Chapter 11 of the Bankruptcy Code were recorded on a separate line item on the unaudited condensed consolidated statements of operations. The Predecessor Company had recorded $7.1 million during the three months ended September 30, 2009, respectively, associated with items such as professional fees, the write-off of unamortized deferred financing costs, net premiums / discounts and fair value adjustments due to purchase accounting associated with long-term debt classified as liabilities subject to compromise, and rejected leases. In conjunction with our adoption of fresh start accounting, an adjustment was established to record our outstanding debt at fair value on the Fresh Start Reporting Date. The Company was required to record our amended and restated credit facilities at a discount as a result of their fair value on the Fresh Start Reporting Date. Therefore, the carrying amount of these debt obligations is lower than the principal amount due at maturity. This fair value adjustment is amortized as an increase to interest expense over the remaining term of the respective debt agreements and does not impact future scheduled interest or principal payments. The unamortized fair value adjustment resulting from fresh start accounting was $99.1 million at September 30, 2010. Net debt represents total debt less cash and cash equivalents on the respective date. Net debt – eliminating fair value discount eliminates the fair value discount as a result of fresh start accounting described in Note 4 and represents principal amounts due at maturity.
Endnotes (cont’d) Note: These schedules are preliminary and subject to change pending the Company's filing of its Form 10-Q Other Placeholder: Advertising sales is a non-GAAP statistical measure and consists of sales of advertising in print directories distributed during the period and Internet-based products and services with respect to which such advertising first appeared publicly during the period. It is important to distinguish advertising sales from net revenue, which is recognized under the deferral and amortization method. Combined advertising sales for the three months ended March 31, 2010 combines advertising sales of the Successor Company for the two months ended March 31, 2010 and the Predecessor Company for the one month ended January 31, 2010. In order to provide more visibility into what the Company will book as revenue in the future, we have introduced a non-GAAP statistical measure called bookings, which represent sales activity associated with our print directories and Internet-based products and services during the period. Bookings associated with our local customers represent signed contracts during the period. Bookings associated with our national customers represent what has been published or fulfilled during the period.