Attached files
| file | filename |
|---|---|
| 8-K - FORM 8-K - PDC ENERGY, INC. | pec8k11082010.htm |
| EX-99.1 - EX-99.1 - PDC ENERGY, INC. | pdcrelease2010_1108.htm |

Third Quarter 2010 Results Teleconference
November 8, 2010

Disclaimer
The following information contains forward-looking statements within the meaning of the Private Securities Litigation Reform Act of 1995. These
forward-looking statements are based on Management’s current expectations and beliefs, as well as a number of assumptions concerning future
events.
forward-looking statements are based on Management’s current expectations and beliefs, as well as a number of assumptions concerning future
events.
These statements are based on certain assumptions and analyses made by Management in light of its experience and its perception of historical
trends, current conditions and expected future developments as well as other factors it believes are appropriate in the circumstances. However,
whether actual results and developments will conform with Management’s expectations and predictions is subject to a number of risks and
uncertainties, general economic, market or business conditions; the opportunities (or lack thereof) that may be presented to and pursued by PDC
Energy; actions by competitors; changes in laws or regulations; and other factors, many of which are beyond the control of PDC Energy.
You are cautioned not to put undue reliance on such forward-looking statements because actual results may vary materially from those expressed
or implied, as more fully discussed in our safe harbor statements found in our SEC filings, including, without limitation, the discussion under the
heading “Risk Factors” in the Company’s 2009 annual report on Form 10-K and in subsequent Form 10-Qs. All forward-looking statements are
based on information available to Management on this date and PDC Energy assumes no obligation to, and expressly disclaims any obligation to,
update or revise any forward looking statements, whether as a result of new information, future events or otherwise.
The SEC permits oil and gas companies to disclose in their filings with the SEC proved reserves, probable reserves and possible reserves. SEC
regulations define “proved reserves” as those quantities of oil or gas which, by analysis of geosciences and engineering data, can be estimated
with reasonable certainty to be economically producible in future years from known reservoirs under existing economic conditions, operating
methods and government regulations; “probable reserves” as unproved reserves which, together with proved reserves, are as likely as not to be
recovered; and “possible reserves” as unproved reserves which are less certain to be recovered than probable reserves. Estimates of probable
and possible reserves which may potentially be recoverable through additional drilling or recovery techniques are by nature more uncertain than
estimates of proved reserves and accordingly are subject to substantially greater risk of not actually being realized by the Company. In addition,
the Company’s reserves and production forecasts and expectations for future periods are dependent upon many assumptions, including
estimates of production decline rates from existing wells and the undertaking and outcome of future drilling activity, which may be affected by
significant commodity price declines or drilling cost increases.
This material also contains certain non-GAAP financial measures as defined under the Securities and Exchange Commission rules.
2
11/08/2010

Rick McCullough
Chairman and Chief Executive Officer
3
11/08/2010

Third Quarter 2010 Highlights
11/08/2010
4
• Financial results were essentially within guidance in spite of lease operating
expense which was up for the quarter due to the expensing of approximately
$2 MM which was budgeted as a capital item
expense which was up for the quarter due to the expensing of approximately
$2 MM which was budgeted as a capital item
• Q3 2010 realized prices of $6.42 per Mcfe compared to Q3 2009 realized
prices of $6.14 per Mcfe
prices of $6.14 per Mcfe
• Production slightly above guidance due to Wattenberg results
• Drilled 39.7 net wells vs. 21.0 net wells in Q3 2009
• Production continues to trend higher as fourth quarter’s production and exit
rate should exceed guidance; oil’s percentage of (2010 exit rate) production
should approach 26% versus 18% of 2009 exit rate production
rate should exceed guidance; oil’s percentage of (2010 exit rate) production
should approach 26% versus 18% of 2009 exit rate production

Third Quarter 2010 Highlights, continued
11/08/2010
5
• Drilling efficiencies continue to improve as a result of optimizing capital costs
and improving operating performance in the Piceance Basin and Wattenberg
Field
and improving operating performance in the Piceance Basin and Wattenberg
Field
• Signed an agreement with a private company to acquire producing assets
and undeveloped acreage located in the Wolfberry oil trend in West Texas for
$40 MM in cash
and undeveloped acreage located in the Wolfberry oil trend in West Texas for
$40 MM in cash
• Amended and restated the Company’s revolving bank loan facility agreement
on November 4, 2010, increasing the borrowing base to $350 MM, adding
additional lenders, amending certain other provisions including a cost
reduction on its borrowing grid, and extending the maturity to November 2015
on November 4, 2010, increasing the borrowing base to $350 MM, adding
additional lenders, amending certain other provisions including a cost
reduction on its borrowing grid, and extending the maturity to November 2015

Bart Brookman
Senior Vice President - Exploration and Production
6
11/08/2010

Q1 2010 Production:
8.1
Bcfe
8.1
Bcfe
Rocky Mountains
Q1 2010 Production:
0.6
Bcfe
0.6
Bcfe
Q2 2010 Production:
0.6
Bcfe
0.6
Bcfe
Q3 2010 Production:
0.6
Bcfe
0.6
Bcfe
2010E Production:
2.5
Bcfe
2.5
Bcfe
Appalachian Basin (PDCM)
Q1 2010 Production:
0.3
Bcfe
0.3
Bcfe
Q3 2010 Production
9.2 Bcfe
Michigan
Basin (1%)
Basin (1%)
Appalachian Basin (7%)
Rocky
Mountains (90%)
Mountains (90%)
Rocky
Mountains (91%)
Mountains (91%)
7
Core Operating Regions
Operations Underway
Q3 2010 Production:
0.1
Bcfe
0.1
Bcfe
2010E Production:
0.5
Bcfe
0.5
Bcfe
Permian Basin
Permian (1%)
11/08/2010

Quarterly Net Production
8
• Q3 actual production exceeded
mid-year guidance
mid-year guidance
• Primarily Wattenberg Field driven
• Improved frac designs
• Production includes increased oil and
gas liquids component
gas liquids component
• Successfully acquired and
integrated Permian assets
integrated Permian assets
• Optimizing production
• Increasing production from
Marcellus
Marcellus
• Q4 production anticipated to be in-
line or above guidance
line or above guidance
• Lower line pressure in Wattenberg
Field
Field
Michigan
(reflected as discontinued operations)
11/08/2010
*Excludes Q4 anticipated acquisitions.
*

Quarterly Drilling Activity
9
• Improved capital efficiencies achieved
in drilling and completion operations
in drilling and completion operations
• Two rigs operating in Wattenberg Field
• One flex rig operating in Piceance Basin
• Significant improvement in spud-to-spud time
11/08/2010
3Q 2010
4Q 2010 Expectations
• Drill five Permian Basin wells
• Drill first horizontal Niobrara well in
Krieger prospect
Krieger prospect
• Spud 4th horizontal Marcellus well
• Operate 3rd vertical rig in Wattenberg
Field
Field
* Excludes Q4 anticipated acquisitions.
*
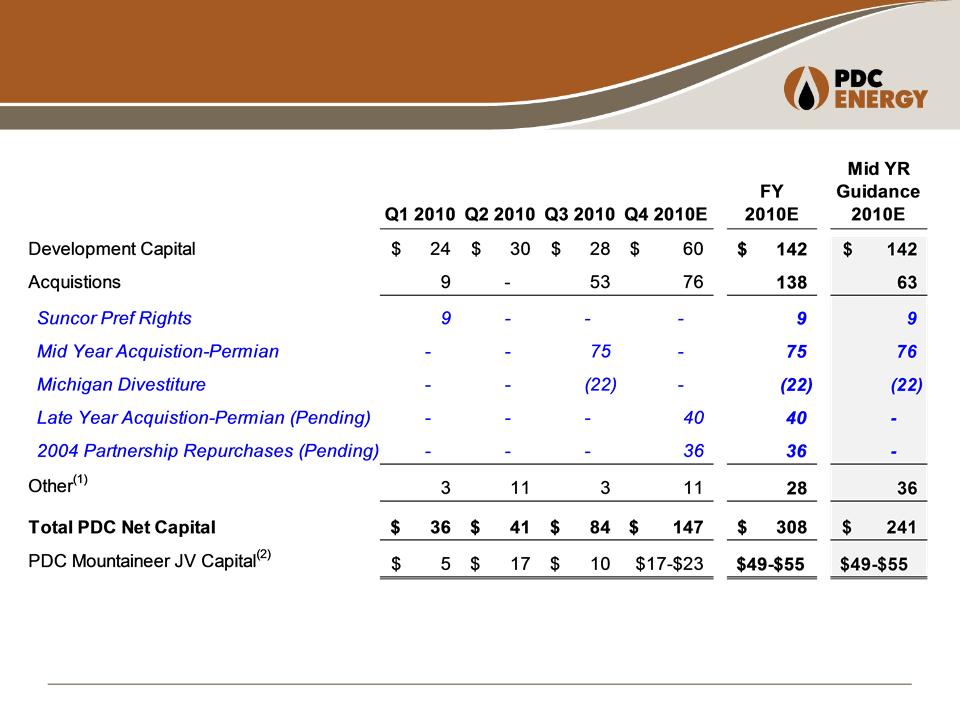
Q3 Capital Expenditure Update
Q1-Q3 Actual & New Estimates for 4Q2010
Q1-Q3 Actual & New Estimates for 4Q2010
$ in Millions
10
11/08/2010
(1) Other capital includes exploration, leasehold, facilities, and miscellaneous.
(2) Marcellus operations funded by our joint venture partner.

11
2010 Production by Area
Billion Cubic Feet Equivalent (Bcfe)
|
Area
|
Q1 2010
Actual |
Q2 2010
Actual |
Q3 2010
Actual |
FY 2010E
|
|
Wattenberg
|
4.0
|
4.0
|
4.1
|
15.9
|
|
Piceance
|
3.0
|
2.8
|
3.2
|
11.9
|
|
NECO
|
1.1
|
1.1
|
1.1
|
4.4
|
|
Michigan*
|
0.3
|
0.4
|
-
|
0.7
|
|
West Texas
|
0.0
|
0.0
|
0.1
|
0.6
|
|
Other
(ND, TX, WY,OH)
|
0.1
|
0.1
|
0.1
|
0.4
|
|
Appalachia
(PDCM) |
0.6
|
0.6
|
0.6
|
2.5
|
|
TOTAL
|
9.1
|
9.0
|
9.2
|
36.4
|
* Michigan production through 6/30/10 reflected as discontinued operations.
11/08/2010
Note: Full-year excludes Q4 anticipated acquisitions.

Growth in Fourth Quarter Production
11/08/2010
12
Mid-Year Guidance Net Production 2010 Exit
Rate
Rate
•Net Production 9.3 Bcfe 107 MMcfe/d
•Oil 360 Mbo 4.3 MMBbl/d
•Gas 7,200 MMcf 80.8 MMcf/d
Fourth Quarter New Activity
•2nd Wolfberry Acquisition(1) 0.1 Bcfe 3.6
MMcfe/d
MMcfe/d
• Oil 17.4 Mbo 0.5 MBbl/d
• Gas 7.3 MMcf 0.2 MMcf/d
•Partnership Purchases(2) 0.1 Bcfe 3.6 MMcfe/d
• Oil 2.2 Mbo 0.07 MBbl/d
• Gas 97 MMcf 3.2 MMcf/d
Updated Fourth Quarter 9.5 Bcfe 114 MMcfe/d
26% oil
26% oil
(1) Wolfberry acquisition production for December 2010 based on current rate estimate.
(2) Partnership production based upon December 2010 post-closing volumes. Assumes PDC successful in outstanding partnership repurchase offer.

Lifting Costs
|
|
Q1 2010
Actual
|
Q2 2010
Actual
|
Q3 2010
Actual
|
FY 2010E
|
|
Direct Costs ($/Mcfe)
|
$0.75
|
$0.98
|
$0.97
|
$0.73 - $0.87
|
|
Indirect Costs ($/Mcfe)
|
$0.29
|
$0.26
|
$0.24
|
$0.27 - $0.31
|
|
Total Lifting Cost ($/Mcfe)
|
$1.04
|
$1.24
|
$1.21
|
$1.00 - $1.18
|
13
• Q3 2010 per unit costs increased as a result of:
• Increased workovers to enhance production (primarily in Piceance Basin)
• Accrual of facility upgrade costs in Piceance Basin and Wattenberg Field
• Total lifting costs include workover expenses of $0.08 in Q1, $0.30 in Q2,
and $0.36 in Q3
and $0.36 in Q3
11/08/2010

Operations Highlights
• Q4 drilling activity in-line with guidance; six active drilling rigs
• Wattenberg production continues to exceed engineering expectations
• Spud first Permian Basin well
• Drilling fourth horizontal well in WV
• First horizontal Niobrara well TD’d on the Krieger Prospect in the DJ Basin
• Approved a ten year mid-stream transportation commitment in WV for future
Marcellus production
Marcellus production
• Four superfracs executed in Piceance Basin with encouraging results
14
11/08/2010

Gysle Shellum
Chief Financial Officer
15
11/08/2010

Summary Financial Results
11/08/2010
16
In Millions, Except for Per Share Data
|
|
Three Months Ended
|
Nine Months Ended
|
||
|
September 30,
|
September 30,
|
|||
|
Measure
|
2010
|
2009
|
2010
|
2009
|
|
O&G Revenues
|
$48.1
|
$42.9
|
$156.1
|
$121.4
|
|
O&G Production & Well Operations Costs
|
$16.7
|
$14.7
|
$48.2
|
$44.2
|
|
O&G Operating Margin
|
$31.4
|
$28.2
|
$107.9
|
$77.2
|
|
Adjusted cash flow from operations(1)
|
$23.6
|
$37.3
|
$101.8
|
$114.7
|
|
Adjusted EBITDA(2)
|
$27.2
|
$36.3
|
$109.3
|
$117.2
|
|
Adjusted EBITDA (per diluted share)(1)
|
$1.40
|
$2.14
|
$5.66
|
$7.55
|
|
DD&A
|
$28.2
|
$31.9
|
$83.0
|
$99.1
|
|
G&A
|
$10.4
|
$9.6
|
$31.0
|
$36.5
|
(1) See appendix for Non-GAAP reconciliation of Adjusted Cash Flow from Operations and Adjusted EBITDA.

Summary Financial Results
11/08/2010
17
|
|
Three Months Ended
|
Nine Months Ended
|
||
|
September 30,
|
September 30,
|
|||
|
Measure
|
2010
|
2009
|
2010
|
2009
|
|
Operating income (loss)
|
$10.3
|
($30.6)
|
$62.3
|
($77.6)
|
|
Net Income (loss) attributable to
.shareholders |
$3.4
|
($24.5)
|
$24.4
|
($63.3)
|
|
Diluted earnings (loss) per share
.attributable to shareholders |
$0.17
|
($1.44)
|
$1.26
|
($4.07)
|
|
|
Three Months Ended
|
Nine Months Ended
|
||
|
September 30,
|
September 30,
|
|||
|
Measure
|
2010
|
2009
|
2010
|
2009
|
|
Adjusted net income (loss) from continuing
operations(1) |
($1.9)
|
($3.4)
|
$5.7
|
($4.0)
|
|
Adjusted earnings (loss) per share from
continuing operations(1)
|
($0.10)
|
($0.20)
|
$0.29
|
($0.26)
|
(1) See appendix for Non-GAAP reconciliation of Adjusted Net Income.
In Millions, Except for Per Share Data

Debt Maturity Schedule
11/08/2010
18
• $350 million revolver matures
in November 2015
in November 2015
• Maturity schedule and increase
reflects:
reflects:
– Mitigation of liquidity risk
– Diversification of funding sources
– Growing support of investing
community in our strategies and
execution
community in our strategies and
execution
• As of September 30, 2010:
– $102 million drawn balance
– $19 million undrawn L.O.C
– $13 million cash balance
– $198 million available liquidity
$203
$102
$ in Millions
2010
2011
2012
2013
2014
2015
2016
2017
2018

Quarterly Realized Hedge Price
11/08/2010
19
As of 9/30/10
Note: Weighted average for full year 2010 is $7.36/Mcfe.

Oil and Gas Per Unit Costs
11/08/2010
20
|
|
Three Months Ended
|
Nine Months Ended
|
||
|
September 30,
|
September 30,
|
|||
|
Measure
|
2010
|
2009
|
2010
|
2009
|
|
Average Lifting Costs(1)
|
$1.21
|
$0.79
|
$1.16
|
$0.78
|
|
DD&A (O&G Properties Only)
|
$2.87
|
$2.79
|
$2.89
|
$2.87
|
(1) Lifting costs represent natural gas and oil lease operating expenses, exclusive of production taxes, on a per unit basis.
Per Mcfe
Third quarter 2010 per unit costs were higher than 2009 third quarter per unit costs due to lower production and
the addition of approximately $0.33 per unit due to the incurrence of approximately $1 million of environmental
maintenance expenses, and well workover expenses of approximately $2 million. When amounts are adjusted
for these items the comparison was $0.88 per unit in 2010 compared to $0.79 per unit in 2009. Most of the
difference in per unit costs was related to lower production volumes in 2010.
For the nine months ended September 30, when amounts are adjusted for the incurrence of approximately $2.6
million of environmental maintenance expenses, and well workover expenses of approximately $3.8 million, the
comparison was $0.92 per unit in 2010 versus $0.78 per unit in 2009. Most of this is related to lower production
volumes.
million of environmental maintenance expenses, and well workover expenses of approximately $3.8 million, the
comparison was $0.92 per unit in 2010 versus $0.78 per unit in 2009. Most of this is related to lower production
volumes.

Lance Lauck
Senior Vice President - Business Development
21
11/08/2010

Acquiring Additional Wolfberry Assets
11/08/2010
22
Existing Production with Significant Upside Opportunities
Acquisition Summary - Announced November 3, 2010
• Acquiring 5,760 net acres in the Wolfberry Trend for $40 million
• Contiguous to existing Wolfberry acreage position
• Privately negotiated transaction
• PDC operated assets with essentially a 100% working interest
• Current net production of 330 boe/d from 6 Wolfberry wells
• 7th well on flow-back
• Identified 122 locations on 40-acre spacing; plan to drill first well in December 2010
• Approximately 10 million barrels of oil equivalent (MMBOE) in 2P reserves
• 90% oil and natural gas liquids, delivering full cycle cash margin of $60/BOE
• Effective date of November 1, 2010; Expect to close transaction on November 19, 2010

Doubling Size of Permian Position
11/08/2010
23
Establishes Permian Basin as a Key Development Area for PDC
Key Highlights
• Established a field office in Midland, TX
• Added experienced technical staff to lead Wolfberry development
• Drilling first Wolfberry well on initial acquisition; development ahead of schedule
• Expect to drill five wells by end of 2010
• Full testing of Wolfberry acreage areas expected by early 2011
• Anticipate 20-30 wells drilled in 2011; 1 to 2 rig program
• Workovers and production optimization projects growing base production
• Multi-year production growth expected from Wolfberry development drilling
• Implementing PDC strategy to increase liquids in corporate reserve portfolio
|
|
Nov 2010 Acquisition
|
Total Permian
|
|
Acquisition Cost
|
$40MM
|
$115MM
|
|
Net Wolfberry Acres
|
5,760
|
10,500
|
|
Net Production (Boe/d)
|
330
|
900
|
|
Net 2P Reserves (MMBOE)
|
10.0
|
18.5
|
|
40-acre Drilling Locations
|
122
|
250
|

Appendix
24
11/08/2010

25
11/08/2010
|
|
Three Months Ended
|
Nine Months Ended
|
||
|
September 30,
|
September 30,
|
|||
|
|
2010
|
2009
|
2010
|
2009
|
|
Net Income (loss) from continuing operations
|
$3.2
|
($25.0)
|
$26.0
|
($64.6)
|
|
Unrealized (gain) loss on derivatives, net (1)
|
(11.4)
|
35.0
|
(36.1)
|
95.7
|
|
Provision for underpayment of gas sales
|
3.3
|
-
|
3.3
|
2.6
|
|
Tax effect of above adjustments
|
3.1
|
(13.4)
|
12.5
|
(37.7)
|
|
Adjusted Net Income (loss) from continuing
operations |
($1.9)
|
($3.4)
|
$5.7
|
($4.0)
|
|
Weighted average diluted shares outstanding
|
19,406
|
16,962
|
19,319
|
15,530
|
|
Adjusted diluted earnings (loss) per share
|
($0.10)
|
($0.20)
|
$0.29
|
($0.26)
|
Adjusted Net Income Reconciliation
$ in Millions, Except for Per Share Data
(1) Includes natural gas marketing activities.

26
11/08/2010
|
|
Three Months Ended
|
Nine Months Ended
|
||
|
September 30,
|
September 30,
|
|||
|
|
2010
|
2009
|
2010
|
2009
|
|
Net Cash provided by operating activities
|
$21.4
|
$39.3
|
$116.8
|
$100.0
|
|
Changes in assets and liabilities
|
2.2
|
(2.0)
|
(15.0)
|
14.7
|
|
Adjusted cash flow from continuing
operations |
$23.6
|
$37.3
|
$101.8
|
$114.7
|
|
Weighted average diluted shares outstanding
|
19,406
|
16,962
|
19,319
|
15,530
|
|
Adjusted cash flow per share
|
$1.22
|
$2.20
|
$5.27
|
$7.39
|
Adjusted Cash Flow Reconciliation
$ in Millions, Except for Per Share Data

27
11/08/2010
Adjusted EBITDA Reconciliation
$ in Millions, Except for Per Share Data
|
|
Three Months Ended
|
Nine Months Ended
|
||
|
September 30,
|
September 30,
|
|||
|
|
2010
|
2009
|
2010
|
2009
|
|
Net Income (loss) from continuing operations
|
$3.2
|
($25.0)
|
$26.0
|
($64.6)
|
|
Unrealized (gain) loss on derivatives, net(1)
|
(11.4)
|
35.0
|
(36.1)
|
95.7
|
|
Interest, net
|
8.2
|
9.0
|
23.6
|
26.8
|
|
Income taxes expense (benefit)
|
(1.0)
|
(14.7)
|
12.7
|
(39.8)
|
|
Depreciation, depletion & amortization
|
28.2
|
31.9
|
83.0
|
99.1
|
|
Adjusted EBITDA
|
$27.2
|
$36.3
|
$109.3
|
$117.2
|
|
Weighted average diluted shares outstanding
|
19,406
|
16,962
|
19,319
|
15,530
|
|
Adjusted EBITDA per share
|
$1.40
|
$2.14
|
$5.66
|
$7.55
|
(1) Includes natural gas marketing activities.

Contact Information
Investor Relations
• Peter Schreck, Vice President - Finance and Treasurer
pschreck@petd.com
• Marti Dowling, Manager Investor Relations
mdowing@petd.com
• Heather Davis, Investor Relations Coordinator
hdavis@petd.com
Corporate Headquarters
• PDC Energy
1775 Sherman Street
Suite 3000
Denver, CO 80203
303-860-5800
Website
• www.petd.com
28
11/08/2010