Attached files
| file | filename |
|---|---|
| 8-K - FORM 8-K - PNC FINANCIAL SERVICES GROUP, INC. | d8k.htm |
 The
PNC Financial Services Group, Inc. BancAnalysts Association of Boston
November 4, 2010
Exhibit 99.1 |
 2
Cautionary Statement Regarding Forward-Looking Information
and Adjusted Information
This
presentation
includes
“snapshot”
information
about
PNC
used
by
way
of
illustration.
It
is
not
intended
as
a
full
business
or
financial
review
and
should
be
viewed
in
the
context
of
all
of
the
information
made
available
by
PNC
in
its
SEC
filings.
The
presentation
also
contains
forward-looking
statements
regarding
our
outlook
or
expectations
relating
to
PNC’s
future
business,
operations,
financial
condition,
financial
performance,
capital
and
liquidity
levels,
and
asset
quality.
Forward-looking
statements
are
necessarily
subject
to
numerous
assumptions,
risks
and
uncertainties,
which
change
over
time.
The
forward-looking
statements
in
this
presentation
are
qualified
by
the
factors
affecting
forward-looking
statements
identified
in
the
more
detailed
Cautionary
Statement
included
in
the
Appendix,
which
is
included
in
the
version
of
the
presentation
materials
posted
on
our
corporate
website
at
www.pnc.com/investorevents.
We
provide
greater
detail
regarding
some
of
these
factors
in
our
2009
Form
10-K
and
2010
Form
10-Qs,
including
in
the
Risk
Factors
and
Risk
Management
sections
of
those
reports,
and
in
our
subsequent
SEC
filings
(accessible
on
the
SEC’s
website
at
www.sec.gov
and
on
or
through
our
corporate
website
at
www.pnc.com/secfilings).
We
have
included
web
addresses
here
and
elsewhere
in
this
presentation
as
inactive
textual
references
only.
Information
on
these
websites
is
not
part
of
this
presentation.
Future
events
or
circumstances
may
change
our
outlook
or
expectations
and
may
also
affect
the
nature
of
the
assumptions,
risks
and
uncertainties
to
which
our
forward-
looking
statements
are
subject.
The
forward-looking
statements
in
this
presentation
speak
only
as
of
the
date
of
this
presentation.
We
do
not
assume
any
duty
and
do
not
undertake
to
update
those
statements.
In
this
presentation,
we
will
sometimes
refer
to
adjusted
results
to
help
illustrate
the
impact
of
certain
types
of
items,
such
as
the
acceleration
of
accretion
of
the
remaining
issuance
discount
on
our
TARP
preferred
stock
in
connection
with
the
first
quarter
2010
redemption
of
such
stock,
our
fourth
quarter
2009
gain
related
to
BlackRock’s
acquisition
of
Barclays
Global
Investors
(the
“BLK/BGI
gain”),
our
third
quarter
2010
gain
related
to
the
sale
of
PNC
Global
Investment
Servicing
Inc.
(“GIS”),
our
fourth
quarter
2008
conforming
provision
for
credit
losses
for
National
City,
and
integration
costs
in
the
2010
and
2009
periods.
This
information
supplements
our
results
as
reported
in
accordance
with
GAAP
and
should
not
be
viewed
in
isolation
from,
or
a
substitute
for,
our
GAAP
results.
We
believe
that
this
additional
information
and
the
reconciliations
we
provide
may
be
useful
to
investors,
analysts,
regulators
and
others
as
they
evaluate
the
impact
of
these
respective
items
on
our
results
for
the
periods
presented
due
to
the
extent
to
which
the
items
are
not
indicative
of
our
ongoing
operations.
In
certain
discussions,
we
may
also
provide
information
on
yields
and
margins
for
all
interest-earning
assets
calculated
using
net
interest
income
on
a
taxable-equivalent
basis
by
increasing
the
interest
income
earned
on
tax-exempt
assets
to
make
it
fully
equivalent
to
interest
income
earned
on
taxable
investments.
We
believe
this
adjustment
may
be
useful
when
comparing
yields
and
margins
for
all
earning
assets.
We
may
also
adjust
yields
and
margins
for
the
ratio
of
annualized
provision
for
credit
related
losses
to
average
interest-earning
assets.
We
believe
such
adjustments
are
useful
as
a
tool
to
help
evaluate
the
amount
of
credit
related
risk
associated
with
interest-earning
assets.
We
may
also
provide
information
on
pretax
pre-provision
earnings
(total
revenue
less
noninterest
expense),
as
we
believe
that
pretax
pre-
provision
earnings
is
useful
as
a
tool
to
help
evaluate
the
ability
to
provide
for
credit
costs
through
operations.
This
presentation
may
also
include
discussion
of
other
non-GAAP
financial
measures,
which,
to
the
extent
not
so
qualified
therein
or
in
the
Appendix,
is
qualified
by
GAAP
reconciliation
information
available
on
our
corporate
website
at
www.pnc.com
under
“About
PNC–Investor
Relations.” |
 3
Key Take-Aways
PNC’s business model and execution have delivered strong
results in this challenging environment
PNC has made significant progress toward returning to a
moderate risk profile
PNC has meaningful opportunities to improve market share
PNC has demonstrated the ability to deliver shareholder value
PNC Continues to Build a Great Company.
PNC Continues to Build a Great Company. |
 4
Footprint covering nearly 1/3 of the U.S.
population
Retail
Corporate & Institutional
A leader in serving middle-market
customers and government entities
One of the largest bank-held asset
managers in the U.S.
Asset Management
Residential Mortgage
One of the nation’s largest mortgage
platforms
A Powerful Franchise Focused on Quality Growth
8
th
$260 billion
Assets
U.S.
Rank
1
Sept. 30, 2010
6,626
2,461
$179 billion
5
th
ATMs
5
th
Branches
6
th
Deposits
(1) Rankings source: SNL DataSource; Banks headquartered in U.S.
CO
TX
KS
OK
BlackRock
A leader in investment management, risk
management and advisory services worldwide
Execution |
 5
Continuing to Build a Great Company
Continued to deliver strong financial results in a challenging environment
High quality and well-positioned balance sheet; increased bank liquidity and
strengthened capital
Credit quality improvement
Businesses continued to grow clients and deepen relationships
3Q10 highlights
Execution
3Q09
3Q10
Pretax pre-provision
earnings
/provision
1.8x
3.0x
Net income
2.4x
1.6x
(1) Total revenue less noninterest expense. Further information
is provided in the Appendix.
YTD09
YTD10
$559
$1,103
$1,296
$2,577
Net income
1 |
 6
PNC’s Business Model
Staying core funded and disciplined in our deposit pricing
Returning to a moderate risk profile
Leveraging customer relationships and our strong brand to grow high
quality, diverse revenue streams
Creating positive operating leverage
while
investing in innovation
Remaining disciplined with our capital
Executing on our strategies
Execution
(1) A period to period dollar or percentage change when revenue growth exceeds
expense growth. 1 |
 7
Building a High Quality,
Differentiated Balance Sheet
(1) December 31, 2008 was the closing date of our National City acquisition.
Returning
to a
Moderate
Risk Profile
$260.1
29.4
.6
11.1
39.8
179.2
10.3
40.7
$128.2
$260.1
46.5
150.1
$63.5
Sept. 30, 2010
(9.3)
Other
(7.3)
Preferred equity
($30.9)
Total liabilities and equity
(12.5)
Borrowed funds
(13.3)
Other time/savings
(13.7)
Total deposits
11.9
Common equity
(17.6)
Retail CDs
$17.2
Transaction deposits
(25.5)
Other assets
(25.4)
Total loans
($30.9)
Total assets
$20.0
Change from
Dec. 31, 2008
1
Investment securities
Category (billions)
Loans to deposits ratio of 84%
Loans declined driven by loan
pay-offs, sales, net charge-offs
and ongoing soft demand
Continued to grow transaction
deposits while reducing higher
cost brokered and retail CDs
Added high quality, short-
duration securities
Significant improvement in
common equity
Highlights |
 8
1.36%
0.64%
0.66%
.04%
1.39%
2.37%
.49%
.13%
.50%
1.78%
.83%
.25%
1.15%
3.99%
2.61%
0.71%
0.88%
3.16%
2002
2003
2004
2005
2006
2007
2008
2009
2010
Provision for credit losses to average loans
Relative Cost of Credit
(1)
Excludes
the
4Q08
conforming
provision
for
credit
losses
of
$504
million
related
to
the
National
City
acquisition.
Average
loans
do
not
reflect
the
National
City
acquisition
as
the
acquisition
closed
on
December
31,
2008.
Other
acquisitions
did
not
similarly
impact
the
ratio.
Including
the
National
City
conforming
provision,
the
provision
for
credit
losses
to
average
loans
for
2008
was
2.09%.
Further
information
is
provided
in
the
Appendix.
(2)
Peers
represents
average
of
banks
identified
in the Appendix. (3) For the nine months ended September 30, 2010,
annualized. Recession
1
3
Returning
to a
Moderate
Risk Profile
PNC
Peers
Overheated economy
Slow growth economy
2 |
 9
Active Credit Risk Management
0%
1%
2%
3%
4%
Nonperforming
loans²
to total
loans
Nonperforming
assets²
to total
assets
Net charge-offs
to average loans
Allowance for
loan and lease
losses³
to
loans
3Q10 reserves / YTD10 annualized NCOs
2.5
1.8
1.6
1.4
1.3
1.2
1.2
1.2
1.1
1.1
1.0
1.0
0.9
MTB
PNC
CMA
JPM
WFC
USB
FITB
BAC
RF
KEY
STI
BBT
COF
X
Key
3Q10
metrics
1
2.18%
2.75%
3.22%
3.84%
1.61%
2.81%
3.48%
3.41%
Returning
to a
Moderate
Risk Profile
(1)
As
of
or
for
the
quarter
ended
September
30,
2010.
Net
charge-offs
to
average
loans
percentages
are
annualized.
Peers
represents
average
of
banks
identified
in
the
Appendix
as
available.
COF
nonperforming
assets
to
total
assets
and
nonperforming
loans
to
total
loans
not
available.
Sources:
SNL
DataSource,
company
reports.
(2)
Does
not
include
purchased
impaired
loans
or
loans
held
for
sale.
(3)
Includes
impairment
reserves
attributable
to
purchased
impaired
loans.
Loans
PNC
acquired from National City that were impaired are purchased impaired loans.
|
 10
(6)
(5)
(4)
(3)
(2)
(1)
0
1
2
3
4
0%
1%
2%
3%
4%
5%
6%
Active Balance Sheet Management
PNC Duration
of Equity
(At Quarter End)
Fed Funds
Effective Rate
(At Quarter End)
2007
2008
2009
+4.6%
100 bps increase
(5.9%)
100 bps decrease
Effect on NII in 2
nd
year from gradual
interest rate change over preceding
12 months
Effect on NII in 1
st
year from gradual
interest rate change over following 12
months
PNC 3Q10 NII Sensitivity
(1.8%)
+1.5%
100 bps decrease
100 bps increase
Q1
Q2
Q3
Q4
Q1
Q2
Q3
Q4
Q1
Q2
Q3
Q4
Q1
Q2
2010
Q3
PNC 3Q10 information is estimated.
Returning
to a
Moderate
Risk Profile |
 11
Favorable
Credit
Risk-Adjusted
1
Returns
Peer source: SNL DataSource and company reports. (1) Net interest margin less
(annualized provision/average interest earning assets). Further information is
provided in the Appendix.
YTD10 net interest margin
7.13%
4.26%
4.18%
4.02%
3.90%
3.82%
3.62%
3.34%
3.22%
3.21%
3.12%
2.86%
2.80%
COF
WFC
PNC
BBT
USB
MTB
FITB
STI
KEY
CMA
JPM
RF
BAC
YTD10
credit
risk-adjusted
NIM
1
5.30%
3.19%
2.96%
2.67%
2.12%
2.06%
2.06%
2.04%
1.98%
1.78%
1.34%
1.17%
0.44%
COF
MTB
PNC
WFC
CMA
USB
BBT
JPM
KEY
FITB
STI
BAC
RF
Returning
to a
Moderate
Risk Profile |
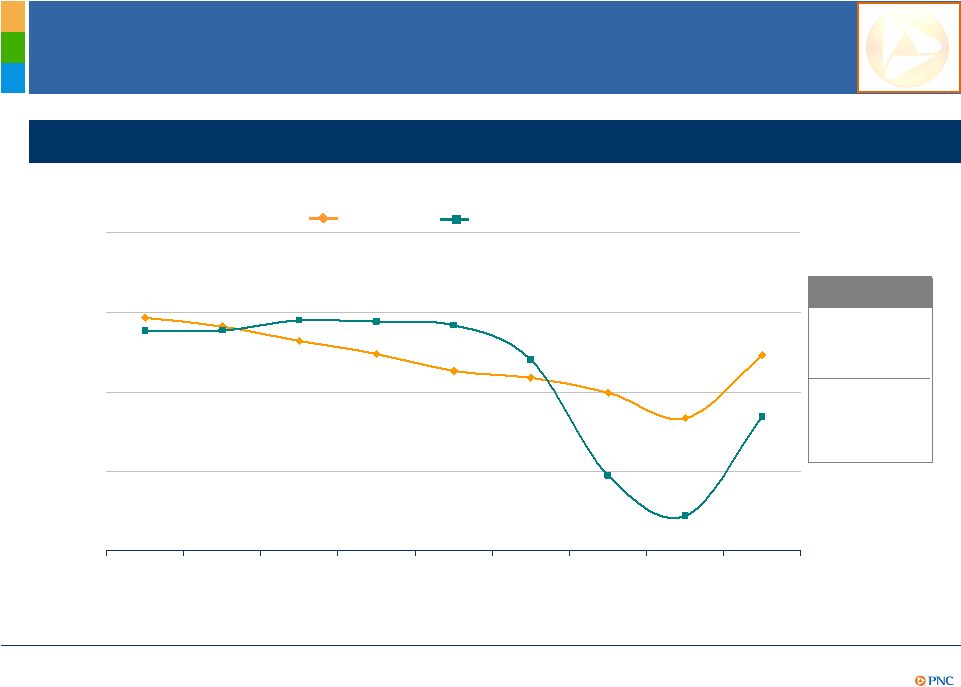 12
Credit
Risk-Adjusted
Net
Interest
Margin
1
Trend
3.43%
3.32%
3.14%
2.97%
2.76%
2.68%
2.96%
2.17%
2.49%3
3.26%
3.27%
3.40%
3.38%
3.33%
2.90%
1.45%
2.18%
0.94%
0.50%
1.50%
2.50%
3.50%
4.50%
2002
2003
2004
2005
2006
2007
2008
2009
2010
PNC
credit
risk-adjusted
margin
1
vs.
Peers
2
PNC
Peers
2
(1)
Net
interest
margin
less
(provision/average
interest-earning
assets).
2010
is
for
the
nine
months
ended
September
30,
annualized.
(2)
Peers
represents
average
of
banks
identified
in
the
Appendix.
Peer
source:
SNL
DataSource.
(3)
Excludes
the
4Q08
conforming
provision
for
credit
losses
of
$504
million
related
to
the
National
City
acquisition
as
average
interest-earning
assets
do
not
reflect
the
National
City
acquisition
because
the
acquisition
closed
on
December
31,
2008.
Other
acquisitions
did
not
similarly
impact
the
ratio.
Including
the
National
City
conforming
provision,
the
credit
risk-adjusted
net
interest
margin
was
2.04%.
Further
information on (1) and (3) is provided in the Appendix.
PNC
2.88%
Average
Peers
2
2.68%
Returning
to a
Moderate
Risk Profile |
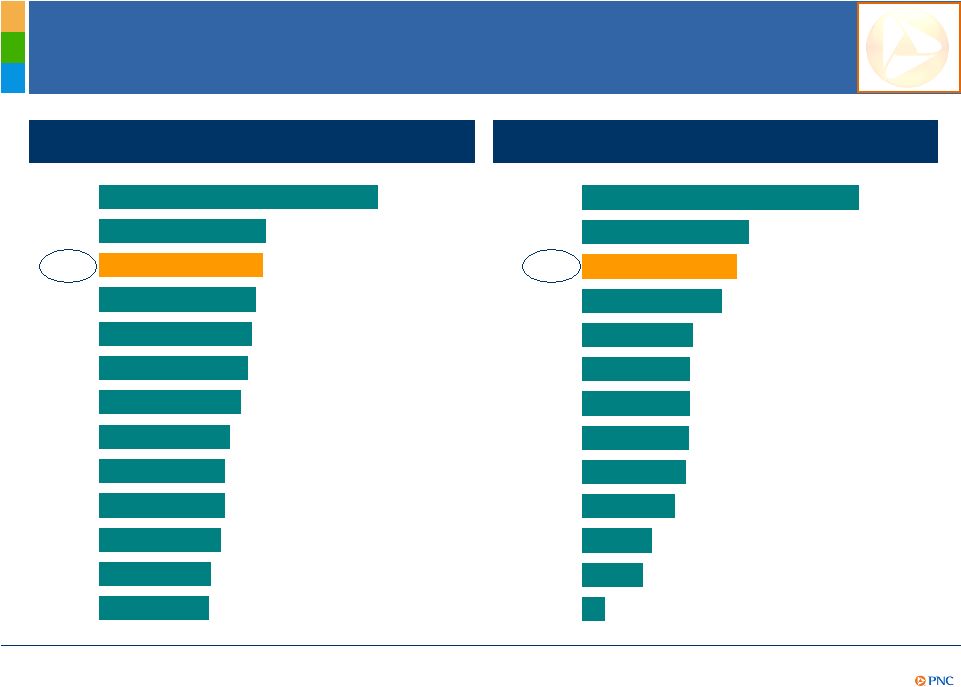
 13
Growing Diversified Fee-Based Revenue Streams
Full
year
2008
noninterest
income
mix
1
Annualized
YTD10
noninterest
income
mix
2
(1)
As
reported
in
our
2008
Form
10-K.
On
Feb.
2,
2010
PNC
entered
into
an
agreement
to
sell
GIS,
which
resulted
in
the
operations
of
GIS
being
presented
as
income
from
discontinued
operations,
net
of
income
taxes,
on
our
Consolidated
Income
Statement
for
prior
periods.
GAAP
2008
noninterest
income
(continuing
operations)
was
$2.442
billion
which
does
not
include
$904
million
of
fund
servicing
revenue
and
$21
million
of
other
noninterest
income
related
to
GIS.
(2)
Total
noninterest
income
(continuing
operations)
for
the
nine
months
ended
Sept.
30,
2010
was
$4.244
billion.
Other
includes
net
gains
on
sales
of
securities,
net
other-
than-temporary
impairments,
and
other.
Further
information
on
(1)
and
(2)
is
provided
in
the
Appendix.
Asset
management
$1,001
Consumer services
$1,252
Corporate
services
$949
Residential
mortgage
$723
Deposit
service
charges
$764
18%
22%
13%
17%
13%
Other
$969
17%
Categories in millions
$5.7
billion
Growing
Fee-based
Revenue
Asset
management
$686
Consumer
services
$623
Corporate
services
$704
Deposit
service
charges
$372
20%
19%
21%
27%
Other $78
2%
Categories in millions
$3.4
billion
Fund
servicing
$904
11% |
 14
Demonstrated Opportunities to Grow
Corporate Services Revenue
2009
2010
Treasury Management
$841
$919
Revenue
1
(1) Consolidated PNC amounts. Not all of these revenues are reflected in
noninterest income. September YTD
Capital Markets
One of the nation's top
treasury management
providers
Excellent source of low cost
deposits
Continued growth in
purchasing cards to
governments
Broadened Healthcare
Advantage offering –
YTD10
revenue up 20% from YTD09
Strong pipeline including
healthcare providers,
agencies and middle market
companies
2009
2010
$346
$411
Revenue
1
September YTD
A leading provider of innovative
investment banking solutions to
the middle market
In terms of deals
-
#2 middle market deal
bookrunner for 2010
-
#4 U.S. real estate
bookrunner
-
#4 U.S. asset-based credit
lead arranger
Harris Williams YTD10 revenue
up $40 million from YTD09
Further growth expected from
strong pipeline
Growing
Fee-based
Revenue |
 15
Demonstrated Opportunities to Grow
Fee-Based Revenue
(1) Consolidated PNC amounts. Includes earnings from our equity investment in
BlackRock. 2009
2010
$639
$751
Revenue
1
September YTD
Asset Management
Asset Management Group
continued to outperform sales
and client acquisition goals
Further growth expected
-
Common platforms
-
Cross-sell initiatives
-
Market driven potential
PNC assets under
administration over $200 billion
at Sept. 30, 2010
PNC assets under management
up 6% linked quarter to $105
billion
Growing
Fee-based
Revenue
2009
2010
$171
$196
Servicing Fees
September YTD
Residential Mortgage
Aligning the business with
PNC’s model
Focused on leveraging the
customer value relationship
with differentiated service
Capturing cross-sell
opportunities with banking
businesses
3Q10 loan origination
volumes up 17% linked
quarter |
 16
A Demonstrated Ability to Grow and
Deepen Relationships
Online banking
2,682
2,968
Online bill payment
753
942
Checking relationships
Growing and retaining checking relationships
Growing
Fee-based
Revenue
Retail active customers
3
(thousands)
3Q09
3Q10
3Q09
3Q10
3Q08
1
3Q09
2
3Q10
+37,000
+43,000
+53,000
(Change during the quarter)
(1) Excludes the impact of the conversion of Sterling Financial Corporation
accounts. (2) Excludes the impact of the required divestitures related to the National City
acquisition. (3) At quarter end. |
 17
Disciplined Expense Management
Highlights
$800
million
captured
in
2009
$900
million
captured
through
3Q10
PNC acquisition-related cost saves
annualized
12/31/08 –
12/31/09
1/1/10 –
9/30/10
Goal
4Q10
$1.8 billion
$1.7 billion
Branch conversions complete
Successfully captured $1.7 billion in
annualized acquisition-related cost
savings through 3Q10, well ahead of our
original target amount and schedule
Focused on implementing continuous
improvement culture across the franchise
Delivering
Shareholder
Value |
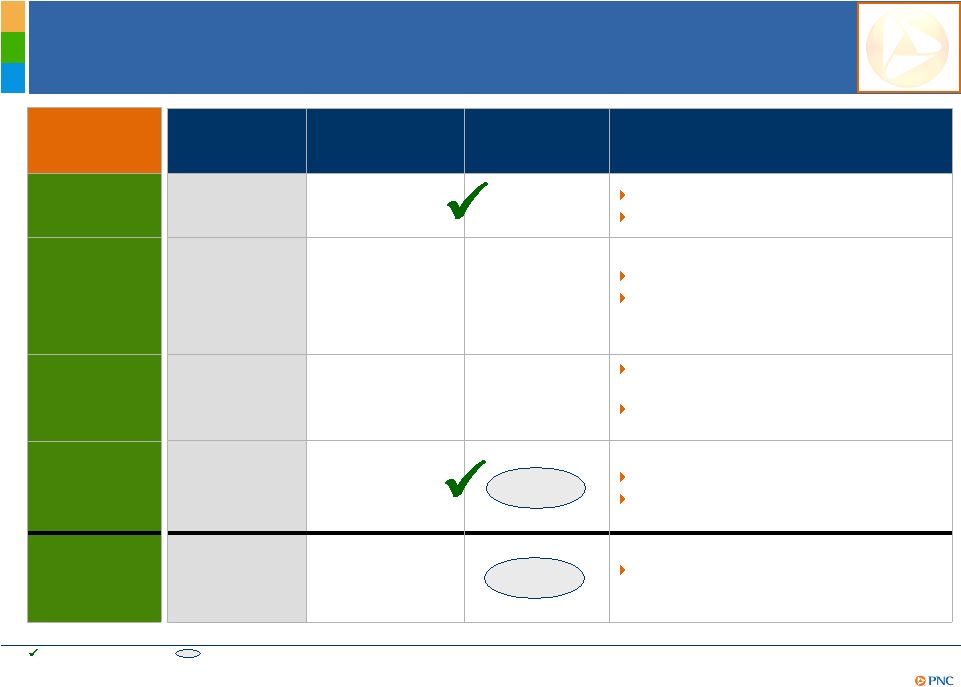 18
PNC’s Framework for Success
Execute on and deliver the PNC business
model
Capitalize on integration opportunities
Emphasize continuous improvement culture
Leverage credit that meets our risk/return
criteria
Focus on cross selling PNC’s deep product
offerings
Focus “front door”
on risk-adjusted returns
Leverage “back door”
credit liquidation
capabilities
Maximize credit portfolio value
Reposition deposit gathering strategies
Action Plans
1.30% reported
1.23% adjusted
1
$1.7 billion
38%
1.78%
84%
Sept. 30, 2010
1.50%+
$1.8 billion
>50%
0.3%-0.5%
80%-90%
Strategic
Objective
Return on
average assets
(nine months ended)
Key Metrics
Loans to
deposits ratio
(as of)
Provision to
average loans
(provision for nine
months ended,
annualized)
Noninterest
income/total
revenue
(nine months ended)
Acquisition-
related cost
savings
(3Q10 annualized run
rate)
Executing our
strategies
PNC Business
Model
Staying core
funded
Returning to a
moderate risk
profile
Growing high
quality, diverse
revenue streams
Creating positive
operating
leverage
=
original
goal
achieved.
=
new
goal
established
in
2Q10;
original
goals
for
annualized
acquisition-related
cost
savings
and
return
on
average
assets
were
$1.2 billion and 1.30%+, respectively. (1) Adjusted for after-tax integration
costs, the after-tax gain on the sale of GIS, and the impact of the accelerated accretion of
the remaining issuance discount in connection with the redemption of our TARP
preferred stock in 1Q10. Further information is provided in the Appendix.
Delivering
Shareholder
Value |
 19
Well Positioned Capital Level to Support Growth
Ratios as of quarter end. Source: Company reports, MTB is estimated.
(1) Estimated.
Sept. 30, 2010 Tier 1 common ratio
PNC’s capital priorities
4.8%
6.4%
7.3%
7.6%
7.6%
8.0%
8.5%
8.6%
9.0%
9.5%
9.6%
10.0%
8.2%
8.0%
PNC
MTB
FITB
RF
USB
STI
WFC
COF
BAC
KEY
BBT
JPM
PNC
CMA
Maintain strong levels
Support our clients
Invest in our
businesses
Basel III clarity
Return capital to
shareholders when
appropriate
Delivering
Shareholder
Value
1 |
 20
A Demonstrated Ability to Achieve
Greater Shareholder Value
Book
value
and
tangible
book
value¹
(1)
Tangible
book
value
per
share
calculated
as
book
value
per
share
less
total
intangible
assets
per
share.
(2)
Peers
represents
average
of
banks
identified
in
the
Appendix.
Source:
SNL
DataSource.
(3)
PNC
believes
that
tangible
book
value,
a
non-GAAP
measure,
is
useful
as
a
tool
to
help
evaluate
the
amount,
on
a
per
share
basis,
of
intangible
assets
included
in
book
value
per
common
share.
Further
information
is
provided
in
the
Appendix.
Delivering
Shareholder
Value
4Q08
3Q10
4Q08
3Q10
4Q08
3Q10
4Q08
3Q10
Book value per share
PNC
Peers
2
Tangible
book
value
per
share
1
PNC
3
Peers
2
$39.44
$55.91
$29.99
$28.98
$13.10
$35.89
$16.85
$18.04 |
 21
Summary
PNC Continues to Build a Great Company.
PNC Continues to Build a Great Company.
We have delivered strong results
We are focused on delivering risk-adjusted revenue
growth
We are committed to delivering shareholder value |
 22
Cautionary Statement Regarding Forward-Looking Information
Appendix
This
presentation
includes
“snapshot”
information
about
PNC
used
by
way
of
illustration
and
is
not
intended
as
a
full
business
or
financial
review.
It
should
not
be
viewed
in
isolation
but
rather
in
the
context
of
all
of
the
information
made
available
by
PNC
in
its
SEC
filings.
We
also
make
statements
in
this
presentation,
and
we
may
from
time
to
time
make
other
statements,
regarding
our
outlook
or
expectations
for
earnings,
revenues,
expenses,
capital
levels,
liquidity
levels,
asset
quality
and/or
other
matters
regarding
or
affecting
PNC
that
are
forward-looking
statements
within
the
meaning
of
the
Private
Securities
Litigation
Reform
Act.
Forward-looking
statements
are
typically
identified
by
words
such
as
“believe,”
“plan,”
“expect,”
“anticipate,”
“intend,”
“outlook,”
“estimate,”
“forecast,”
“will,”
“should,”
“project,”
“goal”
and
other
similar
words
and
expressions.
Forward-looking
statements
are
subject
to
numerous
assumptions,
risks
and
uncertainties,
which
change
over
time.
Forward-looking
statements
speak
only
as
of
the
date
they
are
made.
We
do
not
assume
any
duty
and
do
not
undertake
to
update
our
forward-looking
statements.
Actual
results
or
future
events
could
differ,
possibly
materially,
from
those
that
we
anticipated
in
our
forward-looking
statements,
and
future
results
could
differ
materially
from
our
historical
performance.
Our
forward-looking
statements
are
subject
to
the
following
principal
risks
and
uncertainties.
We
provide
greater
detail
regarding
some
of
these
factors
in
our
2009
Form
10-
K
and
2010
Form
10-Qs,
including
in
the
Risk
Factors
and
Risk
Management
sections
of
those
reports,
and
in
our
subsequent
SEC
filings.
Our
forward-looking
statements
may
also
be
subject
to
other
risks
and
uncertainties,
including
those
that
we
may
discuss
elsewhere
in
this
presentation
or
in
our
filings
with
the
SEC,
accessible
on
the
SEC’s
website
at
www.sec.gov
and
on
or
through
our
corporate
website
at
www.pnc.com/secfilings.
We
have
included
these
web
addresses
as
inactive
textual
references
only.
Information
on
these
websites
is
not
part
of
this
document.
•Our
businesses
and
financial
results
are
affected
by
business
and
economic
conditions,
both
generally
and
specifically
in
the
principal
markets
in
which
we
operate.
In
particular,
our
businesses
and
financial
results
may
be
impacted
by:
o
Changes
in
interest
rates
and
valuations
in
the
debt,
equity
and
other
financial
markets;
o
Disruptions
in
the
liquidity
and
other
functioning
of
financial
markets,
including
such
disruptions
in
the
markets
for
real
estate
and
other
assets
commonly
securing
financial
products;
o
Actions
by
the
Federal
Reserve
and
other
government
agencies,
including
those
that
impact
money
supply
and
market
interest
rates;
o
Changes
in
our
customers’,
suppliers’
and
other
counterparties’
performance
in
general
and
their
creditworthiness
in
particular;
o
A
slowing
or
failure
of
the
moderate
economic
recovery
that
began
last
year;
o
Continued
effects
of
the
aftermath
of
recessionary
conditions
and
the
uneven
spread
of
the
positive
impacts
of
the
recovery
on
the
economy
in
general
and
our
customers
in
particular,
including
adverse
impact
on
loan
utilization
rates
as
well
as
delinquencies,
defaults
and
customer
ability
to
meet
credit
obligations;
o
Changes
in
levels
of
unemployment;
and
o
Changes
in
customer
preferences
and
behavior,
whether
as
a
result
of
changing
business
and
economic
conditions,
climate-related
physical
changes
or
legislative
and
regulatory
initiatives,
or
other
factors.
•A
continuation
of
turbulence
in
significant
portions
of
the
US
and
global
financial
markets,
particularly
if
it
worsens,
could
impact
our
performance,
both
directly
by
affecting
our
revenues
and
the
value
of
our
assets
and
liabilities
and
indirectly
by
affecting
our
counterparties
and
the
economy
generally. |
 23
Cautionary Statement Regarding Forward-Looking Information
(continued)
Appendix
•We
will
be
impacted
by
the
extensive
reforms
enacted
in
the
Dodd-Frank
Wall
Street
Reform
and
Consumer
Protection
Act.
Further,
as
much
of
that
Act
will
require
the
adoption
of
implementing
regulations
by
a
number
of
different
regulatory
bodies,
the
precise
nature,
extent
and
timing
of
many
of
these
reforms
and
the
impact
on
us
is
still
uncertain.
•Financial
industry
restructuring
in
the
current
environment
could
also
impact
our
business
and
financial
performance
as
a
result
of
changes
in
the
creditworthiness
and
performance
of
our
counterparties
and
by
changes
in
the
competitive
and
regulatory
landscape.
•Our
results
depend
on
our
ability
to
manage
current
elevated
levels
of
impaired
assets.
•Given
current
economic
and
financial
market
conditions,
our
forward-looking
financial
statements
are
subject
to
the
risk
that
these
conditions
will
be
substantially
different
than
we
are
currently
expecting.
These
statements
are
based
on
our
current
view
that
the
moderate
economic
recovery
that
began
last
year
will
continue
throughout
the
rest
of
2010
and
slowly
gather
momentum
in
2011
amidst
continued
low
interest
rates.
•Legal
and
regulatory
developments
could
have
an
impact
on
our
ability
to
operate
our
businesses
or
our
financial
condition
or
results
of
operations
or
our
competitive
position
or
reputation.
Reputational
impacts,
in
turn,
could
affect
matters
such
as
business
generation
and
retention,
our
ability
to
attract
and
retain
management,
liquidity,
and
funding.
These
legal
and
regulatory
developments
could
include:
o
Changes
resulting
from
legislative
and
regulatory
responses
to
the
current
economic
and
financial
industry
environment;
o
Other
legislative
and
regulatory
reforms,
including
broad-based
restructuring
of
financial
industry
regulation
as
well
as
changes
to
laws
and
regulations
involving
tax,
pension,
bankruptcy,
consumer
protection,
and
other
aspects
of
the
financial
institution
industry;
o
Unfavorable
resolution
of
legal
proceedings
or
other
claims
and
regulatory
and
other
governmental
investigations
or
other
inquiries.
In
addition
to
matters
relating
to
PNC’s
business
and
activities,
such
matters
may
also
include
proceedings,
claims,
investigations,
or
inquiries
relating
to
pre-acquisition
business
and
activities
of
acquired
companies
such
as
National
City;
o
The
results
of
the
regulatory
examination
and
supervision
process,
including
our
failure
to
satisfy
the
requirements
of
agreements
with
governmental
agencies;
o
Changes
in
accounting
policies
and
principles;
o
Changes
resulting
from
legislative
and
regulatory
initiatives
relating
to
climate
change
that
have
or
may
have
a
negative
impact
on
our
customers’
demand
for
or
use
of
our
products
and
services
in
general
and
their
creditworthiness
in
particular;
and
o
Changes
to
regulations
governing
bank
capital,
including
as
a
result
of
the
so-called
“Basel
3”
initiatives.
•Our
business
and
operating
results
are
affected
by
our
ability
to
identify
and
effectively
manage
risks
inherent
in
our
businesses,
including,
where
appropriate,
through
the
effective
use
of
third-party
insurance,
derivatives,
and
capital
management
techniques,
and
by
our
ability
to
meet
evolving
regulatory
capital
standards.
•The
adequacy
of
our
intellectual
property
protection,
and
the
extent
of
any
costs
associated
with
obtaining
rights
in
intellectual
property
claimed
by
others,
can
impact
our
business
and
operating
results.
•Our
ability
to
anticipate
and
respond
to
technological
changes
can
have
an
impact
on
our
ability
to
respond
to
customer
needs
and
to
meet
competitive
demands.
•Our
ability
to
implement
our
business
initiatives
and
strategies
could
affect
our
financial
performance
over
the
next
several
years.
•Our
expansion
with
our
National
City
acquisition
in
geographic
markets
and
into
business
operations
in
areas
in
which
we
did
not
have
significant
experience
or
presence
prior
to
2009
presents
greater
risks
and
uncertainties
than
were
present
for
us
in
other
recent
acquisitions.
•Competition
can
have
an
impact
on
customer
acquisition,
growth
and
retention,
as
well
as
on
our
credit
spreads
and
product
pricing,
which
can
affect
market
share,
deposits
and
revenues. |
 24
Cautionary Statement Regarding Forward-Looking Information
(continued)
Appendix
•Our
business
and
operating
results
can
also
be
affected
by
widespread
disasters,
terrorist
activities
or
international
hostilities,
either
as
a
result
of
the
impact
on
the
economy
and
capital
and
other
financial
markets
generally
or
on
us
or
on
our
customers,
suppliers
or
other
counterparties
specifically.
•Also,
risks
and
uncertainties
that
could
affect
the
results
anticipated
in
forward-looking
statements
or
from
historical
performance
relating
to
our
equity
interest
in
BlackRock,
Inc.
are
discussed
in
more
detail
in
BlackRock’s
filings
with
the
SEC,
including
in
the
Risk
Factors
sections
of
BlackRock’s
reports.
BlackRock’s
SEC
filings
are
accessible
on
the
SEC’s
website
and
on
or
through
BlackRock’s
website
at
www.blackrock.com.
This
material
is
referenced
for
informational
purposes
only
and
should
not
be
deemed
to
constitute
a
part
of
this
document.
We
grow
our
business
in
part
by
acquiring
from
time
to
time
other
financial
services
companies.
Acquisitions
present
us
with
risks
in
addition
to
those
presented
by
the
nature
of
the
business
acquired.
These
include
risks
and
uncertainties
related
both
to
the
acquisition
transactions
themselves
and
to
the
integration
of
the
acquired
businesses
into
PNC
after
closing.
Acquisitions
may
be
substantially
more
expensive
to
complete
(including
unanticipated
costs
incurred
in
connection
with
the
integration
of
the
acquired
company)
and
the
anticipated
benefits
(including
anticipated
cost
savings
and
strategic
gains)
may
be
significantly
harder
or
take
longer
to
achieve
than
expected.
Acquisitions
may
involve
our
entry
into
new
businesses
or
new
geographic
or
other
markets,
and
these
situations
also
present
risks
resulting
from
our
inexperience
in
those
new
areas.
As
a
regulated
financial
institution,
our
pursuit
of
attractive
acquisition
opportunities
could
be
negatively
impacted
due
to
regulatory
delays
or
other
regulatory
issues.
Regul
atory
and/or
legal
issues
relating
to
the
pre-acquisition
operations
of
an
acquired
business
may
cause
reputational
harm
to
PNC
following
the
acquisition
and
integration
of
the
acquired
business
into
ours
and
may
result
in
additional
future
costs
or
regulatory
limitations
arising
as
a
result
of
those
issues.
Any
annualized,
proforma,
estimated,
third
party
or
consensus
numbers
in
this
presentation
are
used
for
illustrative
or
comparative
purposes
only
and
may
not
reflect
actual
results.
Any
consensus
earnings
estimates
are
calculated
based
on
the
earnings
projections
made
by
analysts
who
cover
that
company.
The
analysts’
opinions,
estimates
or
forecasts
(and
therefore
the
consensus
earnings
estimates)
are
theirs
alone,
are
not
those
of
PNC
or
its
management,
and
may
not
reflect
PNC’s
or
other
company’s
actual
or
anticipated
results. |
 25
Non-GAAP to GAAP Reconcilement
Appendix
In millions except per share data and percentages
Adjustments,
pretax
Income taxes
(benefit)¹
Net income
Net income
attributable to
common
shareholders
Diluted EPS
from net
income
Average
Assets
Return on
Avg. Assets
Net income, diluted EPS, and return on avg. assets, as reported
$1,103
$1,094
$2.07
$264,579
1.65%
Adjustments:
Gain on sale of GIS
$(639)
$311
(328)
(328)
(.62)
Integration costs
96
(34)
62
62
.11
Net income, diluted EPS, and return on avg. assets, as adjusted
$837
$828
$1.56
$264,579
1.27%
In millions except per share data
Adjustments,
pretax
Income taxes
(benefit)¹
Net income
Net income
attributable to
common
shareholders
Diluted EPS
from net
income
Net income and diluted EPS, as reported
$803
$786
$1.47
Adjustment:
Integration costs
$100
($35)
65
65
.13
Net income and diluted EPS, as adjusted
$868
$851
$1.60
In millions except per share data
Adjustments,
pretax
Income taxes
(benefit)¹
Net income
Net income
attributable to
common
shareholders
Diluted EPS
from net
income
Net income and diluted EPS, as reported
$559
$467
$1.00
Adjustment:
Integration costs
$89
($31)
58
58
.12
Net income and diluted EPS, as adjusted
$617
$525
$1.12
For the three months ended September 30, 2010
For the three months ended June 30, 2010
For the three months ended September 30, 2009
PNC believes that information adjusted for the impact of certain items may be useful due to
the extent to which the items are not indicative of our ongoing operations. (1)
Calculated
using
a
marginal
federal
income
tax
rate
of
35%
and
includes
applicable
income
tax
adjustments.
The
after-tax
gain
on
the
sale
of
GIS
also
reflects
the
impact
of state income taxes. |
 26
Non-GAAP to GAAP Reconcilement
Appendix
In millions except per share data and percentages
Adjustments,
pretax
Income taxes
(benefit)¹
Net income
Net income
attributable to
common
shareholders
Diluted EPS
from net
income
Average
Assets
Return on
Avg. Assets
Net income, diluted EPS, and return on avg. assets, as reported
$2,577
$2,213
$4.24
$265,355
1.30%
Adjustments:
Gain on sale of GIS
$(639)
$311
(328)
(328)
(.63)
Integration costs
309
(108)
201
201
.38
TARP preferred stock accelerated discount
accretion² 250
.48
Net income, diluted EPS, and return on avg. assets, as adjusted
$2,450
$2,336
$4.47
$265,355
1.23%
In millions except per share data
Adjustments,
pretax
Income taxes
(benefit)¹
Net income
Net income
attributable to
common
shareholders
Diluted EPS
from net
income
Net income and diluted EPS, as reported
$1,296
$992
$2.17
Adjustment:
Integration costs
$266
($83)
183
183
.40
Net income and diluted EPS, as adjusted
$1,479
$1,175
$2.57
(2) Represents accelerated accretion of the remaining issuance discount on redemption of the
preferred stock in February 2010. (1)
Calculated
using
a
marginal
federal
income
tax
rate
of
35%
and
includes
applicable
income
tax
adjustments.
The
after-tax
gain
on
the
sale
of
GIS
also
reflects
the
impact
of state income taxes.
PNC believes that information adjusted for the impact of certain items may be useful due to
the extent to which the items are not indicative of our ongoing operations. For the
nine months ended September 30, 2010 For the nine months ended September 30,
2009 Average loans
Provision to
average loans
$1,517
$72,744
2.09%
504
$1,013
$72,744
1.39%
PNC believes that information adjusted for the impact of this item may be useful due to the
extent to which the item is not indicative of our ongoing operations and, in the
percentage, as average loans for 2008 do not reflect National City because the acquisition closed on December 31, 2008.
Year ended December 31, 2008 in millions except percentages
Provision for credit losses
Conforming provision - National City
Provision excluding National City conforming provision |
 27
Non-GAAP to GAAP Reconcilement
Appendix
For the three months ended
Sept. 30, 2010
June 30, 2010
Mar. 31, 2010
Dec. 31, 2009
Sept. 30, 2009
In millions except ratio and per share data
Total revenue
$3,598
$3,912
$3,763
$4,886
$3,853
Noninterest expense
2,158
2,002
2,113
2,209
2,214
Pretax pre-provision earnings
$1,440
$1,910
$1,650
$2,677
$1,639
Provision
$486
$823
$751
$1,049
$914
Income from continuing operations before income taxes and
noncontrolling interests (Pretax earnings)
$954
$1,087
$899
$1,628
$725
Pretax pre-provision earnings/provision
3.0
2.3
2.2
2.6
1.8
Gain on BLK/BGI transaction
$1,076
Pretax earnings excluding BLK/BGI gain
$1,601
Pretax pre-provision earnings excluding BLK/BGI gain/provision
1.5
PNC
believes
that
pretax
pre-provision
earnings,
a
non-GAAP
measure,
is
useful
as
a
tool
to
help
evaluate
the
ability
to
provide
for
credit
costs
through
operations,
and
that
information adjusted for the impact of the BLK/BGI gain may be useful due to the extent to
which that item is not indicative of our ongoing operations. For the three months
ended $ in millions
Sept. 30, 2010
June 30, 2010
Mar. 31, 2010
Dec. 31, 2009
Sept. 30, 2009
Net interest margin
3.96%
4.35%
4.24%
4.05%
3.76%
Provision for credit losses
$486
$823
$751
$1,049
$914
Avg. interest-earning assets
$223,677
$224,580
$226,992
$230,998
$235,694
Annualized provision/Avg. interest-earning assets
0.86%
1.47%
1.34%
1.80%
1.54%
Credit risk-adjusted net interest margin (1)
3.10%
2.88%
2.90%
2.25%
2.22%
For the nine months ended
$ in millions
Sept. 30, 2010
Sept. 30, 2009
Net interest margin
4.18%
3.72%
Provision for credit losses
$2,060
$2,881
Avg. interest-earning assets
$225,071
$241,010
Annualized provision/Avg. interest-earning assets
1.22%
1.60%
Credit risk-adjusted net interest margin (1)
2.96%
2.12%
PNC
believes
that
credit
risk-adjusted
net
interest
margin,
a
non-GAAP
measure,
is
useful
as
a
tool
to
help
evaluate
the
amount
of
credit
related
risk
associated with interest-earning assets.
(1) The adjustment represents annualized provision for credit losses divided by average
interest-earning assets. |
 28
Non-GAAP to GAAP Reconcilement
Appendix
$ in millions
2002
2003
2004
2005
2006
2007
2008
2009
Net interest margin
3.99%
3.64%
3.22%
3.00%
2.92%
3.00%
3.37%
3.82%
Provision for credit losses
$309
$177
$52
$21
$124
$315
$1,517
$3,930
Avg. interest-earning assets
$55,345
$55,172
$61,821
$73,001
$77,692
$98,010
$114,484
$238,487
Provision/Avg. interest-earning assets
0.56%
0.32%
0.08%
0.03%
0.16%
0.32%
1.33%
1.65%
Credit risk-adjusted net interest margin (1)
3.43%
3.32%
3.14%
2.97%
2.76%
2.68%
2.04%
2.17%
$504
Adjusted provision for credit losses
$1,013
Avg. interest-earning assets
$114,484
Adjusted provision/Avg. interest-earning assets
0.88%
Adjusted credit risk-adjusted net interest margin (1)
2.49%
For the year ended
(1) The adjustment represents provision for credit losses divided by average
interest-earning assets. Conforming provision - National City
PNC
believes
that
credit
risk-adjusted
net
interest
margin,
a
non-GAAP
measure,
is
useful
as
a
tool
to
help
evaluate
the
amount
of
credit
related
risk
associated
with
interest-earning assets.
Sept. 30, 2010
Sept. 30, 2009
In millions except ratio
Total revenue
$11,273
$11,342
Noninterest expense
6,273
6,864
Pretax pre-provision earnings
$5,000
$4,478
Provision
$2,060
$2,881
Income from continuing operations before income taxes and
noncontrolling interests (Pretax earnings)
$2,940
$1,597
Pretax pre-provision earnings/provision
2.4
1.6
PNC believes that pretax pre-provision
earnings, a non-GAAP measure, is useful as a tool to help evaluate the ability to provide for credit costs through operations.
For the nine months ended |
 29
Non-GAAP to GAAP Reconcilement
Appendix
For the nine months ended
In millions
Sept. 30, 2010
Annualized
Asset management
$751
$1,001
Consumer services
939
1,252
Corporate services
712
949
Residential mortgage
542
723
Service charges on deposits
573
764
Net gains on sales of securities
358
477
Net other-than-temporary impairments
(281)
(375)
Other
650
867
Total other noninterest income
727
969
Total noninterest income (continuing
operations) $4,244
$5,659
For the year ended
GIS excluded from
GAAP
In millions except percentages
Dec. 31, 2008 10-K
% of total
continuing operations
Noninterest income
(continuing operations)
% of total
Fund servicing
$904
27%
($904)
Asset management
686
20%
$686
28%
Consumer services
623
19%
623
26%
Corporate services
704
21%
704
29%
Service charges on deposits
372
11%
372
15%
Net securities losses
(206)
(206)
Other
284
(21)
263
Total other noninterest income
78
2%
(21)
57
2%
Total noninterest income
$3,367
($925)
$2,442
PNC believes the noninterest income composition as set forth in the 2008 10-K is useful as
a tool to illustrate PNC's revenue composition prior to the sale of GIS and the
acquisition of National City. |
 30
Non-GAAP to GAAP Reconcilement
Appendix
In millions except per share data
As of Dec. 31, 2008
As of Sept. 30, 2010
Common shareholders' equity
$17,490
$29,394
Common shares outstanding
443
526
Book value per
common share $39.44
$55.91
Intangible assets
$11,688
$10,518
Common shareholders' equity less intangible assets
$5,802
$18,876
Common shares outstanding
443
526
Tangible book
value per common share $13.10
$35.89
PNC
believes
that
tangible
book
value
per
common
share,
a
non-GAAP
measure,
is
useful
as
a
tool
to
help
evaluate
the
amount,
on
a
per
share
basis,
of
intangible assets included in book value per common share. |
 31
Peer Group of Banks
Appendix
The PNC Financial Services Group, Inc.
PNC
BB&T Corporation
BBT
Bank of America Corporation
BAC
Capital One Financial, Inc.
COF
Comerica Inc.
CMA
Fifth Third Bancorp
FITB
JPMorgan Chase
JPM
KeyCorp
KEY
M&T Bank
MTB
Regions Financial Corporation
RF
SunTrust Banks, Inc.
STI
U.S. Bancorp
USB
Wells Fargo & Co.
WFC
Ticker |