Attached files
Table of Contents
UNITED STATES
SECURITIES AND EXCHANGE COMMISSION
Washington, D.C. 20549
FORM 10-Q
| þ | QUARTERLY REPORT PURSUANT TO SECTION 13 OR 15(d) OF THE SECURITIES EXCHANGE ACT OF 1934 |
For the quarterly period ended September 30, 2010
OR
| ¨ | TRANSITION REPORT PURSUANT TO SECTION 13 OR 15(d) OF THE SECURITIES EXCHANGE ACT OF 1934 |
For the transition period from to
Mirant Americas Generation, LLC
(Exact Name of Registrant as Specified in Its Charter)
Commission File Number: 333-63240
51-0390520 (I.R.S. Employer Identification No.)
Mirant North America, LLC
(Exact Name of Registrant as Specified in Its Charter)
Commission File Number: 333-134722
20-4514609 (I.R.S. Employer Identification No.)
Mirant Mid-Atlantic, LLC
(Exact Name of Registrant as Specified in Its Charter)
Commission File Number: 333-61668
58-2574140 (I.R.S. Employer Identification No.)
Delaware
(State or Other Jurisdiction of Incorporation or Organization of All Registrants)
1155 Perimeter Center West, Suite 100, Atlanta, Georgia 30338
(Address of Principal Executive Offices, Including Zip Code, of All Registrants)
(678) 579-5000
(Registrant’s Telephone Number, Including Area Code)
Indicate by check mark whether the registrant (1) has filed all reports required to be filed by Section 13 or 15(d) of the Securities Exchange Act of 1934 during the preceding 12 months (or for such shorter period that the registrant was required to file such reports), and (2) has been subject to such filing requirements for the past 90 days.
| Mirant Americas Generation, LLC |
þ Yes ¨ No | |||
| Mirant North America, LLC |
þ Yes ¨ No | |||
| Mirant Mid-Atlantic, LLC |
þ Yes ¨ No | |||
Indicate by check mark whether the registrant has submitted electronically and posted on its corporate Web site, if any, every Interactive Data File required to be submitted and posted pursuant to Rule 405 of Regulation S-T (§ 232.405 of this chapter) during the preceding 12 months (or for such shorter period that the registrant was required to submit and post such files).
| Mirant Americas Generation, LLC |
¨ Yes ¨ No | |||
| Mirant North America, LLC |
¨ Yes ¨ No | |||
| Mirant Mid-Atlantic, LLC |
¨ Yes ¨ No | |||
Table of Contents
Indicate by check mark whether the registrant is a large accelerated filer, an accelerated filer, a non-accelerated filer, or a smaller reporting company. See the definitions of “large accelerated filer,” “accelerated filer” and “smaller reporting company” in Rule 12b-2 of the Exchange Act.
| Large Accelerated Filer |
Accelerated Filer | Non-accelerated Filer |
Smaller Reporting Company | |||||
| Mirant Americas Generation, LLC |
¨ | ¨ | þ | ¨ | ||||
| Mirant North America, LLC |
¨ | ¨ | þ | ¨ | ||||
| Mirant Mid-Atlantic, LLC |
¨ | ¨ | þ | ¨ | ||||
Indicate by check mark whether the registrant is a shell company (as defined in Rule 12b-2 of the Exchange Act).
| Mirant Americas Generation, LLC |
¨ Yes þ No | |||
| Mirant North America, LLC |
¨ Yes þ No | |||
| Mirant Mid-Atlantic, LLC |
¨ Yes þ No | |||
Indicate by check mark whether the registrant has filed all documents and reports required to be filed by Section 12, 13 or 15(d) of the Securities Exchange Act of 1934 subsequent to the distribution of securities under a plan confirmed by a court.
| Mirant Americas Generation, LLC |
þ Yes ¨ No | |||
| Mirant North America, LLC |
þ Yes ¨ No | |||
| Mirant Mid-Atlantic, LLC |
þ Yes ¨ No | |||
All of the registrant’s outstanding membership interests are held by its parent and there are no membership interest held by nonaffiliates.
| Registrant |
Parent |
|||||
| Mirant Americas Generation, LLC |
Mirant Americas, Inc. | |||||
| Mirant North America, LLC |
Mirant Americas Generation, LLC | |||||
| Mirant Mid-Atlantic, LLC |
Mirant North America, LLC | |||||
This combined Form 10-Q is separately filed by Mirant Americas Generation, LLC, Mirant North America, LLC and Mirant Mid-Atlantic, LLC. Information contained in this combined Form 10-Q relating to Mirant Americas Generation, LLC, Mirant North America, LLC and Mirant Mid-Atlantic, LLC is filed by such registrant on its own behalf and each registrant makes no representation as to information relating to registrants other than itself.
NOTE: WHEREAS MIRANT AMERICAS GENERATION, LLC, MIRANT NORTH AMERICA, LLC AND MIRANT MID-ATLANTIC, LLC MEET THE CONDITIONS SET FORTH IN GENERAL INSTRUCTION H(1)(a) AND (b) OF FORM 10-Q, THIS COMBINED FORM 10-Q IS BEING FILED WITH THE REDUCED DISCLOSURE FORMAT PURSUANT TO GENERAL INSTRUCTION H(2).
Table of Contents
| Page | ||||||
| i-iii | ||||||
| 4 | ||||||
| PART I—FINANCIAL INFORMATION | ||||||
| Item 1. |
Interim Financial Statements (Unaudited): | |||||
| Mirant Americas Generation, LLC | ||||||
| 7 | ||||||
| 8 | ||||||
| 9 | ||||||
| 10 | ||||||
| Mirant North America, LLC | ||||||
| 11 | ||||||
| 12 | ||||||
| 13 | ||||||
| 14 | ||||||
| Mirant Mid-Atlantic, LLC | ||||||
| 15 | ||||||
| 16 | ||||||
| 17 | ||||||
| 18 | ||||||
| Combined Notes to Condensed Consolidated Financial Statements (Unaudited) |
19 | |||||
| Item 2. |
Management’s Discussion and Analysis of Results of Operations and Financial Condition |
|||||
| 69 | ||||||
| 95 | ||||||
| 106 | ||||||
| Item 3. |
125 | |||||
| Item 4. |
130 | |||||
| PART II—OTHER INFORMATION | ||||||
| Item 1. |
131 | |||||
| Item 1A. |
131 | |||||
| Item 6. |
Exhibits |
|||||
| 132 | ||||||
| 133 | ||||||
| 134 | ||||||
3
Table of Contents
Glossary of Certain Defined Terms
Ancillary Services—Services that ensure reliability and support the transmission of electricity from generation sites to customer loads. Such services include regulation service, reserves and voltage support.
Administrative Services Agreement—Management, personnel and services agreement with Mirant Services, effective January 3, 2006.
APSA—Asset Purchase and Sale Agreement dated June 7, 2000, between Mirant and Pepco.
Bankruptcy Code—United States Bankruptcy Code.
Bankruptcy Court—United States Bankruptcy Court for the Northern District of Texas, Fort Worth Division.
Baseload Generating Units—Units that satisfy minimum baseload requirements of the system and produce electricity at an essentially constant rate and run continuously.
CAIR—Clean Air Interstate Rule.
CAISO—California Independent System Operator.
Cal PX—California Power Exchange.
Clean Air Act—Federal Clean Air Act.
Clean Water Act—Federal Water Pollution Control Act.
CO2—Carbon dioxide.
Companies—Mirant Americas Generation, LLC, Mirant North America, LLC, Mirant Mid-Atlantic, LLC and their subsidiaries.
CPUC—California Public Utilities Commission.
DC Circuit—The United States Court of Appeals for the District of Columbia Circuit.
Dodd-Frank Act—The Dodd-Frank Wall Street Reform and Consumer Protection Act.
DWR—California Department of Water Resources.
EBITDA—Earnings before interest, taxes, depreciation and amortization.
EOB—California Electricity Oversight Board.
EPA—United States Environmental Protection Agency.
EPC—Engineering, procurement and construction.
Exchange Act—Securities Exchange Act of 1934.
Exchange Ratio—Right of Mirant Corporation stockholders to receive 2.835 shares of common stock of RRI Energy, Inc.
FASB—Financial Accounting Standards Board.
FERC—Federal Energy Regulatory Commission.
GAAP—United States generally accepted accounting principles.
GenOn Energy—GenOn Energy, Inc.
GenOn Escrow—GenOn Escrow Corporation.
Gross Margin—Operating revenue less cost of fuel, electricity and other products, excluding depreciation and amortization.
Hart-Scott-Rodino Act—Hart-Scott-Rodino Antitrust Improvements Act of 1976, as amended.
i
Table of Contents
Hudson Valley Gas—Hudson Valley Gas Corporation.
IBEW—International Brotherhood of Electrical Workers.
Intermediate Generating Units—Units that meet system requirements that are greater than baseload and less than peaking.
ISO—Independent System Operator.
LIBOR—London InterBank Offered Rate.
LTSA—Long-term service agreement.
MDE—Maryland Department of the Environment.
Merger Agreement—The agreement and plan of merger into which Mirant Corporation entered with RRI Energy, Inc. and RRI Energy Holdings, Inc. on April 11, 2010.
Mirant—Old Mirant prior to January 3, 2006, and New Mirant on or after January 3, 2006.
Mirant Americas—Mirant Americas, Inc.
Mirant Americas Energy Marketing—Mirant Americas Energy Marketing, LP.
Mirant Bowline—Mirant Bowline, LLC.
Mirant California—Mirant California, LLC.
Mirant Chalk Point—Mirant Chalk Point, LLC.
Mirant Delta—Mirant Delta, LLC.
Mirant Energy Trading—Mirant Energy Trading, LLC.
Mirant Kendall—Mirant Kendall, LLC.
Mirant Lovett—Mirant Lovett, LLC, owner of the former Lovett generating facility, which was shut down on April 19, 2008, and has been demolished.
Mirant Marsh Landing—Mirant Marsh Landing, LLC.
Mirant MD Ash Management—Mirant MD Ash Management, LLC.
Mirant New York—Mirant New York, LLC.
Mirant NY-Gen—Mirant NY-Gen, LLC sold by Mirant North America in the second quarter of 2007.
Mirant Potomac River—Mirant Potomac River, LLC.
Mirant Potrero—Mirant Potrero, LLC.
Mirant Services—Mirant Services, LLC.
MW—Megawatt.
MWh—Megawatt hour.
NAAQS—National ambient air quality standard.
Net Capacity Factor—Actual production of electricity as a percentage of net dependable capacity to produce electricity.
New Mirant—Mirant Corporation on or after January 3, 2006.
NOL—Net operating loss.
NOV—Notice of violation.
ii
Table of Contents
NOx—Nitrogen oxides.
NSR—New source review.
NYISO—New York Independent System Operator.
NYMEX—New York Mercantile Exchange.
Old Mirant—MC 2005, LLC, known as Mirant Corporation prior to January 3, 2006.
OTC—Over-the-Counter.
Ozone Season—The period between May 1 and September 30 of each year.
Peaking Generating Units—Units used to meet demand requirements during the periods of greatest or peak load on the system.
Pepco—Potomac Electric Power Company.
PG&E—Pacific Gas & Electric Company.
PJM—PJM Interconnection, LLC.
Plan—The plan of reorganization that was approved in conjunction with Mirant’s and the Companies’ emergence from bankruptcy protection on January 3, 2006.
Power Sale, Fuel Supply and Services Agreement—Power sale, fuel supply and services agreement with Mirant Americas Energy Marketing, effective January 3, 2006. As of February 1, 2006, the agreement was transferred to Mirant Energy Trading.
PPA—Power purchase agreement.
Reserve Margin—Excess capacity over peak demand.
RGGI—Regional Greenhouse Gas Initiative.
RMR—Reliability-must-run.
RRI Energy—RRI Energy, Inc.
RTO—Regional Transmission Organization.
Scrubbers—Flue gas desulfurization emissions controls.
SO2—Sulfur dioxide.
Spark Spread—The difference between the price received for electricity generated compared to the market price of the natural gas required to produce the electricity.
VaR—Value at risk.
Virginia DEQ—Virginia Department of Environmental Quality.
iii
Table of Contents
CAUTIONARY STATEMENT REGARDING FORWARD-LOOKING INFORMATION
In addition to historical information, the information presented in this combined Form 10-Q includes forward-looking statements within the meaning of Section 27A of the Securities Act of 1933 and Section 21E of the Securities Exchange Act of 1934. These statements involve known and unknown risks and uncertainties and relate to future events, our future financial performance or our projected business results. In some cases, one can identify forward-looking statements by terminology such as “may,” “will,” “should,” “expect,” “intend,” “seek,” “plan,” “think,” “anticipate,” “estimate,” “predict,” “target,” “potential” or “continue” or the negative of these terms or other comparable terminology.
Forward-looking statements are only predictions. Actual events or results may differ materially from any forward-looking statement as a result of various factors, which include:
| • | legislative and regulatory initiatives regarding deregulation, regulation or restructuring of the industry of generating, transmitting and distributing electricity (the “electricity industry”); changes in state, federal and other regulations affecting the electricity industry (including rate and other regulations); changes in, or changes in the application of, environmental and other laws and regulations to which we and our subsidiaries and affiliates are or could become subject; |
| • | failure of our plants to perform as expected, including outages for unscheduled maintenance or repair; |
| • | environmental regulations (including the cumulative effect of many such regulations) that restrict our ability or render it uneconomic to operate our plants, including regulations related to the emission of CO2 and other greenhouse gases; |
| • | increased regulation that limits our access to adequate water supplies and landfill options needed to support power generation or that increases the costs of cooling water and handling, transporting and disposing off-site of ash and other byproducts; |
| • | changes in market conditions, including developments in the supply, demand, volume and pricing of electricity and other commodities in the energy markets, including efforts to reduce demand for electricity and to encourage the development of renewable sources of electricity, and the extent and timing of the entry of additional competition in our markets; |
| • | continued poor economic and financial market conditions, including impacts on financial institutions and other current and potential counterparties, and negative impacts on liquidity in the power and fuel markets in which we hedge and transact; |
| • | increased credit standards, margin requirements, market volatility or other market conditions that could increase our obligations to post collateral beyond amounts that are expected, including additional collateral costs associated with OTC hedging activities as a result of new or proposed rules and regulations governing derivative financial instruments, including those resulting from the Dodd-Frank Act; |
| • | our inability to access effectively the OTC and exchange-based commodity markets or changes in commodity market conditions and liquidity, including as a result of new or proposed rules and regulations governing derivative financial instruments, including those resulting from the Dodd-Frank Act, which may affect our ability to engage in asset management and, for Mirant Americas Generation and Mirant North America, proprietary trading and fuel oil management activities as expected, or result in material gains or losses from open positions; |
| • | deterioration in the financial condition of Mirant Americas Generation’s, Mirant North America’s and Mirant Mid-Atlantic’s counterparties or Mirant Mid-Atlantic’s affiliates and the failure of such parties to pay amounts owed to us or to perform obligations or services due to us beyond collateral posted; |
| • | hazards customary to the power generation industry and the possibility that we may not have adequate insurance to cover losses resulting from such hazards or the inability of our insurers to provide agreed upon coverage; |
4
Table of Contents
| • | the expected timing and likelihood of completion of Mirant’s proposed merger with RRI Energy, including the timing, receipt and terms and conditions of required governmental and regulatory approvals that may reduce anticipated benefits or cause the parties to abandon the merger; the diversion of management’s time and attention from our ongoing business during the time we are seeking to complete the merger; the ability to maintain relationships with employees, customers and suppliers; the ability to integrate successfully the businesses and realize cost savings and any other synergies; and the risk that credit ratings of the combined company or its subsidiaries may be different from what the companies expect; |
| • | price mitigation strategies employed by ISOs or RTOs that reduce our revenue and may result in a failure to compensate our generating units adequately for all of their costs; |
| • | changes in the rules used to calculate capacity, energy and ancillary services payments; |
| • | legal and political challenges to the rules used to calculate capacity, energy and ancillary services payments; |
| • | volatility in our gross margin as a result of our accounting for derivative financial instruments used in our asset management and Mirant Americas Generation’s and Mirant North America’s proprietary trading and fuel oil management activities and volatility in our cash flow from operations resulting from working capital requirements, including collateral, to support our asset management and Mirant Americas Generation’s and Mirant North America’s proprietary trading and fuel oil management activities; |
| • | our ability to enter into intermediate and long-term contracts to sell power or to hedge our expected future generation of power, and to obtain adequate supply and delivery of fuel for our generating facilities, at our required specifications and on terms and prices acceptable to us; |
| • | our failure to utilize new or advancements in power generation technologies; |
| • | the inability of Mirant Americas Generation’s and Mirant North America’s operating subsidiaries to generate sufficient cash flow to support their operations; |
| • | our and our affiliates’ ability to borrow additional funds and access capital markets; |
| • | strikes, union activity or labor unrest; |
| • | our ability to obtain or develop capable leaders and our ability to retain or replace the services of key employees; |
| • | weather and other natural phenomena, including hurricanes and earthquakes; |
| • | the cost and availability of emissions allowances; |
| • | curtailment of operations and reduced prices for electricity resulting from transmission constraints; |
| • | the ability of Mirant Americas Generation and Mirant North America to execute the business plan in California, including entering into new tolling arrangements for their existing generating facilities; |
| • | our relative lack of geographic diversification of revenue sources resulting in concentrated exposure to the Mid-Atlantic market; |
| • | the ability of lenders under Mirant North America’s revolving credit facility to perform their obligations; |
| • | war, terrorist activities, cyberterrorism and inadequate cybersecurity, or the occurrence of a catastrophic loss; |
| • | our failure to provide a safe working environment for our employees and visitors thereby increasing our exposure to additional liability, loss of productive time, other costs and a damaged reputation; |
5
Table of Contents
| • | Mirant Americas Generation’s and Mirant North America’s consolidated indebtedness and the possibility that Mirant Americas Generation, Mirant North America or their subsidiaries may incur additional indebtedness in the future; |
| • | restrictions on the ability of Mirant Americas Generation’s subsidiaries to pay dividends, make distributions or otherwise transfer funds to Mirant Americas Generation, including restrictions on Mirant North America contained in its financing agreements and restrictions on Mirant Mid-Atlantic contained in its leveraged lease documents, which may affect Mirant Americas Generation’s ability to access the cash flows of those subsidiaries to make debt service and other payments; |
| • | restrictions on the ability of Mirant North America’s subsidiaries to pay dividends, make distributions or otherwise transfer funds to Mirant North America, including restrictions on Mirant Mid-Atlantic contained in its leveraged lease documents, which may affect Mirant North America’s ability to access the cash flows of those subsidiaries to make debt service and other payments; |
| • | our failure to comply with or monitor provisions of our loan agreements and debt may lead to a breach and, if not remedied, result in an event of default thereunder, which would limit access to needed capital and damage our reputation and relationships with financial institutions; and |
| • | the disposition of the pending litigation described in this combined Form 10-Q. |
Many of these risks, uncertainties and assumptions are beyond our ability to control or predict. All forward-looking statements attributable to us or persons acting on our behalf are expressly qualified in their entirety by cautionary statements contained throughout this report. Because of these risks, uncertainties and assumptions, you should not place undue reliance on these forward-looking statements. Furthermore, forward-looking statements speak only as of the date they are made.
Factors that Could Affect Future Performance
We undertake no obligation to update publicly or revise any forward-looking statements to reflect events or circumstances that may arise after the date of this report.
In addition to the discussion of certain risks in Management’s Discussion and Analysis of Results of Operations and Financial Condition and the accompanying combined Notes to Mirant Americas Generation, LLC’s, Mirant North America, LLC’s and Mirant Mid-Atlantic, LLC’s unaudited condensed consolidated financial statements, other factors that could affect the Companies’ future performance (business, results of operations or financial condition and cash flows) are set forth in the Companies’ 2009 Annual Report on Form 10-K, our Form 10-Q for the period ended June 30, 2010, Mirant’s Definitive Proxy Statement on Schedule 14A filed on September 15, 2010, and elsewhere in this Form 10-Q and are incorporated herein by reference.
Certain Terms
As used in this report, unless the context requires otherwise, “we,” “us,” “our,” and the “Companies” refer to Mirant Americas Generation, LLC, Mirant North America, LLC, Mirant Mid-Atlantic, LLC and their subsidiaries. In addition, as used in this report, unless the context requires otherwise, “Mirant Americas Generation” refers to Mirant Americas Generation, LLC and its subsidiaries, “Mirant North America” refers to Mirant North America, LLC and its subsidiaries and “Mirant Mid-Atlantic” refers to Mirant Mid-Atlantic, LLC and its subsidiaries.
6
Table of Contents
MIRANT AMERICAS GENERATION, LLC AND SUBSIDIARIES
(Wholly-Owned Indirect Subsidiary of Mirant Corporation)
CONDENSED CONSOLIDATED STATEMENTS OF OPERATIONS (UNAUDITED)
| Three Months Ended September 30, |
Nine Months Ended September 30, |
|||||||||||||||
| 2010 | 2009 | 2010 | 2009 | |||||||||||||
| (in millions) | ||||||||||||||||
| Operating revenues (including unrealized gains (losses) of $154 million, $(193) million, $286 million and $18 million, respectively) |
$ | 775 | $ | 454 | $ | 1,899 | $ | 1,828 | ||||||||
| Cost of fuel, electricity and other products—nonaffiliate (including unrealized losses (gains) of $(13) million, $(19) million, $107 million and $(48) million, respectively) |
245 | 160 | 720 | 577 | ||||||||||||
| Cost of fuel, electricity and other products—affiliate (including unrealized losses (gains) of $0, $0, $0 and $0, respectively) |
2 | 2 | 6 | 6 | ||||||||||||
| Total cost of fuel, electricity and other products |
247 | 162 | 726 | 583 | ||||||||||||
| Gross Margin (excluding depreciation and amortization) |
528 | 292 | 1,173 | 1,245 | ||||||||||||
| Operating Expenses: |
||||||||||||||||
| Operations and maintenance—nonaffiliate |
88 | 77 | 270 | 258 | ||||||||||||
| Operations and maintenance—affiliate |
74 | 73 | 216 | 210 | ||||||||||||
| Depreciation and amortization |
52 | 36 | 151 | 104 | ||||||||||||
| Impairment losses |
— | 14 | — | 14 | ||||||||||||
| Gain on sales of assets, net |
(1 | ) | (3 | ) | (4 | ) | (20 | ) | ||||||||
| Total operating expenses, net |
213 | 197 | 633 | 566 | ||||||||||||
| Operating Income |
315 | 95 | 540 | 679 | ||||||||||||
| Other Expense (Income), net: |
||||||||||||||||
| Interest expense |
51 | 33 | 150 | 105 | ||||||||||||
| Interest income |
— | — | — | (1 | ) | |||||||||||
| Other, net |
(1 | ) | (1 | ) | 1 | — | ||||||||||
| Total other expense, net |
50 | 32 | 151 | 104 | ||||||||||||
| Income Before Income Taxes |
265 | 63 | 389 | 575 | ||||||||||||
| Benefit for income taxes |
(1 | ) | — | (1 | ) | — | ||||||||||
| Net Income |
$ | 266 | $ | 63 | $ | 390 | $ | 575 | ||||||||
The accompanying combined notes are an integral part of these unaudited condensed consolidated financial statements.
7
Table of Contents
MIRANT AMERICAS GENERATION, LLC AND SUBSIDIARIES
(Wholly-Owned Indirect Subsidiary of Mirant Corporation)
CONDENSED CONSOLIDATED BALANCE SHEETS (UNAUDITED)
| At September 30, 2010 |
At December 31, 2009 |
|||||||
| (in millions) | ||||||||
| ASSETS |
||||||||
| Current Assets: |
||||||||
| Cash and cash equivalents |
$ | 537 | $ | 404 | ||||
| Funds on deposit |
205 | 180 | ||||||
| Receivables |
266 | 401 | ||||||
| Derivative contract assets |
2,132 | 1,416 | ||||||
| Inventories |
261 | 241 | ||||||
| Prepaid rent and other payments |
119 | 134 | ||||||
| Total current assets |
3,520 | 2,776 | ||||||
| Property, Plant and Equipment, net |
3,588 | 3,606 | ||||||
| Noncurrent Assets: |
||||||||
| Intangible assets, net |
164 | 171 | ||||||
| Derivative contract assets |
960 | 599 | ||||||
| Prepaid rent |
334 | 304 | ||||||
| Debt issuance costs, net |
23 | 29 | ||||||
| Other |
41 | 32 | ||||||
| Total noncurrent assets |
1,522 | 1,135 | ||||||
| Total Assets |
$ | 8,630 | $ | 7,517 | ||||
| LIABILITIES AND MEMBER’S EQUITY |
||||||||
| Current Liabilities: |
||||||||
| Current portion of long-term debt |
$ | 587 | $ | 74 | ||||
| Accounts payable and accrued liabilities |
544 | 646 | ||||||
| Payable—affiliate |
31 | 42 | ||||||
| Derivative contract liabilities |
1,832 | 1,150 | ||||||
| Other |
21 | 8 | ||||||
| Total current liabilities |
3,015 | 1,920 | ||||||
| Noncurrent Liabilities: |
||||||||
| Long-term debt, net of current portion |
1,973 | 2,556 | ||||||
| Derivative contract liabilities |
379 | 163 | ||||||
| Other |
58 | 49 | ||||||
| Total noncurrent liabilities |
2,410 | 2,768 | ||||||
| Commitments and Contingencies |
||||||||
| Member’s Equity: |
||||||||
| Member’s interest |
3,400 | 3,109 | ||||||
| Preferred stock in affiliate |
(195 | ) | (280 | ) | ||||
| Total member’s equity |
3,205 | 2,829 | ||||||
| Total Liabilities and Member’s Equity |
$ | 8,630 | $ | 7,517 | ||||
The accompanying combined notes are an integral part of these unaudited condensed consolidated financial statements.
8
Table of Contents
MIRANT AMERICAS GENERATION, LLC AND SUBSIDIARIES
(Wholly-Owned Indirect Subsidiary of Mirant Corporation)
CONDENSED CONSOLIDATED STATEMENTS OF MEMBER’S EQUITY (UNAUDITED)
| Member’s Interest |
Preferred Stock in Affiliate |
Total Member’s Equity |
||||||||||
| (in millions) | ||||||||||||
| Balance, December 31, 2009 |
$ | 3,109 | $ | (280 | ) | $ | 2,829 | |||||
| Net income |
390 | — | 390 | |||||||||
| Amortization of discount on preferred stock in affiliate |
10 | (10 | ) | — | ||||||||
| Redemption of preferred stock |
— | 95 | 95 | |||||||||
| Distribution to member |
(109 | ) | — | (109 | ) | |||||||
| Balance, September 30, 2010 |
$ | 3,400 | $ | (195 | ) | $ | 3,205 | |||||
The accompanying combined notes are an integral part of these unaudited condensed consolidated financial statements.
9
Table of Contents
MIRANT AMERICAS GENERATION, LLC AND SUBSIDIARIES
(Wholly-Owned Indirect Subsidiary of Mirant Corporation)
CONDENSED CONSOLIDATED STATEMENTS OF CASH FLOWS (UNAUDITED)
| Nine Months Ended September 30, |
||||||||
| 2010 | 2009 | |||||||
| (in millions) | ||||||||
| Cash Flows from Operating Activities: |
||||||||
| Net income |
$ | 390 | $ | 575 | ||||
| Adjustments to reconcile net income and changes in other operating assets and liabilities to net cash provided by operating activities: |
||||||||
| Depreciation and amortization |
158 | 111 | ||||||
| Impairment losses |
— | 14 | ||||||
| Gain on sales of assets, net |
(4 | ) | (20 | ) | ||||
| Unrealized gains on derivative contracts, net |
(179 | ) | (66 | ) | ||||
| Lower of cost or market inventory adjustments |
22 | 29 | ||||||
| Funds on deposit |
(25 | ) | 21 | |||||
| Changes in other operating assets and liabilities |
59 | 13 | ||||||
| Total adjustments |
31 | 102 | ||||||
| Net cash provided by operating activities |
421 | 677 | ||||||
| Cash Flows from Investing Activities: |
||||||||
| Capital expenditures |
(207 | ) | (500 | ) | ||||
| Proceeds from the sales of assets |
4 | 21 | ||||||
| Net cash used in investing activities |
(203 | ) | (479 | ) | ||||
| Cash Flows from Financing Activities: |
||||||||
| Redemption of preferred stock |
95 | 84 | ||||||
| Repayments of long-term debt |
(71 | ) | (43 | ) | ||||
| Distribution to member |
(109 | ) | — | |||||
| Net cash provided by (used in) financing activities |
(85 | ) | 41 | |||||
| Net Increase in Cash and Cash Equivalents |
133 | 239 | ||||||
| Cash and Cash Equivalents, beginning of period |
404 | 354 | ||||||
| Cash and Cash Equivalents, end of period |
$ | 537 | $ | 593 | ||||
| Supplemental Cash Flow Disclosures: |
||||||||
| Cash paid for interest, net of amounts capitalized |
$ | 94 | $ | 64 | ||||
The accompanying combined notes are an integral part of these unaudited condensed consolidated financial statements.
10
Table of Contents
MIRANT NORTH AMERICA, LLC AND SUBSIDIARIES
(Wholly-Owned Indirect Subsidiary of Mirant Corporation)
CONDENSED CONSOLIDATED STATEMENTS OF OPERATIONS (UNAUDITED)
| Three Months Ended September 30, |
Nine Months Ended September 30, |
|||||||||||||||
| 2010 | 2009 | 2010 | 2009 | |||||||||||||
| (in millions) | ||||||||||||||||
| Operating revenues (including unrealized gains (losses) of $154 million, $(193) million, $286 million and $18 million, respectively) |
$ | 775 | $ | 454 | $ | 1,899 | $ | 1,828 | ||||||||
| Cost of fuel, electricity and other products—nonaffiliate (including unrealized losses (gains) of $(13) million, $(19) million, $107 million and $(48) million, respectively) |
245 | 160 | 720 | 577 | ||||||||||||
| Cost of fuel, electricity and other products—affiliate (including unrealized losses (gains) of $0, $0, $0 and $0, respectively) |
2 | 2 | 6 | 6 | ||||||||||||
| Total cost of fuel, electricity and other products |
247 | 162 | 726 | 583 | ||||||||||||
| Gross Margin (excluding depreciation and amortization) |
528 | 292 | 1,173 | 1,245 | ||||||||||||
| Operating Expenses: |
||||||||||||||||
| Operations and maintenance—nonaffiliate |
88 | 77 | 270 | 258 | ||||||||||||
| Operations and maintenance—affiliate |
74 | 73 | 216 | 210 | ||||||||||||
| Depreciation and amortization |
52 | 36 | 151 | 104 | ||||||||||||
| Impairment losses |
— | 14 | — | 14 | ||||||||||||
| Gain on sales of assets, net |
(1 | ) | (3 | ) | (4 | ) | (20 | ) | ||||||||
| Total operating expenses, net |
213 | 197 | 633 | 566 | ||||||||||||
| Operating Income |
315 | 95 | 540 | 679 | ||||||||||||
| Other Expense (Income), net: |
||||||||||||||||
| Interest expense |
20 | 2 | 59 | 14 | ||||||||||||
| Interest income |
— | — | — | (1 | ) | |||||||||||
| Other, net |
(1 | ) | (1 | ) | 1 | — | ||||||||||
| Total other expense, net |
19 | 1 | 60 | 13 | ||||||||||||
| Income Before Income Taxes |
296 | 94 | 480 | 666 | ||||||||||||
| Benefit for income taxes |
(1 | ) | — | (1 | ) | — | ||||||||||
| Net Income |
$ | 297 | $ | 94 | $ | 481 | $ | 666 | ||||||||
The accompanying combined notes are an integral part of these unaudited condensed consolidated financial statements.
11
Table of Contents
MIRANT NORTH AMERICA, LLC AND SUBSIDIARIES
(Wholly-Owned Indirect Subsidiary of Mirant Corporation)
CONDENSED CONSOLIDATED BALANCE SHEETS (UNAUDITED)
| At September 30, 2010 |
At December 31, 2009 |
|||||||
| (in millions) | ||||||||
| ASSETS |
||||||||
| Current Assets: |
||||||||
| Cash and cash equivalents |
$ | 518 | $ | 403 | ||||
| Funds on deposit |
205 | 180 | ||||||
| Receivables—nonaffiliate |
266 | 401 | ||||||
| Receivables—affiliate |
10 | 9 | ||||||
| Notes receivable—affiliate |
93 | 93 | ||||||
| Derivative contract assets |
2,132 | 1,416 | ||||||
| Inventories |
261 | 241 | ||||||
| Prepaid rent and other payments |
119 | 134 | ||||||
| Total current assets |
3,604 | 2,877 | ||||||
| Property, Plant and Equipment, net |
3,585 | 3,604 | ||||||
| Noncurrent Assets: |
||||||||
| Intangible assets, net |
164 | 171 | ||||||
| Derivative contract assets |
960 | 599 | ||||||
| Prepaid rent |
334 | 304 | ||||||
| Debt issuance costs, net |
17 | 23 | ||||||
| Other |
41 | 32 | ||||||
| Total noncurrent assets |
1,516 | 1,129 | ||||||
| Total Assets |
$ | 8,705 | $ | 7,610 | ||||
| LIABILITIES AND MEMBER’S EQUITY |
||||||||
| Current Liabilities: |
||||||||
| Current portion of long-term debt |
$ | 52 | $ | 74 | ||||
| Accounts payable and accrued liabilities |
490 | 621 | ||||||
| Payable—affiliate |
31 | 42 | ||||||
| Derivative contract liabilities |
1,832 | 1,150 | ||||||
| Other |
21 | 8 | ||||||
| Total current liabilities |
2,426 | 1,895 | ||||||
| Noncurrent Liabilities: |
||||||||
| Long-term debt, net of current portion |
1,125 | 1,174 | ||||||
| Derivative contract liabilities |
379 | 163 | ||||||
| Other |
58 | 49 | ||||||
| Total noncurrent liabilities |
1,562 | 1,386 | ||||||
| Commitments and Contingencies |
||||||||
| Member’s Equity: |
||||||||
| Member’s interest |
4,765 | 4,467 | ||||||
| Preferred stock in affiliate |
(48 | ) | (138 | ) | ||||
| Total member’s equity |
4,717 | 4,329 | ||||||
| Total Liabilities and Member’s Equity |
$ | 8,705 | $ | 7,610 | ||||
The accompanying combined notes are an integral part of these unaudited condensed consolidated financial statements.
12
Table of Contents
MIRANT NORTH AMERICA, LLC AND SUBSIDIARIES
(Wholly-Owned Indirect Subsidiary of Mirant Corporation)
CONDENSED CONSOLIDATED STATEMENTS OF MEMBER’S EQUITY (UNAUDITED)
| Member’s Interest |
Preferred Stock in Affiliate |
Total Member’s Equity |
||||||||||
| (in millions) | ||||||||||||
| Balance, December 31, 2009 |
$ | 4,467 | $ | (138 | ) | $ | 4,329 | |||||
| Net income |
481 | — | 481 | |||||||||
| Amortization of discount on preferred stock in affiliate |
5 | (5 | ) | — | ||||||||
| Redemption of preferred stock |
— | 95 | 95 | |||||||||
| Distribution to member |
(188 | ) | — | (188 | ) | |||||||
| Balance, September 30, 2010 |
$ | 4,765 | $ | (48 | ) | $ | 4,717 | |||||
The accompanying combined notes are an integral part of these unaudited condensed consolidated financial statements.
13
Table of Contents
MIRANT NORTH AMERICA, LLC AND SUBSIDIARIES
(Wholly-Owned Indirect Subsidiary of Mirant Corporation)
CONDENSED CONSOLIDATED STATEMENTS OF CASH FLOWS (UNAUDITED)
| Nine Months Ended September 30, |
||||||||
| 2010 | 2009 | |||||||
| (in millions) | ||||||||
| Cash Flows from Operating Activities: |
||||||||
| Net income |
$ | 481 | $ | 666 | ||||
| Adjustments to reconcile net income and changes in other operating assets and liabilities to net cash provided by operating activities: |
||||||||
| Depreciation and amortization |
157 | 110 | ||||||
| Impairment losses |
— | 14 | ||||||
| Gain on sales of assets, net |
(4 | ) | (20 | ) | ||||
| Unrealized gains on derivative contracts, net |
(179 | ) | (66 | ) | ||||
| Lower of cost or market inventory adjustments |
22 | 29 | ||||||
| Funds on deposit |
(25 | ) | 21 | |||||
| Changes in other operating assets and liabilities |
30 | (16 | ) | |||||
| Total adjustments |
1 | 72 | ||||||
| Net cash provided by operating activities |
482 | 738 | ||||||
| Cash Flows from Investing Activities: |
||||||||
| Capital expenditures |
(207 | ) | (500 | ) | ||||
| Proceeds from the sales of assets |
4 | 21 | ||||||
| Net cash used in investing activities |
(203 | ) | (479 | ) | ||||
| Cash Flows from Financing Activities: |
||||||||
| Redemption of preferred stock |
95 | 84 | ||||||
| Repayments of long-term debt |
(71 | ) | (43 | ) | ||||
| Distribution to member |
(188 | ) | (80 | ) | ||||
| Net cash used in financing activities |
(164 | ) | (39 | ) | ||||
| Net Increase in Cash and Cash Equivalents |
115 | 220 | ||||||
| Cash and Cash Equivalents, beginning of period |
403 | 354 | ||||||
| Cash and Cash Equivalents, end of period |
$ | 518 | $ | 574 | ||||
| Supplemental Cash Flow Disclosures: |
||||||||
| Cash paid for interest, net of amounts capitalized |
$ | 35 | $ | 4 | ||||
The accompanying combined notes are an integral part of these unaudited condensed consolidated financial statements.
14
Table of Contents
MIRANT MID-ATLANTIC, LLC AND SUBSIDIARIES
(Wholly-Owned Indirect Subsidiary of Mirant Corporation)
CONDENSED CONSOLIDATED STATEMENTS OF OPERATIONS (UNAUDITED)
| Three Months Ended September 30, |
Nine Months Ended September 30, |
|||||||||||||||
| 2010 | 2009 | 2010 | 2009 | |||||||||||||
| (in millions) | ||||||||||||||||
| Operating revenues—nonaffiliate (including unrealized gains (losses) of $124 million, $(44) million, $227 million and $101 million, respectively) |
$ | 165 | $ | 27 | $ | 384 | $ | 293 | ||||||||
| Operating revenues—affiliate (including unrealized gains (losses) of $32 million, $(82) million, $62 million and $11 million, respectively) |
488 | 317 | 1,178 | 1,114 | ||||||||||||
| Total operating revenues |
653 | 344 | 1,562 | 1,407 | ||||||||||||
| Cost of fuel, electricity and other products—nonaffiliate (including unrealized losses (gains) of $0, $0, $0 and $0, respectively) |
4 | 5 | 13 | 15 | ||||||||||||
| Cost of fuel, electricity and other products—affiliate (including unrealized losses (gains) of $(23) million, $(2) million, $81 million and $(7) million, respectively) |
178 | 126 | 574 | 415 | ||||||||||||
| Total cost of fuel, electricity and other products |
182 | 131 | 587 | 430 | ||||||||||||
| Gross Margin (excluding depreciation and amortization) |
471 | 213 | 975 | 977 | ||||||||||||
| Operating Expenses: |
||||||||||||||||
| Operations and maintenance—nonaffiliate |
65 | 56 | 200 | 173 | ||||||||||||
| Operations and maintenance—affiliate |
51 | 48 | 146 | 137 | ||||||||||||
| Depreciation and amortization |
36 | 25 | 105 | 73 | ||||||||||||
| Gain on sales of assets, net—affiliate |
— | (2 | ) | (3 | ) | (12 | ) | |||||||||
| Total operating expenses, net |
152 | 127 | 448 | 371 | ||||||||||||
| Operating Income |
319 | 86 | 527 | 606 | ||||||||||||
| Other Expense, net: |
||||||||||||||||
| Interest expense |
1 | — | 2 | 2 | ||||||||||||
| Other, net |
— | — | 1 | — | ||||||||||||
| Total other expense, net |
1 | — | 3 | 2 | ||||||||||||
| Income Before Income Taxes |
318 | 86 | 524 | 604 | ||||||||||||
| Benefit for income taxes |
(1 | ) | — | (1 | ) | — | ||||||||||
| Net Income |
$ | 319 | $ | 86 | $ | 525 | $ | 604 | ||||||||
The accompanying combined notes are an integral part of these unaudited condensed consolidated financial statements.
15
Table of Contents
MIRANT MID-ATLANTIC, LLC AND SUBSIDIARIES
(Wholly-Owned Indirect Subsidiary of Mirant Corporation)
CONDENSED CONSOLIDATED BALANCE SHEETS (UNAUDITED)
| At September 30, 2010 |
At December 31, 2009 |
|||||||
| (in millions) | ||||||||
| ASSETS |
||||||||
| Current Assets: |
||||||||
| Cash and cash equivalents |
$ | 273 | $ | 125 | ||||
| Funds on deposit |
13 | 14 | ||||||
| Receivables—nonaffiliate |
22 | 27 | ||||||
| Receivables—affiliate |
161 | 187 | ||||||
| Derivative contract assets—nonaffiliate |
208 | 155 | ||||||
| Derivative contract assets—affiliate |
481 | 464 | ||||||
| Inventories |
107 | 117 | ||||||
| Prepaid rent |
96 | 96 | ||||||
| Other |
6 | 18 | ||||||
| Total current assets |
1,367 | 1,203 | ||||||
| Property, Plant and Equipment, net |
3,007 | 3,000 | ||||||
| Noncurrent Assets: |
||||||||
| Goodwill, net |
616 | 616 | ||||||
| Other intangible assets, net |
134 | 138 | ||||||
| Derivative contract assets—nonaffiliate |
582 | 399 | ||||||
| Derivative contract assets—affiliate |
162 | 127 | ||||||
| Prepaid rent |
334 | 304 | ||||||
| Other |
20 | 20 | ||||||
| Total noncurrent assets |
1,848 | 1,604 | ||||||
| Total Assets |
$ | 6,222 | $ | 5,807 | ||||
| LIABILITIES AND MEMBER’S EQUITY |
||||||||
| Current Liabilities: |
||||||||
| Current portion of long-term debt |
$ | 4 | $ | 4 | ||||
| Accounts payable and accrued liabilities |
62 | 168 | ||||||
| Payable—affiliate |
116 | 123 | ||||||
| Derivative contract liabilities—nonaffiliate |
19 | 4 | ||||||
| Derivative contract liabilities—affiliate |
391 | 374 | ||||||
| Contract retention liability |
132 | 112 | ||||||
| Other |
9 | 2 | ||||||
| Total current liabilities |
733 | 787 | ||||||
| Noncurrent Liabilities: |
||||||||
| Long-term debt, net of current portion |
18 | 21 | ||||||
| Derivative contract liabilities—nonaffiliate |
7 | 13 | ||||||
| Derivative contract liabilities—affiliate |
138 | 84 | ||||||
| Other |
20 | 16 | ||||||
| Total noncurrent liabilities |
183 | 134 | ||||||
| Commitments and Contingencies |
||||||||
| Member’s Equity: |
||||||||
| Member’s interest |
5,354 | 5,024 | ||||||
| Preferred stock in affiliate |
(48 | ) | (138 | ) | ||||
| Total member’s equity |
5,306 | 4,886 | ||||||
| Total Liabilities and Member’s Equity |
$ | 6,222 | $ | 5,807 | ||||
The accompanying combined notes are an integral part of these unaudited condensed consolidated financial statements.
16
Table of Contents
MIRANT MID-ATLANTIC, LLC AND SUBSIDIARIES
(Wholly-Owned Indirect Subsidiary of Mirant Corporation)
CONDENSED CONSOLIDATED STATEMENTS OF MEMBER’S EQUITY (UNAUDITED)
| Member’s Interest |
Preferred Stock in Affiliate |
Total Member’s Equity |
||||||||||
| (in millions) | ||||||||||||
| Balance, December 31, 2009 |
$ | 5,024 | $ | (138 | ) | $ | 4,886 | |||||
| Net income |
525 | — | 525 | |||||||||
| Amortization of discount on preferred stock in affiliate |
5 | (5 | ) | — | ||||||||
| Redemption of preferred stock |
— | 95 | 95 | |||||||||
| Distribution to member |
(200 | ) | — | (200 | ) | |||||||
| Balance, September 30, 2010 |
$ | 5,354 | $ | (48 | ) | $ | 5,306 | |||||
The accompanying combined notes are an integral part of these unaudited condensed consolidated financial statements.
17
Table of Contents
MIRANT MID-ATLANTIC, LLC AND SUBSIDIARIES
(Wholly-Owned Indirect Subsidiary of Mirant Corporation)
CONDENSED CONSOLIDATED STATEMENTS OF CASH FLOWS (UNAUDITED)
| Nine Months Ended September 30, |
||||||||
| 2010 | 2009 | |||||||
| (in millions) | ||||||||
| Cash Flows from Operating Activities: |
||||||||
| Net income |
$ | 525 | $ | 604 | ||||
| Adjustments to reconcile net income and changes in other operating assets and liabilities to net cash provided by operating activities: |
||||||||
| Depreciation and amortization |
105 | 73 | ||||||
| Gain on sales of assets, net—affiliate |
(3 | ) | (12 | ) | ||||
| Unrealized gains on derivative contracts, net |
(208 | ) | (119 | ) | ||||
| Lower of cost or market inventory adjustments |
13 | 28 | ||||||
| Changes in other operating assets and liabilities |
14 | (45 | ) | |||||
| Total adjustments |
(79 | ) | (75 | ) | ||||
| Net cash provided by operating activities |
446 | 529 | ||||||
| Cash Flows from Investing Activities: |
||||||||
| Capital expenditures |
(194 | ) | (448 | ) | ||||
| Proceeds from the sales of assets |
4 | 12 | ||||||
| Net cash used in investing activities |
(190 | ) | (436 | ) | ||||
| Cash Flows from Financing Activities: |
||||||||
| Redemption of preferred stock |
95 | 84 | ||||||
| Repayment of long-term debt |
(3 | ) | (2 | ) | ||||
| Distribution to member |
(200 | ) | — | |||||
| Net cash provided by (used in) financing activities |
(108 | ) | 82 | |||||
| Net Increase in Cash and Cash Equivalents |
148 | 175 | ||||||
| Cash and Cash Equivalents, beginning of period |
125 | 125 | ||||||
| Cash and Cash Equivalents, end of period |
$ | 273 | $ | 300 | ||||
| Supplemental Cash Flow Disclosures: |
||||||||
| Cash paid for interest |
$ | 1 | $ | 2 | ||||
The accompanying combined notes are an integral part of these unaudited condensed consolidated financial statements.
18
Table of Contents
MIRANT AMERICAS GENERATION, LLC AND SUBSIDIARIES
MIRANT NORTH AMERICA, LLC AND SUBSIDIARIES
MIRANT MID-ATLANTIC, LLC AND SUBSIDIARIES
COMBINED NOTES TO CONDENSED CONSOLIDATED FINANCIAL STATEMENTS (UNAUDITED)
| A. | Description of Business and Accounting and Reporting Policies (Mirant Americas Generation, Mirant North America and Mirant Mid-Atlantic) |
Mirant Americas Generation and Mirant North America are competitive energy companies that produce and sell electricity in the United States. Mirant Americas Generation and Mirant North America own or lease 10,076 MW of net electric generating capacity in the Mid-Atlantic and Northeast regions and in California. Mirant Americas Generation and Mirant North America also operate an integrated asset management and energy marketing organization based in Atlanta, Georgia.
Mirant Mid-Atlantic operates and owns or leases 5,194 MW of net electric generating capacity in the Washington, D.C. area. Mirant Mid-Atlantic’s electric generating capacity is part of the 10,076 MW of net electric generating capacity of Mirant Americas Generation and Mirant North America. Mirant Mid-Atlantic’s generating facilities serve the PJM markets. The PJM ISO operates the largest centrally dispatched control area in the United States.
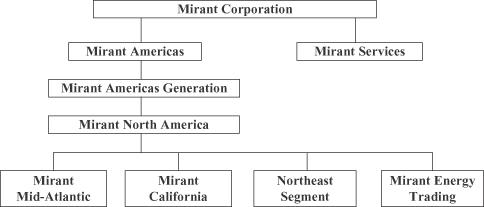
Mirant Americas Generation, Mirant North America and Mirant Mid-Atlantic are Delaware limited liability companies and indirect wholly-owned subsidiaries of Mirant Corporation. Mirant North America is a wholly-owned subsidiary of Mirant Americas Generation. Mirant Mid-Atlantic is a wholly-owned subsidiary of Mirant North America and an indirect wholly-owned subsidiary of Mirant Americas Generation. The chart below is a summary representation of the Companies’ organizational structure and is not a complete organizational chart of Mirant Corporation.
Mirant Americas Generation, Mirant North America and Mirant Mid-Atlantic have a number of service agreements for labor and administrative services with Mirant Services. See Note F for further discussion of arrangements with these related parties.
19
Table of Contents
Mirant’s Proposed Merger with RRI Energy
On April 11, 2010, Mirant entered into the Merger Agreement with RRI Energy and RRI Energy Holdings, Inc. (“Merger Sub”), a direct and wholly-owned subsidiary of RRI Energy. Upon the terms and subject to the conditions set forth in the Merger Agreement, which has been unanimously approved by each of the boards of directors of Mirant and RRI Energy, Merger Sub will merge with and into Mirant, with Mirant continuing as the surviving corporation and a wholly-owned subsidiary of RRI Energy. Mirant and RRI Energy have satisfied many of the conditions to the completion of the merger, including stockholder approval on October 25, 2010, of the proposals related to the merger. Mirant anticipates completing the merger before the end of 2010.
Completion of the merger is subject to each of Mirant and RRI Energy receiving legal opinions that the merger will qualify as a tax-free reorganization under the Internal Revenue Code of 1986, as amended. Under a tax-free reorganization, none of RRI Energy, Merger Sub, Mirant or any of the Mirant stockholders will recognize any gain or loss in the transaction, except that Mirant stockholders will recognize a gain or loss with respect to cash received in lieu of fractional shares of RRI Energy common stock. Pursuant to the Merger Agreement, upon the closing of the merger, each issued and outstanding share of Mirant common stock, including grants of restricted common stock, automatically will be converted into shares of common stock of RRI Energy based on the Exchange Ratio. Additionally, upon the closing of the merger, RRI Energy will be renamed GenOn Energy. Mirant stock options and other equity awards generally will convert upon completion of the merger into stock options and equity awards with respect to RRI Energy common stock, after giving effect to the Exchange Ratio. As a result of the merger, Mirant stockholders will own approximately 54% of the equity of the combined company and RRI Energy stockholders will own approximately 46%.
The primary remaining condition to closing the merger is completion by the Department of Justice (the “DOJ”) of its review and clearance under the Hart-Scott-Rodino Act. On June 14, 2010, Mirant and RRI Energy filed notification of the proposed transaction with the Federal Trade Commission and the DOJ under the Hart-Scott-Rodino Act. On July 15, 2010, Mirant and RRI Energy received a request for additional information from the DOJ, and Mirant has provided the DOJ the information requested and RRI Energy has indicated that it also has done so.
On September 20, 2010, RRI Energy entered into a new senior secured revolving credit facility and a new senior secured term loan. The funding of the term loan facility and the availability of borrowings and letters of credit under the revolving credit facility are subject to the closing of the merger and the satisfaction of the conditions precedent thereto. On October 4, 2010, GenOn Escrow, a wholly-owned subsidiary of Mirant, issued senior notes in an aggregate principal amount of $1.225 billion. Upon issuance, the proceeds of the notes, together with additional funds, were deposited into a segregated escrow account pending the completion of the merger. Upon completion of the merger, and the satisfaction of the conditions precedent thereto, GenOn Escrow will merge with and into RRI Energy and RRI Energy will assume all of GenOn Escrow’s obligations under the notes and the related indenture and the funds held in escrow will be released to RRI Energy. The new GenOn Energy debt financing and revolving credit facility will be used, in part, to discharge and redeem the Mirant North America senior unsecured notes and to repay and terminate the Mirant North America senior secured term loan and revolving credit facility.
The new senior secured revolving credit facility and the new senior secured term loan, and the subsidiary guarantees thereof, will be senior secured obligations of RRI Energy and certain of its existing and future direct and indirect subsidiaries, excluding Mirant Americas Generation; provided, however, that Mirant Americas Generation’s subsidiaries (other than Mirant Mid-Atlantic and Mirant Energy Trading and their subsidiaries) will guarantee the new senior secured revolving credit facility and the new senior secured term loan to the extent permitted under the indenture for the senior notes of Mirant Americas Generation. See Note D for additional information on Mirant North America’s debt subject to refinancing.
Both Mirant and RRI Energy are subject to restrictions on their ability to solicit alternative acquisition proposals, provide information and engage in discussions with third parties, except under limited circumstances
20
Table of Contents
to permit Mirant’s and RRI Energy’s boards of directors to comply with their fiduciary duties. The Merger Agreement contains certain termination rights for both Mirant and RRI Energy, and further provides that, upon termination of the Merger Agreement under specified circumstances, Mirant or RRI Energy may be required to pay the other a termination fee of either $37.15 million or $57.78 million. Further information concerning Mirant’s proposed merger was included in a joint proxy statement/prospectus contained in the registration statement on Form S-4 filed by RRI Energy with the SEC on May 28, 2010, and amended on July 6, 2010, August 12, 2010, September 8, 2010 and September 13, 2010.
Provided neither has experienced an ownership change between December 31, 2009, and the closing date of the merger, each of Mirant and RRI Energy is expected separately to experience an ownership change, as defined in Section (“§”) 382 of the Internal Revenue Code of 1986, on the merger date as a consequence of the merger. Immediately following the merger, Mirant and RRI Energy will be members of the same consolidated federal income tax group. The ability of this consolidated tax group to deduct the pre-merger NOL carry forwards of Mirant and RRI Energy against the post-merger taxable income of the group will be substantially limited as a result of these ownership changes.
Prior to the completion of the merger, Mirant and RRI Energy will continue to operate as independent companies. Except for specific references to Mirant’s proposed merger and the associated debt financing transactions, the disclosures contained in this report on Form 10-Q relate solely to Mirant and the Companies.
Mid-Atlantic Collective Bargaining Agreement
During the second quarter of 2010, Mirant Services entered into a new collective bargaining agreement with the Mid-Atlantic employees represented by IBEW Local 1900. The previous collective bargaining agreement expired on June 1, 2010. The new agreement has a five-year term expiring on June 1, 2015. As part of the new agreement, Mirant Services is required to provide additional retirement contributions through the defined contribution plan currently sponsored by Mirant Services, increases in pay and other benefits. In addition, the new agreement provides for a change to the postretirement healthcare benefit plan covering Mid-Atlantic union employees to eliminate employer-provided healthcare subsidies through a gradual phase-out. The Companies will reimburse Mirant Services for the costs associated with providing the benefits through the Administrative Services Agreement. See Note F for further discussion of arrangements with related parties.
Basis of Presentation
The accompanying unaudited condensed consolidated financial statements of the Companies have been prepared in accordance with GAAP for interim financial information and with the instructions for Form 10-Q and Article 10 of Regulation S-X. Accordingly, they do not include all of the information and footnotes required by GAAP for complete financial statements. In the opinion of management, all adjustments (consisting of normal recurring accruals) considered necessary for a fair presentation have been included. For further information, refer to the consolidated financial statements and notes thereto included in the Companies’ 2009 Annual Report on Form 10-K.
The accompanying unaudited condensed consolidated financial statements include the accounts of the Companies and their wholly-owned subsidiaries. The unaudited condensed consolidated financial statements have been prepared from records maintained by the Companies and their subsidiaries. All significant intercompany accounts and transactions within consolidated entities have been eliminated in consolidation.
The preparation of the unaudited condensed consolidated financial statements in conformity with GAAP requires management to make various estimates and assumptions that affect the reported amounts of assets and liabilities, disclosures of contingent assets and liabilities at the date of the unaudited condensed consolidated financial statements and the reported amounts of revenues and expenses during the period. Actual results could differ from those estimates. Certain prior period amounts have been reclassified to conform to the current period financial statement presentation.
21
Table of Contents
The Companies evaluate events that occur after their balance sheet date but before their financial statements are issued for potential recognition or disclosure. Based on their evaluations, the Companies determined that there were no material subsequent events for recognition or disclosure other than those disclosed herein.
Inventories
Inventories consist primarily of fuel oil, coal, materials and supplies and purchased emissions allowances. Inventory is generally stated at the lower of cost or market value and is expensed on a weighted average cost basis. Fuel inventory is removed from the inventory account as it is used in the generation of electricity or sold to third parties, including in conjunction with Mirant Americas Generation’s and Mirant North America’s fuel oil management activities. Materials and supplies are removed from the inventory account when they are used for repairs, maintenance or capital projects. Purchased emissions allowances are removed from inventory and charged to cost of fuel, electricity and other products in the Companies’ accompanying unaudited condensed consolidated statements of operations as they are utilized for emissions volumes.
Inventories were comprised of the following (in millions):
Mirant Americas Generation and Mirant North America
| At September 30, 2010 |
At December 31, 2009 |
|||||||
| Fuel inventory: |
||||||||
| Fuel oil |
$ | 123 | $ | 99 | ||||
| Coal |
36 | 52 | ||||||
| Other |
1 | 1 | ||||||
| Materials and supplies |
71 | 66 | ||||||
| Purchased emissions allowances |
30 | 23 | ||||||
| Total inventories |
$ | 261 | $ | 241 | ||||
Mirant Mid-Atlantic
| At September 30, 2010 |
At December 31, 2009 |
|||||||
| Fuel inventory: |
||||||||
| Fuel oil |
$ | 22 | $ | 20 | ||||
| Coal |
36 | 52 | ||||||
| Other |
1 | 1 | ||||||
| Materials and supplies |
48 | 43 | ||||||
| Purchased emissions allowances |
— | 1 | ||||||
| Total inventories |
$ | 107 | $ | 117 | ||||
Impairment of Long-Lived Assets
The Companies evaluate long-lived assets, such as property, plant and equipment and purchased intangible assets subject to amortization, for impairment whenever events or changes in circumstances indicate that the carrying amount of the asset may not be recoverable. Such evaluations are performed in accordance with the accounting guidance related to evaluating long-lived assets for impairment. Recoverability of assets to be held and used is measured by a comparison of the carrying amount of an asset to the estimated undiscounted future cash flows expected to be generated by the asset. If the carrying amount of an asset exceeds its estimated undiscounted future cash flows, an impairment charge is recognized as the amount by which the carrying amount of the asset exceeds its fair value. In the second quarter of 2010, the Companies evaluated the Dickerson generating facility for impairment, but did not record an impairment charge. In the third quarter of 2009,
22
Table of Contents
Mirant Americas Generation and Mirant North America evaluated the Potrero generating facility and certain intangible assets related to the Potrero and Contra Costa generating facilities for impairment and recorded a $14 million impairment charge. See Note C for further discussion.
Capitalization of Interest Cost (Mirant Americas Generation and Mirant North America)
Mirant Americas Generation and Mirant North America capitalize interest on projects during their construction period. Mirant Americas Generation and Mirant North America determine which debt instruments represent a reasonable measure of the cost of financing construction in terms of interest costs incurred that otherwise could have been avoided. These debt instruments and associated interest costs are included in the calculation of the weighted average interest rate used for determining the capitalization rate. Once a project is placed in service, capitalized interest, as a component of the total cost of the construction, is depreciated over the estimated useful life of the asset constructed.
For the three and nine months ended September 30, 2010 and 2009, Mirant Americas Generation and Mirant North America incurred the following interest costs on debt to nonaffiliates (in millions):
Mirant Americas Generation
| Three Months Ended September 30, |
Nine Months Ended September 30, |
|||||||||||||||
| 2010 | 2009 | 2010 | 2009 | |||||||||||||
| Total interest costs |
$ | 52 | $ | 53 | $ | 154 | $ | 158 | ||||||||
| Capitalized and included in property, plant and equipment, net |
(1 | ) | (20 | ) | (4 | ) | (53 | ) | ||||||||
| Interest expense |
$ | 51 | $ | 33 | $ | 150 | $ | 105 | ||||||||
The amounts of capitalized interest above include interest accrued. For the three and nine months ended September 30, 2010, cash paid for interest was $2 million and $97 million, respectively, of which $0 and $3 million, respectively, was capitalized. For the three and nine months ended September 30, 2009, cash paid for interest was $3 million and $99 million, respectively, of which $2 million and $35 million, respectively, was capitalized.
Mirant North America
| Three Months Ended September 30, |
Nine Months Ended September 30, |
|||||||||||||||
| 2010 | 2009 | 2010 | 2009 | |||||||||||||
| Total interest costs |
$ | 21 | $ | 22 | $ | 63 | $ | 67 | ||||||||
| Capitalized and included in property, plant and equipment, net |
(1 | ) | (20 | ) | (4 | ) | (53 | ) | ||||||||
| Interest expense |
$ | 20 | $ | 2 | $ | 59 | $ | 14 | ||||||||
The amounts of capitalized interest above include interest accrued. For the three and nine months ended September 30, 2010, cash paid for interest was $2 million and $38 million, respectively, of which $0 and $3 million, respectively, was capitalized. For the three and nine months ended September 30, 2009, cash paid for interest was $2 million and $39 million, respectively, of which $2 million and $35 million, respectively, was capitalized.
Recently Adopted Accounting Guidance
On January 21, 2010, the FASB issued guidance that enhances the disclosures for fair value measurements. The guidance requires the Companies to disclose separately the amount of significant transfers between Level 1
23
Table of Contents
and Level 2 of the fair value hierarchy, the reasons for the significant transfers, the valuation techniques and inputs used and the classes of assets and liabilities accounted for at fair value on a recurring basis. The Companies adopted this accounting guidance for the quarter ended March 31, 2010. See Note B for additional information on fair value measurements.
On February 25, 2010, the FASB issued guidance that amends its requirement for public companies to disclose the date through which the Companies have evaluated subsequent events and whether that date represents the date the financial statements were issued or were available to be issued. The Companies adopted the subsequent event disclosure requirements for the quarter ended March 31, 2010, and the adoption had no effect on the Companies’ unaudited condensed consolidated statements of operations, financial positions or cash flows. The Companies continue to evaluate subsequent events through the date when the financial statements are issued.
New Accounting Guidance Not Yet Adopted at September 30, 2010
On January 21, 2010, the FASB issued guidance that requires a reconciliation for Level 3 fair value measurements, including presenting separately the amounts of purchases, issuances and settlements on a gross basis. The Companies currently disclose the amounts of purchases, issuances and settlements on a net basis within their roll forward of Level 3 fair value measurements in Note B. These disclosure requirements are effective for fiscal years beginning after December 15, 2010. The Companies will present these disclosures in their Form 10-Q for the quarter ended March 31, 2011.
| B. | Financial Instruments (Mirant Americas Generation, Mirant North America and Mirant Mid-Atlantic) |
Derivative Financial Instruments
In connection with the business of generating electricity, the Companies are exposed to energy commodity price risk associated with the acquisition of fuel and emissions allowances needed to generate electricity, the price of electricity produced and sold and the fair value of fuel inventories. In addition, the open positions in Mirant Americas Generation’s and Mirant North America’s trading activities, comprised of proprietary trading and fuel oil management activities, expose them to risks associated with changes in energy commodity prices. The Companies, through their asset management activities, enter into a variety of exchange-traded and OTC energy and energy-related derivative financial instruments, such as forward contracts, futures contracts, option contracts and financial swap agreements to manage exposure to commodity price risks. These contracts have varying terms and durations, which range from a few days to years, depending on the instrument. Mirant Americas Generation’s and Mirant North America’s proprietary trading activities also utilize similar derivative financial instruments in markets where they have a physical presence to attempt to generate incremental gross margin. Mirant Americas Generation’s and Mirant North America’s fuel oil management activities use derivative financial instruments to hedge economically the fair value of their physical fuel oil inventories, optimize the approximately three million barrels of storage capacity that they own or lease, as well as attempt to profit from market opportunities related to timing and/or differences in the pricing of various products.
Changes in the fair value and settlements of derivative financial instruments used to hedge electricity economically are reflected in operating revenue, and changes in the fair value and settlements of derivative financial instruments used to hedge fuel economically are reflected in cost of fuel, electricity and other products in the accompanying unaudited condensed consolidated statements of operations.
Changes in the fair value and settlements of Mirant Americas Generation’s and Mirant North America’s derivative contracts for trading activities, comprised of proprietary trading and fuel oil management, are recorded on a net basis as operating revenue in the accompanying unaudited condensed consolidated statements of operations.
24
Table of Contents
In May 2010, the Companies concluded that they could no longer assert that physical delivery is probable for many of their coal agreements. The conclusion was based on expected generation levels, changes observed in the coal markets and substantial progress in the construction of their coal blending facility at the Morgantown generating facility that will allow for greater flexibility of their coal supply. Because the Companies can no longer assert that physical delivery of coal from these agreements is probable, they are required to apply fair value accounting for these contracts in the current period and prospectively.
As of September 30, 2010, the Companies do not have any derivative financial instruments for which hedge accounting has been elected, and option contracts comprise less than 1% of the Companies’ net derivative contract assets.
The Companies also consider risks associated with interest rates, counterparty credit and Mirant Americas Generation’s, Mirant North America’s and Mirant Mid-Atlantic’s own non-performance risk when valuing their derivative financial instruments. The nominal value of the derivative contract assets and liabilities is discounted to account for time value using a LIBOR forward interest rate curve based on the tenor of the Companies’ transactions being valued.
Mirant Americas Generation and Mirant North America
The following table presents the fair value of each class of derivative financial instruments related to commodity price risk (in millions):
| Fair Value at | ||||||||||
| Commodity Derivative Contracts |
Balance Sheet Location |
September 30, 2010 |
December 31, 2009 |
|||||||
| Asset management: |
||||||||||
| Power |
Derivative contract assets |
$ | 1,453 | $ | 1,178 | |||||
| Fuel |
Derivative contract assets |
41 | 26 | |||||||
| Total asset management |
1,494 | 1,204 | ||||||||
| Trading activities |
Derivative contract assets |
1,598 | 811 | |||||||
| Total derivative contract assets |
3,092 | 2,015 | ||||||||
| Asset management: |
||||||||||
| Power |
Derivative contract liabilities |
(471 | ) | (488 | ) | |||||
| Fuel |
Derivative contract liabilities |
(137 | ) | (15 | ) | |||||
| Total asset management |
(608 | ) | (503 | ) | ||||||
| Trading activities |
Derivative contract liabilities |
(1,603 | ) | (810 | ) | |||||
| Total derivative contract liabilities |
(2,211 | ) | (1,313 | ) | ||||||
| Asset management, net: |
||||||||||
| Power |
982 | 690 | ||||||||
| Fuel |
(96 | ) | 11 | |||||||
| Total asset management |
886 | 701 | ||||||||
| Trading activities, net |
(5 | ) | 1 | |||||||
| Total derivative contracts, net |
$ | 881 | $ | 702 | ||||||
25
Table of Contents
The following tables present the net gains (losses) for derivative financial instruments recognized in income in the unaudited condensed consolidated statements of operations (in millions):
| Commodity Derivative Contracts |
Location of Net Gains (Losses) |
Amount of Net Gains (Losses) Recognized in Income for the Three Months Ended |
||||||||||||||||||||||||
| September 30, 2010 | September 30, 2009 | |||||||||||||||||||||||||
| Realized1 | Unrealized | Total | Realized1 | Unrealized | Total | |||||||||||||||||||||
| Asset management |
Operating revenues | $ | 54 | $ | 164 | $ | 218 | $ | 292 | $ | (169 | ) | $ | 123 | ||||||||||||
| Trading activities |
Operating revenues | — | (10 | ) | (10 | ) | 32 | (24 | ) | 8 | ||||||||||||||||
| Asset management |
Cost of fuel, electricity and other products | (69 | ) | 13 | (56 | ) | (25 | ) | 19 | (6 | ) | |||||||||||||||
| Total |
$ | (15 | ) | $ | 167 | $ | 152 | $ | 299 | $ | (174 | ) | $ | 125 | ||||||||||||
| Commodity Derivative Contracts |
Location of Net Gains (Losses) |
Amount of Net Gains (Losses) Recognized in Income for the Nine Months Ended |
||||||||||||||||||||||||
| September 30, 2010 | September 30, 2009 | |||||||||||||||||||||||||
| Realized1 | Unrealized | Total | Realized1 | Unrealized | Total | |||||||||||||||||||||
| Asset management |
Operating revenues | $ | 230 | $ | 299 | $ | 529 | $ | 619 | $ | 91 | $ | 710 | |||||||||||||
| Trading activities |
Operating revenues | (2 | ) | (13 | ) | (15 | ) | 106 | (73 | ) | 33 | |||||||||||||||
| Asset management |
Cost of fuel, electricity and other products | (95 | ) | (107 | ) | (202 | ) | (69 | ) | 48 | (21 | ) | ||||||||||||||
| Total |
$ | 133 | $ | 179 | $ | 312 | $ | 656 | $ | 66 | $ | 722 | ||||||||||||||
| 1 | Represents the total cash settlements of derivative financial instruments during each quarterly reporting period that existed at the beginning of each quarterly reporting period. |
The following table presents the notional quantity on long (short) positions for derivative financial instruments on a gross and net basis at September 30, 2010 (in equivalent MWh in millions):
| Notional Quantity | ||||||||||||
| Derivative Contract Assets |
Derivative Contract Liabilities |
Net Derivative Contracts |
||||||||||
| Commodity Type: |
||||||||||||
|
Power1 |
(141 | ) | 104 | (37 | ) | |||||||
| Natural gas |
(79 | ) | 80 | 1 | ||||||||
| Fuel oil |
2 | (3 | ) | (1 | ) | |||||||
| Coal |
11 | 8 | 19 | |||||||||
| Total |
(207 | ) | 189 | (18 | ) | |||||||
| 1 | Includes MWh equivalent of natural gas transactions used to hedge power economically. |
26
Table of Contents
Mirant Mid-Atlantic
The following table presents the fair value of each class of derivative financial instruments related to commodity price risk (in millions):
| Commodity Derivative Contracts |
Balance Sheet Location |
Fair Value at | ||||||||
| September 30, 2010 |
December 31, 2009 |
|||||||||
| Asset management—nonaffiliate: |
||||||||||
| Power |
Derivative contract assets | $ | 790 | $ | 554 | |||||
| Fuel |
Derivative contract assets | — | — | |||||||
| Asset management—affiliate: |
||||||||||
| Power |
Derivative contract assets | 611 | 584 | |||||||
| Fuel |
Derivative contract assets | 32 | 7 | |||||||
| Total derivative contract assets |
1,433 | 1,145 | ||||||||
| Asset management—nonaffiliate: |
||||||||||
| Power |
Derivative contract liabilities | (26 | ) | (17 | ) | |||||
| Fuel |
Derivative contract liabilities | — | — | |||||||
| Asset management—affiliate: |
||||||||||
| Power |
Derivative contract liabilities | (423 | ) | (457 | ) | |||||
| Fuel |
Derivative contract liabilities | (106 | ) | (1 | ) | |||||
| Total derivative contract liabilities |
(555 | ) | (475 | ) | ||||||
| Asset management—nonaffiliate, net: |
||||||||||
| Power |
764 | 537 | ||||||||
| Fuel |
— | — | ||||||||
| Asset management—affiliate, net: |
||||||||||
| Power |
188 | 127 | ||||||||
| Fuel |
(74 | ) | 6 | |||||||
| Total derivative contracts, net |
$ | 878 | $ | 670 | ||||||
The following tables present the net gains (losses) for derivative financial instruments recognized in income in the unaudited condensed consolidated statements of operations (in millions):
| Commodity Derivative Contracts |
Location of Net Gains (Losses) |
Amount of Net Gains
(Losses) Recognized in Income for the Three Months Ended |
||||||||||||||||||||||||
| September 30, 2010 | September 30, 2009 | |||||||||||||||||||||||||
| Realized1 | Unrealized | Total | Realized1 | Unrealized | Total | |||||||||||||||||||||
| Asset management |
Operating revenues | $ | 54 | $ | 156 | $ | 210 | $ | 241 | $ | (126 | ) | $ | 115 | ||||||||||||
| Asset management |
Cost of fuel, electricity and other products | (58 | ) | 23 | (35 | ) | (1 | ) | 2 | 1 | ||||||||||||||||
| Total |
$ | (4 | ) | $ | 179 | $ | 175 | $ | 240 | $ | (124 | ) | $ | 116 | ||||||||||||
| Commodity Derivative Contracts |
Location of Net Gains (Losses) |
Amount of Net Gains
(Losses) Recognized in Income for the Nine Months Ended |
||||||||||||||||||||||||
| September 30, 2010 | September 30, 2009 | |||||||||||||||||||||||||
| Realized1 | Unrealized | Total | Realized1 | Unrealized | Total | |||||||||||||||||||||
| Asset management |
Operating revenues | $ | 215 | $ | 289 | $ | 504 | $ | 524 | $ | 112 | $ | 636 | |||||||||||||
| Asset management |
Cost of fuel, electricity and other products | (62 | ) | (81 | ) | (143 | ) | 3 | 7 | 10 | ||||||||||||||||
| Total |
$ | 153 | $ | 208 | $ | 361 | $ | 527 | $ | 119 | $ | 646 | ||||||||||||||
| 1 | Represents the total cash settlements of derivative financial instruments during each quarterly reporting period that existed at the beginning of each quarterly reporting period. |
27
Table of Contents
The following table presents the notional quantity on long (short) positions for derivative financial instruments on a gross and net basis at September 30, 2010 (in equivalent MWh in millions):
| Notional Quantity | ||||||||||||
| Derivative Contract Assets |
Derivative Contract Liabilities |
Net Derivative Contracts |
||||||||||
| Commodity Type: |
||||||||||||
|
Power1 |
(69 | ) | 32 | (37 | ) | |||||||
| Coal |
8 | 11 | 19 | |||||||||
| Total |
(61 | ) | 43 | (18 | ) | |||||||
| 1 | Includes MWh equivalent of natural gas transactions used to hedge power economically. |
Fair Value Hierarchy
Based on the observability of the inputs used in the valuation techniques for fair value measurement, the Companies are required to classify recorded fair value measurements according to the fair value hierarchy. The fair value hierarchy ranks the quality and reliability of the information used to determine fair values. The hierarchy gives the highest priority to unadjusted quoted prices in active markets for identical assets or liabilities (Level 1 measurement) and the lowest priority to unobservable inputs (Level 3 measurement). The fair value measurement inputs the Companies use vary from readily observable prices for exchange-traded instruments to price curves that cannot be validated through external pricing sources. The Companies’ financial assets and liabilities carried at fair value in the unaudited condensed consolidated financial statements are classified in three categories based on the inputs used.
In certain cases, the inputs used to measure fair value may fall into different levels of the fair value hierarchy. In such cases, the level in the fair value hierarchy within which the fair value measurement in its entirety falls must be determined based on the lowest level input that is significant to the fair value measurement. The Companies’ assessment of the significance of a particular input to the fair value measurement in its entirety requires judgment and consideration of factors specific to the asset or liability.
The Companies’ transactions in Level 1 of the fair value hierarchy primarily consist of natural gas and crude oil futures traded on the NYMEX and swaps cleared against the NYMEX prices. The Companies’ transactions in Level 2 of the fair value hierarchy primarily include non-exchange-traded derivatives such as OTC forwards, swaps and options. The Companies did not have any transfers between Levels 1 and 2 for the three and nine months ended September 30, 2010. The Companies’ transactions in Level 3 of the fair value hierarchy primarily consist of coal agreements and financial power swaps in less liquid locations. As described earlier in this Note, the Companies were required to apply fair value accounting for many of their coal agreements beginning in May 2010. The fair value of these agreements is reflected in Level 3 of the fair value hierarchy as of September 30, 2010.
The following tables set forth by level within the fair value hierarchy the Companies’ financial assets and liabilities that were accounted for at fair value on a recurring basis, by class and tenor, respectively. At September 30, 2010, the Companies’ only financial assets and liabilities recognized at fair value on a recurring basis are derivative financial instruments.
28
Table of Contents
Mirant Americas Generation and Mirant North America
The following table presents financial assets and liabilities accounted for at fair value on a recurring basis as of September 30, 2010, on a gross and net basis by class (in millions):
| Quoted Prices in Active Markets for Identical Assets (Level 1) |
Significant Other Observable Inputs (Level 2) |
Significant Other Unobservable Inputs (Level 3) |
Total | |||||||||||||
| Assets: |
||||||||||||||||
| Commodity contracts—asset management: |
||||||||||||||||
| Power |
$ | 2 | $ | 1,438 | $ | 13 | $ | 1,453 | ||||||||
| Fuel |
7 | 3 | 31 | 41 | ||||||||||||
| Total commodity contracts—asset management |
9 | 1,441 | 44 | 1,494 | ||||||||||||
| Commodity contracts—trading activities |
978 | 594 | 26 | 1,598 | ||||||||||||
| Total derivative contract assets |
987 | 2,035 | 70 | 3,092 | ||||||||||||
| Liabilities: |
||||||||||||||||
| Commodity contracts—asset management: |
||||||||||||||||
| Power |
(27 | ) | (439 | ) | (5 | ) | (471 | ) | ||||||||
| Fuel |
(29 | ) | (1 | ) | (107 | ) | (137 | ) | ||||||||
| Total commodity contracts—asset management |
(56 | ) | (440 | ) | (112 | ) | (608 | ) | ||||||||
| Commodity contracts—trading activities |
(974 | ) | (621 | ) | (8 | ) | (1,603 | ) | ||||||||
| Total derivative contract liabilities |
(1,030 | ) | (1,061 | ) | (120 | ) | (2,211 | ) | ||||||||
| Net: |
||||||||||||||||
| Commodity contracts—asset management: |
||||||||||||||||
| Power |
(25 | ) | 999 | 8 | 982 | |||||||||||
| Fuel |
(22 | ) | 2 | (76 | ) | (96 | ) | |||||||||
| Total commodity contracts—asset management |
(47 | ) | 1,001 | (68 | ) | 886 | ||||||||||
| Commodity contracts—trading activities, net |
4 | (27 | ) | 18 | (5 | ) | ||||||||||
| Total derivative contract assets and liabilities, net |
$ | (43 | ) | $ | 974 | $ | (50 | ) | $ | 881 | ||||||
29
Table of Contents
The following table presents financial assets and liabilities accounted for at fair value on a recurring basis as of December 31, 2009, on a gross and net basis by class (in millions):
| Quoted Prices in Active Markets for Identical Assets (Level 1) |
Significant Other Observable Inputs (Level 2) |
Significant Other Unobservable Inputs (Level 3) |
Total | |||||||||||||
| Assets: |
||||||||||||||||
| Commodity contracts—asset management: |
||||||||||||||||
| Power |
$ | 2 | $ | 1,162 | $ | 14 | $ | 1,178 | ||||||||
| Fuel |
11 | 8 | 7 | 26 | ||||||||||||
| Total commodity contracts—asset management |
13 | 1,170 | 21 | 1,204 | ||||||||||||
| Commodity contracts—trading activities |
374 | 415 | 22 | 811 | ||||||||||||
| Total derivative contract assets |
387 | 1,585 | 43 | 2,015 | ||||||||||||
| Liabilities: |
||||||||||||||||
| Commodity contracts—asset management: |
||||||||||||||||
| Power |
(11 | ) | (475 | ) | (2 | ) | (488 | ) | ||||||||
| Fuel |
(14 | ) | (1 | ) | — | (15 | ) | |||||||||
| Total commodity contracts—asset management |
(25 | ) | (476 | ) | (2 | ) | (503 | ) | ||||||||
| Commodity contracts—trading activities |
(368 | ) | (433 | ) | (9 | ) | (810 | ) | ||||||||
| Total derivative contract liabilities |
(393 | ) | (909 | ) | (11 | ) | (1,313 | ) | ||||||||
| Net: |
||||||||||||||||
| Commodity contracts—asset management: |
||||||||||||||||
| Power |
(9 | ) | 687 | 12 | 690 | |||||||||||
| Fuel |
(3 | ) | 7 | 7 | 11 | |||||||||||
| Total commodity contracts—asset management |
(12 | ) | 694 | 19 | 701 | |||||||||||
| Commodity contracts—trading activities, net |
6 | (18 | ) | 13 | 1 | |||||||||||
| Total derivative contract assets and liabilities, net |
$ | (6 | ) | $ | 676 | $ | 32 | $ | 702 | |||||||
The following table presents net financial assets and liabilities accounted for at fair value on a recurring basis as of September 30, 2010, by tenor (in millions):
| Commodity Contracts | ||||||||||||
| Asset Management |
Trading Activities |
Total | ||||||||||
| Remainder of 2010 |
$ | 107 | $ | (13 | ) | $ | 94 | |||||
| 2011 |
228 | 12 | 240 | |||||||||
| 2012 |
167 | (4 | ) | 163 | ||||||||
| 2013 |
185 | — | 185 | |||||||||
| 2014 |
199 | — | 199 | |||||||||
| Thereafter |
— | — | — | |||||||||
| Total |
$ | 886 | $ | (5 | ) | $ | 881 | |||||
The volumetric weighted average maturity, or weighted average tenor, of the asset management derivative contract portfolio at September 30, 2010 and December 31, 2009, was approximately 18 months and 22 months, respectively. The volumetric weighted average maturity, or weighted average tenor, of the trading derivative contract portfolio at September 30, 2010 and December 31, 2009, was approximately 8 months and 9 months, respectively.
30
Table of Contents
Mirant Mid-Atlantic
The following table presents financial assets and liabilities accounted for at fair value on a recurring basis as of September 30, 2010, on a gross and net basis by class (in millions):
| Quoted Prices in Active Markets for Identical Assets (Level 1) |
Significant Other Observable Inputs (Level 2) |
Significant Other Unobservable Inputs (Level 3) |
Total | |||||||||||||
| Assets: |
||||||||||||||||
| Commodity contracts—asset management: |
||||||||||||||||
| Power |
$ | 2 | $ | 1,397 | $ | 2 | $ | 1,401 | ||||||||
| Fuel |
— | 1 | 31 | 32 | ||||||||||||
| Total derivative contract assets |
2 | 1,398 | 33 | 1,433 | ||||||||||||
| Liabilities: |
||||||||||||||||
| Commodity contracts—asset management: |
||||||||||||||||
| Power |
(27 | ) | (419 | ) | (3 | ) | (449 | ) | ||||||||
| Fuel |
— | — | (106 | ) | (106 | ) | ||||||||||
| Total derivative contract liabilities |
(27 | ) | (419 | ) | (109 | ) | (555 | ) | ||||||||
| Net: |
||||||||||||||||
| Commodity contracts—asset management: |
||||||||||||||||
| Power |
(25 | ) | 978 | (1 | ) | 952 | ||||||||||
| Fuel |
— | 1 | (75 | ) | (74 | ) | ||||||||||
| Total derivative contract assets and liabilities, net |
$ | (25 | ) | $ | 979 | $ | (76 | ) | $ | 878 | ||||||
The following table presents financial assets and liabilities accounted for at fair value on a recurring basis as of December 31, 2009, on a gross and net basis by class (in millions):
| Quoted Prices in Active Markets for Identical Assets (Level 1) |
Significant Other Observable Inputs (Level 2) |
Significant Other Unobservable Inputs (Level 3) |
Total | |||||||||||||
| Assets: |
||||||||||||||||
| Commodity contracts—asset management: |
||||||||||||||||
| Power |
$ | 2 | $ | 1,130 | $ | 6 | $ | 1,138 | ||||||||
| Fuel |
— | — | 7 | 7 | ||||||||||||
| Total derivative contract assets |
2 | 1,130 | 13 | 1,145 | ||||||||||||
| Liabilities: |
||||||||||||||||
| Commodity contracts—asset management: |
||||||||||||||||
| Power |
(11 | ) | (463 | ) | — | (474 | ) | |||||||||
| Fuel |
— | (1 | ) | — | (1 | ) | ||||||||||
| Total derivative contract liabilities |
(11 | ) | (464 | ) | — | (475 | ) | |||||||||
| Net: |
||||||||||||||||
| Commodity contracts—asset management: |
||||||||||||||||
| Power |
(9 | ) | 667 | 6 | 664 | |||||||||||
| Fuel |
— | (1 | ) | 7 | 6 | |||||||||||
| Total derivative contract assets and liabilities, net |
$ | (9 | ) | $ | 666 | $ | 13 | $ | 670 | |||||||
31
Table of Contents
The following table presents net financial assets and liabilities accounted for at fair value on a recurring basis as of September 30, 2010, by tenor (in millions):
| Asset Management |
||||
| Remainder of 2010 |
$ | 104 | ||
| 2011 |
223 | |||
| 2012 |
167 | |||
| 2013 |
185 | |||
| 2014 |
199 | |||
| Thereafter |
— | |||
| Total |
$ | 878 | ||
The volumetric weighted average maturity, or weighted average tenor, of the derivative contract portfolio at September 30, 2010 and December 31, 2009, was approximately 18 months and 23 months, respectively.
Level 3 Disclosures
Mirant Americas Generation and Mirant North America
The following tables present a roll forward of fair values of net assets and liabilities categorized in Level 3 for the nine months ended September 30, 2010 and 2009, and the amount included in income for the three and nine months ended September 30, 2010 and 2009 (in millions):
| Commodity Contracts | ||||||||||||
| Asset Management |
Trading Activities |
Total | ||||||||||
| Fair value of assets and liabilities categorized in Level 3 at January 1, 2010 |
$ | 19 | $ | 13 | $ | 32 | ||||||
| Total gains or losses (realized/unrealized): |
||||||||||||
| Included in income of existing contracts (or changes in net assets or liabilities)1 |
(45 | ) | (22 | ) | (67 | ) | ||||||
| Purchases, issuances and settlements2 |
(80 | ) | 28 | (52 | ) | |||||||
| Transfers in and/or out of Level 33 |
38 | (1 | ) | 37 | ||||||||
| Fair value of assets and liabilities categorized in Level 3 at September 30, 2010 |
$ | (68 | ) | $ | 18 | $ | (50 | ) | ||||
| Commodity Contracts | ||||||||||||
| Asset Management |
Trading Activities |
Total | ||||||||||
| Fair value of assets and liabilities categorized in Level 3 at January 1, 2009 |
$ | 24 | $ | 22 | $ | 46 | ||||||
| Total gains or losses (realized/unrealized): |
||||||||||||
| Included in income of existing contracts (or changes in net assets or liabilities)1 |
(37 | ) | (43 | ) | (80 | ) | ||||||
| Purchases, issuances and settlements2 |
40 | 39 | 79 | |||||||||
| Transfers in and/or out of Level 33 |
— | — | — | |||||||||
| Fair value of assets and liabilities categorized in Level 3 at September 30, 2009 |
$ | 27 | $ | 18 | $ | 45 | ||||||
| 1 | Reflects the total gains or losses on contracts included in Level 3 at the beginning of each quarterly reporting period and at the end of each quarterly reporting period, and contracts entered into during each quarterly reporting period that remain at the end of each quarterly reporting period. Also reflects Mirant Americas Generation’s and Mirant North America’s coal agreements that were initially recognized at fair value in the second quarter of 2010. |
| 2 | Represents the total cash settlements of contracts during each quarterly reporting period that existed at the beginning of each quarterly reporting period. |
32
Table of Contents
| 3 | Denotes the total contracts that existed at the beginning of each quarterly reporting period and were still held at the end of each quarterly reporting period that were either previously categorized as a higher level for which the inputs to the model became unobservable or assets and liabilities that were previously classified as Level 3 for which the lowest significant input became observable during each quarterly reporting period. Amounts reflect fair value as of the end of each quarterly reporting period. |
| Three Months Ended September 30, 2010 |
Nine Months Ended September 30, 2010 |
|||||||||||||||||||||||
| Operating Revenues |
Cost of Fuel |
Total | Operating Revenues |
Cost of Fuel |
Total | |||||||||||||||||||
| Gains (losses) included in income |
$ | (1 | ) | $ | 24 | $ | 23 | $ | 1 | $ | (83 | ) | $ | (82 | ) | |||||||||
| Gains (losses) included in income (or changes in net assets) attributable to the change in unrealized gains or losses relating to assets still held at September 30, 2010 |
$ | (1 | ) | $ | 24 | $ | 23 | $ | 6 | $ | (83 | ) | $ | (77 | ) | |||||||||
| Three Months Ended September 30, 2009 |
Nine Months Ended September 30, 2009 |
|||||||||||||||||||||||
| Operating Revenues |
Cost of Fuel |
Total | Operating Revenues |
Cost of Fuel |
Total | |||||||||||||||||||
| Gains (losses) included in income |
$ | (22 | ) | $ | 2 | $ | (20 | ) | $ | (6 | ) | $ | 5 | $ | (1 | ) | ||||||||
| Gains (losses) included in income (or changes in net assets) attributable to the change in unrealized gains or losses relating to assets still held at September 30, 2009 |
$ | (22 | ) | $ | 2 | $ | (20 | ) | $ | (4 | ) | $ | 5 | $ | 1 | |||||||||
Mirant Mid-Atlantic
The following tables present a roll forward of fair values of net assets and liabilities categorized in Level 3 for the nine months ended September 30, 2010 and 2009, and the amount included in income for the three and nine months ended September 30, 2010 and 2009 (in millions):
| Asset Management |
||||
| Fair value of assets and liabilities categorized in Level 3 at January 1, 2010 |
$ | 13 | ||
| Total gains or losses (realized/unrealized): |
||||
| Included in income of existing contracts (or changes in net assets or liabilities)1 |
(64 | ) | ||
| Purchases, issuances and settlements2 |
(63 | ) | ||
| Transfers in and/or out of Level 33 |
38 | |||
| Fair value of assets and liabilities categorized in Level 3 at September 30, 2010 |
$ | (76 | ) | |
| Asset Management |
||||
| Fair value of assets and liabilities categorized in Level 3 at January 1, 2009 |
$ | — | ||
| Total gains or losses (realized/unrealized): |
||||
| Included in income of existing contracts (or changes in net assets or liabilities)1 |
5 | |||
| Purchases, issuances and settlements2 |
4 | |||
| Transfers in and/or out of Level 33 |
— | |||
| Fair value of assets and liabilities categorized in Level 3 at September 30, 2009 |
$ | 9 | ||
| 1 | Reflects the total gains or losses on contracts included in Level 3 at the beginning of each quarterly reporting period and at the end of each quarterly reporting period, and contracts entered into during each quarterly reporting period that remain at the end of each quarterly reporting period. Also reflects Mirant Mid-Atlantic’s coal agreements that were initially recognized at fair value in the second quarter of 2010. |
33
Table of Contents
| 2 | Represents the total cash settlements of contracts during each quarterly reporting period that existed at the beginning of each quarterly reporting period. |
| 3 | Denotes the total contracts that existed at the beginning of each quarterly reporting period and were still held at the end of each quarterly reporting period that were either previously categorized as a higher level for which the inputs to the model became unobservable or assets and liabilities that were previously classified as Level 3 for which the lowest significant input became observable during each quarterly reporting period. Amounts reflect fair value as of the end of each quarterly reporting period. |
| Three Months Ended September 30, 2010 |
Nine Months Ended September 30, 2010 |
|||||||||||||||||||||||
| Operating Revenues |
Cost of Fuel |
Total | Operating Revenues |
Cost of Fuel |
Total | |||||||||||||||||||
| Gains (losses) included in income |
$ | (1 | ) | $ | 24 | $ | 23 | $ | (7 | ) | $ | (82 | ) | $ | (89 | ) | ||||||||
| Gains (losses) included in income (or changes in net assets) attributable to the change in unrealized gains or losses relating to assets still held at September 30, 2010 |
$ | (1 | ) | $ | 24 | $ | 23 | $ | (7 | ) | $ | (82 | ) | $ | (89 | ) | ||||||||
| Three Months Ended September 30, 2009 |
Nine Months Ended September 30, 2009 |
|||||||||||||||||||||||
| Operating Revenues |
Cost of Fuel |
Total | Operating Revenues |
Cost of Fuel |
Total | |||||||||||||||||||
| Gains included in income |
$ | 2 | $ | 2 | $ | 4 | $ | 4 | $ | 5 | $ | 9 | ||||||||||||
| Gains included in income (or changes in net assets) attributable to the change in unrealized gains or losses relating to assets still held at September 30, 2009 |
$ | 2 | $ | 2 | $ | 4 | $ | 4 | $ | 5 | $ | 9 | ||||||||||||
Counterparty Credit Concentration Risk
The Companies are exposed to the default risk of the counterparties with which they transact. The Companies manage their credit risk by entering into master netting agreements and requiring counterparties to post cash collateral or other credit enhancements based on the net exposure and the credit standing of the counterparty. The Companies also have non-collateralized power hedges entered into by Mirant Mid-Atlantic. These transactions are senior unsecured obligations of Mirant Mid-Atlantic and the counterparties and do not require either party to post cash collateral for initial margin or for securing exposure as a result of changes in power or natural gas prices. The Companies’ credit reserve on their derivative contract assets was $26 million and $13 million at September 30, 2010 and December 31, 2009, respectively.
At September 30, 2010 and December 31, 2009, approximately $4 million and $12 million, respectively, of cash collateral posted to Mirant Americas Generation and Mirant North America by counterparties under master netting agreements were included in accounts payable and accrued liabilities on Mirant Americas Generation’s and Mirant North America’s unaudited condensed consolidated balance sheets.
34
Table of Contents
The Companies also monitor counterparty credit concentration risk on both an individual basis and a group counterparty basis. The following tables highlight the credit quality and the balance sheet settlement exposures related to these activities (dollars in millions):
Mirant Americas Generation and Mirant North America
| At September 30, 2010 | ||||||||||||||||||||
| Credit Rating Equivalent |
Gross Exposure Before Collateral1 |
Net Exposure Before Collateral2 |
Collateral3 | Exposure Net of Collateral |
% of Net Exposure |
|||||||||||||||
| Clearing and Exchange |
$ | 1,689 | $ | 105 | $ | 105 | $ | — | — | |||||||||||
| Investment Grade: |
||||||||||||||||||||
| Financial institutions |
1,050 | 836 | — | 836 | 80 | % | ||||||||||||||
| Energy companies |
517 | 168 | 22 | 146 | 14 | % | ||||||||||||||
| Other |
1 | 1 | — | 1 | — | |||||||||||||||
| Non-investment Grade: |
||||||||||||||||||||
| Financial institutions |
— | — | — | — | — | |||||||||||||||
| Energy companies |
14 | 14 | — | 14 | 1 | % | ||||||||||||||
| Other |
— | — | — | — | — | |||||||||||||||
| No External Ratings: |
||||||||||||||||||||
| Internally-rated investment grade |
29 | 24 | — | 24 | 2 | % | ||||||||||||||
| Internally-rated non-investment grade |
29 | 28 | 1 | 27 | 3 | % | ||||||||||||||
| Not internally rated |
— | — | — | — | — | |||||||||||||||
| Total |
$ | 3,329 | $ | 1,176 | $ | 128 | $ | 1,048 | 100 | % | ||||||||||
| At December 31, 2009 | ||||||||||||||||||||
| Credit Rating Equivalent |
Gross Exposure Before Collateral1 |
Net Exposure Before Collateral2 |
Collateral3 | Exposure Net of Collateral |
% of Net Exposure |
|||||||||||||||
| Clearing and Exchange |
$ | 790 | $ | 96 | $ | 96 | $ | — | — | |||||||||||
| Investment Grade: |
||||||||||||||||||||
| Financial institutions |
997 | 646 | 12 | 634 | 81 | % | ||||||||||||||
| Energy companies |
497 | 125 | 13 | 112 | 14 | % | ||||||||||||||
| Other |
— | — | — | — | — | |||||||||||||||
| Non-investment Grade: |
||||||||||||||||||||
| Financial institutions |
— | — | — | — | — | |||||||||||||||
| Energy companies |
— | — | — | — | — | |||||||||||||||
| Other |
— | — | — | — | — | |||||||||||||||
| No External Ratings: |
||||||||||||||||||||
| Internally-rated investment grade |
34 | 27 | — | 27 | 4 | % | ||||||||||||||
| Internally-rated non-investment grade |
8 | 8 | — | 8 | 1 | % | ||||||||||||||
| Not internally rated |
— | — | — | — | — | |||||||||||||||
| Total |
$ | 2,326 | $ | 902 | $ | 121 | $ | 781 | 100 | % | ||||||||||
| 1 | Gross exposure before collateral represents credit exposure, including realized and unrealized transactions, before (a) applying the terms of master netting agreements with counterparties and (b) netting of transactions with clearing brokers and exchanges. The table excludes amounts related to contracts classified as normal purchases/normal sales and non-derivative contractual commitments that are not recorded at fair value in the unaudited condensed consolidated balance sheets, except for any related accounts receivable. Such contractual commitments contain credit and economic risk if a counterparty does not perform. Non-performance could have a material adverse effect on the future results of operations, financial condition and cash flows. |
| 2 | Net exposure before collateral represents the credit exposure, including both realized and unrealized transactions, after applying the terms of master netting agreements. |
| 3 | Collateral includes cash and letters of credit received from counterparties. |
35
Table of Contents
Mirant Mid-Atlantic
| At September 30, 2010 | ||||||||||||||||||||
| Credit Rating Equivalent |
Gross Exposure Before Collateral1,4 |
Net Exposure Before Collateral2 |
Collateral3 | Exposure Net of Collateral |
% of Net Exposure |
|||||||||||||||
| Clearing and Exchange |
$ | — | $ | — | $ | — | $ | — | — | |||||||||||
| Investment Grade: |
||||||||||||||||||||
| Financial institutions |
835 | 808 | — | 808 | 96 | % | ||||||||||||||
| Energy companies |
— | — | — | — | — | |||||||||||||||
| Other |
— | — | — | — | — | |||||||||||||||
| Non-investment Grade: |
||||||||||||||||||||
| Financial institutions |
— | — | — | — | — | |||||||||||||||
| Energy companies |
12 | 12 | — | 12 | 1 | % | ||||||||||||||
| Other |
— | — | — | — | — | |||||||||||||||
| No External Ratings: |
||||||||||||||||||||
| Internally-rated investment grade |
— | — | — | — | — | |||||||||||||||
| Internally-rated non-investment grade |
27 | 27 | — | 27 | 3 | % | ||||||||||||||
| Not internally rated |
— | — | — | — | — | |||||||||||||||
| Total |
$ | 874 | $ | 847 | $ | — | $ | 847 | 100 | % | ||||||||||
| At December 31, 2009 | ||||||||||||||||||||
| Credit Rating Equivalent |
Gross Exposure Before Collateral1,4 |
Net Exposure Before Collateral2 |
Collateral3 | Exposure Net of Collateral |
% of Net Exposure |
|||||||||||||||
| Clearing and Exchange |
$ | — | $ | — | $ | — | $ | — | — | |||||||||||
| Investment Grade: |
||||||||||||||||||||
| Financial institutions |
595 | 578 | — | 578 | 99 | % | ||||||||||||||
| Energy companies |
— | — | — | — | — | |||||||||||||||
| Other |
— | — | — | — | — | |||||||||||||||
| Non-investment Grade: |
||||||||||||||||||||
| Financial institutions |
— | — | — | — | — | |||||||||||||||
| Energy companies |
— | — | — | — | — | |||||||||||||||
| Other |
— | — | — | — | — | |||||||||||||||
| No External Ratings: |
||||||||||||||||||||
| Internally-rated investment grade |
— | — | — | — | — | |||||||||||||||
| Internally-rated non-investment grade |
8 | 8 | — | 8 | 1 | % | ||||||||||||||
| Not internally rated |
— | — | — | — | — | |||||||||||||||
| Total |
$ | 603 | $ | 586 | $ | — | $ | 586 | 100 | % | ||||||||||
| 1 | Gross exposure before collateral represents credit exposure, including realized and unrealized transactions, before (a) applying the terms of master netting agreements with counterparties and (b) netting of transactions with clearing brokers and exchanges. The table excludes amounts related to contracts classified as normal purchases/normal sales and non-derivative contractual commitments that are not recorded at fair value in the unaudited condensed consolidated balance sheets, except for any related accounts receivable. Such contractual commitments contain credit and economic risk if a counterparty does not perform. Non-performance could have a material adverse effect on the future results of operations, financial condition and cash flows. |
| 2 | Net exposure before collateral represents the credit exposure, including both realized and unrealized transactions, after applying the terms of master netting agreements. |
| 3 | Collateral includes cash and letters of credit received from counterparties. |
| 4 | Amounts do not include exposures with affiliates or exposures incurred by Mirant Mid-Atlantic in connection with transactions entered into with external counterparties by affiliates on its behalf, with the exception of coal purchases. |
36
Table of Contents
Mirant Americas Generation and Mirant North America had credit exposure to two investment grade counterparties at September 30, 2010, and credit exposure to three investment grade counterparties at December 31, 2009, that each represented an exposure of more than 10% of total credit exposure, net of collateral and that totaled $598 million and $495 million at September 30, 2010 and December 31, 2009, respectively.
Mirant Mid-Atlantic had credit exposure to three investment grade counterparties that each represented an exposure of more than 10% of total credit exposure, net of collateral and that totaled $695 million and $481 million at September 30, 2010 and December 31, 2009, respectively.
Mirant Americas Generation, Mirant North America and Mirant Mid-Atlantic Credit Risk
The Companies’ standard industry contracts contain credit-risk-related contingent features such as ratings-related thresholds whereby the Companies would be required to post additional cash collateral or letters of credit as a result of a credit event, including a downgrade. Additionally, some of the Companies’ contracts contain adequate assurance language, which is generally subjective in nature, but would most likely require the Companies to post additional cash collateral or letters of credit as a result of a credit event, including a downgrade. However, as a result of the Companies’ current credit ratings, the Companies are typically required to post collateral in the normal course of business to offset completely their net liability positions, after applying the terms of master netting agreements. At September 30, 2010, the fair value of Mirant Americas Generation’s and Mirant North America’s financial instruments with credit-risk-related contingent features in a net liability position was approximately $24 million, for which Mirant Americas Generation and Mirant North America have posted collateral of $20 million, including cash and letters of credit, to offset substantially the position. At September 30, 2010, Mirant Mid-Atlantic did not have any financial instruments with credit-risk-related contingent features in a net liability position.
In addition, at September 30, 2010 and December 31, 2009, Mirant Americas Generation and Mirant North America had approximately $1 million and $25 million, respectively, of cash collateral posted with counterparties under master netting agreements that was included in funds on deposit on the unaudited condensed consolidated balance sheets.
Fair Values of Other Financial Instruments (Mirant Americas Generation and Mirant North America)
Other financial instruments recorded at fair value include cash, interest-bearing cash equivalents and interest-bearing funds on deposit. The following methods are used by Mirant Americas Generation and Mirant North America to estimate the fair value of financial instruments that are not otherwise carried at fair value on the accompanying unaudited condensed consolidated balance sheets:
Notes and Other Receivables. The fair value of Mirant North America’s notes receivable are estimated using interest rates it would receive currently for similar types of arrangements.
Long- and Short-Term Debt. The fair value of Mirant Americas Generation’s and Mirant North America’s long- and short-term debt is estimated using quoted market prices, when available.
The carrying amounts and fair values of Mirant Americas Generation’s and Mirant North America’s financial instruments are as follows (in millions):
Mirant Americas Generation
| At September 30, 2010 | At December 31, 2009 | |||||||||||||||
| Carrying Amount |
Fair Value | Carrying Amount |
Fair Value | |||||||||||||
| Liabilities: |
||||||||||||||||
| Long- and short-term debt |
$ | 2,560 | $ | 2,557 | $ | 2,630 | $ | 2,558 | ||||||||
37
Table of Contents
Mirant North America
| At September 30, 2010 | At December 31, 2009 | |||||||||||||||
| Carrying Amount |
Fair Value | Carrying Amount |
Fair Value | |||||||||||||
| Assets: |
||||||||||||||||
| Notes receivable—affiliate |
$ | 93 | $ | 93 | $ | 93 | $ | 93 | ||||||||
| Liabilities: |
||||||||||||||||
| Long- and short-term debt |
$ | 1,177 | $ | 1,199 | $ | 1,248 | $ | 1,223 | ||||||||
| C. | Impairments on Assets Held and Used (Mirant Americas Generation, Mirant North America and Mirant Mid-Atlantic) |
Dickerson Generating Facility
Background
During the second quarter of 2010, the County Council for Montgomery County, Maryland, adopted a law which imposes a levy of $5 per ton of CO2 emitted by Mirant Mid-Atlantic’s Dickerson generating facility. The Companies currently estimate Mirant Mid-Atlantic will incur $10 million to $15 million in levies per year as a result of the CO2 levy which will cause a decrease in the cash flows that the Dickerson generating facility is projected to earn in future periods. See Note I for additional information related to the Montgomery County Carbon Emissions Levy and the Companies’ legal challenge of it.
The Companies viewed the adoption of the law by the Montgomery County council as a triggering event under accounting guidance because the law has caused management to review the economic viability of the Dickerson generating facility as a result of projected decreases in cash flows.
Asset Grouping
For purposes of impairment testing, a long-lived asset or assets must be grouped at the lowest level of identifiable cash flows. In performing the impairment analysis, the Companies determined that the Dickerson generating facility was the lowest level for which identifiable cash flows are available. As a result, the Companies included the cash flows associated with the Dickerson leased facilities as well as the owned combustion turbine units. The leased facilities are accounted for as operating leases, so only the leasehold improvements related to these facilities are recorded on the unaudited condensed consolidated balance sheets. The most significant leasehold improvements for the Dickerson generating facility relate to capital expenditures made as part of the compliance with the Maryland Healthy Air Act.
Assumptions and Results
The Companies’ assessment for recoverability of the Dickerson generating facility under the accounting guidance related to the impairment of a long-lived asset involved developing scenarios for the future expected operations of the Dickerson generating facility. The scenarios related to the success of the legal challenges to the law. The sum of the probability weighted undiscounted cash flows for the Dickerson generating facility exceeded the carrying value as of June 30, 2010. As a result, the Companies did not record an impairment charge. The carrying value of the Dickerson generating facility represented approximately 16% of Mirant Americas Generation’s and Mirant North America’s total property, plant and equipment, net and 19% of Mirant Mid-Atlantic’s total property, plant and equipment, net at September 30, 2010. There were no additional events in the third quarter that required the Companies to update its previous impairment analysis.
38
Table of Contents
Potrero Generating Facility
Background
In the third quarter of 2009, Mirant Potrero executed a settlement agreement with the City of San Francisco in which it agreed to shut down the Potrero generating facility when it is no longer needed for reliability, as determined by the CAISO. That settlement agreement became effective in November 2009, following its approval by the City’s Board of Supervisors and Mayor. There are several projects underway in the San Francisco area to increase reliability for the region that once completed are expected to reduce and possibly eliminate the need for the Potrero generating facility to operate for reliability reasons. Mirant Potrero agreed in the settlement agreement to submit to the CAISO a notice of intent to shut down the facility as of December 31, 2010. The CAISO will make the final determination on when each of the units at the Potrero generating facility is no longer needed for reliability and may be shut down. As a result of the settlement agreement, Mirant Americas Generation and Mirant North America evaluated the Potrero generating facility for impairment during the third quarter of 2009. See Note J for further discussion of the settlement agreement with the City of San Francisco.
Asset Grouping
For purposes of impairment testing, a long-lived asset or assets must be grouped at the lowest level of identifiable cash flows. All of the units at Mirant Potrero are viewed as a single asset group. Additionally, the asset group includes intangible assets recorded at Mirant California for trading and development rights related to Mirant Potrero.
Assumptions and Results
Mirant Americas Generation and Mirant North America evaluated the Potrero generating facility for impairment during the third quarter of 2009. Mirant Americas Generation’s and Mirant North America’s assessment of Mirant Potrero under the accounting guidance related to the impairment of a long-lived asset involved developing scenarios for the future expected operations of the Potrero generating facility. One such scenario assumed the complete shutdown of the Potrero generating facility in December 2010 in accordance with the timeline proposed in the settlement agreement. Mirant Americas Generation and Mirant North America also considered additional scenarios that assumed the CAISO would not allow complete shutdown of the facility in December 2010 because expected reliability projects in the City of San Francisco were not completed.
Mirant Americas Generation and Mirant North America determined that the tangible assets for the Potrero generating facility were not impaired because the weighted average sum of the undiscounted cash flows exceeded the carrying value of the tangible assets in the third quarter of 2009. The carrying value of the Potrero generating facility represented less than 1% of Mirant Americas Generation’s and Mirant North America’s total property, plant and equipment, net at September 30, 2010.
As a result of certain terms included in the settlement agreement, Mirant Americas Generation and Mirant North America separately evaluated the trading and development rights associated with the Potrero generating facility for impairment and determined that both of these intangible assets were fully impaired as of September 30, 2009. Accordingly, Mirant Americas Generation and Mirant North America recognized an impairment loss of $9 million on the unaudited condensed consolidated statements of operations to write off the carrying value of the intangible assets related to the Potrero generating facility. This impairment loss is included in the results of Mirant Americas Generation’s and Mirant North America’s California segment for the three and nine months ended September 30, 2009.
Contra Costa Generating Facility
Background
On September 2, 2009, Mirant Delta entered into an agreement with PG&E for the 674 MW at Contra Costa units 6 and 7 for the period from November 2011 through April 2013. At the end of the agreement, and subject to
39
Table of Contents
any necessary regulatory approval, Mirant Delta has agreed to retire Contra Costa units 6 and 7, which began operations in 1964, in furtherance of state and federal policies to retire aging power plants that utilize once-through cooling technology. The agreement to retire these units did not significantly affect the remaining useful life of the Contra Costa generating facility. The Mirant Delta agreement became effective on September 30, 2010.
Assumptions and Results
Mirant Americas Generation and Mirant North America evaluated the intangible asset of trading rights related to their Contra Costa generating facility for impairment during the third quarter of 2009 as a result of the shutdown provisions in the tolling agreement. Because the Contra Costa generating facility is under contract with PG&E through its expected shutdown date of April 2013, Mirant Americas Generation and Mirant North America determined the intangible asset was fully impaired as of September 30, 2009. Mirant Americas Generation and Mirant North America recorded an impairment loss of $5 million on the unaudited condensed consolidated statements of operations to write off the carrying value of the trading rights related to the Contra Costa generating facility. This impairment loss is included in the results of Mirant Americas Generation’s and Mirant North America’s California segment for the three and nine months ended September 30, 2009.
The following table sets forth by level within the fair value hierarchy the Mirant Americas Generation’s and Mirant North America’s intangible assets that were accounted for at fair value on a non-recurring basis. All of Mirant Americas Generation’s and Mirant North America’s intangible assets that were measured at fair value as a result of an impairment during the current period were categorized in Level 3 as of September 30, 2009 (in millions):
| Fair Value at September 30, 2009 | ||||||||||||||||||||
| Total | Quoted Prices in Active Markets for Identical Assets (Level 1) |
Significant Other Observable Inputs (Level 2) |
Significant Other Unobservable Inputs (Level 3) |
Loss Included in Earnings |
||||||||||||||||
| Potrero intangible assets |
$ | — | $ | — | $ | — | $ | — | $ | 9 | ||||||||||
| Contra Costa intangible assets |
— | — | — | — | 5 | |||||||||||||||
| Total |
$ | — | $ | — | $ | — | $ | — | $ | 14 | ||||||||||
40
Table of Contents
| D. | Long-Term Debt (Mirant Americas Generation, Mirant North America and Mirant Mid-Atlantic) |
Long-term debt was as follows (dollars in millions):
| At September 30, 2010 |
At December 31, 2009 |
Interest Rate |
Secured/ Unsecured |
|||||||||||
| Long-term debt: |
||||||||||||||
| Mirant Mid-Atlantic: |
||||||||||||||
| Mirant Chalk Point capital lease, due 2010 to 2015 |
$ | 22 | $ | 25 | 8.19% | — | ||||||||
| Less: current portion of long-term debt |
(4 | ) | (4 | ) | ||||||||||
| Total Mirant Mid-Atlantic long-term debt, net of current portion |
18 | 21 | ||||||||||||
| Mirant North America: |
||||||||||||||
| Senior secured term loan, due 2010 to 2013 |
305 | 373 | LIBOR+1.75%1 | Secured | ||||||||||
| Senior notes, due December 2013 |
850 | 850 | 7.375% | Unsecured | ||||||||||
| Less: current portion of senior secured term loan |
(48 | ) | (70 | ) | ||||||||||
| Total Mirant North America long-term debt, net of current portion |
1,125 | 1,174 | ||||||||||||
| Mirant Americas Generation: |
||||||||||||||
| Senior notes: |
||||||||||||||
| Due May 2011 |
535 | 535 | 8.30% | Unsecured | ||||||||||
| Due October 2021 |
450 | 450 | 8.50% | Unsecured | ||||||||||
| Due May 2031 |
400 | 400 | 9.125% | Unsecured | ||||||||||
| Unamortized debt premiums (discounts), net |
(2 | ) | (3 | ) | ||||||||||
| Less: current portion of senior notes |
(535 | ) | — | |||||||||||
| Total Mirant Americas Generation |
$ | 1,973 | $ | 2,556 | ||||||||||
| 1 | The weighted average interest rate for the nine months ended September 30, 2010 and the year ended December 31, 2009, was 2.043% and 2.130%, respectively. |
Mirant Americas Generation Senior Notes
The senior notes are senior unsecured obligations of Mirant Americas Generation having no recourse to any subsidiary or affiliate of Mirant Americas Generation. The principal balance of the Mirant Americas Generation senior notes due in May 2011 is included in current portion of long-term debt at September 30, 2010.
Mirant North America Senior Secured Credit Facilities
Mirant North America, a wholly-owned subsidiary of Mirant Americas Generation, entered into senior secured credit facilities in January 2006, which are comprised of a senior secured term loan due January 2013 and a senior secured revolving credit facility due January 2012. The senior secured term loan had an initial principal balance of $700 million, which has amortized to $305 million as of September 30, 2010. At the closing, $200 million drawn under the senior secured term loan was deposited into a cash collateral account to support the issuance of up to $200 million of letters of credit. During 2008, Mirant North America transferred to the senior secured revolving credit facility approximately $78 million of letters of credit previously supported by the cash collateral account and withdrew approximately $78 million from the cash collateral account, thereby reducing the cash collateral account to approximately $122 million. At September 30, 2010, the cash collateral balance was
41
Table of Contents
approximately $124 million as a result of interest earned on the invested cash balances. At September 30, 2010, there were approximately $44 million of letters of credit outstanding under the senior secured revolving credit facility and $123 million of letters of credit outstanding under the senior secured term loan cash collateral account. Upon the completion of the merger with RRI Energy, the outstanding letters of credit will transfer to the GenOn Energy senior secured revolving credit facility. At September 30, 2010, $711 million was available under the senior secured revolving credit facility and less than $1 million was available under the senior secured term loan for cash draws or for the issuance of letters of credit. Although the senior secured revolving credit facility has lender commitments of $800 million, availability thereunder reflects a $45 million effective reduction as a result of the bankruptcy filing of Lehman Commercial Paper, Inc., a lender under the facility.
In addition to quarterly principal installments, which are currently $0.8 million, Mirant North America is required to make annual principal prepayments under the senior secured term loan equal to a specified percentage of its excess free cash flow, which is based on adjusted EBITDA less capital expenditures and as further defined in the loan agreement. On March 10, 2010, Mirant North America made a mandatory principal prepayment of approximately $66 million on the term loan. At September 30, 2010, the current estimate of the mandatory principal prepayment of the term loan in March 2011 is approximately $45 million. This amount has been reclassified from long-term debt to current portion of long-term debt at September 30, 2010.
The senior secured credit facilities are senior secured obligations of Mirant North America. In addition, certain subsidiaries of Mirant North America (not including Mirant Mid-Atlantic or Mirant Energy Trading) have jointly and severally guaranteed, as senior secured obligations, the senior secured credit facilities. The senior secured credit facilities have no recourse to any other Mirant entities. Upon completion of the merger with RRI Energy, the Mirant North America term loan will be repaid and the Mirant North America credit facility will be terminated.
Mirant North America Senior Notes
The senior notes due in 2013 are senior unsecured obligations of Mirant North America. In addition, certain subsidiaries of Mirant North America (not including Mirant Mid-Atlantic or Mirant Energy Trading) have jointly and severally guaranteed, as senior unsecured obligations, the senior notes. The Mirant North America senior notes have no recourse to any other Mirant entities, including Mirant Americas Generation. In connection with the consummation of the merger with RRI Energy, and the related financing transactions, the Mirant North America senior notes will be discharged and redeemed.
| E. | Guarantees and Letters of Credit (Mirant Americas Generation and Mirant North America) |
Mirant generally conducts its business through various intermediate holding companies, including Mirant Americas Generation and Mirant North America, and various operating subsidiaries, which enter into contracts as a routine part of their business activities. In certain instances, the contractual obligations of such subsidiaries are guaranteed by, or otherwise supported by, Mirant or another of its subsidiaries, including guarantees of Mirant North America or letters of credit issued under the credit facilities of Mirant North America.
In addition, Mirant Americas Generation and its subsidiaries and Mirant North America and its subsidiaries enter into various contracts that include indemnification and guarantee provisions. Examples of these contracts include financing and lease arrangements, purchase and sale agreements, including for commodities, construction agreements and agreements with vendors. Although the primary obligation of Mirant Americas Generation, Mirant North America or a subsidiary under such contracts is to pay money or render performance, such contracts may include obligations to indemnify the counterparty for damages arising from the breach thereof and, in certain instances, other existing or potential liabilities. In many cases Mirant Americas Generation’s and Mirant North America’s maximum potential liability cannot be estimated because some of the underlying agreements contain no limits on potential liability.
42
Table of Contents
Upon issuance or modification of a guarantee, Mirant Americas Generation and Mirant North America determine if the obligation is subject to initial recognition and measurement of a liability and/or disclosure of the nature and terms of the guarantee. Generally, guarantees of the performance of a third party are subject to the recognition and measurement, as well as the disclosure provisions of the accounting guidance related to guarantees. Such guarantees must initially be recorded at fair value, as determined in accordance with the accounting guidance. Mirant Americas Generation and Mirant North America did not have any guarantees at September 30, 2010, that met the recognition requirements of the accounting guidance.
For the nine months ended September 30, 2010, Mirant Americas Generation and Mirant North America had net decreases to their guarantees and letters of credit of approximately $16 million, which included a net decrease of approximately $32 million to their letters of credit, partially offset by increases of approximately $9 million to other guarantees and approximately $7 million to their surety bonds.
This Note should be read in conjunction with the complete description under Note 7, Commitments and Contingencies—Guarantees, to the Companies’ consolidated financial statements in their 2009 Annual Report on Form 10-K.
| F. | Related Party Arrangements and Transactions (Mirant Americas Generation, Mirant North America and Mirant Mid-Atlantic) |
Administrative Services Agreement with Mirant Services
Mirant Services provides the Companies with various management, personnel and other services as set forth in the Administrative Services Agreement. The Companies reimburse Mirant Services for amounts equal to Mirant Services’ costs of providing such services.
The total costs incurred by the Companies under the Administrative Services Agreement with Mirant Services have been included in the Companies’ accompanying unaudited condensed consolidated statements of operations as follows (in millions):
Mirant Americas Generation and Mirant North America
| Three Months Ended September 30, |
Nine Months Ended September 30, |
|||||||||||||||
| 2010 | 2009 | 2010 | 2009 | |||||||||||||
| Cost of fuel, electricity and other products—affiliate |
$ | 2 | $ | 2 | $ | 6 | $ | 6 | ||||||||
| Operations and maintenance expense—affiliate |
41 | 39 | 121 | 113 | ||||||||||||
| Total |
$ | 43 | $ | 41 | $ | 127 | $ | 119 | ||||||||
Mirant Mid-Atlantic
| Three Months Ended September 30, |
Nine Months Ended September 30, |
|||||||||||||||
| 2010 | 2009 | 2010 | 2009 | |||||||||||||
| Cost of fuel, electricity and other products—affiliate |
$ | 2 | $ | 2 | $ | 6 | $ | 6 | ||||||||
| Operations and maintenance expense—affiliate |
26 | 22 | 75 | 62 | ||||||||||||
| Total |
$ | 28 | $ | 24 | $ | 81 | $ | 68 | ||||||||
Power Sales and Fuel Supply Arrangement with Mirant Energy Trading (Mirant Mid-Atlantic)
Mirant Mid-Atlantic operates under a Power Sale, Fuel Supply and Services Agreement with Mirant Energy Trading. Amounts due to Mirant Energy Trading for fuel purchases and due from Mirant Energy Trading for power and capacity sales are recorded as a payable—affiliate or accounts receivable—affiliate in Mirant Mid-Atlantic’s accompanying unaudited condensed consolidated balance sheets.
43
Table of Contents
Under the Power Sale, Fuel Supply and Services Agreement, Mirant Energy Trading resells Mirant Mid-Atlantic’s energy products in the PJM spot and forward markets and to other third parties. Mirant Mid-Atlantic is paid the amount received by Mirant Energy Trading for such capacity and energy. Mirant Mid-Atlantic has counterparty credit risk in the event that Mirant Energy Trading is unable to collect amounts owed from third parties for the resale of Mirant Mid-Atlantic’s energy products.
Services Provided by Mirant Energy Trading (Mirant Mid-Atlantic)
Mirant Mid-Atlantic receives services from Mirant Energy Trading which include the bidding and dispatch of the generating units, fuel procurement and the execution of contracts, including economic hedges, to reduce price risk. Amounts due to and from Mirant Energy Trading under the Power Sale, Fuel Supply and Services Agreement are recorded as a net payable—affiliate or accounts receivable—affiliate, as appropriate. Substantially all energy marketing overhead expenses are allocated to Mirant’s operating subsidiaries. During both the three and nine months ended September 30, 2010 and 2009, Mirant Mid-Atlantic incurred approximately $3 million and $10 million of energy marketing overhead expense. These costs are included in operations and maintenance expense—affiliate in Mirant Mid-Atlantic’s accompanying unaudited condensed consolidated statements of operations.
Services Agreement with Mirant Marsh Landing (Mirant Americas Generation and Mirant North America)
Mirant Energy Trading entered into a services agreement with Mirant Marsh Landing that includes the bidding and dispatch of the Mirant Marsh Landing generating units, fuel procurement and the execution of contracts to reduce price risk, except to the extent that Mirant Marsh Landing contracts directly with third-parties, including the PPA with PG&E. As a fee for such services, Mirant Marsh Landing has agreed to pay Mirant Energy Trading the allocated cost to Mirant Energy Trading of providing such services.
Administration Arrangements with Mirant Services
Substantially all of Mirant’s corporate overhead costs are allocated to Mirant’s operating subsidiaries based on an average of each operating subsidiaries’ gross margin, labor costs and net property, plant and equipment relative to all operating subsidiaries. Management has concluded that this method of allocating overhead costs is reasonable. For the three and nine months ended September 30, 2010 and 2009, the Companies incurred the following in costs under these arrangements, which are included in operations and maintenance expense—affiliate in the Companies’ accompanying unaudited condensed consolidated statements of operations (in millions):
| Three Months Ended September 30, |
Nine Months Ended September 30, |
|||||||||||||||
| 2010 | 2009 | 2010 | 2009 | |||||||||||||
| Mirant Americas Generation |
$ | 33 | $ | 34 | $ | 95 | $ | 97 | ||||||||
| Mirant North America |
$ | 33 | $ | 34 | $ | 95 | $ | 97 | ||||||||
| Mirant Mid-Atlantic |
$ | 22 | $ | 23 | $ | 61 | $ | 65 | ||||||||
Mirant’s proposed merger with RRI Energy is expected to affect the allocation of corporate overhead costs to the Companies for periods subsequent to the completion of the merger. However, changes in allocated overhead costs to the Companies compared to historical levels cannot be estimated at this time.
Agreement for Purchase and Sale between Mirant Marsh Landing and Mirant Delta (Mirant Americas Generation and Mirant North America)
In October 2010, Mirant Delta entered into an agreement for the sale of the land for the Marsh Landing planned generating facility site to Mirant Marsh Landing for consideration of approximately $3 million based on a third-party appraisal. In connection with the closing of the sale of the land for the Marsh Landing site, Mirant
44
Table of Contents
Delta and Mirant Marsh Landing will enter into related agreements including a shared facilities and services agreement, easement agreements and an assignment of certain water rights to Mirant Marsh Landing. The transfer of the site is expected to close before the end of 2010.
Notes Receivable from Affiliate (Mirant North America)
During the pendency of the Chapter 11 proceedings, Mirant Americas Generation and certain of its subsidiaries and Mirant and certain of its subsidiaries (excluding Mirant Americas Generation and its subsidiaries) participated in separate intercompany cash management programs whereby cash balances at Mirant and the respective participating subsidiaries were transferred to central concentration accounts to fund working capital and other needs of the respective participants. At September 30, 2010 and December 31, 2009, Mirant North America had current notes receivable from Mirant Americas Generation of $93 million related to its pre-emergence intercompany cash management program. For the three and nine months ended September 30, 2010, Mirant North America did not earn any interest income related to the notes receivable, compared to less than $1 million for the same periods in 2009.
Purchased Emissions Allowances (Mirant Mid-Atlantic)
In the first quarter of 2009, Mirant Energy Trading began maintaining on behalf of Mirant Mid-Atlantic an inventory of certain purchased emissions allowances. The emissions allowances are sold by Mirant Energy Trading to Mirant Mid-Atlantic as they are needed for operations. Mirant Mid-Atlantic purchases emissions allowances from Mirant Energy Trading at Mirant Energy Trading’s original cost to purchase the allowances. For allowances that have been purchased by Mirant Energy Trading from a Mirant affiliate, the price paid by Mirant Energy Trading is determined by market indices. Emissions allowances purchased from Mirant Energy Trading that were utilized in the three and nine months ended September 30, 2010, were $9 million and $25 million, respectively, compared to $12 million and $37 million, respectively, for the same periods in 2009 and are recorded in cost of fuel, electricity and other products—affiliate in Mirant Mid-Atlantic’s accompanying unaudited condensed consolidated statements of operations.
Preferred Shares in Mirant Americas
Series A (Mirant Americas Generation, Mirant North America and Mirant Mid-Atlantic)
Pursuant to the Plan, Mirant Americas issued mandatorily redeemable Series A preferred shares to Mirant Mid-Atlantic for the purpose of funding future environmental capital expenditures. For the nine months ended September 30, 2010, the Companies recorded $5 million in preferred stock in affiliate and member’s interest in the accompanying unaudited condensed consolidated balance sheets of each entity related to the amortization of the discount on the preferred stock in Mirant Americas.
The Series A preferred shares issued by Mirant Americas are mandatorily redeemable by Mirant Americas at various dates. In June 2010, Mirant Americas was required to and did redeem $95 million in the Series A preferred stock held by Mirant Mid-Atlantic.
Series B (Mirant Americas Generation)
Mirant Americas issued mandatorily redeemable Series B preferred shares to Mirant Americas Generation for the purpose of supporting the refinancing of Mirant Americas Generation senior notes due in 2011. For the nine months ended September 30, 2010, Mirant Americas Generation recorded $5 million in preferred stock in affiliate and member’s interest in Mirant Americas Generation’s unaudited condensed consolidated balance sheets related to the amortization of the discount on the preferred stock in Mirant Americas.
45
Table of Contents
| G. | Income Taxes (Mirant Americas Generation, Mirant North America and Mirant Mid-Atlantic) |
Mirant Americas Generation and Mirant North America
Mirant Americas Generation and Mirant North America and most of their subsidiaries are limited liability companies that are treated as branches of Mirant Americas for income tax purposes. As a result, Mirant Americas and Mirant have direct liability for the majority of the United States federal and state income taxes relating to Mirant Americas Generation’s and Mirant North America’s operations. Some of Mirant Americas Generation’s and Mirant North America’s subsidiaries continue to exist as corporate regarded entities for income tax purposes. They are Hudson Valley Gas, Mirant Kendall and Mirant Special Procurement, Inc. For these subsidiaries that continue to exist as corporate regarded entities, Mirant Americas Generation and Mirant North America allocate current and deferred income taxes to each corporate regarded entity as if such entity were a single taxpayer utilizing the asset and liability method to account for income taxes. To the extent Mirant Americas Generation and Mirant North America provide tax expense or benefit, any related tax payable or receivable to Mirant is reclassified to equity in the same period because Mirant Americas Generation and Mirant North America do not have a tax sharing agreement with Mirant.
If Mirant Americas Generation were to be allocated income taxes attributable to its operations, the pro forma income tax provision attributable to income before taxes would be $67 million and $68 million, respectively, for the three and nine months ended September 30, 2010, compared to $5 million and $13 million, respectively, for the three and nine months ended September 30, 2009. The pro forma balance of Mirant Americas Generation’s net deferred income taxes would be a net deferred tax liability of $66 million as of September 30, 2010. If Mirant North America were to be allocated income taxes attributable to its operations, the pro forma income tax provision attributable to income before taxes would be $119 million and $192 million, respectively, for the three and nine months ended September 30, 2010, compared to $38 million and $253 million, respectively, for the three and nine months ended September 30, 2009. The pro forma balance of Mirant North America’s deferred income taxes would be a net deferred tax liability of $308 million as of September 30, 2010.
On April 11, 2010, Mirant entered into the Merger Agreement with RRI Energy and Merger Sub, a direct and wholly-owned subsidiary of RRI Energy. Provided neither has experienced an ownership change between December 31, 2009, and the closing date of the merger, each of Mirant and RRI Energy is expected separately to experience an ownership change, as defined in §382 of the Internal Revenue Code of 1986, on the merger date as a consequence of the merger. Immediately following the merger, Mirant and RRI Energy will be members of the same consolidated federal income tax group. The ability of this consolidated tax group to deduct the pre-merger NOL carry forwards of Mirant and RRI Energy against the post-merger taxable income of the group will be substantially limited as a result of these ownership changes. Mirant Americas Generation’s and Mirant North America’s annual limitation on their NOLs as corporate regarded entities and the pro forma annual limitation on Mirant Americas Generation’s and Mirant North America’s pro forma NOLs will also be limited and could result in the recognition of additional current tax expense for the corporate regarded entities and additional pro forma current tax expense in future periods. Given §382’s broad definition, and irrespective of the expected merger discussed above, an ownership change could be the unintended consequence of otherwise normal market trading in Mirant’s stock that is outside Mirant’s control. On March 26, 2009, Mirant announced the adoption of a stockholder rights plan (the “Stockholder Rights Plan”) to reduce the likelihood of an unintended ownership change. However, there can be no assurance that the Stockholder Rights Plan will prevent such an ownership change. On February 26, 2010, Mirant announced that the Board of Directors had extended the Stockholder Rights Plan and on May 6, 2010, Mirant’s stockholders approved the Stockholder Rights Plan at Mirant’s 2010 Annual Meeting of Stockholders.
Mirant Mid-Atlantic
Mirant Mid-Atlantic and its subsidiaries are limited liability companies and are not subject to United States federal or state income taxes. As such, Mirant Mid-Atlantic is treated as though it were a branch or division of Mirant Americas Generation’s parent, Mirant Americas, for income tax purposes, and not as a separate taxpayer.
46
Table of Contents
Mirant Americas and Mirant are directly responsible for income taxes related to Mirant Mid-Atlantic’s operations. If Mirant Mid-Atlantic were to be allocated income taxes attributable to its operations, the pro forma income tax provision attributable to income before taxes would be $127 million and $209 million, respectively, for the three and nine months ended September 30, 2010, compared to $35 million and $242 million, respectively, for the same periods in 2009. The balance of Mirant Mid-Atlantic’s pro forma deferred income taxes would be a net deferred tax liability of $519 million as of September 30, 2010.
47
Table of Contents
| H. | Segment Reporting (Mirant Americas Generation and Mirant North America) |
Mirant Americas Generation and Mirant North America have four operating segments: Mid-Atlantic, Northeast, California and Other Operations. The Mid-Atlantic segment consists of four generating facilities located in Maryland and Virginia with total net generating capacity of 5,194 MW. The Northeast segment consists of three generating facilities located in Massachusetts and one generating facility located in New York with total net generating capacity of 2,535 MW. The California segment consists of three generating facilities located in or near the City of San Francisco, with total net generating capacity of 2,347 MW. Other Operations includes proprietary trading and fuel oil management activities, parent company adjustments for affiliate transactions, interest expense on debt at Mirant Americas Generation and Mirant North America and interest income on the invested cash balances of Mirant Americas Generation and Mirant North America. In the following tables, eliminations are primarily related to intercompany sales of emissions allowances, intercompany revenues, intercompany cost of fuel and interest on intercompany notes receivable and notes payable.
Mirant Americas Generation Operating Segments
| Mid-Atlantic | Northeast | California | Other Operations |
Eliminations | Total | |||||||||||||||||||
| (in millions) | ||||||||||||||||||||||||
| Three Months Ended September 30, 2010: |
||||||||||||||||||||||||
| Operating revenues—nonaffiliate1 |
$ | 165 | $ | 2 | $ | 28 | $ | 580 | $ | — | $ | 775 | ||||||||||||
| Operating revenues—affiliate2 |
488 | 86 | 13 | 53 | (640 | ) | — | |||||||||||||||||
| Total operating revenues |
653 | 88 | 41 | 633 | (640 | ) | 775 | |||||||||||||||||
| Cost of fuel, electricity and other |
4 | — | — | 241 | — | 245 | ||||||||||||||||||
| Cost of fuel, electricity and other |
178 | 59 | 9 | 396 | (640 | ) | 2 | |||||||||||||||||
| Total cost of fuel, electricity and |
182 | 59 | 9 | 637 | (640 | ) | 247 | |||||||||||||||||
| Gross margin |
471 | 29 | 32 | (4 | ) | — | 528 | |||||||||||||||||
| Operating Expenses: |
||||||||||||||||||||||||
| Operations and maintenance—nonaffiliate |
65 | 14 | 6 | 3 | — | 88 | ||||||||||||||||||
| Operations and maintenance—affiliate |
51 | 14 | 9 | — | — | 74 | ||||||||||||||||||
| Depreciation and amortization |
36 | 5 | 8 | 3 | — | 52 | ||||||||||||||||||
| Gain on sales of assets, net |
— | (1 | ) | — | — | — | (1 | ) | ||||||||||||||||
| Total operating expenses, net |
152 | 32 | 23 | 6 | — | 213 | ||||||||||||||||||
| Operating income (loss) |
319 | (3 | ) | 9 | (10 | ) | — | 315 | ||||||||||||||||
| Total other expense (income), net |
1 | — | (2 | ) | 51 | — | 50 | |||||||||||||||||
| Income (loss) before income taxes |
318 | (3 | ) | 11 | (61 | ) | — | 265 | ||||||||||||||||
| Benefit for income taxes |
(1 | ) | — | — | — | — | (1 | ) | ||||||||||||||||
| Net income (loss) |
$ | 319 | $ | (3 | ) | $ | 11 | $ | (61 | ) | $ | — | $ | 266 | ||||||||||
| Total assets at September 30, 2010 |
$ | 6,222 | $ | 610 | $ | 113 | $ | 4,056 | $ | (2,371 | ) | $ | 8,630 | |||||||||||
| 1 | Includes unrealized gains of $124 million and $30 million for Mid-Atlantic and Other Operations, respectively. |
| 2 | Includes unrealized gains of $32 million and $8 million for Mid-Atlantic and Northeast, respectively, and unrealized losses of $40 million for Other Operations. |
| 3 | Includes unrealized gains of $13 million for Other Operations. |
| 4 | Includes unrealized losses of $13 million and $10 million for Other Operations and Northeast, respectively, and unrealized gains of $23 million for Mid-Atlantic. |
48
Table of Contents
Mirant Americas Generation Operating Segments
| Mid-Atlantic | Northeast | California | Other Operations |
Eliminations | Total | |||||||||||||||||||
| (in millions) | ||||||||||||||||||||||||
| Nine Months Ended September 30, 2010: |
||||||||||||||||||||||||
| Operating revenues—nonaffiliate1 |
$ | 384 | $ | 10 | $ | 89 | $ | 1,416 | $ | — | $ | 1,899 | ||||||||||||
| Operating revenues—affiliate2 |
1,178 | 190 | 23 | 100 | (1,491 | ) | — | |||||||||||||||||
| Total operating revenues |
1,562 | 200 | 112 | 1,516 | (1,491 | ) | 1,899 | |||||||||||||||||
| Cost of fuel, electricity and other |
13 | — | — | 707 | — | 720 | ||||||||||||||||||
| Cost of fuel, electricity and other |
574 | 121 | 21 | 781 | (1,491 | ) | 6 | |||||||||||||||||
| Total cost of fuel, electricity and |
587 | 121 | 21 | 1,488 | (1,491 | ) | 726 | |||||||||||||||||
| Gross margin |
975 | 79 | 91 | 28 | — | 1,173 | ||||||||||||||||||
| Operating Expenses: |
||||||||||||||||||||||||
| Operations and maintenance—nonaffiliate |
200 | 39 | 23 | 8 | — | 270 | ||||||||||||||||||
| Operations and maintenance—affiliate |
146 | 40 | 30 | — | — | 216 | ||||||||||||||||||
| Depreciation and amortization |
105 | 17 | 23 | 6 | — | 151 | ||||||||||||||||||
| Gain on sales of assets, net |
(3 | ) | (1 | ) | — | — | — | (4 | ) | |||||||||||||||
| Total operating expenses, net |
448 | 95 | 76 | 14 | — | 633 | ||||||||||||||||||
| Operating income (loss) |
527 | (16 | ) | 15 | 14 | — | 540 | |||||||||||||||||
| Total other expense (income), net |
3 | 1 | (2 | ) | 149 | — | 151 | |||||||||||||||||
| Income (loss) before income taxes |
524 | (17 | ) | 17 | (135 | ) | — | 389 | ||||||||||||||||
| Benefit for income taxes |
(1 | ) | — | — | — | — | (1 | ) | ||||||||||||||||
| Net income (loss) |
$ | 525 | $ | (17 | ) | $ | 17 | $ | (135 | ) | $ | — | $ | 390 | ||||||||||
| Total assets at September 30, 2010 |
$ | 6,222 | $ | 610 | $ | 113 | $ | 4,056 | $ | (2,371 | ) | $ | 8,630 | |||||||||||
| 1 | Includes unrealized gains of $227 million and $59 million for Mid-Atlantic and Other Operations, respectively. |
| 2 | Includes unrealized gains of $62 million and $10 million for Mid-Atlantic and Northeast, respectively, and unrealized losses of $72 million for Other Operations. |
| 3 | Includes unrealized losses of $107 million for Other Operations. |
| 4 | Includes unrealized losses of $81 million and $26 million for Mid-Atlantic and Northeast, respectively, and unrealized gains of $107 million for Other Operations. |
49
Table of Contents
Mirant Americas Generation Operating Segments
| Mid-Atlantic | Northeast | California | Other Operations |
Eliminations | Total | |||||||||||||||||||
| (in millions) | ||||||||||||||||||||||||
| Three Months Ended September 30, 2009: |
||||||||||||||||||||||||
| Operating revenues—nonaffiliate1 |
$ | 27 | $ | 3 | $ | 21 | $ | 403 | $ | — | $ | 454 | ||||||||||||
| Operating revenues—affiliate2 |
317 | 54 | 22 | 180 | (573 | ) | — | |||||||||||||||||
| Total operating revenues |
344 | 57 | 43 | 583 | (573 | ) | 454 | |||||||||||||||||
| Cost of fuel, electricity and other |
5 | 1 | — | 154 | — | 160 | ||||||||||||||||||
| Cost of fuel, electricity and other |
126 | 22 | 10 | 417 | (573 | ) | 2 | |||||||||||||||||
| Total cost of fuel, electricity and |
131 | 23 | 10 | 571 | (573 | ) | 162 | |||||||||||||||||
| Gross margin |
213 | 34 | 33 | 12 | — | 292 | ||||||||||||||||||
| Operating Expenses: |
||||||||||||||||||||||||
| Operations and maintenance—nonaffiliate |
56 | 13 | 7 | 1 | — | 77 | ||||||||||||||||||
| Operations and maintenance—affiliate |
48 | 13 | 10 | 2 | — | 73 | ||||||||||||||||||
| Depreciation and amortization |
25 | 4 | 5 | 2 | — | 36 | ||||||||||||||||||
| Impairment losses |
— | — | 14 | — | — | 14 | ||||||||||||||||||
| Gain on sales of assets, net |
(2 | ) | (1 | ) | — | — | — | (3 | ) | |||||||||||||||
| Total operating expenses, net |
127 | 29 | 36 | 5 | — | 197 | ||||||||||||||||||
| Operating income (loss) |
86 | 5 | (3 | ) | 7 | — | 95 | |||||||||||||||||
| Total other expense, net |
— | — | 1 | 31 | — | 32 | ||||||||||||||||||
| Net income (loss) |
$ | 86 | $ | 5 | $ | (4 | ) | $ | (24 | ) | $ | — | $ | 63 | ||||||||||
| Total assets at December 31, 2009 |
$ | 5,807 | $ | 616 | $ | 139 | $ | 3,189 | $ | (2,234 | ) | $ | 7,517 | |||||||||||
| 1 | Includes unrealized losses of $44 million and $149 million for Mid-Atlantic and Other Operations, respectively. |
| 2 | Includes unrealized gains of $125 million for Other Operations and unrealized losses of $82 million and $43 million for Mid-Atlantic and Northeast, respectively. |
| 3 | Includes unrealized gains of $19 million for Other Operations. |
| 4 | Includes unrealized losses of $19 million for Other Operations and unrealized gains of $2 million and $17 million for Mid-Atlantic and Northeast, respectively. |
50
Table of Contents
Mirant Americas Generation Operating Segments
| Mid-Atlantic | Northeast | California | Other Operations |
Eliminations | Total | |||||||||||||||||||
| (in millions) | ||||||||||||||||||||||||
| Nine Months Ended September 30, 2009: |
||||||||||||||||||||||||
| Operating revenues—nonaffiliate1 |
$ | 293 | $ | 11 | $ | 78 | $ | 1,449 | $ | (3 | ) | $ | 1,828 | |||||||||||
| Operating revenues—affiliate2 |
1,114 | 256 | 33 | 164 | (1,567 | ) | — | |||||||||||||||||
| Total operating revenues |
1,407 | 267 | 111 | 1,613 | (1,570 | ) | 1,828 | |||||||||||||||||
| Cost of fuel, electricity and other |
15 | 2 | — | 560 | — | 577 | ||||||||||||||||||
| Cost of fuel, electricity and other |
415 | 122 | 22 | 1,014 | (1,567 | ) | 6 | |||||||||||||||||
| Total cost of fuel, electricity and |
430 | 124 | 22 | 1,574 | (1,567 | ) | 583 | |||||||||||||||||
| Gross margin |
977 | 143 | 89 | 39 | (3 | ) | 1,245 | |||||||||||||||||
| Operating Expenses: |
||||||||||||||||||||||||
| Operations and maintenance—nonaffiliate |
173 | 54 | 28 | 3 | — | 258 | ||||||||||||||||||
| Operations and maintenance—affiliate |
137 | 39 | 29 | 5 | — | 210 | ||||||||||||||||||
| Depreciation and amortization |
73 | 13 | 15 | 3 | — | 104 | ||||||||||||||||||
| Impairment losses |
— | — | 14 | — | — | 14 | ||||||||||||||||||
| Gain on sales of assets, net |
(12 | ) | (3 | ) | (1 | ) | — | (4 | ) | (20 | ) | |||||||||||||
| Total operating expenses, net |
371 | 103 | 85 | 11 | (4 | ) | 566 | |||||||||||||||||
| Operating income |
606 | 40 | 4 | 28 | 1 | 679 | ||||||||||||||||||
| Total other expense, net |
2 | — | 2 | 100 | — | 104 | ||||||||||||||||||
| Net income (loss) |
$ | 604 | $ | 40 | $ | 2 | $ | (72 | ) | $ | 1 | $ | 575 | |||||||||||
| Total assets at December 31, 2009 |
$ | 5,807 | $ | 616 | $ | 139 | $ | 3,189 | $ | (2,234 | ) | $ | 7,517 | |||||||||||
| 1 | Includes unrealized gains of $101 million for Mid-Atlantic and unrealized losses of $83 million for Other Operations. |
| 2 | Includes unrealized gains of $11 million and $10 million for Mid-Atlantic and Other Operations, respectively, and unrealized losses of $21 million for Northeast. |
| 3 | Includes unrealized gains of $48 million for Other Operations. |
| 4 | Includes unrealized losses of $48 million for Other Operations and unrealized gains of $7 million and $41 million for Mid-Atlantic and Northeast, respectively. |
51
Table of Contents
Mirant North America Operating Segments
| Mid-Atlantic | Northeast | California | Other Operations |
Eliminations | Total | |||||||||||||||||||
| (in millions) | ||||||||||||||||||||||||
| Three Months Ended September 30, 2010: |
||||||||||||||||||||||||
| Operating revenues—nonaffiliate1 |
$ | 165 | $ | 2 | $ | 28 | $ | 580 | $ | — | $ | 775 | ||||||||||||
| Operating revenues—affiliate2 |
488 | 86 | 13 | 53 | (640 | ) | — | |||||||||||||||||
| Total operating revenues |
653 | 88 | 41 | 633 | (640 | ) | 775 | |||||||||||||||||
| Cost of fuel, electricity and other |
4 | — | — | 241 | — | 245 | ||||||||||||||||||
| Cost of fuel, electricity and other |
178 | 59 | 9 | 396 | (640 | ) | 2 | |||||||||||||||||
| Total cost of fuel, electricity and |
182 | 59 | 9 | 637 | (640 | ) | 247 | |||||||||||||||||
| Gross margin |
471 | 29 | 32 | (4 | ) | — | 528 | |||||||||||||||||
| Operating Expenses: |
||||||||||||||||||||||||
| Operations and maintenance— nonaffiliate |
65 | 14 | 6 | 3 | — | 88 | ||||||||||||||||||
| Operations and maintenance— affiliate |
51 | 14 | 9 | — | — | 74 | ||||||||||||||||||
| Depreciation and amortization |
36 | 5 | 8 | 3 | — | 52 | ||||||||||||||||||
| Gain on sales of assets, net |
— | (1 | ) | — | — | — | (1 | ) | ||||||||||||||||
| Total operating expenses, net |
152 | 32 | 23 | 6 | — | 213 | ||||||||||||||||||
| Operating income (loss) |
319 | (3 | ) | 9 | (10 | ) | — | 315 | ||||||||||||||||
| Total other expense (income), net |
1 | — | (2 | ) | 20 | — | 19 | |||||||||||||||||
| Income (loss) before income taxes |
318 | (3 | ) | 11 | (30 | ) | — | 296 | ||||||||||||||||
| Benefit for income taxes |
(1 | ) | — | — | — | — | (1 | ) | ||||||||||||||||
| Net income (loss) |
$ | 319 | $ | (3 | ) | $ | 11 | $ | (30 | ) | $ | — | $ | 297 | ||||||||||
| Total assets at September 30, 2010 |
$ | 6,222 | $ | 610 | $ | 113 | $ | 4,030 | $ | (2,270 | ) | $ | 8,705 | |||||||||||
| 1 | Includes unrealized gains of $124 million and $30 million for Mid-Atlantic and Other Operations, respectively. |
| 2 | Includes unrealized gains of $32 million and $8 million for Mid-Atlantic and Northeast, respectively, and unrealized losses of $40 million for Other Operations. |
| 3 | Includes unrealized gains of $13 million for Other Operations. |
| 4 | Includes unrealized losses of $13 million and $10 million for Other Operations and Northeast, respectively, and unrealized gains of $23 million for Mid-Atlantic. |
52
Table of Contents
Mirant North America Operating Segments
| Mid-Atlantic | Northeast | California | Other Operations |
Eliminations | Total | |||||||||||||||||||
| (in millions) | ||||||||||||||||||||||||
| Nine Months Ended September 30, 2010: |
||||||||||||||||||||||||
| Operating revenues—nonaffiliate1 |
$ | 384 | $ | 10 | $ | 89 | $ | 1,416 | $ | — | $ | 1,899 | ||||||||||||
| Operating revenues—affiliate2 |
1,178 | 190 | 23 | 100 | (1,491 | ) | — | |||||||||||||||||
| Total operating revenues |
1,562 | 200 | 112 | 1,516 | (1,491 | ) | 1,899 | |||||||||||||||||
| Cost of fuel, electricity and other |
13 | — | — | 707 | — | 720 | ||||||||||||||||||
| Cost of fuel, electricity and other |
574 | 121 | 21 | 781 | (1,491 | ) | 6 | |||||||||||||||||
| Total cost of fuel, electricity and |
587 | 121 | 21 | 1,488 | (1,491 | ) | 726 | |||||||||||||||||
| Gross margin |
975 | 79 | 91 | 28 | — | 1,173 | ||||||||||||||||||
| Operating Expenses: |
||||||||||||||||||||||||
| Operations and maintenance—nonaffiliate |
200 | 39 | 23 | 8 | — | 270 | ||||||||||||||||||
| Operations and maintenance— affiliate |
146 | 40 | 30 | — | — | 216 | ||||||||||||||||||
| Depreciation and amortization |
105 | 17 | 23 | 6 | — | 151 | ||||||||||||||||||
| Gain on sales of assets, net |
(3 | ) | (1 | ) | — | — | — | (4 | ) | |||||||||||||||
| Total operating expenses, net |
448 | 95 | 76 | 14 | — | 633 | ||||||||||||||||||
| Operating income (loss) |
527 | (16 | ) | 15 | 14 | — | 540 | |||||||||||||||||
| Total other expense (income), net |
3 | 1 | (2 | ) | 58 | — | 60 | |||||||||||||||||
| Income (loss) before income taxes |
524 | (17 | ) | 17 | (44 | ) | — | 480 | ||||||||||||||||
| Benefit for income taxes |
(1 | ) | — | — | — | — | (1 | ) | ||||||||||||||||
| Net income (loss) |
$ | 525 | $ | (17 | ) | $ | 17 | $ | (44 | ) | $ | — | $ | 481 | ||||||||||
| Total assets at September 30, 2010 |
$ | 6,222 | $ | 610 | $ | 113 | $ | 4,030 | $ | (2,270 | ) | $ | 8,705 | |||||||||||
| 1 | Includes unrealized gains of $227 million and $59 million for Mid-Atlantic and Other Operations, respectively. |
| 2 | Includes unrealized gains of $62 million and $10 million for Mid-Atlantic and Northeast, respectively, and unrealized losses of $72 million for Other Operations. |
| 3 | Includes unrealized losses of $107 million for Other Operations. |
| 4 | Includes unrealized losses of $81 million and $26 million for Mid-Atlantic and Northeast, respectively, and unrealized gains of $107 million for Other Operations. |
53
Table of Contents
Mirant North America Operating Segments
| Mid-Atlantic | Northeast | California | Other Operations |
Eliminations | Total | |||||||||||||||||||
| (in millions) | ||||||||||||||||||||||||
| Three Months Ended September 30, 2009: |
||||||||||||||||||||||||
| Operating revenues—nonaffiliate1 |
$ | 27 | $ | 3 | $ | 21 | $ | 403 | $ | — | $ | 454 | ||||||||||||
| Operating revenues—affiliate2 |
317 | 54 | 22 | 180 | (573 | ) | — | |||||||||||||||||
| Total operating revenues |
344 | 57 | 43 | 583 | (573 | ) | 454 | |||||||||||||||||
| Cost of fuel, electricity and other |
5 | 1 | — | 154 | — | 160 | ||||||||||||||||||
| Cost of fuel, electricity and other |
126 | 22 | 10 | 417 | (573 | ) | 2 | |||||||||||||||||
| Total cost of fuel, electricity and |
131 | 23 | 10 | 571 | (573 | ) | 162 | |||||||||||||||||
| Gross margin |
213 | 34 | 33 | 12 | — | 292 | ||||||||||||||||||
| Operating Expenses: |
||||||||||||||||||||||||
| Operations and maintenance—nonaffiliate |
56 | 13 | 7 | 1 | — | 77 | ||||||||||||||||||
| Operations and maintenance—affiliate |
48 | 13 | 10 | 2 | — | 73 | ||||||||||||||||||
| Depreciation and amortization |
25 | 4 | 5 | 2 | — | 36 | ||||||||||||||||||
| Impairment losses |
— | — | 14 | — | — | 14 | ||||||||||||||||||
| Gain on sales of assets, net |
(2 | ) | (1 | ) | — | — | — | (3 | ) | |||||||||||||||
| Total operating expenses, net |
127 | 29 | 36 | 5 | — | 197 | ||||||||||||||||||
| Operating income (loss) |
86 | 5 | (3 | ) | 7 | — | 95 | |||||||||||||||||
| Total other expense, net |
— | — | 1 | — | — | 1 | ||||||||||||||||||
| Net income (loss) |
$ | 86 | $ | 5 | $ | (4 | ) | $ | 7 | $ | — | $ | 94 | |||||||||||
| Total assets at December 31, 2009 |
$ | 5,807 | $ | 616 | $ | 139 | $ | 3,181 | $ | (2,133 | ) | $ | 7,610 | |||||||||||
| 1 | Includes unrealized losses of $44 million and $149 million for Mid-Atlantic and Other Operations, respectively. |
| 2 | Includes unrealized gains of $125 million for Other Operations and unrealized losses of $82 million and $43 million for Mid-Atlantic and Northeast, respectively. |
| 3 | Includes unrealized gains of $19 million for Other Operations. |
| 4 | Includes unrealized losses of $19 million for Other Operations and unrealized gains of $2 million and $17 million for Mid-Atlantic and Northeast, respectively. |
54
Table of Contents
Mirant North America Operating Segments
| Mid-Atlantic | Northeast | California | Other Operations |
Eliminations | Total | |||||||||||||||||||
| (in millions) | ||||||||||||||||||||||||
| Nine Months Ended September 30, 2009: |
||||||||||||||||||||||||
| Operating revenues—nonaffiliate1 |
$ | 293 | $ | 11 | $ | 78 | $ | 1,449 | $ | (3 | ) | $ | 1,828 | |||||||||||
| Operating revenues—affiliate2 |
1,114 | 256 | 33 | 164 | (1,567 | ) | — | |||||||||||||||||
| Total operating revenues |
1,407 | 267 | 111 | 1,613 | (1,570 | ) | 1,828 | |||||||||||||||||
| Cost of fuel, electricity and other |
15 | 2 | — | 560 | — | 577 | ||||||||||||||||||
| Cost of fuel, electricity and other |
415 | 122 | 22 | 1,014 | (1,567 | ) | 6 | |||||||||||||||||
| Total cost of fuel, electricity and |
430 | 124 | 22 | 1,574 | (1,567 | ) | 583 | |||||||||||||||||
| Gross margin |
977 | 143 | 89 | 39 | (3 | ) | 1,245 | |||||||||||||||||
| Operating Expenses: |
||||||||||||||||||||||||
| Operations and maintenance—nonaffiliate |
173 | 54 | 28 | 3 | — | 258 | ||||||||||||||||||
| Operations and maintenance—affiliate |
137 | 39 | 29 | 5 | — | 210 | ||||||||||||||||||
| Depreciation and amortization |
73 | 13 | 15 | 3 | — | 104 | ||||||||||||||||||
| Impairment losses |
— | — | 14 | — | — | 14 | ||||||||||||||||||
| Gain on sales of assets, net |
(12 | ) | (3 | ) | (1 | ) | — | (4 | ) | (20 | ) | |||||||||||||
| Total operating expenses, net |
371 | 103 | 85 | 11 | (4 | ) | 566 | |||||||||||||||||
| Operating income |
606 | 40 | 4 | 28 | 1 | 679 | ||||||||||||||||||
| Total other expense, net |
2 | — | 2 | 9 | — | 13 | ||||||||||||||||||
| Net income |
$ | 604 | $ | 40 | $ | 2 | $ | 19 | $ | 1 | $ | 666 | ||||||||||||
| Total assets at December 31, 2009 |
$ | 5,807 | $ | 616 | $ | 139 | $ | 3,181 | $ | (2,133 | ) | $ | 7,610 | |||||||||||
| 1 | Includes unrealized gains of $101 million for Mid-Atlantic and unrealized losses of $83 million for Other Operations. |
| 2 | Includes unrealized gains of $11 million and $10 million for Mid-Atlantic and Other Operations, respectively, and unrealized losses of $21 million for Northeast. |
| 3 | Includes unrealized gains of $48 million for Other Operations. |
| 4 | Includes unrealized losses of $48 million for Other Operations and unrealized gains of $7 million and $41 million for Mid-Atlantic and Northeast, respectively. |
55
Table of Contents
| I. | Litigation and Other Contingencies (Mirant Americas Generation, Mirant North America and Mirant Mid-Atlantic) |
The Companies are involved in a number of significant legal proceedings. In certain cases, plaintiffs seek to recover large and sometimes unspecified damages, and some matters may be unresolved for several years. The Companies cannot currently determine the outcome of the proceedings described below or the ultimate amount of potential losses and therefore have not made any provision for such matters unless specifically noted below. Pursuant to guidance related to accounting for contingencies, management provides for estimated losses to the extent information becomes available indicating that losses are probable and that the amounts are reasonably estimable. Additional losses could have a material adverse effect on the Companies’ results of operations, financial positions or cash flows.
Scrubber Contract Issues
Mirant Mid-Atlantic is working through various issues with Stone & Webster, Inc. (“Stone & Webster”), the EPC contractor for the scrubber projects at the Chalk Point, Dickerson and Morgantown generating facilities to determine the final amount owed to Stone & Webster. Stone & Webster is estimating that the cost incurred under the EPC contract at completion will exceed the amount currently budgeted. If the costs actually incurred for the EPC work were to equal the amount projected by Stone & Webster, the costs incurred by Mirant Mid-Atlantic and Mirant Chalk Point for environmental controls to meet the Maryland Healthy Air Act would exceed the $1.674 billion currently budgeted for the total project by approximately 5%. Mirant Mid-Atlantic is questioning various costs incurred by Stone & Webster and is auditing various components of the costs incurred by Stone & Webster. Mirant Mid-Atlantic also has submitted owner change orders to Stone & Webster that would reduce the costs incurred under the EPC contract by removing work included in the contract specifications that ultimately was not performed or that was completed by Mirant Mid-Atlantic. Mirant Mid-Atlantic expects the final contract amount to be less than the amount projected by Stone & Webster, but cannot predict how much of a reduction will be achieved. The current budget of $1.674 billion continues to represent management’s best estimate of the Companies’ total capital expenditures for compliance with the Maryland Healthy Air Act.
Environmental Matters
Brandywine Fly Ash Facility. By letter dated November 19, 2009, the Defenders of Wildlife, Sierra Club, Patuxent Riverkeeper and Chesapeake Climate Action Network (the “Brandywine Noticing Parties”) notified Mirant, Mirant Mid-Atlantic and Mirant MD Ash Management of their intent to file suit for violations of the Clean Water Act and Maryland’s Water Pollution Control Law alleged to have occurred at the Brandywine Fly Ash Facility owned by Mirant MD Ash Management in Prince George’s County, Maryland. They contend that the operation of the Brandywine facility has resulted in unpermitted discharges of certain pollutants, including aluminum, arsenic, cadmium, copper, lead, mercury, selenium and zinc, through three outfalls and through seepage to the ground water from the disposal cells at the facility. They also assert that the discharges cause violations of certain of Maryland’s water quality criteria. Finally, the Brandywine Noticing Parties contend that Mirant MD Ash Management failed to perform certain monitoring and sampling or to file certain reports required under its existing National Pollutant Discharge Elimination System (“NPDES”) permit for the Brandywine Fly Ash Facility. The notice states that the Brandywine Noticing Parties will request the court to enjoin further violations, to impose civil penalties under the Clean Water Act of up to $37,500 per day per violation for the period after January 4, 2006, and to award them attorney’s fees. By letter dated January 15, 2010, the MDE advised Mirant Mid-Atlantic and Mirant MD Ash Management of its intent to file suit for violations of the Clean Water Act and Maryland’s Water Pollution Control Law based upon factual allegations similar to those asserted by the Brandywine Noticing Parties. Mirant MD Ash Management disputes the allegations of violations of the Clean Water Act and Maryland’s Water Pollution Control Law made by the Brandywine Noticing Parties in the November 19, 2009, letter and by MDE in its letter of January 15, 2010.
On April 2, 2010, the MDE filed a complaint against Mirant Mid-Atlantic and Mirant MD Ash Management in the United States District Court for the District of Maryland asserting violations of the Clean Water Act and
56
Table of Contents
Maryland’s Water Pollution Control Law on the grounds alleged in the November 19, 2009, letter from the Brandywine Noticing Parties and the MDE’s letter of January 15, 2010. Four environmental advocacy groups filed a motion seeking to intervene as plaintiffs in the proceeding. Mirant MD Ash Management and Mirant Mid-Atlantic filed a motion seeking dismissal of the complaint on various grounds, including that the complaint fails to state a claim under the Clean Water Act because the discharges alleged were within the scope of possible discharges identified in filings made by Mirant MD Ash Management with the MDE to obtain its existing NPDES permit for the Brandywine Fly Ash Facility. On September 8, 2010, the United States District Court for the District of Maryland granted the environmental groups’ motion to intervene as plaintiffs and denied the motion to dismiss filed by Mirant MD Ash Management and Mirant Mid-Atlantic.
EPA Information Request. In January 2001, the EPA issued a request for information to Mirant concerning the implications under the EPA’s NSR regulations promulgated under the Clean Air Act of past repair and maintenance activities at the Potomac River generating facility in Virginia and the Chalk Point, Dickerson and Morgantown generating facilities in Maryland. The requested information concerned the period of operations that predates the ownership and lease of those facilities by Mirant Potomac River, Mirant Chalk Point and Mirant Mid-Atlantic. Mirant responded fully to this request. Under the APSA, Pepco is responsible for fines and penalties arising from any violation of the NSR regulations associated with operations prior to the acquisition or lease of the facilities by Mirant Potomac River, Mirant Chalk Point and Mirant Mid-Atlantic. If a violation is determined to have occurred at any of the facilities, Mirant Potomac River, Mirant Chalk Point and Mirant Mid-Atlantic, as the owner or lessee of the facility, may be responsible for the cost of purchasing and installing emissions control equipment, the cost of which may be material. Mirant Chalk Point and Mirant Mid-Atlantic have installed a variety of emissions control equipment on the Chalk Point, Dickerson and Morgantown generating facilities in Maryland to comply with the Maryland Healthy Air Act, but that equipment may not include all of the emissions control equipment that could be required if a violation of the EPA’s NSR regulations is determined to have occurred at one or more of those facilities. If such a violation is determined to have occurred after the acquisition or lease of the facilities by Mirant Potomac River, Mirant Chalk Point and Mirant Mid-Atlantic or, if occurring prior to the acquisition or lease, is determined to constitute a continuing violation, Mirant Potomac River, Mirant Chalk Point or Mirant Mid-Atlantic could also be subject to fines and penalties by the state or federal government for the period after its acquisition or lease of the facility at issue, the cost of which may be material, although applicable bankruptcy law may bar such liability for periods prior to January 3, 2006, when the Plan became effective for Mirant Potomac River, Mirant Chalk Point and Mirant Mid-Atlantic.
Faulkner Fly Ash Facility. By letter dated April 2, 2008, the Environmental Integrity Project and the Potomac Riverkeeper notified Mirant, the Companies and various of the Companies’ subsidiaries that they and certain individuals intended to file suit alleging that violations of the Clean Water Act were occurring at the Faulkner Fly Ash Facility owned by Mirant MD Ash Management. The April 2, 2008, letter alleged that the Faulkner facility discharged certain pollutants at levels that exceed Maryland’s water quality criteria, that it discharged certain pollutants without obtaining an appropriate NPDES permit, and that Mirant MD Ash Management failed to perform monthly monitoring required under an applicable NPDES permit. The letter indicated that the organizations intended to file suit to enjoin the violations alleged, to obtain civil penalties for past violations occurring after January 3, 2006, and to recover attorneys’ fees. Mirant MD Ash Management disputes the allegations of violations of the Clean Water Act made by the two organizations in the April 2, 2008, letter.
In May 2008, the MDE filed a complaint in the Circuit Court for Charles County, Maryland, against Mirant MD Ash Management and Mirant Mid-Atlantic. The complaint alleges violations of Maryland’s water pollution laws similar to those asserted in the April 2, 2008, letter from the Environmental Integrity Project and the Potomac Riverkeeper. The MDE complaint requests that the court (1) prohibit continuation of the alleged unpermitted discharges, (2) require Mirant MD Ash Management and Mirant Mid-Atlantic to cease from disposing of any further coal combustion byproducts at the Faulkner Fly Ash Facility and close and cap the existing disposal cells within one year and (3) assess civil penalties of up to $10,000 per day for each violation. The discharges that are the subject of the MDE’s complaint result from a leachate treatment system installed by Mirant MD Ash Management in accordance with a December 18, 2000, Complaint and Consent Order (the
57
Table of Contents
“December 2000 Consent Order”) entered by the Maryland Secretary of the Environment, Water Management Administration pursuant to an agreement between the MDE and Pepco, the previous owner of the Faulkner Fly Ash Facility. Mirant MD Ash Management and Mirant Mid-Atlantic on July 23, 2008, filed a motion seeking dismissal of the MDE complaint, arguing that the discharges are permitted by the December 2000 Consent Order. In September 2009, the court denied a motion by Environmental Integrity Project seeking to intervene as a party to the suit, and the Environmental Integrity Project has appealed that ruling.
Suit Regarding Chalk Point Emissions. On June 25, 2009, the Chesapeake Climate Action Network and four individuals filed a complaint against Mirant Mid-Atlantic and Mirant Chalk Point in the United States District Court for the District of Maryland. The plaintiffs alleged that Mirant Chalk Point had violated the Clean Air Act and Maryland environmental regulations by failing to install controls to limit emissions of particulate matter on unit 3 and unit 4 of the Chalk Point generating facility, which at times burn residual fuel oil. The plaintiffs sought to enjoin the alleged violations, to obtain civil penalties of up to $32,500 per day for past noncompliance and to recover attorneys’ fees. Mirant Mid-Atlantic and Mirant Chalk Point disputed the plaintiffs’ allegations of violations of the Clean Air Act and Maryland environmental regulations. On October 13, 2009, Mirant Mid-Atlantic and Mirant Chalk Point filed a motion seeking dismissal of the complaint on the grounds that it was barred (1) under principles of res judicata by the dismissal with prejudice in January 2007 of similar claims filed by environmental advocacy organizations asserting that emissions from Chalk Point units 3 and 4 violated the Clean Air Act and (2) by actions taken by the MDE currently and over a number of years to ensure compliance by Chalk Point units 3 and 4 with regulations under the Clean Air Act and Maryland law limiting emissions of particulate matter. On August 13, 2010, the United States District Court for the District of Maryland granted the motion to dismiss based upon MDE’s diligent prosecution of the particulate emissions standard, and that dismissal has become final.
Mirant Mid-Atlantic NOV Regarding Reporting of Ozone Season NOx Emissions. In March 2010, the MDE issued an NOV to Mirant Mid-Atlantic asserting that it had failed in 2009 to comply with state regulations requiring it to notify MDE when the Chalk Point, Dickerson and Morgantown generating facilities had exceeded 80% of the applicable limitation on ozone season NOx emissions. The NOV states that such a violation can result in a civil penalty of up to $25,000 for each day of violation.
Mirant Potomac River NOV Regarding Particulate Matter Continuous Emissions Monitoring System. By letter dated April 6, 2010, the Virginia DEQ issued an NOV to Mirant Potomac River asserting that it had failed to include required particulate matter continuous emissions monitoring system (“PM CEMS”) data in compliance reports submitted for the second half and fourth quarter of 2009. The NOV alleges that when the PM CEMS data were subsequently provided, they indicated that particulate matter emissions may have occurred above the permitted limit. Mirant Potomac River thinks that the PM CEMS equipment was not functioning properly and that the data indicating exceedances of the emissions limit for particulate matter are erroneous. The NOV states that such violations can result in various civil penalties, including a civil penalty of up to $32,500 per day for each violation.
Mirant Potomac River NOV Regarding Opacity Excursions. By letter dated May 12, 2010, the Virginia DEQ issued an NOV to Mirant Potomac River asserting that in four six-minute intervals in February 2010 the opacity readings from one of the stacks at the Potomac River generating facility exceeded the applicable limit. On July 8, 2010, the Virginia DEQ issued another NOV to Mirant Potomac River asserting that on June 21, 2010, the Potomac River generating facility exceeded its permitted opacity limits for three six-minute intervals. The NOVs state that such violations can result in various civil penalties, including a civil penalty of up to $32,500 per day for each violation.
Mirant Potomac River NOV Regarding Fuels. By letter dated October 22, 2010, the Virginia DEQ issued an NOV to Mirant Potomac River asserting that it (a) combusted used oils from the Potomac River generating facility in the facility’s boilers without authority under its permit and (b) received one shipment of coal that exceeded the maximum ash content of 11.0% allowed under its permit. The NOV states that such violations can result in various civil penalties, including a civil penalty of up to $32,500 per day for each violation.
58
Table of Contents
Montgomery County Carbon Emissions Levy. Mirant Mid-Atlantic’s Dickerson generating facility is located in Montgomery County, Maryland. The Montgomery County Council enacted a law (the “CO2 Levy”) effective May 29, 2010, that imposes a levy on major emitters of CO2 in Montgomery County of $5 per ton of CO2 emitted. The CO2 Levy defines a major emitter of CO2 in Montgomery County to be a source emitting 1 million tons or more annually of CO2. Based upon historical emissions, the Dickerson generating facility is expected to fall within the definition of a major emitter, and is currently the only facility in Montgomery County that would meet the criteria to be a major emitter. Mirant Americas Generation, Mirant North America and Mirant Mid-Atlantic estimate that the CO2 Levy will impose an additional $10 million to $15 million per year in levies owed to Montgomery County. On June 1, 2010, Mirant Mid-Atlantic filed an action against Montgomery County in the United States District Court for the District of Maryland seeking a determination that the CO2 Levy is unlawful. In its complaint, Mirant Mid-Atlantic contends that the CO2 Levy violates its equal protection and due process rights, imposes an unconstitutional excessive fine, is an unconstitutional bill of attainder, constitutes a prohibited special law under the Maryland Constitution, and is preempted by Maryland law and the RGGI, an interstate compact to which Maryland is a party. Montgomery County filed a motion to dismiss, arguing that the CO2 Levy is a tax and that the district court lacks the jurisdiction to hear challenges to such a tax under the federal Tax Injunction Act. On July 12, 2010, the district court ruled that the CO2 Levy is a tax rather than a fee as argued by Mirant Mid-Atlantic, and it dismissed the suit for lack of jurisdiction. Mirant Mid-Atlantic has appealed that ruling to the United States Court of Appeals for the Fourth Circuit. If the district court’s ruling is not reversed on appeal, Mirant Mid-Atlantic intends to refile its legal challenges to the CO2 Levy in the Maryland state courts.
Riverkeeper Suit Against Mirant Lovett (Mirant Americas Generation and Mirant North America). On March 11, 2005, Riverkeeper, Inc. filed suit against Mirant Lovett in the United States District Court for the Southern District of New York under the Clean Water Act. The suit alleges that Mirant Lovett failed to implement a marine life exclusion system at its former Lovett generating facility and to perform monitoring for the exclusion of certain aquatic organisms from the facility’s cooling water intake structures in violation of Mirant Lovett’s water discharge permit issued by the State of New York. The plaintiff requested the court to impose civil penalties of $32,500 per day of violation and to award the plaintiff attorneys’ fees. Mirant Lovett’s view is that it complied with the terms of its water discharge permit, as amended by a Consent Order entered June 29, 2004. Mirant Lovett filed a motion seeking dismissal of the suit on the grounds that it complied with the terms of its water discharge permit, the closure of the Lovett generating facility in April 2008 moots the plaintiff’s request for injunctive relief, and the discharge in bankruptcy received by Mirant Lovett in 2007 bars any claim for penalties. On December 15, 2009, the district court granted in part and denied in part Mirant Lovett’s motion to dismiss. The court dismissed the plaintiff’s claims for injunctive relief and for penalties for any period prior to Mirant Lovett’s emergence from bankruptcy on October 2, 2007. It allowed to go forward claims alleging that Mirant Lovett violated its water discharge permit by not implementing the marine life exclusion system between the later of February 23, 2008 or when ice conditions on the Hudson River allowed for the system’s safe deployment and April 19, 2008, when the Lovett generating facility ceased operation, concluding that the June 29, 2004 Consent Order did not have the effect of modifying the water discharge permit.
Chapter 11 Proceedings
On July 14, 2003, and various dates thereafter, the Companies and their subsidiaries (collectively, the “Mirant Debtors”) filed voluntary petitions for relief under Chapter 11 of the Bankruptcy Code in the Bankruptcy Court. Mirant, the Companies and most of the Mirant Debtors emerged from bankruptcy on January 3, 2006, when the Plan became effective. The remaining Mirant Debtors (Mirant New York, Mirant Bowline, Mirant Lovett, Mirant NY-Gen and Hudson Valley Gas) emerged from bankruptcy on various dates in 2007. As of September 30, 2010, approximately 461,000 of the shares of Mirant common stock to be distributed under the Plan had not yet been distributed and have been reserved for distribution with respect to claims disputed by the Mirant Debtors that have not been resolved. Under the terms of the Plan, upon the resolution of such a disputed claim, the claimant will receive the same pro rata distributions of Mirant common stock, cash, or both common stock and cash as previously allowed claims, regardless of the price at which Mirant common stock is trading at the time the claim is resolved.
59
Table of Contents
To the extent the aggregate amount of the payouts determined to be due with respect to disputed claims ultimately results in the number of reserved shares being insufficient, Mirant would have to issue additional shares of common stock to address the shortfall, which would dilute existing Mirant stockholders, and Mirant and Mirant Americas Generation would have to pay additional cash amounts as necessary under the terms of the Plan to satisfy such pre-petition claims.
California and Western Power Markets (Mirant Americas Generation and Mirant North America)
FERC Refund Proceedings Arising Out of California Energy Crisis. High prices experienced in California and western wholesale electricity markets in 2000 and 2001 caused various purchasers of electricity in those markets to initiate proceedings seeking refunds. Several of those proceedings remain pending either before the FERC or on appeal to the United States Court of Appeals for the Ninth Circuit (the “Ninth Circuit”). The proceedings that remain pending include proceedings (1) ordered by the FERC on July 25, 2001, (the “FERC Refund Proceedings”) to determine the amount of any refunds and amounts owed for sales made by market participants, including Mirant Americas Energy Marketing, in the CAISO or the Cal PX markets from October 2, 2000, through June 20, 2001 (the “Refund Period”), (2) ordered by the FERC to determine whether there had been unjust and unreasonable charges for spot market bilateral sales in the Pacific Northwest from December 25, 2000, through June 20, 2001 (the “Pacific Northwest Proceeding”), and (3) arising from a complaint filed in 2002 by the California Attorney General that sought refunds for transactions conducted in markets administered by the CAISO and the Cal PX outside the Refund Period set by the FERC and for transactions between the DWR and various owners of generation and power marketers, including Mirant Americas Energy Marketing and subsidiaries of Mirant Americas Generation and Mirant North America. Various parties appealed the FERC orders related to these proceedings to the Ninth Circuit seeking review of a number of issues, including changing the Refund Period to include periods prior to October 2, 2000, and expanding the sales of electricity subject to potential refund to include bilateral sales made to the DWR and other parties. Although various of these appeals remain pending, the Ninth Circuit ruled in orders issued on August 2, 2006, and September 9, 2004, that the FERC should consider further whether to grant relief for sales of electricity made in the CAISO and Cal PX markets prior to October 2, 2000, at rates found to be unjust, and, in the proceeding initiated by the California Attorney General, what remedies, including potential refunds, are appropriate where entities, including Mirant Americas Energy Marketing, purportedly did not comply with certain filing requirements for transactions conducted under market-based rate tariffs.
On January 14, 2005, Mirant and certain of its subsidiaries, including Mirant Americas Generation and Mirant North America (the “Mirant Settling Parties”) entered into a Settlement and Release of Claims Agreement (the “California Settlement”) with PG&E, Southern California Edison Company, San Diego Gas and Electric Company, the CPUC, the DWR, the EOB and the Attorney General of the State of California (collectively, the “California Parties”). The California Settlement was approved by the FERC on April 13, 2005, and became effective on April 15, 2005, upon its approval by the Bankruptcy Court. The California Settlement resulted in the release of most of Mirant Americas Energy Marketing’s potential liability (1) in the FERC Refund Proceedings for sales made in the CAISO or the Cal PX markets, (2) in the Pacific Northwest Proceeding, and (3) in any proceedings at the FERC resulting from the complaint filed in 2002 by the California Attorney General. Based on the California Settlement, on April 15, 2008, the FERC dismissed Mirant Americas Energy Marketing and the other subsidiaries of Mirant Americas Generation and Mirant North America from the proceeding initiated by the complaint filed in 2002 by the California Attorney General.
Under the California Settlement, the California Parties and those other market participants who have opted into the settlement have released the Mirant Settling Parties, including Mirant Americas Energy Marketing, from any liability for refunds related to sales of electricity and natural gas in the western markets from January 1, 1998, through July 14, 2003. Also, the California Parties have assumed the obligation of Mirant Americas Energy Marketing to pay any refunds determined by the FERC to be owed by Mirant Americas Energy Marketing to other parties that do not opt into the settlement for transactions in the CAISO and Cal PX markets during the Refund Period, with the liability of the California Parties for such refund obligation limited to the
60
Table of Contents
amount of certain receivables assigned by Mirant Americas Energy Marketing to the California Parties under the California Settlement. The settlement did not relieve Mirant Americas Energy Marketing of liability for any refunds that the FERC determines it to owe (1) to participants in the Cal PX and CAISO markets that did not opt into the settlement for periods outside the Refund Period and (2) to participants in bilateral transactions with Mirant Americas Energy Marketing that did not opt into the settlement.
Resolution of the refund proceedings that remain pending before the FERC or that currently are on appeal to the Ninth Circuit could ultimately result in the FERC concluding that the prices received by Mirant Americas Energy Marketing in some transactions occurring in 2000 and 2001 should be reduced. Mirant Americas Generation’s and Mirant North America’s view is that the bulk of any obligations of Mirant Americas Energy Marketing to make refunds as a result of sales completed prior to July 14, 2003, in the CAISO or Cal PX markets or in bilateral transactions either have been addressed by the California Settlement or have been resolved as part of Mirant Americas Energy Marketing’s bankruptcy proceedings. To the extent that Mirant Americas Energy Marketing’s potential refund liability arises from contracts that were transferred to Mirant Energy Trading as part of the transfer of the trading and marketing business under the Plan, Mirant Energy Trading may have exposure to any refund liability related to transactions under those contracts.
Complaint Challenging Capacity Rates Under the RPM Provisions of PJM’s Tariff
On May 30, 2008, a variety of parties, including the state public utility commissions of Maryland, Pennsylvania, New Jersey and Delaware, ratepayer advocates, certain electric cooperatives, various groups representing industrial electricity users, and federal agencies (the “RPM Buyers”), filed a complaint with the FERC asserting that capacity auctions held to determine capacity payments under the reliability pricing model (“RPM”) provisions of PJM’s tariff had produced rates that were unjust and unreasonable. PJM conducted the capacity auctions that are the subject of the complaint to set the capacity payments in effect under the RPM provisions of its tariff for twelve month periods beginning June 1, 2008, June 1, 2009, and June 1, 2010. The RPM Buyers allege that (i) the times between when the auctions were held and the periods that the resulting capacity rates would be in effect were too short to allow competition from new resources in the auctions, (ii) the administrative process established under the RPM provisions of PJM’s tariff was inadequate to restrain the exercise of market power by the withholding of capacity to increase prices, and (iii) the locational pricing established under the RPM provisions of PJM’s tariff created opportunities for sellers to raise prices while serving no legitimate function. The RPM Buyers asked the FERC to reduce significantly the capacity rates established by the capacity auctions and to set June 1, 2008, as the date beginning on which any rates found by the FERC to be excessive would be subject to refund. If the FERC were to reduce the capacity payments set through the capacity auctions to the rates proposed by the RPM Buyers, the capacity revenue the Companies have received or expect to receive for the period June 1, 2008 through May 31, 2011, would be reduced by approximately $600 million. On September 19, 2008, the FERC issued an order dismissing the complaint. The FERC found that no party had violated the RPM provisions of PJM’s tariff and that the prices determined during the auctions were in accordance with the tariff’s provisions. The RPM Buyers filed a request for rehearing, which the FERC denied on June 18, 2009. Certain of the RPM Buyers have appealed the orders entered by the FERC to the United States Court of Appeals for the Fourth Circuit. That appeal has been transferred to the United States Court of Appeal for the District of Columbia Circuit.
Other Legal Matters
The Companies are involved in various other claims and legal actions arising in the ordinary course of business. Although the Companies cannot predict the outcome and estimate the range of loss, the Companies think that the ultimate disposition of these matters, individually or in aggregate, will not have a material adverse effect on the Companies’ results of operations, financial positions or cash flows.
61
Table of Contents
| J. | Settlements and Other Charges (Mirant Americas Generation, Mirant North America and Mirant Mid-Atlantic) |
Potomac River Settlement
In July 2008, the City of Alexandria, Virginia (in which the Potomac River generating facility is located) and Mirant Potomac River entered into an agreement containing certain terms that were included in a proposed comprehensive state operating permit for the Potomac River generating facility issued by the Virginia DEQ that month. Under that agreement, Mirant Potomac River committed to spend $34 million over several years to reduce particulate emissions. The $34 million was placed in escrow and included in funds on deposit and other noncurrent assets in the accompanying unaudited condensed consolidated balance sheets. At September 30, 2010, the balance in the escrow account was approximately $33 million and is included in the Companies’ estimated capital expenditures for future periods. On July 30, 2008, the Virginia State Air Pollution Control Board approved the comprehensive permit with terms consistent with the agreement between Mirant Potomac and the City of Alexandria, and the Virginia DEQ issued the permit on July 31, 2008.
Prior to the issuance of the comprehensive state operating permit in July 2008, the Potomac River generating facility operated under a state operating permit issued June 1, 2007, that significantly restricted the facility’s operations by imposing stringent limits on its SO2 emissions and constraining unit operations so that no more than three of the facility’s five units could operate at one time. In compliance with the comprehensive permit, in 2008 Mirant Potomac River merged the stacks for units 3, 4 and 5 into one stack at the Potomac River generating facility and, in January 2009, Mirant Potomac River merged the stacks for units 1 and 2 into one stack. With the completion of the stack mergers, the permit issued in July 2008 does not constrain operations of the Potomac River generating facility below historical operations and allows operation of all five units at one time. In July 2010, the Virginia DEQ issued a permit that limits NOx emissions from Mirant Potomac River’s generating facility to 890 tons during the Ozone Season. The Companies think that at current market prices the new limit on NOx emissions during the Ozone Season will not have a material effect upon the Companies’ results of operations, financial positions or cash flows.
Mirant Potrero Settlement Agreement with City of San Francisco (Mirant Americas Generation and Mirant North America)
Mirant Potrero and the City and County of San Francisco, California entered into a Settlement Agreement (the “Potrero Settlement”) dated August 13, 2009. The Potrero Settlement became effective in November 2009 upon its approval by the City’s Board of Supervisors and Mayor. The Potrero Settlement addressed certain disputes that had arisen between the City of San Francisco and Mirant Potrero related to the Potrero generating facility. Among other things, the Potrero Settlement obligates Mirant Potrero to close permanently each of the remaining units of the Potrero generating facility at the end of the year in which the CAISO determines that such unit is no longer needed to maintain the reliable operation of the electricity system. The agreement also bars Mirant Potrero from building any additional generating facilities on the site of the Potrero generating facility. Mirant Potrero expects that the completion of the TransBay Cable project, which is an underwater electric transmission cable in the San Francisco Bay, will eliminate the need for unit 3 of the Potrero generating facility to operate for reliability purposes. The TransBay Cable project has encountered some delays in startup that make it uncertain whether it will become fully operational in 2010. By letter dated January 12, 2010, the CAISO advised the City of San Francisco that the expected replacement in 2010 of two underground transmission cables, if completed successfully, would allow the CAISO not to require the continued operation of the remaining units of the Potrero generating facility, units 4, 5 and 6, for reliability purposes after 2010. In September 2010, the CAISO notified Mirant Potrero that it was designating all four units of the Potrero generating facility as needed for reliability purposes in 2011. If, prior to the end of 2010, the CAISO concludes that the TransBay Cable project is fully operational and the replacement of the two underground transmission cables has been completed, then the CAISO could determine that some or all of the units of the Potrero generating facility are no longer needed for reliability purposes and such units could close by the end of 2010.
62
Table of Contents
| K. | Guarantor/Non-Guarantor Condensed Consolidating Financial Information (Mirant North America) |
Mirant North America’s revolving and term loan credit facilities and 7.375% senior notes are jointly and severally and fully and unconditionally guaranteed on a senior secured basis and senior unsecured basis, respectively, by certain subsidiaries of Mirant North America (all of which are wholly-owned). The accompanying unaudited condensed consolidating financial information has been prepared and presented pursuant to the Securities and Exchange Commission Regulation S-X Rule 3-10, “Financial Statements of Guarantors and Issuers of Guaranteed Securities Registered or being Registered.” This information is not intended to present the financial position, results of operations and cash flows of the individual companies or groups of companies in accordance with GAAP.
The following sets forth unaudited condensed consolidating financial statements of the guarantor and non-guarantor subsidiaries:
MIRANT NORTH AMERICA
GUARANTOR/NON-GUARANTOR
CONDENSED CONSOLIDATING STATEMENTS OF OPERATIONS (UNAUDITED)
Three Months Ended September 30, 2010
(in millions)
| Parent | Guarantor | Non- Guarantor |
Eliminations | Consolidated | ||||||||||||||||
| Operating revenues |
$ | — | $ | 130 | $ | 781 | $ | (136 | ) | $ | 775 | |||||||||
| Cost of fuel, electricity and other products |
— | 68 | 315 | (136 | ) | 247 | ||||||||||||||
| Gross margin |
— | 62 | 466 | — | 528 | |||||||||||||||
| Operating Expenses: |
||||||||||||||||||||
| Operations and maintenance |
— | 44 | 118 | — | 162 | |||||||||||||||
| Depreciation and amortization |
— | 14 | 36 | 2 | 52 | |||||||||||||||
| Gain on sales of assets, net |
— | (1 | ) | — | — | (1 | ) | |||||||||||||
| Total operating expenses, net |
— | 57 | 154 | 2 | 213 | |||||||||||||||
| Operating income |
— | 5 | 312 | (2 | ) | 315 | ||||||||||||||
| Equity earnings of subsidiaries |
(316 | ) | — | — | 316 | — | ||||||||||||||
| Other expense, net |
19 | — | 1 | (1 | ) | 19 | ||||||||||||||
| Income before income taxes |
297 | 5 | 311 | (317 | ) | 296 | ||||||||||||||
| Benefit for income taxes |
— | — | (1 | ) | — | (1 | ) | |||||||||||||
| Net income |
$ | 297 | $ | 5 | $ | 312 | $ | (317 | ) | $ | 297 | |||||||||
63
Table of Contents
MIRANT NORTH AMERICA
GUARANTOR/NON-GUARANTOR
CONDENSED CONSOLIDATING STATEMENTS OF OPERATIONS (UNAUDITED)
Three Months Ended September 30, 2009
(in millions)
| Parent | Guarantor | Non- Guarantor |
Eliminations | Consolidated | ||||||||||||||||
| Operating revenues |
$ | — | $ | 100 | $ | 517 | $ | (163 | ) | $ | 454 | |||||||||
| Cost of fuel, electricity and other products |
— | 33 | 292 | (163 | ) | 162 | ||||||||||||||
| Gross margin |
— | 67 | 225 | — | 292 | |||||||||||||||
| Operating Expenses: |
||||||||||||||||||||
| Operations and maintenance |
— | 42 | 108 | — | 150 | |||||||||||||||
| Depreciation and amortization |
— | 10 | 25 | 1 | 36 | |||||||||||||||
| Impairment losses |
— | 14 | — | — | 14 | |||||||||||||||
| Gain on sales of assets, net |
— | (1 | ) | (2 | ) | — | (3 | ) | ||||||||||||
| Total operating expenses, net |
— | 65 | 131 | 1 | 197 | |||||||||||||||
| Operating income |
— | 2 | 94 | (1 | ) | 95 | ||||||||||||||
| Equity earnings of subsidiaries |
(114 | ) | — | — | 114 | — | ||||||||||||||
| Other expense, net |
20 | 1 | — | (20 | ) | 1 | ||||||||||||||
| Net income |
$ | 94 | $ | 1 | $ | 94 | $ | (95 | ) | $ | 94 | |||||||||
MIRANT NORTH AMERICA
GUARANTOR/NON-GUARANTOR
CONDENSED CONSOLIDATING STATEMENTS OF OPERATIONS (UNAUDITED)
Nine Months Ended September 30, 2010
(in millions)
| Parent | Guarantor | Non- Guarantor |
Eliminations | Consolidated | ||||||||||||||||
| Operating revenues |
$ | — | $ | 313 | $ | 1,889 | $ | (303 | ) | $ | 1,899 | |||||||||
| Cost of fuel, electricity and other products |
— | 142 | 887 | (303 | ) | 726 | ||||||||||||||
| Gross margin |
— | 171 | 1,002 | — | 1,173 | |||||||||||||||
| Operating Expenses: |
||||||||||||||||||||
| Operations and maintenance |
— | 133 | 353 | — | 486 | |||||||||||||||
| Depreciation and amortization |
— | 41 | 105 | 5 | 151 | |||||||||||||||
| Gain on sales of assets, net |
— | (1 | ) | (3 | ) | — | (4 | ) | ||||||||||||
| Total operating expenses, net |
— | 173 | 455 | 5 | 633 | |||||||||||||||
| Operating income (loss) |
— | (2 | ) | 547 | (5 | ) | 540 | |||||||||||||
| Equity earnings of subsidiaries |
(541 | ) | — | — | 541 | — | ||||||||||||||
| Other expense, net |
60 | — | 4 | (4 | ) | 60 | ||||||||||||||
| Income (loss) before income taxes |
481 | (2 | ) | 543 | (542 | ) | 480 | |||||||||||||
| Benefit for income taxes |
— | — | (1 | ) | — | (1 | ) | |||||||||||||
| Net income (loss) |
$ | 481 | $ | (2 | ) | $ | 544 | $ | (542 | ) | $ | 481 | ||||||||
64
Table of Contents
MIRANT NORTH AMERICA
GUARANTOR/NON-GUARANTOR
CONDENSED CONSOLIDATING STATEMENTS OF OPERATIONS (UNAUDITED)
Nine Months Ended September 30, 2009
(in millions)
| Parent | Guarantor | Non- Guarantor |
Eliminations | Consolidated | ||||||||||||||||
| Operating revenues |
$ | (3 | ) | $ | 378 | $ | 1,898 | $ | (445 | ) | $ | 1,828 | ||||||||
| Cost of fuel, electricity and other products |
— | 146 | 882 | (445 | ) | 583 | ||||||||||||||
| Gross margin |
(3 | ) | 232 | 1,016 | — | 1,245 | ||||||||||||||
| Operating Expenses: |
||||||||||||||||||||
| Operations and maintenance |
— | 150 | 318 | — | 468 | |||||||||||||||
| Depreciation and amortization |
— | 28 | 74 | 2 | 104 | |||||||||||||||
| Impairment losses |
— | 14 | — | — | 14 | |||||||||||||||
| Gain on sales of assets, net |
(4 | ) | (4 | ) | (12 | ) | — | (20 | ) | |||||||||||
| Total operating expenses (income), net |
(4 | ) | 188 | 380 | 2 | 566 | ||||||||||||||
| Operating income |
1 | 44 | 636 | (2 | ) | 679 | ||||||||||||||
| Equity earnings of subsidiaries |
(727 | ) | — | — | 727 | — | ||||||||||||||
| Other expense, net |
62 | 2 | 2 | (53 | ) | 13 | ||||||||||||||
| Net income |
$ | 666 | $ | 42 | $ | 634 | $ | (676 | ) | $ | 666 | |||||||||
65
Table of Contents
MIRANT NORTH AMERICA
GUARANTOR/NON-GUARANTOR
CONDENSED CONSOLIDATING BALANCE SHEETS (UNAUDITED)
At September 30, 2010
(in millions)
| Parent | Guarantor | Non- Guarantor |
Eliminations | Consolidated | ||||||||||||||||
| ASSETS |
||||||||||||||||||||
| Current Assets: |
||||||||||||||||||||
| Cash and cash equivalents |
$ | 80 | $ | — | $ | 438 | $ | — | $ | 518 | ||||||||||
| Funds on deposit |
124 | — | 81 | — | 205 | |||||||||||||||
| Receivables—nonaffiliate |
— | 2 | 264 | — | 266 | |||||||||||||||
| Receivables—affiliate |
— | 48 | 20 | (58 | ) | 10 | ||||||||||||||
| Notes receivable—affiliate |
45 | 103 | — | (55 | ) | 93 | ||||||||||||||
| Derivative contract assets—nonaffiliate |
— | — | 2,132 | — | 2,132 | |||||||||||||||
| Derivative contract assets—affiliate |
— | 51 | 43 | (94 | ) | — | ||||||||||||||
| Inventories |
— | 30 | 231 | — | 261 | |||||||||||||||
| Prepaid rent and other payments |
— | 11 | 108 | — | 119 | |||||||||||||||
| Total current assets |
249 | 245 | 3,317 | (207 | ) | 3,604 | ||||||||||||||
| Property, Plant and Equipment, net |
— | 430 | 3,011 | 144 | 3,585 | |||||||||||||||
| Noncurrent Assets: |
||||||||||||||||||||
| Goodwill, net |
(616 | ) | — | 616 | — | — | ||||||||||||||
| Intangible assets, net |
— | 30 | 134 | — | 164 | |||||||||||||||
| Derivative contract assets—nonaffiliate |
— | — | 960 | — | 960 | |||||||||||||||
| Derivative contract assets—affiliate |
— | 8 | 9 | (17 | ) | — | ||||||||||||||
| Prepaid rent |
— | — | 334 | — | 334 | |||||||||||||||
| Debt issuance costs, net |
17 | — | — | — | 17 | |||||||||||||||
| Investments in subsidiaries |
6,249 | — | — | (6,249 | ) | — | ||||||||||||||
| Other |
— | 21 | 20 | — | 41 | |||||||||||||||
| Total noncurrent assets |
5,650 | 59 | 2,073 | (6,266 | ) | 1,516 | ||||||||||||||
| Total Assets |
$ | 5,899 | $ | 734 | $ | 8,401 | $ | (6,329 | ) | $ | 8,705 | |||||||||
| LIABILITIES AND MEMBER’S EQUITY |
||||||||||||||||||||
| Current Liabilities: |
||||||||||||||||||||
| Current portion of long-term debt |
$ | 48 | $ | — | $ | 4 | $ | — | $ | 52 | ||||||||||
| Notes payable—affiliate |
11 | 44 | — | (55 | ) | — | ||||||||||||||
| Accounts payable and accrued liabilities |
16 | 16 | 458 | — | 490 | |||||||||||||||
| Payable—affiliate |
— | 29 | 60 | (58 | ) | 31 | ||||||||||||||
| Derivative contract liabilities—nonaffiliate |
— | — | 1,832 | — | 1,832 | |||||||||||||||
| Derivative contract liabilities—affiliate |
— | 43 | 51 | (94 | ) | — | ||||||||||||||
| Other |
— | 12 | 9 | — | 21 | |||||||||||||||
| Total current liabilities |
75 | 144 | 2,414 | (207 | ) | 2,426 | ||||||||||||||
| Noncurrent Liabilities: |
||||||||||||||||||||
| Long-term debt, net of current portion |
1,107 | — | 18 | — | 1,125 | |||||||||||||||
| Derivative contract liabilities—nonaffiliate |
— | — | 379 | — | 379 | |||||||||||||||
| Derivative contract liabilities—affiliate |
— | 9 | 8 | (17 | ) | — | ||||||||||||||
| Other |
— | 38 | 20 | — | 58 | |||||||||||||||
| Total noncurrent liabilities |
1,107 | 47 | 425 | (17 | ) | 1,562 | ||||||||||||||
| Commitments and Contingencies |
||||||||||||||||||||
| Member’s Equity |
4,717 | 543 | 5,562 | (6,105 | ) | 4,717 | ||||||||||||||
| Total Liabilities and Member’s Equity |
$ | 5,899 | $ | 734 | $ | 8,401 | $ | (6,329 | ) | $ | 8,705 | |||||||||
66
Table of Contents
MIRANT NORTH AMERICA
GUARANTOR/NON-GUARANTOR
CONDENSED CONSOLIDATING BALANCE SHEETS (UNAUDITED)
At December 31, 2009
(in millions)
| Parent | Guarantor | Non- Guarantor |
Eliminations | Consolidated | ||||||||||||||||
| ASSETS |
||||||||||||||||||||
| Current Assets: |
||||||||||||||||||||
| Cash and cash equivalents |
$ | 78 | $ | — | $ | 325 | $ | — | $ | 403 | ||||||||||
| Funds on deposit |
124 | — | 56 | — | 180 | |||||||||||||||
| Receivables—nonaffiliate |
— | 8 | 393 | — | 401 | |||||||||||||||
| Receivables—affiliate |
— | 53 | 23 | (67 | ) | 9 | ||||||||||||||
| Notes receivable—affiliate |
25 | 105 | — | (37 | ) | 93 | ||||||||||||||
| Derivative contract assets—nonaffiliate |
— | — | 1,416 | — | 1,416 | |||||||||||||||
| Derivative contract assets—affiliate |
— | 45 | 26 | (71 | ) | — | ||||||||||||||
| Inventories |
— | 31 | 210 | — | 241 | |||||||||||||||
| Prepaid rent and other payments |
— | 12 | 122 | — | 134 | |||||||||||||||
| Total current assets |
227 | 254 | 2,571 | (175 | ) | 2,877 | ||||||||||||||
| Property, Plant and Equipment, net |
— | 454 | 3,005 | 145 | 3,604 | |||||||||||||||
| Noncurrent Assets: |
||||||||||||||||||||
| Goodwill, net |
(616 | ) | — | 616 | — | — | ||||||||||||||
| Intangible assets, net |
— | 33 | 138 | — | 171 | |||||||||||||||
| Derivative contract assets—nonaffiliate |
— | — | 599 | — | 599 | |||||||||||||||
| Derivative contract assets—affiliate |
— | 7 | 2 | (9 | ) | — | ||||||||||||||
| Prepaid rent |
— | — | 304 | — | 304 | |||||||||||||||
| Debt issuance costs, net |
23 | — | — | — | 23 | |||||||||||||||
| Investments in subsidiaries |
5,933 | — | — | (5,933 | ) | — | ||||||||||||||
| Other |
— | 12 | 20 | — | 32 | |||||||||||||||
| Total noncurrent assets |
5,340 | 52 | 1,679 | (5,942 | ) | 1,129 | ||||||||||||||
| Total Assets |
$ | 5,567 | $ | 760 | $ | 7,255 | $ | (5,972 | ) | $ | 7,610 | |||||||||
| LIABILITIES AND MEMBER’S EQUITY |
||||||||||||||||||||
| Current Liabilities: |
||||||||||||||||||||
| Current portion of long-term debt |
$ | 70 | $ | — | $ | 4 | $ | — | $ | 74 | ||||||||||
| Notes payable—affiliate |
14 | 23 | — | (37 | ) | — | ||||||||||||||
| Accounts payable and accrued liabilities |
1 | 22 | 598 | — | 621 | |||||||||||||||
| Payable—affiliate |
— | 35 | 74 | (67 | ) | 42 | ||||||||||||||
| Derivative contract liabilities—nonaffiliate |
— | — | 1,150 | — | 1,150 | |||||||||||||||
| Derivative contract liabilities—affiliate |
— | 26 | 45 | (71 | ) | — | ||||||||||||||
| Other |
— | 5 | 3 | — | 8 | |||||||||||||||
| Total current liabilities |
85 | 111 | 1,874 | (175 | ) | 1,895 | ||||||||||||||
| Noncurrent Liabilities: |
||||||||||||||||||||
| Long-term debt, net of current portion |
1,153 | — | 21 | — | 1,174 | |||||||||||||||
| Derivative contract liabilities—nonaffiliate |
— | — | 163 | — | 163 | |||||||||||||||
| Derivative contract liabilities—affiliate |
— | 2 | 7 | (9 | ) | — | ||||||||||||||
| Other |
— | 32 | 17 | — | 49 | |||||||||||||||
| Total noncurrent liabilities |
1,153 | 34 | 208 | (9 | ) | 1,386 | ||||||||||||||
| Commitments and Contingencies |
||||||||||||||||||||
| Member’s Equity |
4,329 | 615 | 5,173 | (5,788 | ) | 4,329 | ||||||||||||||
| Total Liabilities and Member’s Equity |
$ | 5,567 | $ | 760 | $ | 7,255 | $ | (5,972 | ) | $ | 7,610 | |||||||||
67
Table of Contents
MIRANT NORTH AMERICA
GUARANTOR/NON-GUARANTOR
CONDENSED CONSOLIDATING STATEMENT OF CASH FLOWS (UNAUDITED)
Nine Months Ended September 30, 2010
(in millions)
| Parent | Guarantor | Non- Guarantor |
Eliminations | Consolidated | ||||||||||||||||
| Cash Flows provided by (used in): |
||||||||||||||||||||
| Operating activities |
$ | 214 | $ | 56 | $ | 460 | $ | (248 | ) | $ | 482 | |||||||||
| Investing activities |
(24 | ) | (76 | ) | (190 | ) | 87 | (203 | ) | |||||||||||
| Financing activities |
(188 | ) | 20 | (157 | ) | 161 | (164 | ) | ||||||||||||
| Net increase in cash and cash equivalents |
2 | — | 113 | — | 115 | |||||||||||||||
| Cash and cash equivalents, beginning of period |
78 | — | 325 | — | 403 | |||||||||||||||
| Cash and cash equivalents, end of period |
$ | 80 | $ | — | $ | 438 | $ | — | $ | 518 | ||||||||||
MIRANT NORTH AMERICA
GUARANTOR/NON-GUARANTOR
CONDENSED CONSOLIDATING STATEMENT OF CASH FLOWS (UNAUDITED)
Nine Months Ended September 30, 2009
(in millions)
| Parent | Guarantor | Non- Guarantor |
Eliminations | Consolidated | ||||||||||||||||
| Cash Flows provided by (used in): |
||||||||||||||||||||
| Operating activities |
$ | 118 | $ | 55 | $ | 683 | $ | (118 | ) | $ | 738 | |||||||||
| Investing activities |
(58 | ) | (79 | ) | (436 | ) | 94 | (479 | ) | |||||||||||
| Financing activities |
(43 | ) | 24 | (44 | ) | 24 | (39 | ) | ||||||||||||
| Net increase in cash and cash equivalents |
17 | — | 203 | — | 220 | |||||||||||||||
| Cash and cash equivalents, beginning of period |
101 | — | 253 | — | 354 | |||||||||||||||
| Cash and cash equivalents, end of period |
$ | 118 | $ | — | $ | 456 | $ | — | $ | 574 | ||||||||||
68
Table of Contents
| Item 2. | Management’s Discussion and Analysis of Results of Operations and Financial Condition |
| A. | Mirant Americas Generation |
The following discussion should be read in conjunction with the unaudited condensed consolidated financial statements of Mirant Americas Generation and the notes thereto, which are included elsewhere in this report.
Overview
Mirant Americas Generation, an indirect wholly-owned subsidiary of Mirant, is a competitive energy company that produces and sells electricity in the United States. Mirant Americas Generation owns or leases 10,076 MW of net electric generating capacity in the Mid-Atlantic and Northeast regions and in California. Mirant Americas Generation also operates an integrated asset management and energy marketing organization based in Atlanta, Georgia.
Mirant’s Proposed Merger with RRI Energy
On April 11, 2010, Mirant entered into the Merger Agreement with RRI Energy and RRI Energy Holdings, Inc. (“Merger Sub”), a direct and wholly-owned subsidiary of RRI Energy. Upon the terms and subject to the conditions set forth in the Merger Agreement, which has been unanimously approved by each of the boards of directors of Mirant and RRI Energy, Merger Sub will merge with and into Mirant, with Mirant continuing as the surviving corporation and a wholly-owned subsidiary of RRI Energy. Mirant and RRI Energy have satisfied many of the conditions to the completion of the merger, including stockholder approval on October 25, 2010, of the proposals related to the merger. Mirant anticipates completing the merger before the end of 2010.
Completion of the merger is subject to each of Mirant and RRI Energy receiving legal opinions that the merger will qualify as a tax-free reorganization under the Internal Revenue Code of 1986, as amended. Under a tax-free reorganization, none of RRI Energy, Merger Sub, Mirant or any of the Mirant stockholders will recognize any gain or loss in the transaction, except that Mirant stockholders will recognize a gain or loss with respect to cash received in lieu of fractional shares of RRI Energy common stock. Pursuant to the Merger Agreement, upon the closing of the merger, each issued and outstanding share of Mirant common stock, including grants of restricted common stock, automatically will be converted into shares of common stock of RRI Energy based on the Exchange Ratio. Additionally, upon the closing of the merger, RRI Energy will be renamed GenOn Energy. Mirant stock options and other equity awards generally will convert upon completion of the merger into stock options and equity awards with respect to RRI Energy common stock, after giving effect to the Exchange Ratio. As a result of the merger, Mirant stockholders will own approximately 54% of the equity of the combined company and RRI Energy stockholders will own approximately 46%.
Mirant and RRI Energy have satisfied many of the conditions to completion of the merger, including:
| • | stockholder approval on October 25, 2010, of the proposals related to the merger; |
| • | FERC approval of the merger by order dated August 2, 2010; and |
| • | the receipt of the New York State Public Service Commission’s (the “NYPSC”) order dated July 20, 2010, declaring that it will not further review the merger. |
The primary remaining condition to closing the merger is completion by the Department of Justice (the “DOJ”) of its review and clearance under the Hart-Scott-Rodino Act. On June 14, 2010, Mirant and RRI Energy filed notification of the proposed transaction with the Federal Trade Commission and the DOJ under the Hart-Scott-Rodino Act. On July 15, 2010, we received a request for additional information from the DOJ, and Mirant has provided the DOJ the information requested.
69
Table of Contents
On September 20, 2010, RRI Energy entered into a new senior secured revolving credit facility and a new senior secured term loan. The funding of the term loan facility and the availability of borrowings and letters of credit under the revolving credit facility are subject to the closing of the merger and the satisfaction of the conditions precedent thereto. On October 4, 2010, Mirant and RRI Energy closed on new senior notes. Under the terms of the indenture agreement, the senior notes were issued by GenOn Escrow, a wholly-owned subsidiary of Mirant, and the proceeds were placed into escrow. Upon completion of the merger, GenOn Escrow will merge with and into RRI Energy. The new GenOn Energy debt financing and revolving credit facility will be used, in part, to discharge and redeem the Mirant North America senior unsecured notes and to repay and terminate the Mirant North America senior secured term loan and revolving credit facility.
The new senior secured revolving credit facility and the new senior secured term loan, and the subsidiary guarantees thereof, will be senior secured obligations of RRI Energy and certain of its existing and future direct and indirect subsidiaries, excluding us; provided, however, that our subsidiaries (other than Mirant Mid-Atlantic and Mirant Energy Trading and their subsidiaries) will guarantee the new senior secured revolving credit facility and the new senior secured term loan to the extent permitted under the indenture for our senior notes. See Note D to our unaudited condensed consolidated financial statements contained elsewhere in this report for additional information on Mirant North America’s debt subject to refinancing.
Both Mirant and RRI Energy are subject to restrictions on their ability to solicit alternative acquisition proposals, provide information and engage in discussions with third parties, except under limited circumstances to permit Mirant’s and RRI Energy’s boards of directors to comply with their fiduciary duties. The Merger Agreement contains certain termination rights for both Mirant and RRI Energy, and further provides that, upon termination of the Merger Agreement under specified circumstances, Mirant or RRI Energy may be required to pay the other a termination fee of either $37.15 million or $57.78 million. Further information concerning Mirant’s proposed merger was included in a joint proxy statement/prospectus contained in the registration statement on Form S-4 filed by RRI Energy with the SEC on May 28, 2010, and amended on July 6, 2010, August 12, 2010, September 8, 2010 and September 13, 2010.
Provided neither has experienced an ownership change between December 31, 2009, and the closing date of the merger, each of Mirant and RRI Energy is expected separately to experience an ownership change, as defined in Section (“§”) 382 of the Internal Revenue Code of 1986, on the merger date as a consequence of the merger. Immediately following the merger, Mirant and RRI Energy will be members of the same consolidated federal income tax group. The ability of this consolidated tax group to deduct the pre-merger NOL carry forwards of Mirant and RRI Energy against the post-merger taxable income of the group will be substantially limited as a result of these ownership changes. See Note A to our unaudited condensed consolidated financial statements contained elsewhere in this report for additional information on Mirant’s proposed merger and the effect on the NOLs.
Prior to the completion of the merger, Mirant and RRI Energy will continue to operate as independent companies. Except for specific references to Mirant’s proposed merger and the associated debt financing transactions, the disclosures contained in this report on Form 10-Q relate solely to Mirant and the Companies.
Hedging Activities
We hedge economically a substantial portion of our Mid-Atlantic coal-fired baseload generation and certain of our Mid-Atlantic and Northeast gas and oil-fired generation through OTC transactions. However, we generally do not hedge our intermediate and peaking units for tenors greater than 12 months. We hedge using products which we expect to be effective to mitigate the price risk of our generation. However, as a result of market liquidity limitations, our hedges often are not an exact match for the generation being hedged, and we then have some risks resulting from price differentials for different delivery points and for implied differences in heat rates when we hedge power using natural gas. A majority of our hedges are financial swap transactions between Mirant Mid-Atlantic and financial counterparties that are senior unsecured obligations of such parties and do not
70
Table of Contents
require either party to post cash collateral either for initial margin or for securing exposure as a result of changes in power or natural gas prices. At October 12, 2010, our aggregate hedge levels based on expected generation for the remainder of 2010 and subsequent years were as follows:
| Aggregate Hedge Levels Based on Expected Generation | ||||||||||||||||||||
| 2010 | 2011 | 2012 | 2013 | 2014 | ||||||||||||||||
| Power |
100 | % | 79 | % | 75 | % | 35 | % | 36 | % | ||||||||||
| Fuel |
91 | % | 84 | % | 76 | % | 50 | % | — | % | ||||||||||
The Dodd-Frank Act, which was enacted in July 2010 in response to the global financial crisis, increases the regulation of transactions involving OTC derivative financial instruments. The statute provides that standardized swap transactions between dealers and large market participants will have to be cleared and traded on an exchange or electronic platform. Although the legislative history of the Dodd-Frank Act, including a letter from Senators Dodd and Lincoln, provides strong evidence that market participants, such as Mirant Americas Generation, that utilize OTC derivative financial instruments to hedge commercial risks are not to be subject to these clearing and other requirements, it is uncertain what the implementing regulations to be issued by the Commodities Futures Trading Commission (“CFTC”) will provide. Greater regulation of OTC derivative financial instruments could materially affect our ability to hedge economically our generation by reducing liquidity in the energy and commodity markets, increasing hedge pricing through the imposition of capital requirements on our swap counterparties, and if we are required to clear such transactions on exchanges, by significantly increasing our requirements for cash collateral.
Capital Expenditures and Capital Resources
For the nine months ended September 30, 2010, we invested $204 million for capital expenditures, excluding capitalized interest, of which $109 million related to compliance with the Maryland Healthy Air Act. As of September 30, 2010, we have invested approximately $1.514 billion for capital expenditures related to compliance with the Maryland Healthy Air Act. As the final part of our compliance with the Maryland Healthy Air Act, we placed our scrubbers in service in the fourth quarter of 2009. Provisions in our construction contracts for the scrubbers provide for certain payments to be made after final completion of the project. The current budget of $1.674 billion continues to represent our best estimate of the total capital expenditures for compliance with the Maryland Healthy Air Act. See Note I to our unaudited condensed consolidated financial statements contained elsewhere in this report for further discussion of scrubber contract issues.
For the nine months ended September 30, 2010, our capitalized interest was approximately $4 million compared to $53 million for the same period in 2009. The decrease in capitalized interest from prior periods is a result of placing our scrubbers in service in the fourth quarter of 2009.
The following table details the expected timing of payments for our estimated capital expenditures, excluding capitalized interest, for the remainder of 2010 and for 2011 (in millions):
| 2010 | 2011 | |||||||
| Maryland Healthy Air Act |
$ | 67 | $ | 93 | ||||
| Other environmental |
3 | 24 | ||||||
| Maintenance |
33 | 47 | ||||||
| Other construction |
7 | 51 | ||||||
| Other |
3 | 4 | ||||||
| Total |
$ | 113 | $ | 219 | ||||
We expect that available cash, proceeds from redemption of preferred shares in Mirant Americas and future cash flows from operations will be sufficient to fund the remainder of these capital expenditures.
71
Table of Contents
Scrubber Operating Expenses
Our capital expenditures related to compliance with the Maryland Healthy Air Act included the installation of scrubbers in the fourth quarter of 2009 at our Chalk Point, Dickerson and Morgantown coal-fired units. We incur additional operations and maintenance expenses associated with operating the scrubbers. Examples of these costs include limestone, water and chemicals used during the removal of SO2 emissions, and handling and marketing related to the recyclable gypsum byproduct created during the scrubbing process. The gypsum is sold to third parties for use in drywall production. In addition, we recognize higher depreciation expense because the scrubbers were placed in service in December 2009, and we began depreciating the capitalized costs associated with them over their expected life or, for the leased Dickerson and Morgantown generating units, their remaining lease term.
Commodity Prices
The prices for power and natural gas remain low compared to several years ago. The energy gross margin from our baseload coal units is negatively affected by these price levels. However, we are generally economically neutral for that portion of the generation volumes that we have hedged because our realized gross margin will reflect the contractual prices of our power and fuel contracts. We continue to add hedges opportunistically, including to maintain projected levels of cash flows from operations for future periods to help support continued compliance with the covenants in Mirant North America’s debt and Mirant Mid-Atlantic’s lease agreements.
As a result of the installation of the pollution control equipment at our Maryland generating facilities, we have excess SO2 and NOx emissions allowances. In August 2010, the EPA proposed a replacement for the CAIR. The market prices for SO2 and NOx emissions allowances declined as a result of the proposed rule. As a result, the estimated fair value of our projected excess SO2 and NOx emissions allowances is immaterial. See “Environmental and Regulatory Matters” later in this Item 2 for further information on the EPA’s proposed replacement of the CAIR.
California Development Activities
Contra Costa Toll Extension
On September 2, 2009, Mirant Delta entered into an agreement with PG&E for the 674 MW of Contra Costa units 6 and 7 for the period from November 2011 through April 2013. At the end of the agreement, and subject to any necessary regulatory approval, Mirant Delta has agreed to retire Contra Costa units 6 and 7, which began operations in 1964, in furtherance of state and federal policies to retire aging power plants that utilize once-through cooling technology. The Mirant Delta agreement became effective on September 30, 2010.
Pittsburg Toll Extension
On October 28, 2010, Mirant Delta entered into an agreement with PG&E for 1,159 MW of capacity from Pittsburg units 5, 6 and 7 for three years commencing January 1, 2011, with options for PG&E to extend the agreement for each of 2014 and 2015. Under the agreement, Mirant Delta will receive monthly capacity payments with bonuses and/or penalties based on heat rate and availability. The agreement with PG&E was effective upon the execution of the contract.
Potrero Settlement Agreement
On August 13, 2009, Mirant Potrero entered into a Settlement Agreement (“the Potrero Settlement”) with the City and County of San Francisco. Among other things, the Potrero Settlement obligates Mirant Potrero to close permanently each of the remaining units of the Potrero generating facility at the end of the year in which the CAISO determines that such unit is no longer needed to maintain the reliable operation of the electricity system. In September 2010, the CAISO notified Mirant Potrero that it was designating all four units of the
72
Table of Contents
Potrero generating facility as needed for reliability purposes in 2011. If, prior to the end of 2010, the CAISO concludes that the TransBay Cable project is fully operational and the replacement of the two underground transmission cables has been completed, then the CAISO could determine that some or all of the units of the Potrero generating facility are no longer needed for reliability purposes and such units could close by the end of 2010. See Note J to our unaudited condensed consolidated financial statements contained elsewhere in this report for further discussion of the Potrero Settlement.
Mid-Atlantic Collective Bargaining Agreement
During the second quarter of 2010, Mirant Services entered into a new collective bargaining agreement with the Mid-Atlantic employees represented by IBEW Local 1900. The previous collective bargaining agreement expired on June 1, 2010. The new agreement has a five-year term expiring on June 1, 2015. As part of the new agreement, Mirant Services is required to provide additional retirement contributions through the defined contribution plan currently sponsored by Mirant Services, increases in pay and other benefits. In addition, the new agreement provides for a change to the postretirement healthcare benefit plan covering Mid-Atlantic union employees to eliminate employer-provided healthcare subsidies through a gradual phase-out. We will reimburse Mirant Services for the costs associated with providing the benefits through the Administrative Services Agreement. See Note F to our unaudited condensed consolidated financial statements contained elsewhere in this report for further discussion of arrangements with related parties.
Results of Operations
The following discussion of our performance is organized by reportable segment, which is consistent with the way we manage our business.
In the tables below, the Mid-Atlantic region includes our Chalk Point, Dickerson, Morgantown and Potomac River generating facilities. The Northeast region includes our Bowline, Canal, Kendall and Martha’s Vineyard generating facilities. The California region includes our Contra Costa, Pittsburg and Potrero generating facilities. Other Operations includes proprietary trading and fuel oil management activities. Other Operations also includes interest expense on debt at Mirant Americas Generation and Mirant North America and interest income on our invested cash balances.
73
Table of Contents
Three Months Ended September 30, 2010 versus Three Months Ended September 30, 2009
Consolidated Financial Performance
We reported net income of $266 million and $63 million for the three months ended September 30, 2010 and 2009, respectively. The change in net income is detailed as follows (in millions):
| Three Months Ended September 30, |
Increase/ (Decrease) |
|||||||||||
| 2010 | 2009 | |||||||||||
| Realized gross margin |
$ | 361 | $ | 466 | $ | (105 | ) | |||||
| Unrealized gross margin |
167 | (174 | ) | 341 | ||||||||
| Total gross margin |
528 | 292 | 236 | |||||||||
| Operating Expenses: |
||||||||||||
| Operations and maintenance—nonaffiliate |
88 | 77 | 11 | |||||||||
| Operations and maintenance—affiliate |
74 | 73 | 1 | |||||||||
| Depreciation and amortization |
52 | 36 | 16 | |||||||||
| Impairment losses |
— | 14 | (14 | ) | ||||||||
| Gain on sales of assets, net |
(1 | ) | (3 | ) | 2 | |||||||
| Total operating expenses, net |
213 | 197 | 16 | |||||||||
| Operating income |
315 | 95 | 220 | |||||||||
| Total other expense, net |
50 | 32 | 18 | |||||||||
| Income before income taxes |
265 | 63 | 202 | |||||||||
| Benefit for income taxes |
(1 | ) | — | (1 | ) | |||||||
| Net income |
$ | 266 | $ | 63 | $ | 203 | ||||||
The following discussion includes non-GAAP financial measures because we present our consolidated financial performance in terms of gross margin. Gross margin is our operating revenue less cost of fuel, electricity and other products, and excludes depreciation and amortization. We present gross margin, excluding depreciation and amortization, as well as its two components—realized gross margin and unrealized gross margin—in order to be consistent with how we manage our business. Realized gross margin and unrealized gross margin are both non-GAAP financial measures. Realized gross margin represents our gross margin less unrealized gains and losses on derivative financial instruments for the periods presented. Conversely, unrealized gross margin is our unrealized gains and losses on derivative financial instruments for the periods presented. Management generally evaluates our operating results excluding the impact of unrealized gains and losses. None of our derivative financial instruments recorded at fair value is designated as a hedge and changes in their fair values are recognized currently in income as unrealized gains or losses. As a result, our financial results are, at times, volatile and subject to fluctuations in value primarily because of changes in forward electricity and fuel prices. Adjusting our gross margin to exclude unrealized gains and losses provides a measure of performance that eliminates the volatility created by significant shifts in market values between periods. However, our realized and unrealized gross margin may not be comparable to similarly titled non-GAAP financial measures used by other companies. We encourage our investors to review our unaudited condensed consolidated financial statements and other publicly filed reports in their entirety and not to rely on a single financial measure.
For the three months ended September 30, 2010, our realized gross margin decrease of $105 million was principally a result of the following:
| • | a decrease of $192 million in realized value of hedges. In 2010 and 2009, realized value of hedges was $55 million and $247 million, respectively, which reflects the amount by which the settlement value of power contracts exceeded market prices for power, offset in part by the amount by which contract prices for fuel exceeded market prices for fuel; and |
74
Table of Contents
| • | a decrease of $12 million in contracted and capacity primarily related to lower average capacity prices in the Mid-Atlantic; partially offset by |
| • | an increase of $99 million in energy, primarily as a result of an increase in the average settlement price for power, an increase in generation volumes in the Mid-Atlantic and the Northeast and a decrease in the cost of emissions allowances, offset in part by a decrease in realized gross margin from proprietary trading activities and an increase in the price of fuel. |
Our unrealized gross margin for both periods reflects the following:
| • | unrealized gains of $167 million in 2010, which included a $243 million net increase in the value of hedge and proprietary trading contracts for future periods primarily related to decreases in forward power and natural gas prices and increases in forward coal prices, partially offset by unrealized losses of $76 million from power and fuel contracts that settled during the period for which net unrealized gains had been recorded in prior periods; and |
| • | unrealized losses of $174 million in 2009, which included unrealized losses of $233 million from power and fuel contracts that settled during the period for which net unrealized gains had been recorded in prior periods, partially offset by a $59 million net increase in the value of hedge and proprietary trading contracts for future periods primarily related to decreases in forward power and natural gas prices. |
Operating Expenses
Our operating expense increase of $16 million was primarily a result of the following:
| • | an increase of $12 million in operations and maintenance expense primarily as a result of an increase in costs related to the operation of our scrubbers and the Montgomery County, Maryland CO2 levy imposed on our Dickerson generating facility beginning in May 2010; |
| • | an increase of $16 million in depreciation and amortization expense primarily as a result of the scrubbers that were placed in service in December 2009; and |
| • | a decrease of $2 million in gain on sales of assets primarily related to emissions allowances sold to third parties in 2009; partially offset by |
| • | a decrease of $14 million in impairment related to impairment losses on intangible assets related to our Potrero and Contra Costa generating facilities during 2009. See Note C to our unaudited condensed consolidated financial statements contained elsewhere in this report for additional information related to our impairment reviews. |
Other Expense, Net
The increase of $18 million primarily reflects higher interest expense as a result of lower capitalized interest because of the scrubbers that were placed in service in December 2009.
75
Table of Contents
Gross Margin Overview
The following tables detail realized and unrealized gross margin for the three months ended September 30, 2010 and 2009, by operating segments (in millions):
| Three Months Ended September 30, 2010 | ||||||||||||||||||||||||
| Mid- Atlantic |
Northeast | California | Other Operations |
Eliminations | Total | |||||||||||||||||||
| Energy |
$ | 151 | $ | 14 | $ | — | $ | 6 | $ | — | $ | 171 | ||||||||||||
| Contracted and capacity |
83 | 20 | 32 | — | — | 135 | ||||||||||||||||||
| Realized value of hedges |
58 | (3 | ) | — | — | — | 55 | |||||||||||||||||
| Total realized gross margin |
292 | 31 | 32 | 6 | — | 361 | ||||||||||||||||||
| Unrealized gross margin |
179 | (2 | ) | — | (10 | ) | — | 167 | ||||||||||||||||
| Total gross margin |
$ | 471 | $ | 29 | $ | 32 | $ | (4 | ) | $ | — | $ | 528 | |||||||||||
| Three Months Ended September 30, 2009 | ||||||||||||||||||||||||
| Mid- Atlantic |
Northeast | California | Other Operations |
Eliminations | Total | |||||||||||||||||||
| Energy |
$ | 33 | $ | 3 | $ | — | $ | 36 | $ | — | $ | 72 | ||||||||||||
| Contracted and capacity |
90 | 24 | 33 | — | — | 147 | ||||||||||||||||||
| Realized value of hedges |
214 | 33 | — | — | — | 247 | ||||||||||||||||||
| Total realized gross margin |
337 | 60 | 33 | 36 | — | 466 | ||||||||||||||||||
| Unrealized gross margin |
(124 | ) | (26 | ) | — | (24 | ) | — | (174 | ) | ||||||||||||||
| Total gross margin |
$ | 213 | $ | 34 | $ | 33 | $ | 12 | $ | — | $ | 292 | ||||||||||||
Energy represents gross margin from the generation of electricity, fuel sales and purchases at market prices, fuel handling, steam sales and our proprietary trading and fuel oil management activities.
Contracted and capacity represents gross margin received from capacity sold in ISO and RTO administered capacity markets, through RMR contracts, through tolling agreements and from ancillary services.
Realized value of hedges represents the actual margin upon the settlement of our power and fuel hedging contracts and the difference between market prices and contract costs for coal. Power hedging contracts include sales of both power and natural gas used to hedge power prices, as well as hedges to capture the incremental value related to the geographic location of our physical assets.
Unrealized gross margin represents the net unrealized gain or loss on our derivative contracts, including the reversal of unrealized gains and losses recognized in prior periods and changes in value for future periods.
Operating Statistics
The following table summarizes Net Capacity Factor by region for the three months ended September 30, 2010 and 2009:
| Three Months Ended September 30, |
Increase/ (Decrease) |
|||||||||||
| 2010 | 2009 | |||||||||||
| Mid-Atlantic |
43 | % | 32 | % | 11 | % | ||||||
| Northeast |
13 | % | 9 | % | 4 | % | ||||||
| California |
5 | % | 9 | % | (4 | )% | ||||||
| Total |
27 | % | 21 | % | 6 | % | ||||||
76
Table of Contents
The following table summarizes power generation volumes by region for the three months ended September 30, 2010 and 2009 (in gigawatt hours):
| Three Months Ended September 30, |
Increase/ (Decrease) |
Increase/ (Decrease) |
||||||||||||||
| 2010 | 2009 | |||||||||||||||
| Mid-Atlantic: |
||||||||||||||||
| Baseload |
4,060 | 3,401 | 659 | 19 | % | |||||||||||
| Intermediate |
733 | 194 | 539 | 278 | % | |||||||||||
| Peaking |
121 | 28 | 93 | 332 | % | |||||||||||
| Total Mid-Atlantic |
4,914 | 3,623 | 1,291 | 36 | % | |||||||||||
| Northeast: |
||||||||||||||||
| Baseload |
400 | 378 | 22 | 6 | % | |||||||||||
| Intermediate |
324 | 111 | 213 | 192 | % | |||||||||||
| Peaking |
5 | 2 | 3 | 150 | % | |||||||||||
| Total Northeast |
729 | 491 | 238 | 48 | % | |||||||||||
| California: |
||||||||||||||||
| Intermediate |
255 | 457 | (202 | ) | (44 | )% | ||||||||||
| Peaking1 |
(1 | ) | 1 | (2 | ) | (200 | )% | |||||||||
| Total California |
254 | 458 | (204 | ) | (45 | )% | ||||||||||
| Total |
5,897 | 4,572 | 1,325 | 29 | % | |||||||||||
| 1 | Negative amounts denote net energy used by the generating facility. |
The total increase in power generation volumes for the three months ended September 30, 2010, as compared to the three months ended September 30, 2009, was primarily the result of the following:
Mid-Atlantic. An increase in our generation volumes primarily as a result of higher power prices resulting from an increase in demand because of higher average temperatures and a decrease in outages in 2010 compared to 2009.
Northeast. An increase in our generation volumes primarily as a result of higher power prices resulting from an increase in demand because of higher average temperatures.
California. All of our California generating facilities operate under tolling agreements or are subject to RMR arrangements. Our natural gas-fired units in service at Contra Costa and Pittsburg operate under tolling agreements with PG&E for 100% of the capacity from these units and our Potrero units are subject to RMR arrangements. Therefore, changes in power generation volumes from those generating facilities, which can be caused by weather, planned outages or other factors, generally do not affect our gross margin.
77
Table of Contents
Mid-Atlantic
Our Mid-Atlantic segment includes four generating facilities with total net generating capacity of 5,194 MW.
The following table summarizes the results of operations of our Mid-Atlantic segment (in millions):
| Three Months Ended September 30, |
Increase/ (Decrease) |
|||||||||||
| 2010 | 2009 | |||||||||||
| Gross Margin: |
||||||||||||
| Energy |
$ | 151 | $ | 33 | $ | 118 | ||||||
| Contracted and capacity |
83 | 90 | (7 | ) | ||||||||
| Realized value of hedges |
58 | 214 | (156 | ) | ||||||||
| Total realized gross margin |
292 | 337 | (45 | ) | ||||||||
| Unrealized gross margin |
179 | (124 | ) | 303 | ||||||||
| Total gross margin |
471 | 213 | 258 | |||||||||
| Operating Expenses: |
||||||||||||
| Operations and maintenance |
116 | 104 | 12 | |||||||||
| Depreciation and amortization |
36 | 25 | 11 | |||||||||
| Gain on sales of assets, net |
— | (2 | ) | 2 | ||||||||
| Total operating expenses, net |
152 | 127 | 25 | |||||||||
| Operating income |
319 | 86 | 233 | |||||||||
| Total other expense, net |
1 | — | 1 | |||||||||
| Income before income taxes |
$ | 318 | $ | 86 | $ | 232 | ||||||
Gross Margin
The decrease of $45 million in realized gross margin was principally a result of the following:
| • | a decrease of $156 million in realized value of hedges. In 2010, realized value of hedges was $58 million, which reflects the amount by which the settlement value of power contracts exceeded market prices for power and the amount by which market prices for coal exceeded contract prices for coal. In 2009, realized value of hedges was $214 million, which reflects the amount by which the settlement value of power contracts exceeded market prices for power, partially offset by the amount by which contract prices for coal exceeded market prices for coal; and |
| • | a decrease of $7 million in contracted and capacity primarily related to lower average capacity prices, offset in part by an increase in ancillary services revenue; partially offset by |
| • | an increase of $118 million in energy, primarily as a result of an increase in the average settlement price for power, an increase in generation volumes and a decrease in the cost of emissions allowances, offset in part by an increase in the average price of coal. |
Our unrealized gross margin for both periods reflects the following:
| • | unrealized gains of $179 million in 2010, which included a $228 million net increase in the value of hedge contracts for future periods primarily related to decreases in forward power and natural gas prices and increases in forward coal prices, partially offset by unrealized losses of $49 million from power and fuel contracts that settled during the period for which net unrealized gains had been recorded in prior periods; and |
| • | unrealized losses of $124 million in 2009, which included unrealized losses of $188 million from power and fuel contracts that settled during the period for which net unrealized gains had been recorded in prior periods, partially offset by a $64 million net increase in the value of hedge contracts for future periods primarily related to decreases in forward power and natural gas prices. |
78
Table of Contents
Operating Expenses
Our operating expense increase of $25 million was primarily a result of the following:
| • | an increase of $12 million in operations and maintenance expense primarily as a result of an increase in costs related to the operation of our scrubbers and the Montgomery County, Maryland CO2 levy imposed on our Dickerson generating facility beginning in May 2010; |
| • | an increase of $11 million in depreciation and amortization expense primarily as a result of the scrubbers that were placed in service in December 2009, offset in part by a decrease in the carrying value of the Potomac River generating facility as a result of the impairment charge taken in the fourth quarter of 2009; and |
| • | a decrease of $2 million in gain on sales of assets primarily related to emissions allowances sold to third parties in 2009. |
Northeast
Our Northeast segment is comprised of our three generating facilities located in Massachusetts and one generating facility located in New York with total net generating capacity of 2,535 MW.
The following table summarizes the results of operations of our Northeast segment (in millions):
| Three Months Ended September 30, |
Increase/ (Decrease) |
|||||||||||
| 2010 | 2009 | |||||||||||
| Gross Margin: |
||||||||||||
| Energy |
$ | 14 | $ | 3 | $ | 11 | ||||||
| Contracted and capacity |
20 | 24 | (4 | ) | ||||||||
| Realized value of hedges |
(3 | ) | 33 | (36 | ) | |||||||
| Total realized gross margin |
31 | 60 | (29 | ) | ||||||||
| Unrealized gross margin |
(2 | ) | (26 | ) | 24 | |||||||
| Total gross margin |
29 | 34 | (5 | ) | ||||||||
| Operating Expenses: |
||||||||||||
| Operations and maintenance |
28 | 26 | 2 | |||||||||
| Depreciation and amortization |
5 | 4 | 1 | |||||||||
| Gain on sales of assets, net |
(1 | ) | (1 | ) | — | |||||||
| Total operating expenses, net |
32 | 29 | 3 | |||||||||
| Net income (loss) |
$ | (3 | ) | $ | 5 | $ | (8 | ) | ||||
Gross Margin
The decrease of $29 million in realized gross margin was principally a result of the following:
| • | a decrease of $36 million in realized value of hedges. In 2010, realized value of hedges was $(3) million, which reflects the amount by which contract prices for fuel exceeded market prices, offset by the amount by which the settlement value of power contracts exceeded market prices for power. In 2009, realized value of hedges was $33 million, which reflects the amount by which the settlement value of power contracts exceeded market prices for power, offset in part by the amount by which contract prices for fuel exceeded market prices for fuel; and |
| • | a decrease of $4 million in contracted and capacity primarily related to lower average capacity prices; partially offset by |
| • | an increase of $11 million in energy primarily as a result of an increase in the average settlement price for power, and an increase in generation volumes offset in part by an increase in the price of fuel. |
79
Table of Contents
Our unrealized gross margin for both periods reflects the following:
| • | unrealized losses of $2 million in 2010 from power and fuel contracts that settled during the period for which net unrealized gains had been recorded in prior periods; and |
| • | unrealized losses of $26 million in 2009, which included unrealized losses of $32 million from power and fuel contracts that settled during the period for which net unrealized gains had been recorded in prior periods, partially offset by a $6 million net increase in the value of hedge contracts for future periods primarily related to decreases in forward power and fuel prices. |
Operating Expenses
Our operating expense increase of $3 million was primarily a result of an increase in costs related to unplanned outages in 2010 compared to 2009 for our generating facilities, partially offset by a decrease in property taxes because of lower assessed values.
California
Our California segment consists of the Contra Costa, Pittsburg and Potrero generating facilities with total net generating capacity of 2,347 MW.
The following table summarizes the results of operations of our California segment (in millions):
| Three Months Ended September 30, |
Increase/ (Decrease) |
|||||||||||
| 2010 | 2009 | |||||||||||
| Gross Margin: |
||||||||||||
| Contracted and capacity |
$ | 32 | $ | 33 | $ | (1 | ) | |||||
| Total realized gross margin |
32 | 33 | (1 | ) | ||||||||
| Unrealized gross margin |
— | — | — | |||||||||
| Total gross margin |
32 | 33 | (1 | ) | ||||||||
| Operating Expenses: |
||||||||||||
| Operations and maintenance |
15 | 17 | (2 | ) | ||||||||
| Depreciation and amortization |
8 | 5 | 3 | |||||||||
| Impairment losses |
— | 14 | (14 | ) | ||||||||
| Total operating expenses, net |
23 | 36 | (13 | ) | ||||||||
| Operating income (loss) |
9 | (3 | ) | 12 | ||||||||
| Total other expense (income), net |
(2 | ) | 1 | (3 | ) | |||||||
| Net income (loss) |
$ | 11 | $ | (4 | ) | $ | 15 | |||||
Gross Margin
All of our California generating facilities operate under tolling agreements or are subject to RMR arrangements. Our natural gas-fired units in service at Contra Costa and Pittsburg operate under tolling agreements with PG&E for 100% of the capacity from these units, and our Potrero units are subject to RMR arrangements. Therefore, our gross margin generally is not affected by changes in power generation volumes from those facilities.
Operating Expenses
Our operating expense decrease of $13 million was primarily a result of a decrease in impairment losses on intangible assets related to our Potrero and Contra Costa generating facilities during 2009. See Note C to our unaudited condensed consolidated financial statements contained elsewhere in this report for additional information related to our impairment reviews.
80
Table of Contents
Other Operations
Other Operations includes proprietary trading and fuel oil management activities, interest expense on debt at Mirant Americas Generation and Mirant North America and interest income on our invested cash balances.
The following table summarizes the results of operations of our Other Operations segment (in millions):
| Three Months Ended September 30, |
Increase/ (Decrease) |
|||||||||||
| 2010 | 2009 | |||||||||||
| Gross Margin: |
||||||||||||
| Energy |
$ | 6 | $ | 36 | $ | (30 | ) | |||||
| Total realized gross margin |
6 | 36 | (30 | ) | ||||||||
| Unrealized gross margin |
(10 | ) | (24 | ) | 14 | |||||||
| Total gross margin |
(4 | ) | 12 | (16 | ) | |||||||
| Operating Expenses: |
||||||||||||
| Operations and maintenance |
3 | 3 | — | |||||||||
| Depreciation and amortization |
3 | 2 | 1 | |||||||||
| Total operating expenses, net |
6 | 5 | 1 | |||||||||
| Operating income (loss) |
(10 | ) | 7 | (17 | ) | |||||||
| Total other expense, net |
51 | 31 | 20 | |||||||||
| Net loss |
$ | (61 | ) | $ | (24 | ) | $ | (37 | ) | |||
Gross Margin
The decrease of $30 million in realized gross margin was principally a result of a $36 million decrease from proprietary trading activities, partially offset by a $6 million increase from our fuel oil management activities. The decrease in the contribution from proprietary trading was a result of a decrease in the realized value associated with trading positions in 2010 as compared to 2009. The increase in the contribution from fuel oil management was a result of higher realized gross margin on the settlement of positions used to hedge economically the fair value of our physical fuel oil inventory.
Our unrealized gross margin for both periods reflects the following:
| • | unrealized losses of $10 million in 2010, which included unrealized losses of $25 million from power and fuel contracts that settled during the period for which net unrealized gains had been recorded in prior periods, partially offset by a $15 million net increase in the value of contracts for future periods; and |
| • | unrealized losses of $24 million in 2009, which included unrealized losses of $13 million from power and fuel contracts that settled during the period for which net unrealized gains had been recorded in prior periods and an $11 million net decrease in the value of contracts for future periods. |
Other Expense, Net
The increase of $20 million in other expense, net was principally the result of an increase in interest expense primarily related to lower capitalized interest because of the scrubbers that were placed in service in December 2009.
81
Table of Contents
Nine Months Ended September 30, 2010 versus Nine Months Ended September 30, 2009
Consolidated Financial Performance
We reported net income of $390 million and $575 million for the nine months ended September 30, 2010 and 2009, respectively. The change in net income is detailed as follows (in millions):
| Nine Months Ended September 30, |
Increase/ (Decrease) |
|||||||||||
| 2010 | 2009 | |||||||||||
| Realized gross margin |
$ | 994 | $ | 1,179 | $ | (185 | ) | |||||
| Unrealized gross margin |
179 | 66 | 113 | |||||||||
| Total gross margin |
1,173 | 1,245 | (72 | ) | ||||||||
| Operating Expenses: |
||||||||||||
| Operations and maintenance—nonaffiliate |
270 | 258 | 12 | |||||||||
| Operations and maintenance—affiliate |
216 | 210 | 6 | |||||||||
| Depreciation and amortization |
151 | 104 | 47 | |||||||||
| Impairment losses |
— | 14 | (14 | ) | ||||||||
| Gain on sales of assets, net |
(4 | ) | (20 | ) | 16 | |||||||
| Total operating expenses, net |
633 | 566 | 67 | |||||||||
| Operating income |
540 | 679 | (139 | ) | ||||||||
| Total other expense, net |
151 | 104 | 47 | |||||||||
| Income before income taxes |
389 | 575 | (186 | ) | ||||||||
| Benefit for income taxes |
(1 | ) | — | (1 | ) | |||||||
| Net income |
$ | 390 | $ | 575 | $ | (185 | ) | |||||
Gross Margin
For the nine months ended September 30, 2010, our realized gross margin decrease of $185 million was principally a result of the following:
| • | a decrease of $305 million in realized value of hedges. In 2010 and 2009, realized value of hedges was $202 million and $507 million, respectively, which reflects the amount by which the settlement value of power contracts exceeded market prices for power, offset in part by the amount by which contract prices for fuel exceeded market prices for fuel; and |
| • | a decrease of $3 million in contracted and capacity primarily as a result of a decrease in capacity prices in the Mid-Atlantic, offset in part by higher capacity revenues in California, an increase in ancillary services revenue in the Mid-Atlantic and additional megawatts of capacity sold in the Mid-Atlantic; partially offset by |
| • | an increase of $123 million in energy, primarily as a result of higher generation volumes, an increase in the average settlement price for power and a decrease in the cost of emissions allowances, offset in part by a decrease in realized gross margin from proprietary trading activities and an increase in the price of fuel. |
Our unrealized gross margin for both periods reflects the following:
| • | unrealized gains of $179 million in 2010, which included a $471 million net increase in the value of hedge and proprietary trading contracts for future periods primarily related to decreases in forward power and natural gas prices offset in part by the recognition of many of our coal agreements at fair value beginning in the second quarter of 2010. The increase in value was further offset by unrealized losses of $292 million from power and fuel contracts that settled during the period for which net unrealized gains had been recorded in prior periods; and |
82
Table of Contents
| • | unrealized gains of $66 million in 2009, which included a $552 million net increase in the value of hedge and proprietary trading contracts for future periods primarily related to decreases in forward power and natural gas prices, partially offset by unrealized losses of $486 million from power and fuel contracts that settled during the period for which net unrealized gains had been recorded in prior periods. |
Operating Expenses
Our operating expense increase of $67 million was primarily a result of the following:
| • | an increase of $47 million in depreciation and amortization expense primarily as a result of the scrubbers that were placed in service in December 2009; |
| • | an increase of $18 million in operations and maintenance primarily as a result of an increase of $36 million in costs related to the operation of our scrubbers, an increase in planned maintenance costs in 2010 compared to 2009 and the Montgomery County, Maryland CO2 levy imposed on our Dickerson generating facility beginning in May 2010, offset in part by a decrease of $14 million primarily related to lower property taxes because of a lower assessed value for the site of the demolished Lovett generating facility and a decrease in shutdown costs associated with the demolished Lovett generating facility; and |
| • | a decrease of $16 million in gain on sales of assets primarily related to emissions allowances sold to third parties in 2009; partially offset by |
| • | a decrease of $14 million in impairment related to impairment losses on intangible assets related to our Potrero and Contra Costa generating facilities during 2009. See Note C to our unaudited condensed consolidated financial statements contained elsewhere in this report for additional information related to our impairment reviews. |
Other Expense, Net
The increase of $47 million primarily reflects higher interest expense as a result of lower capitalized interest because of the scrubbers that were placed in service in December 2009.
Gross Margin Overview
The following tables detail realized and unrealized gross margin for the nine months ended September 30, 2010 and 2009, by operating segments (in millions):
| Nine Months Ended September 30, 2010 | ||||||||||||||||||||||||
| Mid- Atlantic |
Northeast | California | Other Operations |
Eliminations | Total | |||||||||||||||||||
| Energy |
$ | 321 | $ | 15 | $ | — | $ | 41 | $ | — | $ | 377 | ||||||||||||
| Contracted and capacity |
257 | 67 | 91 | — | — | 415 | ||||||||||||||||||
| Realized value of hedges |
189 | 13 | — | — | — | 202 | ||||||||||||||||||
| Total realized gross margin |
767 | 95 | 91 | 41 | — | 994 | ||||||||||||||||||
| Unrealized gross margin |
208 | (16 | ) | — | (13 | ) | — | 179 | ||||||||||||||||
| Total gross margin |
$ | 975 | $ | 79 | $ | 91 | $ | 28 | $ | — | $ | 1,173 | ||||||||||||
83
Table of Contents
| Nine Months Ended September 30, 2009 | ||||||||||||||||||||||||
| Mid- Atlantic |
Northeast | California | Other Operations |
Eliminations | Total | |||||||||||||||||||
| Energy |
$ | 124 | $ | 21 | $ | — | $ | 112 | $ | (3 | ) | $ | 254 | |||||||||||
| Contracted and capacity |
261 | 68 | 89 | — | — | 418 | ||||||||||||||||||
| Realized value of hedges |
473 | 34 | — | — | — | 507 | ||||||||||||||||||
| Total realized gross margin |
858 | 123 | 89 | 112 | (3 | ) | 1,179 | |||||||||||||||||
| Unrealized gross margin |
119 | 20 | — | (73 | ) | — | 66 | |||||||||||||||||
| Total gross margin |
$ | 977 | $ | 143 | $ | 89 | $ | 39 | $ | (3 | ) | $ | 1,245 | |||||||||||
Energy represents gross margin from the generation of electricity, fuel sales and purchases at market prices, fuel handling, steam sales and our proprietary trading and fuel oil management activities.
Contracted and capacity represents gross margin received from capacity sold in ISO and RTO administered capacity markets, through RMR contracts, through tolling agreements and from ancillary services.
Realized value of hedges represents the actual margin upon the settlement of our power and fuel hedging contracts and the difference between market prices and contract costs for coal. Power hedging contracts include sales of both power and natural gas used to hedge power prices, as well as hedges to capture the incremental value related to the geographic location of our physical assets.
Unrealized gross margin represents the net unrealized gain or loss on our derivative contracts, including the reversal of unrealized gains and losses recognized in prior periods and changes in value for future periods.
Operating Statistics
The following table summarizes Net Capacity Factor by region for the nine months ended September 30, 2010 and 2009:
| Nine Months Ended September 30, |
Increase/ (Decrease) |
|||||||||||
| 2010 | 2009 | |||||||||||
| Mid-Atlantic |
36 | % | 32 | % | 4 | % | ||||||
| Northeast |
9 | % | 11 | % | (2 | )% | ||||||
| California |
3 | % | 6 | % | (3 | )% | ||||||
| Total |
22 | % | 20 | % | 2 | % | ||||||
84
Table of Contents
The following table summarizes power generation volumes by region for the nine months ended September 30, 2010 and 2009 (in gigawatt hours):
| Nine Months Ended September 30, |
Increase/ (Decrease) |
Increase/ (Decrease) |
||||||||||||||
| 2010 | 2009 | |||||||||||||||
| Mid-Atlantic: |
||||||||||||||||
| Baseload |
11,094 | 10,568 | 526 | 5 | % | |||||||||||
| Intermediate |
1,065 | 333 | 732 | 220 | % | |||||||||||
| Peaking |
191 | 64 | 127 | 198 | % | |||||||||||
| Total Mid-Atlantic |
12,350 | 10,965 | 1,385 | 13 | % | |||||||||||
| Northeast: |
||||||||||||||||
| Baseload |
1,120 | 1,076 | 44 | 4 | % | |||||||||||
| Intermediate |
382 | 683 | (301 | ) | (44 | )% | ||||||||||
| Peaking |
6 | 2 | 4 | 200 | % | |||||||||||
| Total Northeast |
1,508 | 1,761 | (253 | ) | (14 | )% | ||||||||||
| California: |
||||||||||||||||
| Intermediate |
466 | 846 | (380 | ) | (45 | )% | ||||||||||
| Peaking1 |
(1 | ) | 2 | (3 | ) | (150 | )% | |||||||||
| Total California |
465 | 848 | (383 | ) | (45 | )% | ||||||||||
| Total |
14,323 | 13,574 | 749 | 6 | % | |||||||||||
| 1 | Negative amounts denote net energy used by the generating facility. |
The total increase in power generation volumes for the nine months ended September 30, 2010, as compared to the nine months ended September 30, 2009, was primarily the result of the following:
Mid-Atlantic. An increase in our generation volumes primarily as a result of higher power prices resulting from an increase in demand because of higher average temperatures and a decrease in outages in 2010 compared to 2009.
Northeast. A decrease in our Northeast intermediate generation as a result of transmission upgrades in 2009, which reduced the demand for the oil-fired intermediate units at our Canal generating facility and unplanned outages in 2010, partially offset by increases in generation volumes in our baseload and peaking units.
California. All of our California generating facilities operate under tolling agreements or are subject to RMR arrangements. Our natural gas-fired units in service at Contra Costa and Pittsburg operate under tolling agreements with PG&E for 100% of the capacity from these units and our Potrero units are subject to RMR arrangements. Therefore, changes in power generation volumes from those generating facilities, which can be caused by weather, planned outages or other factors, generally do not affect our gross margin.
85
Table of Contents
Mid-Atlantic
Our Mid-Atlantic segment includes four generating facilities with total net generating capacity of 5,194 MW.
The following table summarizes the results of operations of our Mid-Atlantic segment (in millions):
| Nine Months Ended September 30, |
Increase/ (Decrease) |
|||||||||||
| 2010 | 2009 | |||||||||||
| Gross Margin: |
||||||||||||
| Energy |
$ | 321 | $ | 124 | $ | 197 | ||||||
| Contracted and capacity |
257 | 261 | (4 | ) | ||||||||
| Realized value of hedges |
189 | 473 | (284 | ) | ||||||||
| Total realized gross margin |
767 | 858 | (91 | ) | ||||||||
| Unrealized gross margin |
208 | 119 | 89 | |||||||||
| Total gross margin |
975 | 977 | (2 | ) | ||||||||
| Operating Expenses: |
||||||||||||
| Operations and maintenance |
346 | 310 | 36 | |||||||||
| Depreciation and amortization |
105 | 73 | 32 | |||||||||
| Gain on sales of assets, net |
(3 | ) | (12 | ) | 9 | |||||||
| Total operating expenses, net |
448 | 371 | 77 | |||||||||
| Operating income |
527 | 606 | (79 | ) | ||||||||
| Total other expense, net |
3 | 2 | 1 | |||||||||
| Income before income taxes |
$ | 524 | $ | 604 | $ | (80 | ) | |||||
Gross Margin
The decrease of $91 million in realized gross margin was principally a result of the following:
| • | a decrease of $284 million in realized value of hedges. In 2010 and 2009, realized value of hedges was $189 million and $473 million, respectively, which reflects the amount by which the settlement value of power contracts exceeded market prices for power, partially offset by the amount by which contract prices for coal exceeded market prices for coal; and |
| • | a decrease of $4 million in contracted and capacity primarily related to lower average capacity prices, offset in part by an increase in ancillary services revenue and additional megawatts of capacity sold in 2010; partially offset by |
| • | an increase of $197 million in energy, primarily as a result of an increase in the average settlement price for power, higher generation volumes and a decrease in the cost of emissions allowances, partially offset by an increase in the average price for coal. |
Our unrealized gross margin for both periods reflects the following:
| • | unrealized gains of $208 million in 2010, which included a $421 million net increase in the value of hedge contracts for future periods primarily related to decreases in forward power and natural gas prices offset in part by the recognition of many of our coal agreements at fair value beginning in the second quarter of 2010. The increase in value was further offset by unrealized losses of $213 million from power and fuel contracts that settled during the period for which net unrealized gains had been recorded in prior periods; and |
| • | unrealized gains of $119 million in 2009, which included a $498 million net increase in the value of hedge contracts for future periods primarily related to decreases in forward power and natural gas prices, partially offset by unrealized losses of $379 million from power and fuel contracts that settled during the period for which net unrealized gains had been recorded in prior periods. |
86
Table of Contents
Operating Expenses
Our operating expense increase of $77 million was primarily a result of the following:
| • | an increase of $36 million in operations and maintenance expense primarily as a result of an increase in costs related to the operation of our scrubbers, an increase in planned maintenance costs in 2010 compared to 2009 and the Montgomery County, Maryland CO2 levy imposed on our Dickerson generating facility beginning in May 2010; |
| • | an increase of $32 million in depreciation and amortization expense primarily as a result of the scrubbers that were placed in service in December 2009, offset in part by a decrease in the carrying value of the Potomac River generating facility as a result of the impairment charge taken in the fourth quarter of 2009; and |
| • | a decrease of $9 million in gain on sales of assets primarily related to emissions allowances sold to third parties in 2009. |
Northeast
Our Northeast segment is comprised of our three generating facilities located in Massachusetts and one generating facility located in New York with total net generating capacity of 2,535 MW.
The following table summarizes the results of operations of our Northeast segment (in millions):
| Nine Months Ended September 30, |
Increase/ (Decrease) |
|||||||||||
| 2010 | 2009 | |||||||||||
| Gross Margin: |
||||||||||||
| Energy |
$ | 15 | $ | 21 | $ | (6 | ) | |||||
| Contracted and capacity |
67 | 68 | (1 | ) | ||||||||
| Realized value of hedges |
13 | 34 | (21 | ) | ||||||||
| Total realized gross margin |
95 | 123 | (28 | ) | ||||||||
| Unrealized gross margin |
(16 | ) | 20 | (36 | ) | |||||||
| Total gross margin |
79 | 143 | (64 | ) | ||||||||
| Operating Expenses: |
||||||||||||
| Operations and maintenance |
79 | 93 | (14 | ) | ||||||||
| Depreciation and amortization |
17 | 13 | 4 | |||||||||
| Gain on sales of assets, net |
(1 | ) | (3 | ) | 2 | |||||||
| Total operating expenses, net |
95 | 103 | (8 | ) | ||||||||
| Operating income (loss) |
(16 | ) | 40 | (56 | ) | |||||||
| Total other expense, net |
1 | — | 1 | |||||||||
| Net income (loss) |
$ | (17 | ) | $ | 40 | $ | (57 | ) | ||||
Gross Margin
The decrease of $28 million in realized gross margin was principally a result of the following:
| • | a decrease of $21 million in realized value of hedges. In 2010 and 2009, realized value of hedges was $13 million and $34 million, respectively, which reflects the amount by which the settlement value of power contracts exceeded market prices for power, partially offset by the amount by which contract prices for fuel exceeded market prices for fuel; |
87
Table of Contents
| • | a decrease of $6 million in energy primarily as a result of a decrease in generation volumes from our oil-fired intermediate units as a result of transmission upgrades in 2009, a decrease in the average settlement price for power and unplanned outages in 2010; and |
| • | a decrease of $1 million in contracted and capacity primarily related to a decrease in megawatts of capacity sold. |
Our unrealized gross margin for both periods reflects the following:
| • | unrealized losses of $16 million in 2010 from power and fuel contracts that settled during the period for which net unrealized gains had been recorded in prior periods; and |
| • | unrealized gains of $20 million in 2009, which included a $60 million net increase in the value of hedge contracts for future periods primarily related to decreases in forward power and fuel prices, partially offset by unrealized losses of $40 million from power and fuel contracts that settled during the period for which net unrealized gains had been recorded in prior periods. |
Operating Expenses
Our operating expense decrease of $8 million was primarily a result of the following:
| • | a decrease of $14 million in operations and maintenance expense primarily related to lower property taxes because of a lower assessed value for the site of the demolished Lovett generating facility and a decrease in shutdown costs associated with the demolished Lovett generating facility; partially offset by |
| • | an increase of $4 million in depreciation and amortization expense primarily as a result of a revision in the useful lives of our assets as a result of a depreciation study completed in the first quarter of 2010; and |
| • | a decrease of $2 million in gain on sales of assets primarily related to emissions allowances sold to third parties in 2009. |
California
Our California segment consists of the Contra Costa, Pittsburg and Potrero generating facilities with total net generating capacity of 2,347 MW.
The following table summarizes the results of operations of our California segment (in millions):
| Nine Months Ended September 30, |
Increase/ (Decrease) |
|||||||||||
| 2010 | 2009 | |||||||||||
| Gross Margin: |
||||||||||||
| Contracted and capacity |
$ | 91 | $ | 89 | $ | 2 | ||||||
| Total realized gross margin |
91 | 89 | 2 | |||||||||
| Unrealized gross margin |
— | — | — | |||||||||
| Total gross margin |
91 | 89 | 2 | |||||||||
| Operating Expenses: |
||||||||||||
| Operations and maintenance |
53 | 57 | (4 | ) | ||||||||
| Depreciation and amortization |
23 | 15 | 8 | |||||||||
| Impairment losses |
— | 14 | (14 | ) | ||||||||
| Gain on sales of assets, net |
— | (1 | ) | 1 | ||||||||
| Total operating expenses, net |
76 | 85 | (9 | ) | ||||||||
| Operating income |
15 | 4 | 11 | |||||||||
| Total other expense (income), net |
(2 | ) | 2 | (4 | ) | |||||||
| Net income |
$ | 17 | $ | 2 | $ | 15 | ||||||
88
Table of Contents
Gross Margin
All of our California generating facilities operate under tolling agreements or are subject to RMR arrangements. Our natural gas-fired units in service at Contra Costa and Pittsburg operate under tolling agreements with PG&E for 100% of the capacity from these units, and our Potrero units are subject to RMR arrangements. Therefore, our gross margin generally is not affected by changes in power generation volumes from those facilities.
Operating Expenses
Our operating expense decrease of $9 million was primarily a result of the following:
| • | a decrease of $14 million in impairment related to impairment losses on intangible assets related to our Potrero and Contra Costa generating facilities during 2009. See Note C to our unaudited condensed consolidated financial statements contained elsewhere in this report for additional information related to our impairment reviews; and |
| • | a decrease of $4 million in operations and maintenance primarily as a result of a decrease in legal fees and outage costs; partially offset by |
| • | an increase of $8 million in depreciation expense as a result of a decrease in the useful life of our Potrero generating facility because of the settlement with the City of San Francisco executed in the third quarter of 2009. See Note J to our unaudited condensed consolidated financial statements contained elsewhere in this report for additional information on the Mirant Potrero settlement with the City of San Francisco; and |
| • | a decrease of $1 million in gain on sales of assets primarily related to emissions allowances sold to third parties in 2009. |
Other Operations
Other Operations includes proprietary trading and fuel oil management activities, interest expense on debt at Mirant Americas Generation and Mirant North America and interest income on our invested cash balances.
The following table summarizes the results of operations of our Other Operations segment (in millions):
| Nine Months Ended September 30, |
Increase/ (Decrease) |
|||||||||||
| 2010 | 2009 | |||||||||||
| Gross Margin: |
||||||||||||
| Energy |
$ | 41 | $ | 112 | $ | (71 | ) | |||||
| Total realized gross margin |
41 | 112 | (71 | ) | ||||||||
| Unrealized gross margin |
(13 | ) | (73 | ) | 60 | |||||||
| Total gross margin |
28 | 39 | (11 | ) | ||||||||
| Operating Expenses: |
||||||||||||
| Operations and maintenance |
8 | 8 | — | |||||||||
| Depreciation and amortization |
6 | 3 | 3 | |||||||||
| Total operating expenses, net |
14 | 11 | 3 | |||||||||
| Operating income |
14 | 28 | (14 | ) | ||||||||
| Total other expense, net |
149 | 100 | 49 | |||||||||
| Net loss |
$ | (135 | ) | $ | (72 | ) | $ | (63 | ) | |||
89
Table of Contents
Gross Margin
The decrease of $71 million in realized gross margin was principally a result of a $44 million decrease from proprietary trading activities and a $27 million decrease from our fuel oil management activities. The decrease in the contribution from proprietary trading was primarily a result of a decrease in the realized value associated with power positions in 2010 as compared to 2009. The decrease in the contribution from fuel oil management was a result of lower gross margin on positions used to hedge economically the fair value of our physical fuel oil inventory.
Our unrealized gross margin for both periods reflects the following:
| • | unrealized losses of $13 million in 2010, which included unrealized losses of $63 million from power and fuel contracts that settled during the period for which net unrealized gains had been recorded in prior periods, partially offset by a $50 million net increase in the value of contracts for future periods; and |
| • | unrealized losses of $73 million in 2009, which included unrealized losses of $67 million from power and fuel contracts that settled during the period for which net unrealized gains had been recorded in prior periods and a $6 million net decrease in the value of contracts for future periods. |
Operating Expenses
The increase of $3 million in operating expenses was principally the result of the increase in depreciation and amortization expense primarily as a result of the depreciation of interest capitalized at Mirant North America related to the scrubbers that were placed in service in December 2009.
Other Expense, Net
The increase of $49 million in other expense, net was principally the result of an increase in interest expense primarily related to lower capitalized interest because of the scrubbers that were placed in service in December 2009.
90
Table of Contents
Financial Condition
Liquidity and Capital Resources
We expect that we will have sufficient liquidity for our future operations and capital expenditures, and to service our debt obligations. We regularly monitor our ability to finance the needs of our operating, investing and financing activities. See Note D to our unaudited condensed consolidated financial statements contained elsewhere in this report for additional discussion of our debt.
Sources of Funds
The principal sources of our liquidity are expected to be: (1) existing cash on hand and expected cash flows from the operations of our subsidiaries, (2) letters of credit issued or borrowings made under Mirant North America’s senior secured revolving credit facility and letters of credit issued under Mirant North America’s senior secured term loan, (3) capital contributions received upon redemptions of preferred shares in Mirant Americas and (4) at its discretion, additional capital contributions from Mirant Corporation.
As described in “Overview” in this Item 2, RRI Energy entered into new senior secured credit facilities comprised of a $788 million five-year senior secured revolving credit facility and a $700 million seven-year senior secured term loan (the “GenOn Energy credit facilities”). The funding of the term loan facility and the availability of borrowings and letters of credit under the revolving credit facility are subject to the closing of the merger and the satisfaction of the conditions precedent thereto. In addition, GenOn Escrow, a wholly-owned subsidiary of Mirant, issued senior notes in an aggregate principal amount of $1.225 billion. Upon issuance, the proceeds of the notes, together with additional funds, were deposited into a segregated escrow account pending the completion of the merger. Upon completion of the merger, and the satisfaction of the conditions precedent thereto, GenOn Escrow will merge with and into RRI Energy and RRI Energy will assume all of GenOn Escrow’s obligations under the notes and the related indenture and the funds held in escrow will be released to RRI Energy. The proceeds of the new GenOn Energy credit facilities and senior notes will be used, in part, to redeem the Mirant North America senior notes, repay and terminate the Mirant North America term loan and replace the Mirant North America revolving credit facility.
The table below sets forth total cash, cash equivalents and availability under credit facilities of Mirant Americas Generation and its subsidiaries (in millions):
| At September 30, 2010 |
At December 31, 2009 |
|||||||
| Cash and Cash Equivalents: |
||||||||
| Mirant Americas Generation |
$ | 19 | $ | 1 | ||||
| Mirant North America |
245 | 278 | ||||||
| Mirant Mid-Atlantic |
273 | 125 | ||||||
| Total cash and cash equivalents |
537 | 404 | ||||||
| Available under credit facilities |
712 | 680 | ||||||
| Total cash, cash equivalents and credit facilities availability |
$ | 1,249 | $ | 1,084 | ||||
We consider all short-term investments with an original maturity of three months or less to be cash equivalents. At September 30, 2010 and December 31, 2009, except for amounts held in bank accounts to cover upcoming payables, all of our cash and cash equivalents were invested in AAA-rated United States Treasury money market funds.
Available under credit facilities at September 30, 2010 and December 31, 2009, reflects a $45 million effective reduction as a result of the bankruptcy filing of Lehman Commercial Paper, Inc., a lender under the Mirant North America senior secured revolving credit facility.
91
Table of Contents
Mirant Americas Generation is a holding company. The chart below is a summary representation of our capital structure and is not a complete organizational chart.
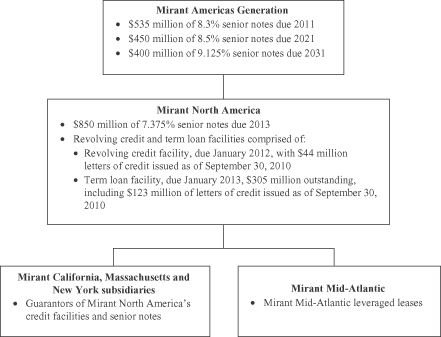
Except for existing cash on hand and, in the case of Mirant North America, borrowings and letters of credit under its credit facilities, Mirant Americas Generation and Mirant North America as holding companies are dependent for liquidity on the distributions and dividends of their subsidiaries, capital contributions received upon redemptions of preferred shares in Mirant Americas and, at its discretion, additional capital contributions from Mirant Corporation. The ability of Mirant North America and its subsidiary, Mirant Mid-Atlantic, to make distributions and pay dividends is restricted under the terms of Mirant North America’s debt agreements and Mirant Mid-Atlantic’s leveraged lease documentation, respectively. At September 30, 2010, Mirant North America had distributed to us all available cash that was permitted to be distributed under the terms of its debt agreements, leaving $518 million at Mirant North America and its subsidiaries. Of this amount, $273 million was held by Mirant Mid-Atlantic which, as of September 30, 2010, met the tests under the leveraged lease documentation permitting it to make distributions to Mirant North America. After taking into account the financial results of Mirant North America for the nine months ended September 30, 2010, we expect Mirant North America will distribute approximately $112 million to us in November 2010. Although we expect Mirant North America to remain in compliance with its financial covenants in future periods, and to have sufficient liquidity and capital resources to meet its obligations, it is likely that it will be restricted from making distributions by the free cash flow requirements under the restricted payment test of its senior credit facility in future periods. The primary factor lowering the free cash flow calculation for Mirant North America is the significant capital expenditure program of Mirant Mid-Atlantic to install emissions controls at its Chalk Point, Dickerson and Morgantown coal-fired units to comply with the Maryland Healthy Air Act. When the capital expenditures no longer affect the calculation of its free cash flow, Mirant North America is expected to be able again to make distributions. We do not expect the liquidity effect of the restriction on distributions under the Mirant North America senior credit facility to be material given that the majority of our liquidity needs arise from the activities of Mirant North America and its subsidiaries, the restriction does not limit Mirant North America from making distributions to us to fund interest payments on our senior notes and Mirant Corporation has significant unrestricted cash and cash equivalents available, at its discretion, to make capital contributions to us and our subsidiaries.
92
Table of Contents
Uses of Funds
Our requirements for liquidity and capital resources, other than for the day-to-day operation of our generating facilities, are significantly influenced by the following activities: (1) capital expenditures, (2) debt service and payments under the Mirant Mid-Atlantic leveraged leases and (3) collateral required for our asset management and proprietary trading and fuel oil management activities.
Capital Expenditures. Our capital expenditures, excluding capitalized interest for the nine months ended September 30, 2010, were $204 million. Our estimated capital expenditures, excluding capitalized interest, for the period October 1, 2010, through December 31, 2011, are expected to be $332 million. See “Capital Expenditures and Capital Resources” in this Item 2 for further discussion of our capital expenditures.
Cash Collateral and Letters of Credit. In order to sell power and purchase fuel in the forward markets and perform other energy trading and marketing activities, we often are required to provide credit support to our counterparties or make deposits with brokers. In addition, we often are required to provide cash collateral or letters of credit to access the transmission grid, to participate in power pools, to fund debt service and rent reserves and for other operating activities. Credit support includes cash collateral, letters of credit, surety bonds and financial guarantees. In the event that we default, the counterparty can draw on a letter of credit or apply cash collateral held to satisfy the existing amounts outstanding under an open contract. As of September 30, 2010, we had approximately $108 million of posted cash collateral and $167 million of letters of credit outstanding primarily to support our asset management activities, trading activities, debt service and rent reserve requirements, and other commercial arrangements. Upon the completion of the merger, the outstanding letters of credit under the Mirant North America senior secured revolving credit facility will transfer to the GenOn Escrow senior secured revolving credit facility. Our liquidity requirements are highly dependent on the level of our hedging activities, forward prices for energy, emissions allowances and fuel, commodity market volatility, credit terms with third parties and regulation of energy contracts. See Note E to our unaudited condensed consolidated financial statements contained elsewhere in this report for additional information.
The following table summarizes cash collateral posted with counterparties and brokers, letters of credit issued and surety bonds provided (in millions):
| At September 30, 2010 |
At December 31, 2009 |
|||||||
| Cash collateral posted—energy trading and marketing |
$ | 68 | $ | 41 | ||||
| Cash collateral posted—other operating activities |
40 | 42 | ||||||
| Letters of credit—energy trading and marketing |
59 | 51 | ||||||
| Letters of credit—debt service and rent reserves |
75 | 101 | ||||||
| Letters of credit—other operating activities |
33 | 47 | ||||||
| Surety bonds |
8 | 1 | ||||||
| Total |
$ | 283 | $ | 283 | ||||
Debt Obligations, Off-Balance Sheet Arrangements and Contractual Obligations
Coal Agreements
During the third quarter of 2010, we entered into a contract to purchase coal in both 2012 and 2013. The total notional value of the contract was $275 million.
93
Table of Contents
Cash Flows
Operating Activities. Our cash provided by operating activities is affected by seasonality, changes in energy prices and fluctuations in our working capital requirements. Net cash provided by operating activities decreased $256 million for the nine months ended September 30, 2010, compared to the same period in 2009, primarily as a result of the following:
| • | Realized gross margin. A decrease in cash provided of $192 million in 2010, compared to the same period in 2009, excluding a decrease in non-cash lower of cost or market fuel inventory adjustments of $7 million. See “Results of Operations” in this Item 2 for additional discussion of our performance in 2010 compared to the same period in 2009; |
| • | Interest expense, net. An increase in cash used of $46 million primarily as a result of a decrease in capitalized interest which is included in investing activities; |
| • | Funds on deposit. An increase in cash used of $46 million. We posted an additional $25 million in collateral with our counterparties in 2010 compared to $21 million returned from our counterparties in 2009; |
| • | Operating expenses. An increase in cash used related to higher operations and maintenance expense of $18 million, primarily as a result of costs related to the operation of our scrubbers in 2010, offset in part by a decrease in shutdown costs associated with the demolished Lovett generating facility and a decrease in outage costs. See “Results of Operations” in this Item 2 for additional discussion of our performance in 2010 compared to the same period in 2009; and |
| • | Other operating assets and liabilities. An increase in cash used of $15 million related to changes in other operating assets and liabilities. |
The increases in cash used in and decrease in cash provided by operating activities were partially offset by the following:
| • | Accounts payable, collateral. A decrease in cash used of $38 million as a result of $41 million received from counterparties in 2010 as compared to $3 million received from counterparties in 2009; and |
| • | Property taxes. A decrease in cash used of $23 million primarily related to the timing of property tax payments. |
Investing Activities. Net cash used in investing activities decreased by $276 million for the nine months ended September 30, 2010, compared to the same period in 2009. This difference was primarily a result of the following:
| • | Capital expenditures. A decrease in cash used of $293 million, including $32 million related to a decrease in capitalized interest, primarily related to placing scrubbers for our Maryland generating facilities in service in the fourth quarter of 2009 as part of our compliance with the Maryland Healthy Air Act; partially offset by |
| • | Proceeds from the sales of assets. A decrease in cash provided of $17 million primarily related to the sales of emissions allowances in 2009 as compared to 2010. |
Financing Activities. Net cash used in financing activities increased by $126 million for the nine months ended September 30, 2010, compared to the same period in 2009. This difference was primarily a result of the following:
| • | Distribution to member. An increase in cash used of $109 million as a result of distributions in 2010. We made no distribution in 2009; and |
| • | Repayment of long-term debt. An increase in cash used of $28 million for repayments of long-term debt; partially offset by |
| • | Redemption of preferred stock. An increase in cash provided of $11 million as a result of the redemption of Series A preferred stock held by Mirant Mid-Atlantic. See Note F to our unaudited condensed consolidated financial statements contained elsewhere in this report for additional information. |
94
Table of Contents
| B. | Mirant North America |
The following discussion should be read in conjunction with the unaudited condensed consolidated financial statements of Mirant North America and the notes thereto, which are included elsewhere in this report.
Overview
Mirant North America, an indirect wholly-owned subsidiary of Mirant and a direct subsidiary of Mirant Americas Generation, is a competitive energy company that produces and sells electricity in the United States. Mirant North America owns or leases 10,076 MW of net electric generating capacity in the Mid-Atlantic and Northeast regions and in California. Mirant North America also operates an integrated asset management and energy marketing organization based in Atlanta, Georgia.
Mirant’s Proposed Merger with RRI Energy
Refer to “Mirant’s Proposed Merger with RRI Energy” above for Mirant Americas Generation.
Hedging Activities
Refer to “Hedging Activities” above for Mirant Americas Generation.
Capital Expenditures and Capital Resources
Refer to “Capital Expenditures and Capital Resources” above for Mirant Americas Generation.
Scrubber Operating Expenses
Refer to “Scrubber Operating Expenses” above for Mirant Americas Generation.
Commodity Prices
Refer to “Commodity Prices” above for Mirant Americas Generation.
California Development Activities
Contra Costa Toll Extension
Refer to “Contra Costa Toll Extension” above for Mirant Americas Generation.
Pittsburg Toll Extension
Refer to “Pittsburg Toll Extension” above for Mirant Americas Generation.
Potrero Settlement Agreement
Refer to “Potrero Settlement Agreement” above for Mirant Americas Generation.
Mid-Atlantic Collective Bargaining Agreement
Refer to “Mid-Atlantic Collective Bargaining Agreement” above for Mirant Americas Generation.
95
Table of Contents
Results of Operations
The following discussion of our performance is organized by reportable segment, which is consistent with the way we manage our business.
In the tables below, the Mid-Atlantic region includes our Chalk Point, Dickerson, Morgantown and Potomac River generating facilities. The Northeast region includes our Bowline, Canal, Kendall and Martha’s Vineyard generating facilities. The California region includes our Contra Costa, Pittsburg and Potrero generating facilities. Other Operations includes proprietary trading and fuel oil management activities, interest expense on our debt and interest income on our invested cash balances.
96
Table of Contents
Three Months Ended September 30, 2010 versus Three Months Ended September 30, 2009
Consolidated Financial Performance
We reported net income of $297 million and $94 million for the three months ended September 30, 2010 and 2009, respectively. The change in net income is detailed as follows (in millions):
| Three Months Ended September 30, |
Increase/ (Decrease) |
|||||||||||
| 2010 | 2009 | |||||||||||
| Realized gross margin |
$ | 361 | $ | 466 | $ | (105 | ) | |||||
| Unrealized gross margin |
167 | (174 | ) | 341 | ||||||||
| Total gross margin |
528 | 292 | 236 | |||||||||
| Operating Expenses: |
||||||||||||
| Operations and maintenance—nonaffiliate |
88 | 77 | 11 | |||||||||
| Operations and maintenance—affiliate |
74 | 73 | 1 | |||||||||
| Depreciation and amortization |
52 | 36 | 16 | |||||||||
| Impairment losses |
— | 14 | (14 | ) | ||||||||
| Gain on sales of assets, net |
(1 | ) | (3 | ) | 2 | |||||||
| Total operating expenses, net |
213 | 197 | 16 | |||||||||
| Operating income |
315 | 95 | 220 | |||||||||
| Total other expense, net |
19 | 1 | 18 | |||||||||
| Income before income taxes |
296 | 94 | 202 | |||||||||
| Benefit for income taxes |
(1 | ) | — | (1 | ) | |||||||
| Net income |
$ | 297 | $ | 94 | $ | 203 | ||||||
The following discussion includes non-GAAP financial measures because we present our consolidated financial performance in terms of gross margin. Gross margin is our operating revenue less cost of fuel, electricity and other products, and excludes depreciation and amortization. We present gross margin, excluding depreciation and amortization, as well as its two components—realized gross margin and unrealized gross margin—in order to be consistent with how we manage our business. Realized gross margin and unrealized gross margin are both non-GAAP financial measures. Realized gross margin represents our gross margin less unrealized gains and losses on derivative financial instruments for the periods presented. Conversely, unrealized gross margin is our unrealized gains and losses on derivative financial instruments for the periods presented. Management generally evaluates our operating results excluding the impact of unrealized gains and losses. None of our derivative financial instruments recorded at fair value is designated as a hedge and changes in their fair values are recognized currently in income as unrealized gains or losses. As a result, our financial results are, at times, volatile and subject to fluctuations in value primarily because of changes in forward electricity and fuel prices. Adjusting our gross margin to exclude unrealized gains and losses provides a measure of performance that eliminates the volatility created by significant shifts in market values between periods. However, our realized and unrealized gross margin may not be comparable to similarly titled non-GAAP financial measures used by other companies. We encourage our investors to review our unaudited condensed consolidated financial statements and other publicly filed reports in their entirety and not to rely on a single financial measure.
Refer to “Consolidated Financial Performance—Mirant Americas Generation” above for realized and unrealized gross margin and operating expenses, additional related details and variance explanations.
Other Expense, Net
The increase of $18 million primarily reflects higher interest expense as a result of lower capitalized interest because of the scrubbers that were placed in service in December 2009.
97
Table of Contents
Gross Margin Overview
Refer to “Gross Margin Overview” in “Results of Operations—Mirant Americas Generation” above for realized and unrealized gross margin by operating segments, additional related details and variance explanations.
Operating Statistics
Refer to “Operating Statistics” in “Results of Operations—Mirant Americas Generation” above for Net Capacity Factor and power generation volumes by region.
Mid-Atlantic
Refer to “Mid-Atlantic” in “Results of Operations—Mirant Americas Generation” above for our Mid-Atlantic segment summary.
Northeast
Refer to “Northeast” in “Results of Operations—Mirant Americas Generation” above for our Northeast segment summary.
California
Refer to “California” in “Results of Operations—Mirant Americas Generation” above for our California segment summary.
Other Operations
Other Operations includes proprietary trading and fuel oil management activities, interest expense on our debt and interest income on our invested cash balances.
The following table summarizes the results of operations of our Other Operations segment (in millions):
| Three Months Ended September 30, |
Increase/ (Decrease) |
|||||||||||
| 2010 | 2009 | |||||||||||
| Gross Margin: |
||||||||||||
| Energy |
$ | 6 | $ | 36 | $ | (30 | ) | |||||
| Total realized gross margin |
6 | 36 | (30 | ) | ||||||||
| Unrealized gross margin |
(10 | ) | (24 | ) | 14 | |||||||
| Total gross margin |
(4 | ) | 12 | (16 | ) | |||||||
| Operating Expenses: |
||||||||||||
| Operations and maintenance |
3 | 3 | — | |||||||||
| Depreciation and amortization |
3 | 2 | 1 | |||||||||
| Total operating expenses, net |
6 | 5 | 1 | |||||||||
| Operating income (loss) |
(10 | ) | 7 | (17 | ) | |||||||
| Total other expense, net |
20 | — | 20 | |||||||||
| Net income (loss) |
$ | (30 | ) | $ | 7 | $ | (37 | ) | ||||
Gross Margin
Refer to “Other Operations” in “Results of Operations—Mirant Americas Generation” above for our gross margin variance explanations.
98
Table of Contents
Other Expense, Net
The increase of $20 million in other expense, net was principally the result of an increase in interest expense primarily related to lower capitalized interest because of the scrubbers that were placed in service in December 2009.
99
Table of Contents
Nine Months Ended September 30, 2010 versus Nine Months Ended September 30, 2009
Consolidated Financial Performance
We reported net income of $481 million and $666 million for the nine months ended September 30, 2010 and 2009, respectively. The change in net income is detailed as follows (in millions):
| Nine Months Ended September 30, |
Increase/ (Decrease) |
|||||||||||
| 2010 | 2009 | |||||||||||
| Realized gross margin |
$ | 994 | $ | 1,179 | $ | (185 | ) | |||||
| Unrealized gross margin |
179 | 66 | 113 | |||||||||
| Total gross margin |
1,173 | 1,245 | (72 | ) | ||||||||
| Operating Expenses: |
||||||||||||
| Operations and maintenance—nonaffiliate |
270 | 258 | 12 | |||||||||
| Operations and maintenance—affiliate |
216 | 210 | 6 | |||||||||
| Depreciation and amortization |
151 | 104 | 47 | |||||||||
| Impairment losses |
— | 14 | (14 | ) | ||||||||
| Gain on sales of assets, net |
(4 | ) | (20 | ) | 16 | |||||||
| Total operating expenses, net |
633 | 566 | 67 | |||||||||
| Operating income |
540 | 679 | (139 | ) | ||||||||
| Total other expense, net |
60 | 13 | 47 | |||||||||
| Income before income taxes |
480 | 666 | (186 | ) | ||||||||
| Benefit for income taxes |
(1 | ) | — | (1 | ) | |||||||
| Net income |
$ | 481 | $ | 666 | $ | (185 | ) | |||||
Refer to “Consolidated Financial Performance—Mirant Americas Generation” above for realized and unrealized gross margin and operating expenses, additional related details and variance explanations.
Other Expense, Net
The increase of $47 million primarily reflects higher interest expense as a result of lower capitalized interest because of the scrubbers that were placed in service in December 2009.
Gross Margin Overview
Refer to “Gross Margin Overview” in “Results of Operations—Mirant Americas Generation” above for realized and unrealized gross margin by operating segments, additional related details and variance explanations.
Operating Statistics
Refer to “Operating Statistics” in “Results of Operations—Mirant Americas Generation” above for Net Capacity Factor and power generation volumes by region.
Mid-Atlantic
Refer to “Mid-Atlantic” in “Results of Operations—Mirant Americas Generation” above for our Mid-Atlantic segment summary.
Northeast
Refer to “Northeast” in “Results of Operations—Mirant Americas Generation” above for our Northeast segment summary.
100
Table of Contents
California
Refer to “California” in “Results of Operations—Mirant Americas Generation” above for our California segment summary.
Other Operations
Other Operations includes proprietary trading and fuel oil management activities, interest expense on our debt and interest income on our invested cash balances.
The following table summarizes the results of operations of our Other Operations segment (in millions):
| Nine Months Ended September 30, |
Increase/ (Decrease) |
|||||||||||
| 2010 | 2009 | |||||||||||
| Gross Margin: |
||||||||||||
| Energy |
$ | 41 | $ | 112 | $ | (71 | ) | |||||
| Total realized gross margin |
41 | 112 | (71 | ) | ||||||||
| Unrealized gross margin |
(13 | ) | (73 | ) | 60 | |||||||
| Total gross margin |
28 | 39 | (11 | ) | ||||||||
| Operating Expenses: |
||||||||||||
| Operations and maintenance |
8 | 8 | — | |||||||||
| Depreciation and amortization |
6 | 3 | 3 | |||||||||
| Total operating expenses, net |
14 | 11 | 3 | |||||||||
| Operating income |
14 | 28 | (14 | ) | ||||||||
| Total other expense, net |
58 | 9 | 49 | |||||||||
| Net income (loss) |
$ | (44 | ) | $ | 19 | $ | (63 | ) | ||||
Gross Margin
Refer to “Other Operations” in “Results of Operations—Mirant Americas Generation” above for our gross margin variance explanations.
Operating Expenses
Refer to “Other Operations” in “Results of Operations—Mirant Americas Generation” above for our operating expenses variance explanations.
Other Expense, Net
The increase of $49 million in other expense, net was principally the result of an increase in interest expense primarily related to lower capitalized interest because of the scrubbers that were placed in service in December 2009.
101
Table of Contents
Financial Condition
Liquidity and Capital Resources
We expect that we will have sufficient liquidity for our future operations and capital expenditures, and to service our debt obligations. We regularly monitor our ability to finance the needs of our operating, investing and financing activities. See Note D to our unaudited condensed consolidated financial statements contained elsewhere in this report for additional discussion of our debt.
Sources of Funds
The principal sources of our liquidity are expected to be: (1) existing cash on hand and expected cash flows from the operations of our subsidiaries, (2) letters of credit issued or borrowings made under our senior secured revolving credit facility and letters of credit issued under our senior secured term loan, (3) capital contributions received upon redemptions of preferred shares in Mirant Americas and (4) at its discretion, additional capital contributions from Mirant Corporation.
As described above in “Overview” under Mirant Americas Generation in this Item 2, RRI Energy entered into new GenOn Energy credit facilities. The funding of the term loan facility and the availability of borrowings and letters of credit under the revolving credit facility are subject to the closing of the merger and the satisfaction of the conditions precedent thereto. In addition, GenOn Escrow, a wholly-owned subsidiary of Mirant, issued senior notes in an aggregate principal amount of $1.225 billion. Upon issuance, the proceeds of the notes, together with additional funds, were deposited into a segregated escrow account pending the completion of the merger. Upon completion of the merger, and the satisfaction of the conditions precedent thereto, GenOn Escrow will merge with and into RRI Energy and RRI Energy will assume all of GenOn Escrow’s obligations under the notes and the related indenture and the funds held in escrow will be released to RRI Energy. The proceeds of the new GenOn Energy credit facilities and senior notes will be used, in part, to redeem our senior notes, repay and terminate our term loan and replace our revolving credit facility.
The table below sets forth total cash, cash equivalents and availability under credit facilities of Mirant North America and its subsidiaries (in millions):
| At September 30, 2010 |
At December 31, 2009 |
|||||||
| Cash and Cash Equivalents: |
||||||||
| Mirant North America |
$ | 245 | $ | 278 | ||||
| Mirant Mid-Atlantic |
273 | 125 | ||||||
| Total cash and cash equivalents |
518 | 403 | ||||||
| Available under credit facilities |
712 | 680 | ||||||
| Total cash, cash equivalents and credit facilities availability |
$ | 1,230 | $ | 1,083 | ||||
We consider all short-term investments with an original maturity of three months or less to be cash equivalents. At September 30, 2010 and December 31, 2009, except for amounts held in bank accounts to cover upcoming payables, all of our cash and cash equivalents were invested in AAA-rated United States Treasury money market funds.
Available under credit facilities at September 30, 2010 and December 31, 2009, reflects a $45 million effective reduction as a result of the bankruptcy filing of Lehman Commercial Paper, Inc., a lender under our senior secured revolving credit facility.
102
Table of Contents
Mirant North America is a holding company. The chart below is a summary representation of our capital structure and is not a complete organizational chart.
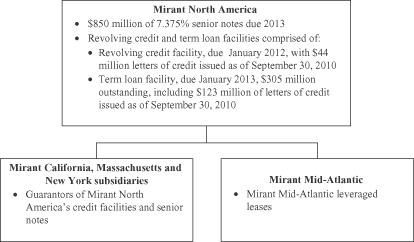
Except for existing cash on hand and borrowings and letters of credit under our credit facilities, as a holding company we are dependent for liquidity on the distributions and dividends of our subsidiaries, capital contributions received upon redemptions of preferred shares in Mirant Americas and, at its discretion, additional capital contributions from Mirant Corporation. Our ability and the ability of our subsidiary, Mirant Mid-Atlantic, to make distributions and pay dividends is restricted under the terms of our debt agreements and Mirant Mid-Atlantic’s leveraged lease documentation, respectively. At September 30, 2010, we had distributed to our parent, Mirant Americas Generation, all available cash that was permitted to be distributed under the terms of our debt agreements, leaving $518 million with us and our subsidiaries. Of this amount, $273 million was held by Mirant Mid-Atlantic which, as of September 30, 2010, met the tests under the leveraged lease documentation permitting it to make distributions to us. After taking into account our financial results for the nine months ended September 30, 2010, we expect to distribute approximately $112 million to our parent, Mirant Americas Generation, in November 2010. Although we expect to remain in compliance with our financial covenants in future periods, and to have sufficient liquidity and capital resources to meet our obligations, it is likely that we will be restricted from making distributions by the free cash flow requirements under the restricted payment test of our senior credit facility in future periods. The primary factor lowering our free cash flow calculation is the significant capital expenditure program of Mirant Mid-Atlantic to install emissions controls at its Chalk Point, Dickerson and Morgantown coal-fired units to comply with the Maryland Healthy Air Act. When the capital expenditures no longer affect the calculation of our free cash flow, we expect to be able again to make distributions.
Uses of Funds
Our requirements for liquidity and capital resources, other than for the day-to-day operation of our generating facilities, are significantly influenced by the following activities: (1) capital expenditures, (2) debt service and payments under the Mirant Mid-Atlantic leveraged leases and (3) collateral required for our asset management and proprietary trading and fuel oil management activities.
Capital Expenditures. Our capital expenditures, excluding capitalized interest for the nine months ended September 30, 2010, were $204 million. Our estimated capital expenditures, excluding capitalized interest, for the period October 1, 2010, through December 31, 2011, are expected to be $332 million. See “Capital Expenditures and Capital Resources” above under Mirant Americas Generation for further discussion of our capital expenditures.
103
Table of Contents
Cash Collateral and Letters of Credit. In order to sell power and purchase fuel in the forward markets and perform other energy trading and marketing activities, we often are required to provide credit support to our counterparties or make deposits with brokers. In addition, we often are required to provide cash collateral or letters of credit to access the transmission grid, to participate in power pools, to fund debt service and rent reserves and for other operating activities. Credit support includes cash collateral, letters of credit, surety bonds and financial guarantees. In the event that we default, the counterparty can draw on a letter of credit or apply cash collateral held to satisfy the existing amounts outstanding under an open contract. As of September 30, 2010, we had approximately $108 million of posted cash collateral and $167 million of letters of credit outstanding primarily to support our asset management activities, trading activities, debt service and rent reserve requirements, and other commercial arrangements. Upon the completion of the merger, the outstanding letters of credit under the Mirant North America senior secured revolving credit facility will transfer to the GenOn Escrow senior secured revolving credit facility. Our liquidity requirements are highly dependent on the level of our hedging activities, forward prices for energy, emissions allowances and fuel, commodity market volatility, credit terms with third parties and regulation of energy contracts. See Note E to our unaudited condensed consolidated financial statements contained elsewhere in this report for additional information.
The following table summarizes cash collateral posted with counterparties and brokers, letters of credit issued and surety bonds provided (in millions):
| At September 30, 2010 |
At December 31, 2009 |
|||||||
| Cash collateral posted—energy trading and marketing |
$ | 68 | $ | 41 | ||||
| Cash collateral posted—other operating activities |
40 | 42 | ||||||
| Letters of credit—energy trading and marketing |
59 | 51 | ||||||
| Letters of credit—debt service and rent reserves |
75 | 101 | ||||||
| Letters of credit—other operating activities |
33 | 47 | ||||||
| Surety bonds |
8 | 1 | ||||||
| Total |
$ | 283 | $ | 283 | ||||
Debt Obligations, Off-Balance Sheet Arrangements and Contractual Obligations
Coal Agreements
During the third quarter of 2010, we entered into a contract to purchase coal in both 2012 and 2013. The total notional value of the contract was $275 million.
Cash Flows
Operating Activities. Our cash provided by operating activities is affected by seasonality, changes in energy prices and fluctuations in our working capital requirements. Net cash provided by operating activities decreased $256 million for the nine months ended September 30, 2010, compared to the same period in 2009, primarily as a result of the following:
| • | Realized gross margin. A decrease in cash provided of $192 million in 2010, compared to the same period in 2009, excluding a decrease in non-cash lower of cost or market fuel inventory adjustments of $7 million. See “Results of Operations” under Mirant Americas Generation in this Item 2 for additional discussion of our performance in 2010 compared to the same period in 2009; |
| • | Interest expense, net. An increase in cash used of $46 million primarily as a result of a decrease in capitalized interest which is included in investing activities; |
| • | Funds on deposit. An increase in cash used of $46 million. We posted an additional $25 million in collateral with our counterparties in 2010 compared to $21 million returned from our counterparties in 2009; |
104
Table of Contents
| • | Operating expenses. An increase in cash used related to higher operations and maintenance expense of $18 million, primarily as a result of costs related to the operation of our scrubbers in 2010, offset in part by a decrease in shutdown costs associated with the demolished Lovett generating facility and a decrease in outage costs. See “Results of Operations” under Mirant Americas Generation in this Item 2 for additional discussion of our performance in 2010 compared to the same period in 2009; and |
| • | Other operating assets and liabilities. An increase in cash used of $15 million related to changes in other operating assets and liabilities. |
The increases in cash used in and decrease in cash provided by operating activities were partially offset by the following:
| • | Accounts payable, collateral. A decrease in cash used of $38 million as a result of $41 million received from counterparties in 2010 as compared to $3 million received from counterparties in 2009; and |
| • | Property taxes. A decrease in cash used of $23 million primarily related to the timing of property tax payments. |
Investing Activities. Net cash used in investing activities decreased by $276 million for the nine months ended September 30, 2010, compared to the same period in 2009. This difference was primarily a result of the following:
| • | Capital expenditures. A decrease in cash used of $293 million, including $32 million related to a decrease in capitalized interest, primarily related to placing scrubbers for our Maryland generating facilities in service in the fourth quarter of 2009 as part of our compliance with the Maryland Healthy Air Act; partially offset by |
| • | Proceeds from the sales of assets. A decrease in cash provided of $17 million primarily related to the sales of emissions allowances in 2009 as compared to 2010. |
Financing Activities. Net cash used in financing activities increased by $125 million for the nine months ended September 30, 2010, compared to the same period in 2009. This difference was primarily a result of the following:
| • | Distribution to member. An increase in cash used of $108 million as a result of distributions. In 2010, we made distributions of $188 million compared to $80 million for the same period in 2009; and |
| • | Repayment of long-term debt. An increase in cash used of $28 million for repayments of long-term debt; partially offset by |
| • | Redemption of preferred stock. An increase in cash provided of $11 million as a result of the redemption of Series A preferred stock held by Mirant Mid-Atlantic. See Note F to our unaudited condensed consolidated financial statements contained elsewhere in this report for additional information. |
105
Table of Contents
| C. | Mirant Mid-Atlantic |
The following discussion should be read in conjunction with the unaudited condensed consolidated financial statements of Mirant Mid-Atlantic and the notes thereto, which are included elsewhere in this report.
Overview
Mirant Mid-Atlantic, an indirect wholly-owned subsidiary of Mirant and Mirant Americas Generation and a direct subsidiary of Mirant North America, is a competitive energy company that produces and sells electricity in the United States. Mirant Mid-Atlantic owns or leases 5,194 MW of net electric generating capacity in the Mid-Atlantic region.
Mirant’s Proposed Merger with RRI Energy
Refer to “Mirant’s Proposed Merger with RRI Energy” above for Mirant Americas Generation.
Hedging Activities
We use derivative financial instruments, such as commodity forwards, futures, options and swaps, to manage our exposure to fluctuations in electric energy and fuel commodity prices. In addition, we hedge economically a substantial portion of our coal-fired baseload generation through OTC transactions. However, we generally do not hedge our intermediate and peaking units for tenors greater than 12 months. We hedge using products which we expect to be effective to mitigate the price risk of our generation. However, as a result of market liquidity limitations, our hedges often are not an exact match for the generation being hedged, and we then have some risks resulting from price differentials for different delivery points and for implied differences in heat rates when we hedge power using natural gas. While some of our hedges are executed through our affiliate, Mirant Energy Trading, a majority of our hedges are financial swap transactions with counterparties that are senior unsecured obligations of such parties and do not require either party to post cash collateral either for initial margin or for securing exposure as a result of changes in power or natural gas prices. At October 12, 2010, our aggregate hedge levels based on expected generation for the remainder of 2010 and subsequent years were as follows:
| Aggregate Hedge Levels Based on Expected Generation | ||||||||||||||||||||
| 2010 | 2011 | 2012 | 2013 | 2014 | ||||||||||||||||
| Power |
100 | % | 78 | % | 77 | % | 38 | % | 39 | % | ||||||||||
| Fuel |
89 | % | 85 | % | 79 | % | 54 | % | — | % | ||||||||||
The Dodd-Frank Act, which was enacted in July 2010 in response to the global financial crisis, increases the regulation of transactions involving OTC derivative financial instruments. The statute provides that standardized swap transactions between dealers and large market participants will have to be cleared and traded on an exchange or electronic platform. Although the legislative history of the Dodd-Frank Act, including a letter from Senators Dodd and Lincoln, provides strong evidence that market participants, such as Mirant Mid-Atlantic, that utilize OTC derivative financial instruments to hedge commercial risks are not to be subject to these clearing and other requirements, it is uncertain what the implementing regulations to be issued by the CFTC will provide. Greater regulation of OTC derivative financial instruments could materially affect our ability to hedge economically our generation by reducing liquidity in the energy and commodity markets, increasing hedge pricing through the imposition of capital requirements on our swap counterparties, and if we are required to clear such transactions on exchanges, by significantly increasing our requirements for cash collateral.
Capital Expenditures and Capital Resources
For the nine months ended September 30, 2010, we invested $194 million for capital expenditures of which $109 million related to compliance with the Maryland Healthy Air Act. As of September 30, 2010, we have
106
Table of Contents
invested approximately $1.514 billion for capital expenditures related to compliance with the Maryland Healthy Air Act. As the final part of our compliance with the Maryland Healthy Air Act, we placed our scrubbers in service in the fourth quarter of 2009. Provisions in our construction contracts for the scrubbers provide for certain payments to be made after final completion of the project. The current budget of $1.674 billion continues to represent our best estimate of the total capital expenditures for compliance with the Maryland Healthy Air Act. See Note I to our unaudited condensed consolidated financial statements contained elsewhere in this report for further discussion of scrubber contract issues.
The following table details the expected timing of payments for our estimated capital expenditures for the remainder of 2010 and for 2011 (in millions):
| 2010 | 2011 | |||||||
| Maryland Healthy Air Act |
$ | 67 | $ | 93 | ||||
| Other environmental |
3 | 24 | ||||||
| Maintenance |
27 | 38 | ||||||
| Other construction |
7 | 51 | ||||||
| Other |
2 | 1 | ||||||
| Total |
$ | 106 | $ | 207 | ||||
We expect that available cash, proceeds from redemption of preferred shares in Mirant Americas and future cash flows from operations will be sufficient to fund the remainder of these capital expenditures.
Scrubber Operating Expenses
Refer to “Scrubber Operating Expenses” above for Mirant Americas Generation.
Commodity Prices
Refer to “Commodity Prices” above for Mirant Americas Generation.
Mid-Atlantic Collective Bargaining Agreement
Refer to “Mid-Atlantic Collective Bargaining Agreement” above for Mirant Americas Generation.
107
Table of Contents
Results of Operations
Three Months Ended September 30, 2010 versus Three Months Ended September 30, 2009
Consolidated Financial Performance
We reported net income of $319 million and $86 million for the three months ended September 30, 2010 and 2009, respectively. The change in net income is detailed as follows (in millions):
| Three Months Ended September 30, |
Increase/ (Decrease) |
|||||||||||
| 2010 | 2009 | |||||||||||
| Realized gross margin |
$ | 292 | $ | 337 | $ | (45 | ) | |||||
| Unrealized gross margin |
179 | (124 | ) | 303 | ||||||||
| Total gross margin |
471 | 213 | 258 | |||||||||
| Operating Expenses: |
||||||||||||
| Operations and maintenance—nonaffiliate |
65 | 56 | 9 | |||||||||
| Operations and maintenance—affiliate |
51 | 48 | 3 | |||||||||
| Depreciation and amortization |
36 | 25 | 11 | |||||||||
| Gain on sales of assets, net—affiliate |
— | (2 | ) | 2 | ||||||||
| Total operating expenses, net |
152 | 127 | 25 | |||||||||
| Operating income |
319 | 86 | 233 | |||||||||
| Total other expense, net |
1 | — | 1 | |||||||||
| Income before income taxes |
318 | 86 | 232 | |||||||||
| Benefit for income taxes |
(1 | ) | — | (1 | ) | |||||||
| Net income |
$ | 319 | $ | 86 | $ | 233 | ||||||
The following discussion includes non-GAAP financial measures because we present our consolidated financial performance in terms of gross margin. Gross margin is our operating revenue less cost of fuel, electricity and other products, and excludes depreciation and amortization. We present gross margin, excluding depreciation and amortization, as well as its two components—realized gross margin and unrealized gross margin—in order to be consistent with how we manage our business. Realized gross margin and unrealized gross margin are both non-GAAP financial measures. Realized gross margin represents our gross margin less unrealized gains and losses on derivative financial instruments for the periods presented. Conversely, unrealized gross margin is our unrealized gains and losses on derivative financial instruments for the periods presented. Management generally evaluates our operating results excluding the impact of unrealized gains and losses. None of our derivative financial instruments recorded at fair value is designated as a hedge and changes in their fair values are recognized currently in income as unrealized gains or losses. As a result, our financial results are, at times, volatile and subject to fluctuations in value primarily because of changes in forward electricity and fuel prices. Adjusting our gross margin to exclude unrealized gains and losses provides a measure of performance that eliminates the volatility created by significant shifts in market values between periods. However, our realized and unrealized gross margin may not be comparable to similarly titled non-GAAP financial measures used by other companies. We encourage our investors to review our unaudited condensed consolidated financial statements and other publicly filed reports in their entirety and not to rely on a single financial measure.
Refer to “Mid-Atlantic” in “Results of Operations—Mirant Americas Generation” above for our realized and unrealized gross margin and operating expenses, additional related details and variance explanations.
Operating Statistics
Our Net Capacity Factor was 43% and 32% for the three months ended September 30, 2010 and 2009, respectively. Our power generation volumes for the three months ended September 30, 2010 (in gigawatt hours)
108
Table of Contents
were 4,914 compared to 3,623 for the same period in 2009. See “Operating Statistics” in “Results of Operations—Mirant Americas Generation” above for additional details on Net Capacity Factor and power generation volumes.
Gross Margin
Refer to “Mid-Atlantic” in “Results of Operations—Mirant Americas Generation” above for our realized and unrealized gross margin, additional related details and variance explanations.
Operating Expenses
Refer to “Mid-Atlantic” in “Results of Operations—Mirant Americas Generation” above for our operating expenses variance explanations.
109
Table of Contents
Nine Months Ended September 30, 2010 versus Nine Months Ended September 30, 2009
Consolidated Financial Performance
We reported net income of $525 million and $604 million for the nine months ended September 30, 2010 and 2009, respectively. The change in net income is detailed as follows (in millions):
| Nine Months Ended September 30, |
Increase/ (Decrease) |
|||||||||||
| 2010 | 2009 | |||||||||||
| Realized gross margin |
$ | 767 | $ | 858 | $ | (91 | ) | |||||
| Unrealized gross margin |
208 | 119 | 89 | |||||||||
| Total gross margin |
975 | 977 | (2 | ) | ||||||||
| Operating Expenses: |
||||||||||||
| Operations and maintenance—nonaffiliate |
200 | 173 | 27 | |||||||||
| Operations and maintenance—affiliate |
146 | 137 | 9 | |||||||||
| Depreciation and amortization |
105 | 73 | 32 | |||||||||
| Gain on sales of assets, net—affiliate |
(3 | ) | (12 | ) | 9 | |||||||
| Total operating expenses, net |
448 | 371 | 77 | |||||||||
| Operating income |
527 | 606 | (79 | ) | ||||||||
| Total other expense, net |
3 | 2 | 1 | |||||||||
| Income before income taxes |
524 | 604 | (80 | ) | ||||||||
| Benefit for income taxes |
(1 | ) | — | (1 | ) | |||||||
| Net income |
$ | 525 | $ | 604 | $ | (79 | ) | |||||
Refer to “Mid-Atlantic” in “Results of Operations—Mirant Americas Generation” above for our realized and unrealized gross margin and operating expenses, additional related details and variance explanations.
Operating Statistics
Our Net Capacity Factor was 36% and 32% for the nine months ended September 30, 2010 and 2009, respectively. Our power generation volumes for the nine months ended September 30, 2010 (in gigawatt hours) were 12,350 compared to 10,965 for the same period in 2009. See “Operating Statistics” in “Results of Operations—Mirant Americas Generation” above for additional details on Net Capacity Factor and power generation volumes.
Gross Margin
Refer to “Mid-Atlantic” in “Results of Operations—Mirant Americas Generation” above for our realized and unrealized gross margin, additional related details and variance explanations.
Operating Expenses
Refer to “Mid-Atlantic” in “Results of Operations—Mirant Americas Generation” above for our operating expenses variance explanations.
110
Table of Contents
Financial Condition
Liquidity and Capital Resources
We expect that we will have sufficient liquidity for our future operations and capital expenditures. We regularly monitor our ability to finance the needs of our operating, investing and financing activities.
Sources of Funds
The principal sources of our liquidity are expected to be: (1) existing cash on hand and expected cash flows from our operations and the operations of our subsidiaries, (2) capital contributions received upon redemptions of preferred shares in Mirant Americas, (3) at its discretion, capital contributions or advances from Mirant North America (4) letters of credit issued or borrowings made under Mirant North America’s senior secured revolving credit facility and letters of credit issued under Mirant North America’s senior secured term loan, and (5) at its discretion, additional capital contributions from Mirant Corporation.
At September 30, 2010, we had $273 million of cash, which amount was available under the leveraged leases for distribution to Mirant North America.
We consider all short-term investments with an original maturity of three months or less to be cash equivalents. At September 30, 2010 and December 31, 2009, except for amounts held in bank accounts to cover upcoming payables, all of our cash and cash equivalents were invested in AAA-rated United States Treasury money market funds.
Uses of Funds
Our requirements for liquidity and capital resources, other than for the day-to-day operation of our generating facilities, are significantly influenced by capital expenditures and payments under our leveraged leases.
Capital Expenditures. Our capital expenditures for the nine months ended September 30, 2010, were $194 million. Our estimated capital expenditures for the period October 1, 2010, through December 31, 2011, are expected to be $313 million. See “Capital Expenditures and Capital Resources” in this Item 2 for further discussion of our capital expenditures.
Operating Leases. We lease the Dickerson and Morgantown baseload units and associated property through 2029 and 2034, respectively, and have an option to extend the leases. We are accounting for these leases as operating leases. Although there is variability in the scheduled payment amounts over the lease term, we recognize rent expense for these leases on a straight-line basis in accordance with the applicable accounting literature. Rent expense under our leases was $24 million and $72 million for both the three and nine months ended September 30, 2010 and 2009, respectively.
Debt Obligations, Off-Balance Sheet Arrangements and Contractual Obligations
Coal Agreements
During the third quarter of 2010, our affiliate, Mirant Energy Trading, entered into a contract on our behalf to purchase coal in both 2012 and 2013. The total notional value of the contract was $275 million.
Cash Flows
Operating Activities. Our cash provided by operating activities is affected by seasonality, changes in energy prices and fluctuations in our working capital requirements. Net cash provided by operating activities decreased $83 million for the nine months ended September 30, 2010, compared to the same period in 2009, primarily as a result of the following:
| • | Realized gross margin. A decrease in cash provided of $106 million in 2010, compared to the same period in 2009, excluding a decrease in non-cash lower of cost or market fuel inventory adjustments of $15 million. See “Results of Operations” under Mirant Americas Generation in this Item 2 for additional discussion of our performance in 2010 compared to the same period in 2009; and |
111
Table of Contents
| • | Operating expenses. An increase in cash used related to higher operations and maintenance expense of $36 million, primarily as a result of costs related to the operation of our scrubbers in 2010. See “Results of Operations” under Mirant Americas Generation in this Item 2 for additional discussion of our performance in 2010 compared to the same period in 2009. |
The increases in cash used in and decrease in cash provided by operating activities were partially offset by the following:
| • | Property taxes. A decrease in cash used of $25 million primarily related to the timing of property tax payments; |
| • | Other operating assets and liabilities. A decrease in cash used of $19 million related to changes in other operating assets and liabilities; and |
| • | Inventories. A decrease in cash used of $15 million primarily related to larger volumes of coal purchased in 2009 compared to the same period in 2010. |
Investing Activities. Net cash used in investing activities decreased by $246 million for the nine months ended September 30, 2010, compared to the same period in 2009. This difference was primarily a result of the following:
| • | Capital expenditures. A decrease in cash used of $254 million primarily related to placing scrubbers for our Maryland generating facilities in service in the fourth quarter of 2009 as part of our compliance with the Maryland Healthy Air Act; partially offset by |
| • | Proceeds from the sales of assets. A decrease in cash provided of $8 million primarily related to the sales of emissions allowances in 2009 as compared to 2010. |
Financing Activities. Net cash used in financing activities increased by $190 million for the nine months ended September 30, 2010, compared to the same period in 2009. This difference was primarily a result of the following:
| • | Distribution to member. An increase in cash used of $200 million as a result of distributions to our member in 2010. We made no distribution in 2009; partially offset by |
| • | Redemption of preferred stock. An increase in cash provided of $11 million as a result of the redemption of Series A preferred stock of Mirant Americas. See Note F to our unaudited condensed consolidated financial statements contained elsewhere in this report for additional information. |
Environmental and Regulatory Matters (Mirant Americas Generation, Mirant North America and Mirant Mid-Atlantic)
Regulation of Greenhouse Gases, including the RGGI. Concern over climate change has led to significant legislative and regulatory efforts at the state and federal level to limit greenhouse gas emissions, especially CO2. One such effort is the RGGI, a multi-state initiative in the Mid-Atlantic and Northeast that outlined a cap-and-trade program to reduce CO2 emissions from electric generating units with capacity of 25 MW or greater by requiring facilities to hold one CO2 allowance for each ton of CO2 that is emitted. The RGGI program calls for participating states, which include Maryland, Massachusetts and New York, to stabilize CO2 emissions to an established level from 2009 through 2014, followed by a 2.5% reduction each year from 2015 through 2018. Each of these three states has promulgated regulations implementing the RGGI. The first three-year control period (which became effective on January 1, 2009, and extends through December 31, 2011), will be followed by a second three-year control period (2012-2014), and a third four-year control period (2015-2018). The RGGI program provides for the banking of CO2 allowances, which gives facilities the ability to carry over unused allowances from a current compliance period into future compliance periods. Complying with the RGGI could have a material adverse effect upon our operations and our operating costs, depending upon the availability and cost of emissions allowances and the extent to which such costs may be offset by higher market prices to recover
112
Table of Contents
increases in operating costs caused by the RGGI. As contemplated in a memorandum of understanding among the participating states, Regional Greenhouse Gas Initiative, Inc. is comprehensively reviewing the program, which may cause the participating states to change the manner in which the program is administered.
During 2009, Mirant Americas Generation and Mirant North America produced approximately 14.6 million tons of CO2 at their Maryland, Massachusetts and New York generating facilities for a total cost of $45 million under the RGGI, including 13.2 million tons of CO2 (for a total cost of $41 million) at Mirant Mid-Atlantic’s Maryland generating facilities. In 2010, Mirant Americas Generation and Mirant North America expect to produce approximately 16.9 million tons of CO2 at their Maryland, Massachusetts and New York generating facilities, including approximately 15.8 million tons at Mirant Mid-Atlantic’s Maryland generating facilities. The RGGI regulations required those facilities to obtain allowances to emit CO2 beginning in 2009. Annual allowances generally were not granted to existing sources of such emissions. Instead, allowances have been made available for such facilities by purchase through periodic auctions conducted quarterly or through subsequent purchase from a party that holds allowances sold through a quarterly auction process. The Maryland regulations implementing the RGGI, which were amended on May 8, 2009, also provide that if the allowance clearing price reaches or exceeds $7 per ton of CO2 in the auctions of allowances that occur during 2009 to 2011 for the current year’s allowances, Maryland will withhold the remainder of that year’s allowances from sale in any future auction during that calendar year and make those allowances available by direct sale at $7 per ton to generators in Maryland. In this scenario, between 0% and 50% of Maryland’s allowances allocated for sale in that year may be made available for purchase by such generators. Any such allowances made available for each generator to purchase at $7 per ton will be in proportion to each generator’s annual average heat input during specified historical periods as compared to the total average input for all affected Maryland generators in existence at that time. In none of the auctions held to date has the price reached $7 per ton.
The ninth auction of allowances by the RGGI states was held on September 8, 2010. The clearing price for the approximately 34.4 million allowances sold in the auction allocated for use beginning in the first control period (2009-2011) was $1.86 per ton. The clearing price for the approximately 1.3 million allowances sold in the auction allocated for use beginning in the second control period (2012-2014) was $1.86 per ton. The allowances sold in this auction may be used for compliance in any of the RGGI states. Further auctions will occur quarterly, with the next auction scheduled for December 1, 2010.
In California, emissions of greenhouse gases are governed by California’s Global Warming Solutions Act (“AB 32”), which requires that statewide greenhouse gas emissions be reduced to 1990 levels by 2020. In December 2008, the California Air Resources Board (“CARB”) approved a Scoping Plan for implementing AB 32. The Scoping Plan requires that the CARB adopt a cap-and-trade regulation by January 2011 and that the cap and trade program begin in 2012. The CARB’s schedule for developing regulations to implement AB 32 is being coordinated with the schedule of the Western Climate Initiative (“WCI”) for development of a regional cap-and-trade program for greenhouse gas emissions. Through the WCI, California is working with other western states and Canadian provinces to coordinate and implement a regional cap-and-trade program. On October 28, 2010, CARB released its proposed cap-and-trade regulation for public comment, with an adoption hearing scheduled for December 16, 2010. If the proposed regulation is adopted, Mirant Americas Generation’s and Mirant North America’s California generating facilities would be required to comply commencing in 2012. The proposed cap-and-trade regulation, as well as other plans, rules and programs approved to implement AB 32, could have a material adverse effect on how Mirant Americas Generation and Mirant North America operate their California generating facilities and the costs of operating the facilities.
In August 2008, Massachusetts adopted its Global Warming Solutions Act (the “Climate Protection Act”), which establishes a program to reduce greenhouse gas emissions significantly over the next 40 years. Under the Climate Protection Act, the Commonwealth of Massachusetts Department of Environmental Protection (“MADEP”) has established a reporting and verification system for statewide greenhouse gas emissions, including emissions from generating facilities producing all electricity consumed in Massachusetts, and determined the state’s
113
Table of Contents
greenhouse gas emissions level from 1990. The Massachusetts Executive Office of Energy and Environmental Affairs (“MAEEA”) is to establish statewide greenhouse gas emissions limits effective beginning in 2020 that will reduce such emissions from the 1990 levels by a range of 10% to 25% beginning in 2020, with the reduction increasing to 80% below 1990 levels by 2050. In setting these limits, the MAEEA is to consider the potential costs and benefits of various reduction measures, including emissions limits for electric generating facilities, and may consider the use of market-based compliance mechanisms. A violation of the emissions limits established under the Climate Protection Act may result in a civil penalty of up to $25,000 per day. Implementation of the Climate Protection Act could have a material adverse effect on how Mirant Americas Generation and Mirant North America operate their Massachusetts generating facilities and the costs of operating those facilities.
In April 2009, the Maryland General Assembly passed the Greenhouse Gas Reduction Act of 2009 (the “Maryland Act”), which became effective in October 2009. The Maryland Act requires a reduction in greenhouse gas emissions in Maryland by 25% from 2006 levels by 2020. However, this provision of the Maryland Act is only in effect through 2016 unless a subsequent statutory enactment extends its effective period. The Maryland Act requires the MDE to develop a proposed implementation plan to achieve these reductions by the end of 2011 and to adopt a final plan by the end of 2012.
In light of the United States Supreme Court ruling in Massachusetts v. EPA that greenhouse gases fit within the Clean Air Act’s definition of “air pollutant,” the EPA has proposed and promulgated regulations regarding the emission of greenhouse gases. In September 2009, the EPA promulgated a rule that requires owners of facilities in many sectors of the economy, including power generation, to report annually to the EPA the quantity and source of greenhouse gas emissions released from those facilities. In addition to this reporting requirement, the EPA has promulgated several rules that address greenhouse gas emissions. In December 2009, under a portion of the Clean Air Act that regulates vehicles, the EPA determined that elevated concentrations of greenhouse gases in the atmosphere endanger the public’s health and welfare through their contribution to climate change (“Endangerment Finding”). In April 2010, the EPA finalized the rule to regulate greenhouse gases from vehicles beginning in model year 2012. In April 2010, the EPA also issued its “Reconsideration of Interpretation of Regulations that Determine Pollutants Covered by Clean Air Act Permitting Programs,” which addresses the scope of pollutants subject to certain permitting requirements under the Clean Air Act as well as when such requirements become effective. The EPA has stated that, because of the vehicle rule, emissions of greenhouse gases from new stationary sources such as power plants and from major modifications to such sources will become subject to certain Clean Air Act permitting requirements as of January 2011. These permitting requirements will require such sources to use “best available control technology” to limit their greenhouse gases, but the EPA has not provided guidance as to what this technology may be. Various parties have sought judicial review of these regulations and we expect that the legal challenges to these regulations will not be resolved for several years. The additional substantive requirements under the Clean Air Act that may apply or may come to apply to stationary sources such as power plants are not clear at this time.
Various bills have been proposed in Congress to govern CO2 emissions from generating facilities. Current proposals include a cap-and-trade system that would require us to purchase allowances for some or all of the CO2 emitted by our generating facilities. Although we expect that market prices for electricity would increase following such legislation and would allow us to recover a portion of the cost of these allowances, we cannot predict with any certainty the actual increases in costs such legislation could impose upon us or our ability to recover such cost increases through higher market rates for electricity, and such legislation could have a material adverse effect on our unaudited condensed consolidated statements of operations, financial positions and cash flows. It is possible that Congress will take action to regulate greenhouse gas emissions within the next several years. The form and timing of any final legislation will be influenced by political and economic factors and is uncertain at this time. During 2009, Mirant Americas Generation and Mirant North America produced approximately 16.1 million tons of CO2 at their generating facilities, including approximately 14 million tons at Mirant Mid-Atlantic’s generating facilities. Mirant Americas Generation and Mirant North America expect to produce approximately 18.4 million total tons of CO2 at their generating facilities in 2010, including approximately 16.9 million total tons at Mirant Mid-Atlantic’s generating facilities in 2010.
114
Table of Contents
Clean Air Interstate Rule. In 2005, the EPA promulgated the CAIR, which established in the eastern United States SO2 and NOx cap-and-trade programs applicable directly to states and indirectly to generating facilities. The NOx cap-and-trade program has two components, an annual program and an Ozone Season program. The CAIR SO2 cap-and-trade program builds off the existing acid rain cap-and-trade program but requires generating facilities to surrender twice as many allowances to cover emissions from 2010 through 2014 and approximately three times as many allowances starting in 2015. Maryland, New York and Virginia are subject to the CAIR’s SO2 and both NOx trading programs. Massachusetts is subject only to the CAIR’s Ozone Season NOx trading program. These cap-and-trade programs were to be implemented in two phases, with the first phase going into effect in 2009 for NOx and 2010 for SO2 and more stringent caps going into effect in 2015. Various parties challenged the EPA’s adoption of the CAIR, and on July 11, 2008, the DC Circuit in State of North Carolina v. Environmental Protection Agency issued an opinion that would have vacated the CAIR. Various parties filed requests for rehearing with the DC Circuit and on December 23, 2008, the DC Circuit issued a second opinion in which it granted rehearing only to the extent that it remanded the case to the EPA without vacating the CAIR. Accordingly, the CAIR will remain effective until it is replaced by a rule consistent with the DC Circuit’s opinions. The four states in which Mirant Americas Generation and Mirant North America operate (i.e., Maryland, Massachusetts, New York and Virginia) and two states in which Mirant Mid-Atlantic operates that are subject to CAIR (i.e., Maryland and Virginia) have promulgated regulations implementing the federal CAIR.
The EPA has stated that it expects to finalize the regulations to replace the CAIR in 2011, and on August 2, 2010, the EPA proposed a rule (the “Proposed Transport Rule”) and two possible alternatives to replace the CAIR. If finalized, the Proposed Transport Rule and each of the alternatives would impose more stringent emission reductions than were required under the CAIR. The EPA’s Proposed Transport Rule would establish an emissions budget for each of thirty-one eastern and midwestern states and the District of Columbia, and would allow limited interstate trading. For SO2, generating facilities in a region comprised of Illinois, Indiana, Iowa, Georgia, Kentucky, Ohio, Michigan, Missouri, New York, North Carolina, Pennsylvania, Tennessee, Virginia, West Virginia and Wisconsin would be subject to a more stringent cap on SO2 emissions than the other states subject to the rule, and would not be allowed to use emissions allowances from sources in a separate region comprised of Alabama, Delaware, the District of Columbia, Florida, Kansas, Louisiana, Maryland, Massachusetts, Minnesota, Nebraska, New Jersey, Rhode Island and South Carolina. For both SO2 and NOx, interstate trading of emissions allowances would be allowed only to the extent that the total number of emissions allowances used within a particular state did not exceed the state’s budgeted allowances plus a “variability limit” intended to account for the variability of emissions due to changes in demand for electricity, timing of maintenance activities and unit outages. If total emissions allowances used within a state in a year exceed the annual budget plus the variability limit, then owners of generating facilities in that state that are deemed responsible for the state’s exceedance would be required to surrender additional allowances. The two alternatives on which the EPA is seeking comment would further restrict trading. Under the first alternative, only intrastate trading of allowances would be allowed. The second alternative would establish an emissions limit for each generating facility, with some averaging allowed. Finally, the EPA has also stated that it may issue a subsequent, more stringent rule if the EPA concludes that recent or planned revisions to the particulate matter and ozone NAAQS make necessary more stringent limits on SO2 and NOx emissions from electric generating facilities. We continue to monitor developments related to the EPA’s proposed alternatives to replace the existing CAIR rule.
Virginia CAIR Implementation. In April 2006, Virginia enacted legislation that, among other things, granted the Virginia State Air Pollution Control Board the discretion to prohibit electric generating facilities located in a non-attainment area from purchasing SO2 and NOx allowances to achieve compliance under the EPA’s CAIR. In the fourth quarter of 2007, the Virginia State Air Pollution Control Board approved regulations that it interpreted as prohibiting the acquisition in any manner of SO2 and NOx allowances by facilities in non-attainment areas to satisfy the requirements of the CAIR as implemented by Virginia. Mirant Potomac River’s generating facility is located in a non-attainment area for ozone. Thus, this Virginia regulation effectively capped the Potomac River generating facility’s SO2 and NOx emissions at amounts equal to the allowances allocated to the facility, which constrained the facility’s operations. Mirant Potomac River challenged the legality of the regulations regarding the trading of NOx allowances in Virginia state court. On June 23, 2009, the Court of Appeals of Virginia issued
115
Table of Contents
an opinion concluding that the Virginia State Air Pollution Control Board exceeded its statutory authority. The Virginia State Air Pollution Control Board petitioned the Virginia Supreme Court to review the decision by the Virginia Court of Appeals, and the Virginia Supreme Court denied that request on October 15, 2009. In January 2010, the Virginia DEQ informed Mirant Potomac River that in light of the decision of the Virginia Court of Appeals vacating Virginia’s rules restricting trading, the Virginia DEQ had determined that issuing a state operating permit to limit NOx emissions during the Ozone Season was warranted. In July 2010, the Virginia DEQ issued a permit that limits NOx emissions from Mirant Potomac River’s generating facility to 890 tons during the Ozone Season that the Virginia DEQ asserts is effective for the 2010 Ozone Season. We think that at current market prices the new limit on NOx emissions during the Ozone Season will not have a material effect upon our results of operations, financial positions or cash flows.
EPA Regulations Regarding Coal Combustion Byproducts. In June 2010, the EPA proposed two alternatives for regulating byproducts of coal combustion (e.g., ash and gypsum) under the federal Resource Conservation and Recovery Act of 1976. Under the first proposal, these byproducts would be regulated as solid wastes. Under the second proposal, these byproducts would be regulated as “special wastes” in a manner similar to the regulation of hazardous waste with an exception for beneficial reuse of these byproducts. The second alternative would impose significantly more stringent requirements on and increase materially the cost of disposal of coal combustion byproducts. The EPA expects to finalize this rule in 2011.
Kendall NPDES and Surface Water Discharge Permit (Mirant Americas Generation and Mirant North America). On September 26, 2006, the EPA issued to Mirant Kendall a National Pollution Discharge Elimination System (“NPDES”) renewal permit for the Kendall generating facility. The same permit was concurrently issued by the MADEP as a state Surface Water Discharge Permit (“SWD Permit”), and was accompanied by MADEP’s earlier issued water quality certificate under section 401 of the Clean Water Act. The new permits imposed new temperature limits at various points in the Charles River, an extensive temperature, water quality and biological monitoring program and a requirement to develop and install a barrier net system to reduce fish impingement and entrainment. The provisions regulating the thermal discharge could have caused substantial curtailments of the operations of the Kendall generating facility. Mirant Kendall appealed the permits in three proceedings: (1) appeal of the NPDES permit to the EPA’s Environmental Appeals Board; (2) appeal of the SWD Permit to the MADEP; and (3) appeal of the water quality certification to the MADEP. The effect of the permits was stayed pending the outcome of those appeals. The two appeals to the MADEP were stayed pending the outcome of the appeal to the Environmental Appeals Board. On September 28, 2007, the Environmental Appeals Board stayed the appeal proceedings in order for the EPA to address the sections of the permit that were affected by the EPA’s suspension of its regulations governing cooling water intake structures for existing power plants adopted under section 316(b) of the Clean Water Act (the “316(b) regulations”) as a result of the 2007 decision by the United States Court of Appeals for the Second Circuit in Riverkeeper, Inc. et al. v. EPA that remanded to the EPA for reconsideration numerous provisions of those regulations. On December 19, 2008, the EPA and the MADEP issued final permit modifications to address the 316(b) regulations. Those permit modifications would have required modifications to the intake structure for the Kendall generating facility to add fine and coarse mesh barrier exclusion technologies and to install a mechanism to sweep organisms away from the intake structure through an induced water flow. On February 2, 2009, Mirant Kendall filed appeals of those modifications, which appeals were joined with the appeals of the 2006 permits and stayed the effect of those permit modifications.
On October 15, 2010, Mirant Kendall submitted a permit modification request to the EPA and MADEP that requested modification of the 2006 permits (as previously modified in 2008) to reflect revised permit terms agreed upon among Mirant Kendall, the EPA and MADEP as part of a settlement of the permit renewal proceedings pending before EPA and MADEP. The settlement contemplates that an additional pipeline will be installed across the Charles River under the Longfellow Bridge to allow Mirant Kendall to make additional steam sales to Trigen-Boston Energy Corporation in Boston and that Mirant Kendall will install a back pressure steam turbine and air cooled condenser at the Kendall generating station. This new pipeline and equipment, once operational, would allow Mirant Kendall to reduce significantly its use of water from the Charles River. On October 25, 2010, EPA and MADEP issued the proposed revised permits (the “2010 Kendall Permits”) as draft permit modifications for public
116
Table of Contents
comment, with any comments due by November 23, 2010. Mirant Kendall expects the 2010 Kendall Permits to be issued as final permits by the EPA and MADEP in late 2010 or the first quarter of 2011. The 2010 Kendall Permits will limit Mirant Kendall to drawing no more than 3.2 million gallons of water per day from the river under normal operations, impose temperature limits similar to the 2006 permits, and require monitoring of temperatures at various points in the river when the Kendall generating facility is discharging water to the river. The 2010 Kendall Permits do not require the installation of barrier nets or modifications to the intake structure at the facility. Because river water will no longer be used for once-through cooling under normal operations once the new pipeline and equipment have been installed, Mirant Kendall expects the 2010 Kendall Permits to impose significantly less risk that operations of the facility would have to be curtailed to maintain compliance with the temperature limits. As part of its settlement with the EPA and MADEP, Mirant Kendall expects the EPA and MADEP to issue administrative consent orders that defer application of the new limit on the amount of river water used by the Kendall generating facility and the new temperature limits imposed by the 2010 Kendall Permits until installation has been completed of the new pipeline, the back pressure steam turbine, and the air cooled condenser, which is not expected to occur until 2015.
117
Table of Contents
Critical Accounting Estimates (Mirant Americas Generation, Mirant North America and Mirant Mid-Atlantic)
The sections below contain updates to our summary of critical accounting estimates included under Item 7, Management’s Discussion and Analysis of Results of Operations and Financial Condition, in our 2009 Annual Report on Form 10-K.
Revenue Recognition and Accounting for Energy Trading and Marketing Activities
Nature of Estimates Required. We utilize two comprehensive accounting models, an accrual model and a fair value model, in reporting our results of operations and financial positions. We determine the appropriate model for our operations based on applicable accounting standards.
The accrual model is used to account for our revenues from the sale of energy, capacity and ancillary services. We recognize revenue when it has been earned and collection is probable as a result of electricity delivered or capacity available to customers pursuant to contractual commitments that specify volume, price and delivery requirements. Sales of energy are based on economic dispatch, or they may be ‘as-ordered’ by an ISO or RTO, based on member participation agreements, but without an underlying contractual commitment. ISO and RTO revenues and revenues for sales of energy based on economic dispatch are recorded on the basis of MWh delivered, at the relevant day-ahead or real-time prices.
The fair value model is used to measure fair value on a recurring basis for derivative energy contracts that are used to manage our exposure to commodity price risk or that are used in Mirant Americas Generation’s and Mirant North America’s proprietary trading and fuel oil management activities. We use a variety of derivative financial instruments, such as futures, forwards, swaps and option contracts, in the management of our business. Such derivative financial instruments have varying terms and durations, or tenors, which range from a few days to a number of years, depending on the instrument.
Derivative financial instruments are reflected in our unaudited condensed consolidated financial statements at fair value, with changes in fair value recognized currently in income unless they qualify for a scope exception pursuant to the accounting guidance. Management considers fair value techniques and valuation adjustments related to credit and liquidity to be critical accounting estimates. These estimates are considered significant because they are highly susceptible to change from period to period and are dependent on many subjective factors. The fair value of derivative financial instruments is included in derivative contract assets and liabilities in our unaudited condensed consolidated balance sheets. Transactions that are not accounted for using the fair value model under the accounting guidance for derivative financial instruments are either not derivatives or qualify for a scope exception and are accounted for under accrual accounting. We recognize immediately in income inception gains and losses for transactions at other than the bid price or ask price.
Key Assumptions and Approach Used. Determining the fair value of our derivatives is based largely on observable quoted prices from exchanges and independent brokers in active markets. We think that these prices represent the best available information for valuation purposes. For most delivery locations and tenors where we have positions, we receive multiple independent broker price quotes. In accordance with the exit price objective under the fair value measurements accounting guidance, the fair value of our derivative contract assets and liabilities is determined based on the net underlying position of the recorded derivative contract assets and liabilities using bid prices for our assets and ask prices for liabilities. If no active market exists, we estimate the fair value of certain derivative financial instruments using price extrapolation, interpolation and other quantitative methods. We have not identified any distressed market conditions that would alter our valuation techniques at September 30, 2010. Fair value estimates involve uncertainties and matters of significant judgment. Our techniques for fair value estimation include assumptions for market prices, correlation and volatility. The degree of estimation increases for longer duration contracts, contracts with multiple pricing features, option contracts and off-hub delivery points. Note B to our unaudited condensed consolidated financial statements contained elsewhere in this report explains the fair value hierarchy. Mirant Americas Generation’s and Mirant
118
Table of Contents
North America’s assets and liabilities classified as Level 3 in the fair value hierarchy represent approximately 2% of their total assets and 5% of their total liabilities measured at fair value at September 30, 2010. Mirant Mid-Atlantic’s assets classified as Level 3 in the fair value hierarchy represented 2% of its total assets and 20% of its total liabilities measured at fair value at September 30, 2010.
The fair value of derivative contract assets and liabilities in our unaudited condensed consolidated balance sheets is also affected by our assumptions as to time value, credit risk and non-performance risk. The nominal value of the contracts is discounted using a forward interest rate curve based on LIBOR. In addition, the fair value of our derivative contract assets is reduced to reflect the estimated default risk of counterparties on their contractual obligations to us. The default risk of our counterparties for a significant portion of our overall net position is measured based on published spreads on credit default swaps. The fair value of our derivative contract liabilities is reduced to reflect our estimated risk of default on our contractual obligations to counterparties and is measured based on published default rates of our debt. The credit risk reflected in the fair value of our derivative contract assets and the non-performance risk reflected in the fair value of our derivative contract liabilities are calculated with consideration of our master netting agreements with counterparties and our exposure is reduced by cash collateral posted to us against these obligations.
Effect if Different Assumptions Used. The amounts recorded as revenue or cost of fuel, electricity and other products change as estimates are revised to reflect actual results and changes in market conditions or other factors, many of which are beyond our control. Because we use derivative financial instruments and have not elected cash flow or fair value hedge accounting, certain components of our financial statements, including gross margin, operating income and balance sheet ratios, are at times volatile and subject to fluctuations in value primarily as a result of changes in forward energy and fuel prices. Significant negative changes in fair value could require us to post additional collateral either in the form of cash or letters of credit. Because the fair value measurements of our material assets and liabilities are based on observable market information, there is not a significant range of values around the fair value estimate. For our derivative financial instruments that are measured at fair value using quantitative pricing models, a significant change in estimate could affect our results of operations and cash flows at the time contracts are ultimately settled. The estimated fair value of Mirant Americas Generation’s and Mirant North America’s derivative contract assets and liabilities was a net asset of $881 million at September 30, 2010. A 10% change in electricity and fuel prices would result in approximately a $131 million change in the fair value of their net asset at September 30, 2010. The estimated fair value of Mirant Mid-Atlantic’s derivative contract assets and liabilities was a net asset of $878 million at September 30, 2010. A 10% change in electricity and fuel prices would result in approximately a $127 million change in the fair value of its net asset at September 30, 2010. See Item 3, “Quantitative and Qualitative Disclosures About Market Risk” for further sensitivities in our assumptions used to calculate fair value. See Note B to our unaudited condensed consolidated financial statements contained elsewhere in this report for further information on derivative financial instruments related to energy trading and marketing activities.
Estimated Useful Lives
Nature of Estimates Required. The estimated useful lives of our long-lived assets are used to compute depreciation expense, determine the carrying value of asset retirement obligations and estimate expected future cash flows attributable to an asset for the purposes of impairment testing. Estimated useful lives are based, in part, on the assumption that we provide an appropriate level of capital expenditures while the assets are still in operation. Without these continued capital expenditures, the useful lives of these assets could decrease significantly.
Key Assumptions and Approach Used. Estimated useful lives are the mechanism by which we allocate the cost of long-lived assets over the asset’s service period. We perform depreciation studies periodically to update changes in estimated useful lives. The actual useful life of an asset could be affected by changes in estimated or actual commodity prices, environmental regulations, various legal factors, competitive forces and our liquidity and ability to sustain required maintenance expenditures and satisfy asset retirement obligations. We use
119
Table of Contents
composite depreciation for groups of similar assets and establish an average useful life for each group of related assets. In accordance with the accounting guidance related to evaluating long-lived assets for impairment, we cease depreciation on long-lived assets classified as held for sale. Also, we may revise the remaining useful life of an asset held and used subject to impairment testing.
We completed a depreciation study in the first quarter of 2010 that resulted in a change to the estimated useful lives of our long-lived assets. The change in useful lives resulted in a decrease of approximately $2 million and $4 million in depreciation and amortization expense for Mirant Americas Generation and Mirant North America, and a decrease of approximately $3 million and $8 million for Mirant Mid-Atlantic for the three and nine months ended September 30, 2010, respectively. In addition, the change in useful lives also resulted in an increase of $9 million in Mirant Americas Generation’s and Mirant North America’s asset retirement obligations and $1 million in Mirant Mid-Atlantic’s asset retirement obligations and a corresponding increase of $9 million in Mirant Americas Generation’s and Mirant North America’s property, plant and equipment, net and $1 million in Mirant Mid-Atlantic’s property, plant and equipment, net at September 30, 2010.
Effect if Different Assumptions Used. The determination of estimated useful lives is dependent on subjective factors such as expected market conditions, commodity prices and anticipated capital expenditures. Since composite depreciation rates are used, the actual useful life of a particular asset may differ materially from the useful life estimated for the related group of assets.
Asset Impairments
Nature of Estimates Required. We evaluate our long-lived assets, including intangible assets, for impairment in accordance with applicable accounting guidance. The amount of an impairment charge is calculated as the excess of the asset’s carrying value over its fair value, which generally represents the discounted expected future cash flows attributable to the asset, or in the case of an asset we expect to sell, as its fair value less costs to sell.
The accounting guidance related to impairments of long-lived assets requires management to recognize an impairment charge if the sum of the undiscounted expected future cash flows from a long-lived asset or definite-lived intangible asset is less than the carrying value of that asset. We evaluate our long-lived assets (property, plant and equipment) and definite-lived intangible assets for impairment whenever indicators of impairment exist or when we commit to sell the asset. These evaluations of long-lived assets and definite-lived intangible assets may result from significant decreases in the market price of an asset, a significant adverse change in the extent or manner in which an asset is being used or in its physical condition, a significant adverse change in legal factors or in the business climate that could affect the value of an asset, as well as other economic or operational analyses. If the carrying amount is not recoverable, an impairment charge is recorded.
The prices for power and natural gas remain low compared to several years ago. The energy gross margin from our baseload coal units is negatively affected by these price levels. Additionally, the current weak economic conditions and various demand-response programs have resulted in a decrease in the forecasted gross margin of our generating facilities. On an ongoing basis, we evaluate our long-lived assets for indications of impairment; however, given the remaining useful lives for many of our generating facilities, the total undiscounted cash flows for these generating facilities are more significantly affected by the long-term view of supply and demand than by the short term fluctuations in energy prices and demand. As such, we typically do not consider short term decreases in either energy prices or demand to cause an impairment evaluation.
Key Assumptions and Approach Used. The impairment evaluation is a two-step process, the first of which involves comparing the undiscounted cash flows to the carrying value of the asset. If the carrying value exceeds the undiscounted cash flows, the fair value of the asset must be calculated on a discounted basis. The fair value of an asset is the price that would be received from a sale of the asset in an orderly transaction between market participants at the measurement date. Quoted market prices in active markets are the best evidence of fair value and are used as the basis for the measurement, when available. In the absence of quoted prices for identical or
120
Table of Contents
similar assets, fair value is estimated using various internal and external valuation methods. These methods include discounted cash flow analyses and reviewing available information on comparable transactions. The determination of fair value requires management to apply judgment in estimating future capacity and energy prices, environmental and maintenance expenditures and other cash flows. Our estimates of the fair value of the assets include significant assumptions about the timing of future cash flows, remaining useful lives and the selection of a discount rate that represents the estimated weighted average cost of capital consistent with the risk inherent in future cash flows.
Mirant Mid-Atlantic—Our Dickerson generating facility is located in Montgomery County, Maryland. On May 19, 2010, the Montgomery County Council passed a law that imposes a levy on major emitters of CO2 in Montgomery County of $5 per ton of CO2 emitted. The law defines a major emitter of CO2 in Montgomery County to be a stationary source emitting 1 million tons or more annually of CO2. The Dickerson generating facility falls within the definition of a major emitter, and is currently the only facility in Montgomery County that meets the criteria to be a major emitter. We estimate that the law will impose an additional $10 million to $15 million per year in levies owed to Montgomery County. We have challenged the legality of the law, but cannot predict the outcome of any such challenge. As a result of Montgomery County enacting the levy, we reviewed the Dickerson generating facility for impairment in the second quarter of 2010.
As a result of the impairment analysis, we determined that no impairment charge was required because the scenario-weighted undiscounted cash flows exceeded the carrying value. Our estimate of future cash flows related to the Dickerson generating facility involved considering scenarios related to the Montgomery County levy. The scenarios are related to the success of the legal challenges to the law.
Our assessment of the Dickerson generating facility in the second quarter of 2010 included assumptions about the following:
| • | electricity, fuel and emissions prices; |
| • | capacity payments under the RPM provisions of PJM’s tariff; |
| • | costs related to the Montgomery County CO2 emissions levy; |
| • | costs of CO2 allowances under a potential federal cap-and-trade program; |
| • | timing of announced transmission projects; |
| • | timing and extent of generating capacity additions and retirements; and |
| • | future capital expenditure requirements for the generating facility. |
Our assumptions related to future electricity and fuel prices were based on observable market prices to the extent available and long-term prices derived from proprietary fundamental market modeling. The long-term capacity prices were based on the assumption that the PJM RPM capacity market would continue consistent with the current structure, with expected increases in revenue as a result of declines in reserve margins for periods beyond those for which auctions have already been completed. The total CO2 costs under the levy were determined by applying the cost of CO2 emissions to the expected generation forecasts. We also assumed that a federal CO2 cap-and-trade program would be instituted later this decade which would supplant all pre-existing CO2 programs, including the Montgomery County levy. There are several transmission projects currently planned in the Mid-Atlantic region, including the Trans-Allegheny Interstate Line (“TrAIL”), Mid-Atlantic Power Pathway transmission line (“MAPP”) and the Potomac-Appalachian transmission line (“PATH”). The assumptions regarding the timing of these projects were based on the current status of permitting and construction of each project. The assumptions regarding electricity demand were based on forecasts from PJM and assumptions for generating capacity additions and retirements considered publicly-announced projects, including renewable sources of electricity and additions of nuclear capacity. Capital expenditures include the remaining contract retention payments for the completion of the Maryland Healthy Air Act pollution control equipment.
121
Table of Contents
The estimates and assumptions used in the impairment analysis of the Dickerson generating facility are subject to a high degree of uncertainty, and changes in these assumptions could result in future impairment losses. The scenario-weighted undiscounted cash flows exceeded the carrying value of the Dickerson generating facility by less than 5%. A decrease in projected electricity prices or an increase in coal prices would decrease the future cash flows of the Dickerson generating facility. Additionally, changes to the structure of the PJM RPM capacity market could negatively affect the future capacity prices the facility will earn. The assumptions include the development of a potential federal cap-and-trade program for CO2 emissions. If we are not compensated for the costs of complying with a federal CO2 program through allocated CO2 allowances, increased electricity and capacity prices or decreased coal prices, the cash flows of the Dickerson generating facility would be negatively affected. In addition, if pre-existing CO2 emission programs such as the Montgomery County levy are allowed to remain in effect under a federal CO2 program, the cash flows of the Dickerson generating facility would be negatively affected. If the planned transmission projects are completed earlier than assumed, this could negatively affect the cash flows of the facility. Also, changes in assumptions regarding generating capacity additions and retirements in the PJM region could affect the cash flows, depending on the timing and extent of additions and retirements. The assumptions include only those capital expenditures needed to keep the plant operational through its estimated remaining useful life. However, changes in laws or regulations could require additional capital investments beyond amounts forecasted to keep the plant operational.
The estimates of future cash flows did not include contracts entered into to hedge economically the expected generation of Mirant Mid-Atlantic’s generating facilities. The cash flows related to these contracts were excluded because they were not directly attributable to the Dickerson generating facility.
For purposes of impairment testing, a long-lived asset or assets must be grouped at the lowest level of independent identifiable cash flows. The Dickerson generating facility was determined to be its own group, which includes the leasehold improvements for the leased generating units at the facility. The carrying value of the Dickerson generating facility represented approximately 16% of Mirant Americas Generation’s and Mirant North America’s total property, plant and equipment, net and 19% of Mirant Mid-Atlantic’s total property, plant and equipment, net at September 30, 2010.
Mirant Bowline—In April 2010, the NYISO issued its annual peak load and energy forecast, which Mirant Americas Generation and Mirant North America have evaluated and utilized to develop cash flow projections for the Bowline generating facility. Incorporating these assumptions, along with the current status related to the property tax proceedings, the undiscounted cash flows significantly exceed the carrying value of the long-lived assets. The carrying value of the Bowline generating facility represented approximately 4% of Mirant Americas Generation’s and Mirant North America’s total property, plant and equipment, net at September 30, 2010.
Emissions Allowances—In August 2010, the EPA proposed a replacement for the CAIR. The market prices for SO2 and NOx emissions allowances declined as a result of the proposed rule. Our historical accounting policy has been to include emissions allowances in our asset groupings when evaluating long-lived assets for impairment. However, to the extent the final EPA rule significantly modifies or ends the current cap-and-trade program, we may evaluate whether our SO2 and NOx emissions allowances included in property, plant and equipment and intangible assets should be evaluated separately from the underlying generating facilities. The carrying value of the SO2 and NOx emissions allowances included in property, plant and equipment and intangible assets at September 30, 2010 was approximately $186 million at Mirant Americas Generation and Mirant North America and approximately $148 million at Mirant Mid-Atlantic. See “Environmental and Regulatory Matters” earlier in this section for further information on the EPA’s proposed replacement of the CAIR.
Mirant Potrero—In the third quarter of 2009, Mirant Potrero executed a settlement agreement with the City of San Francisco in which it agreed to shut down the Potrero facility when it is no longer needed for reliability, as determined by the CAISO. Mirant Potrero agreed in the settlement agreement to submit to the CAISO a notice of intent to shut down the facility as of December 31, 2010. The CAISO will make the final determination on when each of the units at the Potrero generating facility is no longer needed for reliability and may be shut down. As a
122
Table of Contents
result of the settlement agreement, Mirant Americas Generation and Mirant North America evaluated their 362 MW Potrero generating facility for impairment during the third quarter of 2009. Mirant Americas Generation and Mirant North America developed multiple scenarios for the future expected operations of the Potrero generating facility based on the settlement agreement and the expected timing of certain projects to ensure reliability of electricity supply for the City of San Francisco. One such project is the TransBay Cable, an underwater electric transmission cable in the San Francisco Bay that is expected to decrease the need for generating resources in the City of San Francisco, which we expect to become operational in 2010 and reduce the reliability need for our Potrero unit 3. Mirant Americas Generation’s and Mirant North America’s cash flows included assumptions about the future operating costs of the Potrero facility as well as the corresponding revenues to be received under an RMR agreement. Mirant Americas Generation and Mirant North America also obtained multiple appraisals to value the land. The sum of the probability weighted undiscounted cash flows for the Potrero generating facility exceeded the carrying value as of September 30, 2009. As a result, Mirant Americas Generation and Mirant North America did not record an impairment charge for the tangible assets at the Potrero generating facility for the three and nine months ended September 30, 2009. The carrying value of the Potrero generating facility represented less than 1% of Mirant Americas Generation’s and Mirant North America’s total property, plant and equipment, net at September 30, 2010.
The asset group for Mirant Potrero included intangible assets recorded at Mirant California related to trading rights and development rights. As a result of certain terms included in the settlement agreement, Mirant Americas Generation and Mirant North America separately evaluated the trading and development rights associated with the Potrero generating facility for impairment and determined that both of these intangible assets were fully impaired as of September 30, 2009. Accordingly, Mirant Americas Generation and Mirant North America recognized an impairment loss of $9 million on their unaudited condensed consolidated statements of operations to write off the carrying value of the intangible assets related to the Potrero generating facility. See Note C to Mirant Americas Generation’s and Mirant North America’s unaudited condensed consolidated financial statements contained elsewhere in this report for further information related to our impairment analysis of the Potrero generating facility and related intangible assets.
Mirant Delta—On September 2, 2009, Mirant Delta entered into an agreement with PG&E for the 674 MW at Contra Costa units 6 and 7 for the period from November 2011 through April 2013. At the end of the agreement, and subject to any necessary regulatory approval, Mirant Delta has agreed to retire Contra Costa units 6 and 7, which began operations in 1964, in furtherance of state and federal policies to retire aging power plants that utilize once-through cooling technology. Mirant Americas Generation and Mirant North America evaluated the trading rights related to Mirant Delta’s Contra Costa generating facility for impairment during the third quarter of 2009 as a result of the retirement provisions in the tolling agreement. Because the Contra Costa generating facility is under contract with PG&E through the expected shutdown date, Mirant Americas Generation and Mirant North America determined the intangible asset was fully impaired as of September 30, 2009. Mirant Americas Generation and Mirant North America recorded an impairment loss of $5 million on the unaudited condensed consolidated statement of operations to write off the carrying value of the trading rights related to the Contra Costa generating facility.
Effect if Different Assumptions Used. The estimates and assumptions used to determine whether an impairment exists are subject to a high degree of uncertainty. The estimated fair value of an asset would change if different estimates and assumptions were used in our applied valuation techniques, including estimated undiscounted cash flows, discount rates and remaining useful lives for assets held and used. If actual results are not consistent with the assumptions used in estimating future cash flows and asset fair values, we may be exposed to additional losses that could be material to our results of operations.
Litigation
We are currently involved in certain legal proceedings. We estimate the range of liability through discussions with applicable legal counsel and analysis of case law and legal precedents. We record our best
123
Table of Contents
estimate of a loss, or the low end of our range if no estimate is better than another estimate within a range of estimates, when the loss is considered probable and can be reasonably estimated. As additional information becomes available, we reassess the potential liability related to our pending litigation and revise our estimates. Revisions in our estimates of the potential liability could materially affect our results of operations and the ultimate resolution may be materially different from the estimates that we make.
See Note I to our unaudited condensed consolidated financial statements contained elsewhere in this report for further information related to our legal proceedings.
Recently Adopted Accounting Guidance
See Note A to our unaudited condensed consolidated financial statements contained elsewhere in this report for further information related to our recently adopted accounting guidance.
124
Table of Contents
| Item 3. | Quantitative and Qualitative Disclosures About Market Risk (Mirant Americas Generation, Mirant North America and Mirant Mid-Atlantic) |
We are exposed to market risk, primarily associated with commodity prices. We also consider risks associated with interest rates and credit when valuing our derivative financial instruments.
Mirant Americas Generation and Mirant North America
The estimated net fair value of our derivative contract assets and liabilities was a net asset of $881 million and $722 million at September 30, 2010 and 2009, respectively. The following tables provide a summary of the factors affecting the change in fair value of the derivative contract asset and liability accounts for the nine months ended September 30, 2010 and 2009 (in millions):
| Commodity Contracts | ||||||||||||
| Asset Management |
Trading Activities |
Total | ||||||||||
| Fair value of portfolio of assets and liabilities at January 1, 2010 |
$ | 701 | $ | 1 | $ | 702 | ||||||
| Gains (losses) recognized in the period, net: |
||||||||||||
| New contracts and other changes in fair value1 |
279 | 59 | 338 | |||||||||
| Roll off of previous values2 |
(229 | ) | (63 | ) | (292 | ) | ||||||
| Purchases, issuances and settlements3 |
135 | (2 | ) | 133 | ||||||||
| Fair value of portfolio of assets and liabilities at September 30, 2010 |
$ | 886 | $ | (5 | ) | $ | 881 | |||||
| Commodity Contracts | ||||||||||||
| Asset Management |
Trading Activities |
Total | ||||||||||
| Fair value of portfolio of assets and liabilities at January 1, 2009 |
$ | 549 | $ | 106 | $ | 655 | ||||||
| Gains (losses) recognized in the period, net: |
||||||||||||
| New contracts and other changes in fair value1 |
6 | (109 | ) | (103 | ) | |||||||
| Roll off of previous values2 |
(419 | ) | (67 | ) | (486 | ) | ||||||
| Purchases, issuances and settlements3 |
550 | 106 | 656 | |||||||||
| Fair value of portfolio of assets and liabilities at September 30, 2009 |
$ | 686 | $ | 36 | $ | 722 | ||||||
| 1 | The fair value, as of the end of each quarterly reporting period, of contracts entered into during each quarterly reporting period and the gains or losses attributable to contracts that existed as of the beginning of each quarterly reporting period and were still held at the end of each quarterly reporting period. |
| 2 | The fair value, as of the beginning of each quarterly reporting period, of contracts that settled during each quarterly reporting period. |
| 3 | Denotes cash settlements during each quarterly reporting period of contracts that existed at the beginning of each quarterly reporting period. |
125
Table of Contents
Mirant Mid-Atlantic
The estimated net fair value of our derivative contract assets and liabilities was a net asset of $878 million and $645 million at September 30, 2010 and 2009, respectively. The following tables provide a summary of the factors affecting the change in fair value of the derivative contract asset and liability accounts for the nine months ended September 30, 2010 and 2009, respectively (in millions):
| Asset Management |
||||
| Fair value of portfolio of assets and liabilities at January 1, 2010 |
$ | 670 | ||
| Gains (losses) recognized in the period, net: |
||||
| New contracts and other changes in fair value1 |
268 | |||
| Roll off of previous values2 |
(213 | ) | ||
| Purchases, issuances and settlements3 |
153 | |||
| Fair value of portfolio of assets and liabilities at September 30, 2010 |
$ | 878 | ||
| Asset Management |
||||
| Fair value of portfolio of assets and liabilities at January 1, 2009 |
$ | 526 | ||
| Gains (losses) recognized in the period, net: |
||||
| New contracts and other changes in fair value1 |
(29 | ) | ||
| Roll off of previous values2 |
(379 | ) | ||
| Purchases, issuances and settlements3 |
527 | |||
| Fair value of portfolio of assets and liabilities at September 30, 2009 |
$ | 645 | ||
| 1 | The fair value, as of the end of each quarterly reporting period, of contracts entered into during each quarterly reporting period and the gains or losses attributable to contracts that existed as of the beginning of each quarterly reporting period and were still held at the end of each quarterly reporting period. |
| 2 | The fair value, as of the beginning of each quarterly reporting period, of contracts that settled during each quarterly reporting period. |
| 3 | Denotes cash settlements during each quarterly reporting period of contracts that existed at the beginning of each quarterly reporting period. |
In May 2010, we concluded that we could no longer assert that physical delivery is probable for many of our coal agreements. The conclusion was based on expected generation levels, changes observed in the coal markets and substantial progress in the construction of a coal blending facility at the Morgantown generating facility that will allow for greater flexibility of our coal supply. Because we can no longer assert that physical delivery of coal from these agreements is probable, we are required to apply fair value accounting for these contracts in the current period and prospectively. The fair value of these derivative contracts is included in the tables above.
We did not elect the fair value option for any financial instruments under the accounting guidance. However, we do transact using derivative financial instruments and they are required to be recorded at fair value under the accounting guidance related to derivative financial instruments in our unaudited condensed consolidated balance sheets.
Counterparty Credit Risk
The valuation of our derivative contract assets is affected by the default risk of the counterparties with which we transact. We recognized a reserve, which is reflected as a reduction of our derivative contract assets, related to counterparty credit risk of $26 million and $13 million at September 30, 2010 and December 31, 2009, respectively.
In accordance with the fair value measurements accounting guidance, we calculate the credit reserve through consideration of observable market inputs, when available. Our non-collateralized power hedges entered into by Mirant Mid-Atlantic with our major trading partners, which represent 65% of the net notional power position of
126
Table of Contents
Mirant Americas Generation, Mirant North America and Mirant Mid-Atlantic at September 30, 2010, are senior unsecured obligations of Mirant Mid-Atlantic and the counterparties, and do not require either party to post cash collateral for initial margin or for securing exposure as a result of changes in power or natural gas prices. We calculate the credit reserve for our non-collateralized power hedges entered into by Mirant Mid-Atlantic using published spreads on credit default swaps for our counterparties applied to our current exposure and potential loss exposure from the financial commitments in our risk management portfolio. Potential loss exposure is calculated as our current exposure plus a calculated VaR over the remaining life of the contracts. We applied a similar approach to calculate the fair value of our coal contracts included in derivative contract assets and liabilities in the unaudited condensed consolidated balance sheets and which also do not require either party to post cash collateral for initial margin or for securing exposure as a result of changes in coal prices. We do not, however, transact in credit default swaps or any other credit derivative. An increase of 10% in the spread of credit default swaps of our major trading partners for our non-collateralized power hedges entered into by Mirant Mid-Atlantic would result in an increase of $2 million in the credit reserve of Mirant Americas Generation, Mirant North America and Mirant Mid-Atlantic as of September 30, 2010. An increase of 10% in the spread of credit default swaps of our coal suppliers would result in an increase of less than $1 million in the credit reserve for Mirant Americas Generation, Mirant North America and Mirant Mid-Atlantic related to coal agreements included in derivative contract assets and liabilities in the unaudited condensed consolidated balance sheets as of September 30, 2010.
We have historically calculated the credit reserve for the remainder of our portfolio considering our current exposure, net of the effect of credit enhancements, and potential loss exposure from the financial commitments in our risk management portfolio, and applied historical default probabilities using current credit ratings of our counterparties. In the fourth quarter of 2009, we changed our methodology to calculate the credit reserve for the remainder of our portfolio to also use published spreads, where available, or proxies based upon published spreads, on credit default swaps for our counterparties applied to our current exposure and potential loss exposure from the financial commitments in our risk management portfolio. The change in credit reserve methodology did not have a material effect on the fair value of our derivative contract assets and liabilities for the remainder of the portfolio because the default risk is generally offset by cash collateral or other credit enhancements. An increase in counterparty credit risk could affect the ability of our counterparties to deliver on their obligations to us. As a result, we may require our counterparties to post additional collateral or provide other credit enhancements. An increase of 10% in the spread of credit default swaps of our trading partners for the remainder of our portfolio would result in an immaterial increase in our credit reserve as of September 30, 2010.
Once we have delivered a physical commodity or agreed to financial settlement terms, we are subject to collection risk. Collection risk is similar to credit risk and collection risk is accounted for when we establish our provision for uncollectible accounts. We manage this risk using the same techniques and processes used in credit risk discussed above.
We also monitor counterparty credit concentration risk on both an individual basis and a group counterparty basis. See Note B to our unaudited condensed consolidated financial statements contained elsewhere in this report for further discussion of our counterparty credit concentration risk.
Mirant Americas Generation, Mirant North America and Mirant Mid-Atlantic Credit Risk
In valuing our derivative contract liabilities, we apply a valuation adjustment for our non-performance, which is based on the probability of our default. Historically, we determined this non-performance adjustment value by multiplying our liability exposure, including outstanding balances for realized transactions, unrealized transactions and the effect of credit enhancements, by the one year probability of our default based on our current credit ratings. The one year probability of default rate considers the tenor of our portfolio and the correlation of default between counterparties within our industry. In the fourth quarter of 2009, we changed our methodology to incorporate published spreads on our credit default swaps, where available, or proxies based upon published spreads. An increase of 10% in the spread of our credit default swap rate would have an immaterial effect on our unaudited condensed consolidated statement of operations for the nine months ended September 30, 2010.
127
Table of Contents
Broker Quotes
In determining the fair value of our derivative contract assets and liabilities, we use third-party market pricing where available. We consider active markets to be those in which transactions for the asset or liability occur in sufficient frequency and volume to provide pricing information on an ongoing basis. Note B to our unaudited condensed consolidated financial statements contained elsewhere in this report explains the fair value hierarchy. Our transactions in Level 1 of the fair value hierarchy primarily consist of natural gas and crude oil futures traded on the NYMEX and swaps cleared against NYMEX prices. For these transactions, we use the unadjusted published settled prices on the valuation date. Our transactions in Level 2 of the fair value hierarchy primarily include non-exchange-traded derivatives such as OTC forwards, swaps and options. We value these transactions using quotes from independent brokers or other widely-accepted valuation methodologies. Transactions are classified in Level 2 if substantially all (greater than 90%) of the fair value can be corroborated using observable market inputs such as transactable broker quotes. In accordance with the exit price objective under the fair value measurements accounting guidance, the fair value of our derivative contract assets and liabilities is determined based on the net underlying position of the recorded derivative contract assets and liabilities using bid prices for our assets and ask prices for liabilities. The quotes that we obtain from brokers are non-binding in nature, but are from brokers that typically transact in the market being quoted and are based on their knowledge of market transactions on the valuation date. We typically obtain multiple broker quotes on the valuation date for each delivery location that extend for the tenor of our underlying contracts. The number of quotes that we can obtain depends on the relative liquidity of the delivery location on the valuation date. If multiple broker quotes are received for a contract, we use an average of the quoted bid or ask prices. If only one broker quote is received for a delivery location and it cannot be validated through other external sources, we will assign the quote to a lower level within the fair value hierarchy. In some instances, we may combine broker quotes for a liquid delivery hub with broker quotes for the price spread between the liquid delivery hub and the delivery location under the contract. We also may apply interpolation techniques to value monthly strips if broker quotes are only available on a seasonal or annual basis. We perform validation procedures on the broker quotes at least on a monthly basis. The validation procedures include reviewing the quotes for accuracy and comparing them to our internal price curves. In certain instances, we may discard a broker quote if it is a clear outlier and multiple other quotes are obtained. At September 30, 2010, we obtained broker quotes for 100% of our delivery locations classified in Level 2 of the fair value hierarchy.
Inactive markets are considered to be those markets with few transactions, noncurrent pricing or prices that vary over time or among market makers. Our transactions in Level 3 of the fair value hierarchy may involve transactions whereby observable market data, such as broker quotes, are not available for substantially all of the tenor of the contract or we are only able to obtain indicative broker quotes that cannot be corroborated by observable market data. In such cases, we may apply valuation techniques such as extrapolation to determine fair value. Proprietary models may also be used to determine the fair value of certain of our derivative contract assets and liabilities that may be structured or otherwise tailored. The degree of estimation increases for longer duration contracts, contracts with multiple pricing features, option contracts and off-hub delivery points. Our techniques for fair value estimation include assumptions for market prices, correlation and volatility. At September 30, 2010, Mirant Americas Generation’s and Mirant North America’s assets and liabilities classified as Level 3 in the fair value hierarchy represented approximately 2% of their total assets and 5% of their total liabilities measured at fair value. At September 30, 2010, Mirant Mid-Atlantic’s assets and liabilities classified as Level 3 in the fair value hierarchy represented approximately 2% of its total assets and 20% of its total liabilities measured at fair value. See Note B to our unaudited condensed consolidated financial statements contained elsewhere in this report for further explanation of the fair value hierarchy.
Interest Rate Risk
Fair Value Measurement
We are also subject to interest rate risk when determining the fair value of our derivative contract assets and liabilities. The nominal value of our derivative contract assets and liabilities is also discounted to account for time
128
Table of Contents
value using a LIBOR forward interest rate curve based on the tenor of our transactions. An increase of 100 basis points in the average LIBOR rate would result in a decrease of $27 million to Mirant Americas Generation’s and Mirant North America’s derivative contract assets and a decrease of $12 million to Mirant Americas Generation’s and Mirant North America’s derivative contract liabilities at September 30, 2010. An increase of 100 basis points in the average LIBOR rate would result in a decrease of $24 million to Mirant Mid-Atlantic’s derivative contract assets and a decrease of $9 million to Mirant Mid-Atlantic’s derivative contract liabilities at September 30, 2010.
Debt (Mirant Americas Generation and Mirant North America)
Our debt that is subject to variable interest rates consists of the Mirant North America senior secured term loan and senior secured revolving credit facility. If both were fully drawn, the amount subject to variable interest rates would be approximately $1.1 billion and a 1% per annum increase in the average market rate would result in an increase in our annual interest expense of approximately $11 million.
Coal Agreement Risk
Our coal supply comes primarily from the Central Appalachian and Northern Appalachian coal regions. Mirant Americas Generation and Mirant North America enter into contracts of varying tenors on behalf of Mirant Mid-Atlantic to secure appropriate quantities of fuel that meet the varying specifications of Mirant Mid-Atlantic’s generating facilities. For our coal-fired generating facilities, we purchase most of our coal from a small number of strategic suppliers under contracts with terms of varying lengths, some of which extend to 2013. We had exposure to three counterparties at September 30, 2010, and exposure to five counterparties at December 31, 2009, that each represented an exposure of more than 10% of our total coal commitments, by volume, and in aggregate represented approximately 76% and 85% of our total coal commitments at September 30, 2010 and December 31, 2009, respectively.
In addition, we have non-performance risk associated with our coal agreements. There is risk that our coal suppliers may not provide the contractual quantities on the dates specified within the agreements or the deliveries may be carried over to future periods. If our coal suppliers do not perform in accordance with the agreements, we may have to procure coal in the market to meet our needs, or power in the market to meet our obligations. In addition, a number of the coal suppliers do not currently have an investment grade credit rating and, accordingly, we may have limited recourse to collect damages in the event of default by a supplier. We seek to mitigate this risk through diversification of coal suppliers, to the extent possible, and through guarantees. Despite this, there can be no assurance that these efforts will be successful in mitigating credit risk from coal suppliers. Non-performance or default risk by our coal suppliers could have a material adverse effect on our future results of operations, financial condition and cash flows. See Note B to our unaudited condensed consolidated financial statements contained elsewhere in this report for further explanation of these agreements and our credit concentration tables.
Certain of our coal contracts are not required to be recorded at fair value under the accounting guidance for derivative financial instruments. As such, these contracts are not included in derivative contract assets and liabilities in the accompanying unaudited condensed consolidated balance sheets. These contracts contain pricing terms that are favorable compared to forward market prices at September 30, 2010, and are projected to provide a $46 million benefit to our realized value of hedges through 2013 as the coal is utilized in the production of electricity.
For a further discussion of market risks, our risk management policy and our use of VaR to measure some of these risks, see Item 7A, Quantitative and Qualitative Disclosures About Market Risk in our 2009 Annual Report on Form 10-K.
129
Table of Contents
| Item 4. | Controls and Procedures (Mirant Americas Generation, Mirant North America and Mirant Mid-Atlantic) |
Effectiveness of Disclosure Controls and Procedures
As required by Exchange Act Rule 13a-15(b), our management, including our Principal Executive Officer and our Principal Financial Officer, conducted an assessment of the effectiveness of the design and operation of our disclosure controls and procedures (as defined by Rules 13a-15(e) and 15d-15(e) under the Exchange Act), as of September 30, 2010. Based upon this assessment, our management concluded that, as of September 30, 2010, the design and operation of these disclosure controls and procedures were effective.
Changes in Internal Control over Financial Reporting
There have been no changes in the Companies’ internal control over financial reporting that have occurred during the quarter ended September 30, 2010, that have materially affected, or are reasonably likely to materially affect, the Companies’ internal control over financial reporting.
130
Table of Contents
PART II
| Item 1. | Legal Proceedings (Mirant Americas Generation, Mirant North America and Mirant Mid-Atlantic) |
See Note I to our unaudited condensed consolidated financial statements contained elsewhere in this report for discussion of the material legal proceedings to which we are a party.
| Item 1A. | Risk Factors (Mirant Americas Generation, Mirant North America and Mirant Mid-Atlantic) |
Part II, Item 1A. Risk Factors of our Quarterly Report on Form 10-Q for the period ended June 30, 2010, includes a discussion of our risk factors. There have been no material changes in our risk factors since those reported in our Form 10-Q for the period ended June 30, 2010. Further information concerning the proposed merger with RRI Energy was included in a joint proxy statement/prospectus contained in the registration statement on Form S-4 filed by RRI Energy with the SEC on May 28, 2010, and amended on July 6, 2010, August 12, 2010, September 8, 2010 and September 13, 2010.
131
Table of Contents
| Item 6. | Exhibits (Mirant Americas Generation, Mirant North America and Mirant Mid-Atlantic) |
| (a) | Exhibits. |
Mirant Americas Generation
| Exhibit No. |
Exhibit Name | |
| 3.1 |
Certificate of Formation for Mirant Americas Generation, LLC, filed with the Delaware Secretary of State on November 1, 2001 (Incorporated herein by reference to Exhibit 3.1 to Registrant’s Form 10-Q filed November 9, 2001) | |
| 3.2 |
Amended and Restated Limited Liability Company Agreement for Mirant Americas Generation, LLC dated January 3, 2006 (Incorporated herein by reference to Exhibit 3.2 Registrant’s Form 10-Q filed November 13, 2006) | |
| 4.1 |
Mirant Americas Generation agrees to furnish to the Securities and Exchange Commission, upon request, a copy of any instrument defining the rights of holders of long-term debt of Mirant Americas Generation and all of its consolidated subsidiaries for which financial statements are required to be filed with the Securities and Exchange Commission. | |
| 31.1A1* |
Certification of the Chief Executive Officer Pursuant to 15 U.S.C. Section 7241, as adopted pursuant to Section 302 of the Sarbanes-Oxley Act of 2002 (Rule 13a-14(a)) | |
| 31.2A4* |
Certification of the Chief Financial Officer Pursuant to 15 U.S.C. Section 7241, as adopted pursuant to Section 302 of the Sarbanes-Oxley Act of 2002 (Rule 13a-14(a)) | |
| 32.1A1* |
Certification of the Chief Executive Officer Pursuant to 18 U.S.C. Section 1350, as adopted pursuant to Section 906 of the Sarbanes-Oxley Act of 2002 (Rule 13a-14(b)) | |
| 32.2A4* |
Certification of the Chief Financial Officer Pursuant to 18 U.S.C. Section 1350, as adopted pursuant to Section 906 of the Sarbanes-Oxley Act of 2002 (Rule 13a-14(b)) | |
| * | Asterisk indicates exhibits filed herewith. |
132
Table of Contents
| Exhibit No. |
Exhibit Name | |
| 3.1 |
Certificate of Formation of Mirant North America, LLC (Incorporated herein by reference to Exhibit 3.1 to Registrant’s Form S-4 filed June 5, 2006) | |
| 3.2 |
Limited Liability Company Agreement of Mirant North America, LLC (Incorporated herein by reference to Exhibit 3.2 to Registrant’s Form S-4 filed June 5, 2006) | |
| 3.3 |
Certificate of Incorporation of MNA Finance Corp. (Incorporated herein by reference to Exhibit 3.3 to Registrant’s Form S-4 filed June 5, 2006) | |
| 3.4 |
Bylaws of MNA Finance Corp. (Incorporated herein by reference to Exhibit 3.4 to Registrant’s Form S-4 filed June 5, 2006) | |
| 4.1 |
Mirant North America agrees to furnish to the Securities and Exchange Commission, upon request, a copy of any instrument defining the rights of holders of long-term debt of Mirant North America and all of its consolidated subsidiaries for which financial statements are required to be filed with the Securities and Exchange Commission. | |
| 31.1A2* |
Certification of the Chief Executive Officer Pursuant to 15 U.S.C. Section 7241, as adopted pursuant to Section 302 of the Sarbanes-Oxley Act of 2002 (Rule 13a-14(a)) | |
| 31.2A5* |
Certification of the Chief Financial Officer Pursuant to 15 U.S.C. Section 7241, as adopted pursuant to Section 302 of the Sarbanes-Oxley Act of 2002 (Rule 13a-14(a)) | |
| 32.1A2* |
Certification of the Chief Executive Officer Pursuant to 18 U.S.C. Section 1350, as adopted pursuant to Section 906 of the Sarbanes-Oxley Act of 2002 (Rule 13a-14(b)) | |
| 32.2A5* |
Certification of the Chief Financial Officer Pursuant to 18 U.S.C. Section 1350, as adopted pursuant to Section 906 of the Sarbanes-Oxley Act of 2002 (Rule 13a-14(b)) | |
| * | Asterisk indicates exhibits filed herewith. |
133
Table of Contents
| Exhibit No. |
Exhibit Name | |
| 3.1 |
Certificate of Formation of Southern Energy Mid-Atlantic, LLC (Incorporated herein by reference to Exhibit 3.1 to Registrant’s Form S-4 in Registration No. 333-61668) | |
| 3.2 |
Amended and Restated Limited Liability Company Agreement of Mirant Mid-Atlantic, LLC, dated as of January 3, 2006 (Incorporated herein by reference to Exhibit 3.2 to Registrant’s Form 10-Q filed November 13, 2006) | |
| 4.1 |
Mirant Mid-Atlantic agrees to furnish to the Securities and Exchange Commission, upon request, a copy of any instrument defining the rights of holders of long-term debt of Mirant Mid-Atlantic. | |
| 31.1A3* |
Certification of the Chief Executive Officer Pursuant to 15 U.S.C. Section 7241, as adopted pursuant to Section 302 of the Sarbanes-Oxley Act of 2002 (Rule 13a-14(a)) | |
| 31.2A6* |
Certification of the Chief Financial Officer Pursuant to 15 U.S.C. Section 7241, as adopted pursuant to Section 302 of the Sarbanes-Oxley Act of 2002 (Rule 13a-14(a)) | |
| 32.1A3* |
Certification of the Chief Executive Officer Pursuant to 18 U.S.C. Section 1350, as adopted pursuant to Section 906 of the Sarbanes-Oxley Act of 2002 (Rule 13a-14(b)) | |
| 32.2A6* |
Certification of the Chief Financial Officer Pursuant to 18 U.S.C. Section 1350, as adopted pursuant to Section 906 of the Sarbanes-Oxley Act of 2002 (Rule 13a-14(b)) | |
| * | Asterisk indicates exhibits filed herewith. |
134
Table of Contents
SIGNATURES
Pursuant to the requirements of the Securities Exchange Act of 1934, the registrant has duly caused this report to be signed on its behalf by the undersigned thereunto duly authorized.
| MIRANT AMERICAS GENERATION, LLC | ||||||
| Date: November 5, 2010 | By: | /S/ ANGELA M. NAGY | ||||
| Angela M. Nagy | ||||||
| Vice President and Controller (Duly Authorized Officer and Principal Accounting Officer) | ||||||
135
Table of Contents
SIGNATURES
Pursuant to the requirements of the Securities Exchange Act of 1934, the registrant has duly caused this report to be signed on its behalf by the undersigned thereunto duly authorized.
| MIRANT NORTH AMERICA, LLC | ||||||
| Date: November 5, 2010 | By: | /S/ ANGELA M. NAGY | ||||
| Angela M. Nagy | ||||||
| Vice President and Controller (Duly Authorized Officer and Principal Accounting Officer) | ||||||
136
Table of Contents
SIGNATURES
Pursuant to the requirements of the Securities Exchange Act of 1934, the registrant has duly caused this report to be signed on its behalf by the undersigned thereunto duly authorized.
| MIRANT MID-ATLANTIC, LLC | ||||||
| Date: November 5, 2010 | By: | /S/ ANGELA M. NAGY | ||||
| Angela M. Nagy | ||||||
| Vice President and Controller (Duly Authorized Officer and Principal Accounting Officer) | ||||||
137