Attached files
| file | filename |
|---|---|
| 8-K - FORM 8-K - M&T BANK CORP | l41053e8vk.htm |
Exhibit 99
| M&TBank O Wilmington Creating the Leading Mid-Atlantic Relationship Bank BancAnalysts Association of Boston 2010 Annual Bank Conference November 4, 2010 |
| Disclaimer This presentation contains forward looking statements within the meaning of the Private Securities Litigation Reform Act giving the Company’s expectations or predictions of future financial or business performance or conditions. Forward-looking statements are typically identified by words such as “believe,” “expect,” “anticipate,” “intend,” “target,” “estimate,” “continue,” “positions,” “prospects” or “potential,” by future conditional verbs such as “will,” “would,” “should,” “could” or “may”, or by variations of such words or by similar expressions. These forward-looking statements are subject to numerous assumptions, risks and uncertainties which change over time. Forward-looking statements speak only as of the date they are made and we assume no duty to update forward-looking statements. In addition to factors previously disclosed in our SEC reports and those identified elsewhere in this presentation, the following factors among others, could cause actual results to differ materially from forward-looking statements or historical performance: ability to obtain regulatory approvals and meet other closing conditions to the merger, including approval by Wilmington Trust shareholders, on the expected terms and schedule; delay in closing the merger; difficulties and delays in integrating the M&T and Wilmington Trust businesses or fully realizing cost savings and other benefits; business disruption following the merger; changes in asset quality and credit risk; the inability to sustain revenue and earnings growth; changes in interest rates and capital markets; inflation; customer acceptance of M&T products and services; customer borrowing, repayment, investment and deposit practices; customer disintermediation; the introduction, withdrawal, success and timing of business initiatives; competitive conditions; the inability to realize cost savings or revenues or to implement integration plans and other consequences associated with mergers, acquisitions and divestitures; economic conditions; and the impact, extent and timing of technological changes, capital management activities, and other actions of the Federal Reserve Board and legislative and regulatory actions and reforms, including those associated with the Dodd-Frank Wall Street Reform and Consumer Protection Act. Annualized, pro forma, projected and estimated numbers are used for illustrative purpose only, are not forecasts and may not reflect actual results. M&T Bank * O Wilmington |
| Transaction Highlights Strategic Rationale The M&T Bank Story Wilmington Trust M M&T Bank * O Wilmington |
| Creating the Leading Relationship Bank in the Mid-Atlantic S M&T Bank O Wilmington Compelling Strategic Fit Premier banking franchise in high-growth Mid- Complementary community banking models with Atlantic region focus on relationships Combines #1 market share in Delaware with the Leverage top-tier scale in targeted markets to leading commercial bank in Mid-Atlantic generate superior profitability Preserves value of Wilmington Trust’s established Common Values brand and recognized capabilities in trust, wealth Q Experienced, long-tenured employees key to management and corporate services success Led by M&T’s experienced management team, with Q Best ate citizen in our communities proven credit expertise Diversified revenue with greater fee income Enhanced capital generation and earnings r“ates significant value for shareholders, customers, employees and communities 4 |
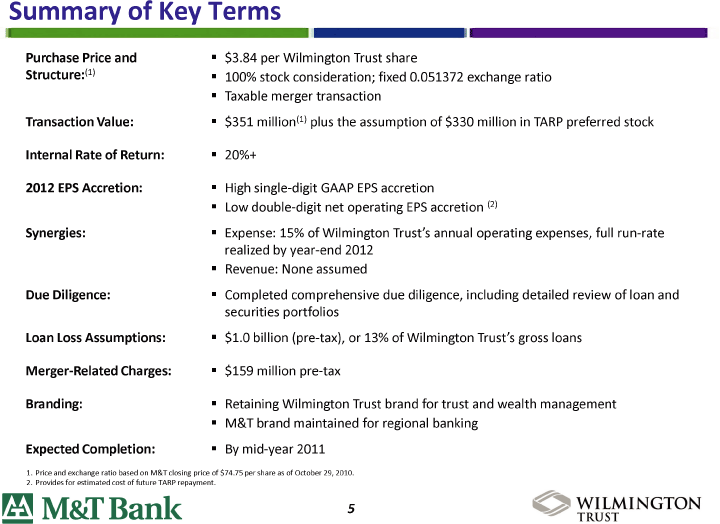
| Summary of Key Terms Purchase Price and $3.84 per Wilmington Trust share Structure:( 1 ) - 100% stock consideration; fixed 0.051372 exchange ratio Taxable merger transaction Transaction Value: $351 million( 1 ) plus the assumption of $330 million in TARP preferred stock Internal Rate of Return: 20%+ 2012 EPS Accretion: High single-digit GAAP EPS accretion Low double-digit net operating EPS accretion ( 2 ) Synergies: Expense: 15% of Wilmington Trust’s annual operating expenses, full run-rate realized by year-end 2012 Revenue: None assumed Due Diligence: Completed comprehensive due diligence, including detailed review of loan and securities portfolios Loan Loss Assumptions: $1.0 billion (pre-tax), or 13% of Wilmington Trust’s gross loans Merger-Related Charges: $159 million pre-tax Branding: Retaining Wilmington Trust brand for trust and wealth management M&T brand maintained for regional banking Expected Completion: By mid-year 2011 Price and exchange ratio based on M&T closing price of $74.75 per share as of October 29, 2010. Provides for estimated cost of future TARP repayment. M&T Bank s O Wilmington |
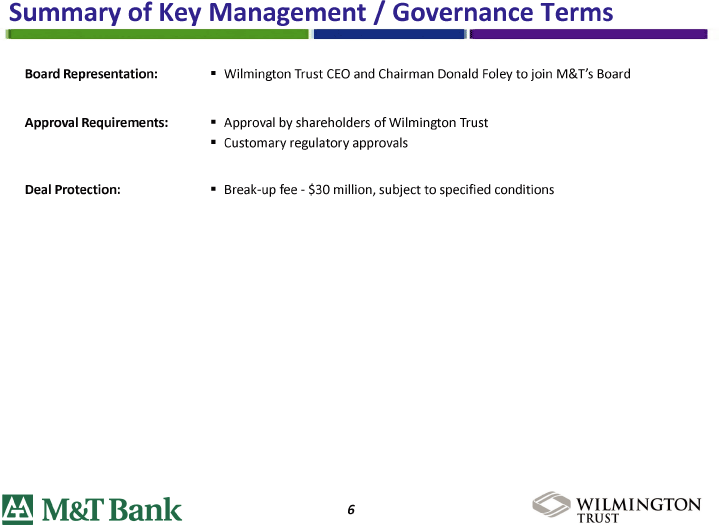
| Summary of Key Management Governance Terms Board Representation: Wilmington Trust CEO and Chairman Donald Foley to join M&T’s Board Approval Requirements: Approval by shareholders of Wilmington Trust Customary regulatory approvals Deal Protection: Break-up fee — $30 million, subject to specified conditions M&TBank « O Wilmington |
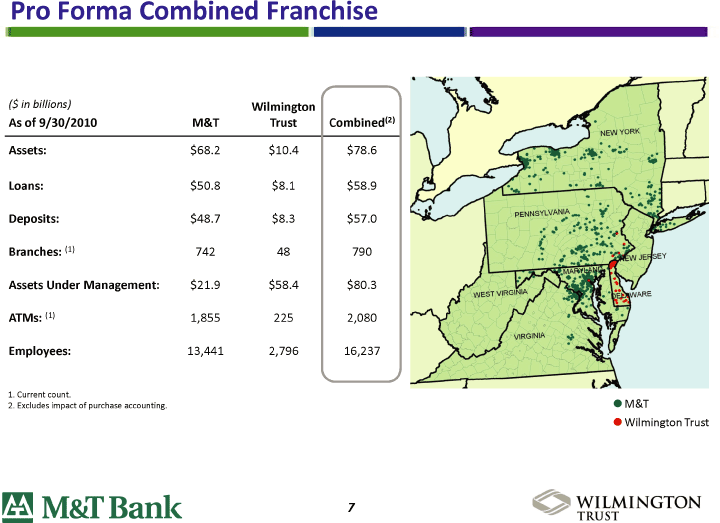
| Pro Forma Combined Franchise ( ~~ 3 (Sin billions) Wilmington YVvT S ) f As of 9 30 2010 M&T Trust Combined f%- .x-x j"-*"* J NEW YORK “ Assets: $68.2 $10.4 $78.6 J OtrTF Jfc*. *•:•• . [ Loans: $50.8 $8.1 $58.9 } S A ‘ ‘ JVT.1 i t— T h~< -r -t v*” *“1 J. Deposits: $48.7 $8.3 $57.0 SlL’-’ Pennsylvania y T < * t $&P’ Branches:(1) 742 48 790 : . k. Lg> J Assets Under Management: $21.9 $58.4 $80.3 « V JihiS rvV r WEST VIRGINIA 1W W.-i)e> VVARE ATMs: (1) 1,855 225 2,080 * t y *N>ILV VVxCT- VIRGINIA , $1 77 Employees: 13,441 2,796 16,237 X >s S5V V _£ T — ( Current count. Excludes impact of purchase accounting. • M &T • Wilmington Trust ra M&T Bank ‘ O Wilmington |
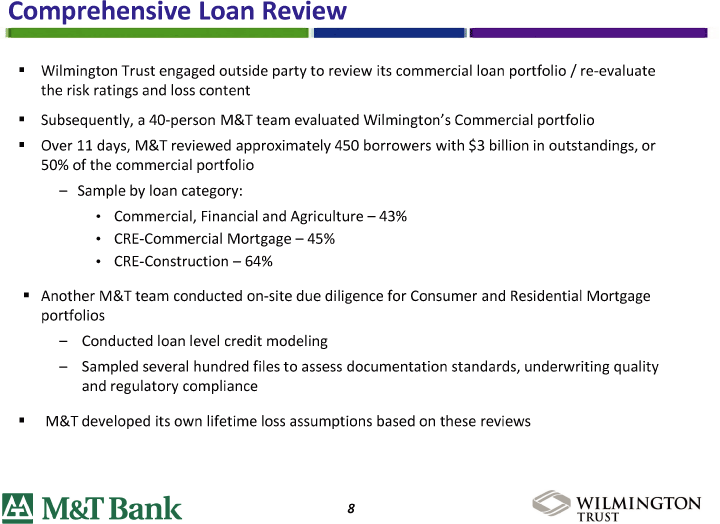
| Comprehensive Loan Review Wilmington Trust engaged outside party to review its commercial loan portfolio re-evaluate the risk ratings and loss content Subsequently, a 40-person M&T team evaluated Wilmington’s Commercial portfolio Over 11 days, M&T reviewed approximately 450 borrowers with $3 billion in outstandings, or 50% of the commercial portfolio — Sample by loan category: Commercial, Financial and Agriculture — 43% CRE-Commercial Mortgage-45% CRE-Construction — 64% Another M&T team conducted on-site due diligence for Consumer and Residential Mortgage portfolios Conducted loan level credit modeling Sampled several hundred files to assess documentation standards, underwriting quality and regulatory compliance M&T developed its own lifetime loss assumptions based on these reviews S M&T Bank * O ™J,lmington |
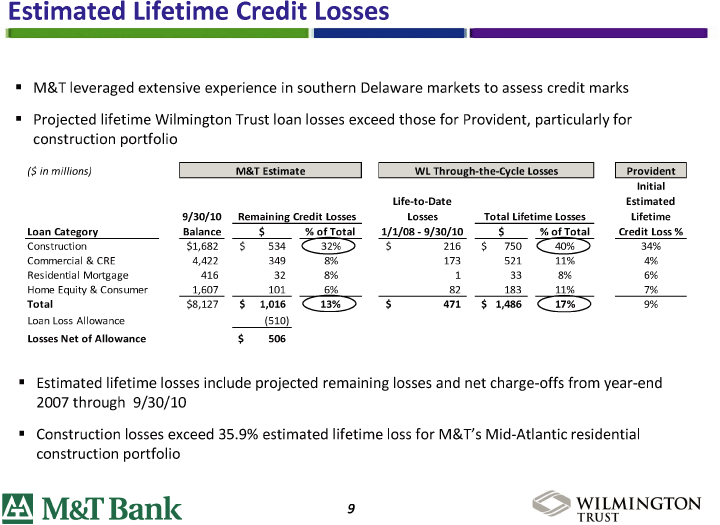
| Estimated Lifetime Credit Losses M&T leveraged extensive experience in southern Delaware markets to assess credit marks Projected lifetime Wilmington Trust loan losses exceed those for Provident, particularly for construction portfolio ($ in millions) M&T Estimate WLThrough-the-Cycle Losses Provident Initial Life-to-Date Estimated 9 30 10 Remaining Credit Losses Losses Total Lifetime Losses Lifetime Loan Category Balance $ % of Total 1 1 08 — 9 30 10 $ % of Total Credit Loss % Construction $1,682 $534 d32 ° Q $216 $750 C L40% J> 34% Commercial & CRE 4,422 349 8% 173 5 21 11% 4% Residential Mortgage 416 32 8% 1 33 8% 6% Home Equity & Consumer 1,607 101 6% 82 1 83 11% 7% Total $8 ,127 $1 ,016 < L13% > $4 71 $1 ,486 C_17%> 9% Loan Loss Allowance (510) Losses Net of Allowance $506 Estimated lifetime losses include projected remaining losses and net charge-offs from year-end 2007 through 9 30 10 Construction losses exceed 35.9% estimated lifetime loss for M&Ts Mid-Atlantic residential construction portfolio M&T Bank * O wilmington |
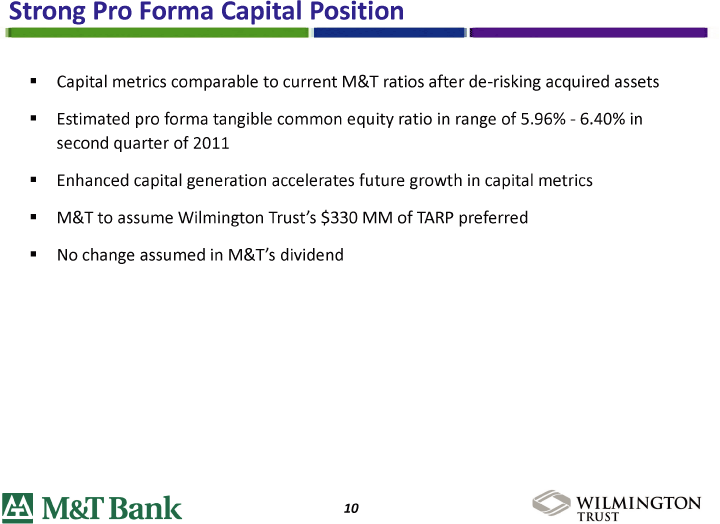
| Strong Pro Forma Capital Position Capital metrics comparable to current M&T ratios after de-risking acquired assets Estimated pro forma tangible common equity ratio in range of 5.96% — 6.40% in second quarter of 2011 Enhanced capital generation accelerates future growth in capital metrics M&T to assume Wilmington Trust’s $330 MM of TARP preferred No change assumed in M&T’s dividend M&T Bank io ™ INGTON |
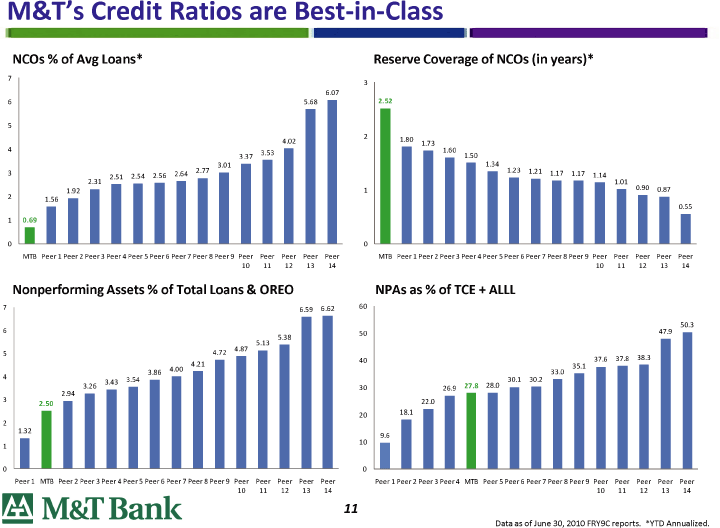
| M&T’s Credit Ratios are Best-in-Class NCOs % of Avg Loans* Reserve Coverage of NCOs (in years)* 7 3 6.07 6 5.68 2.52 5 3.37 353 _ 1.50 2 1.56 0.55 1 0.69 0 0———————————— MTB Peer 1 Peer 2 Peer 3 Peer 4Peer 5 Peer 6 Peer 7 Peer 8 Peer 9 Peer Peer Peer Peer Peer MTB Peer 1 Peer 2 Peer 3 Peer 4 Peer 5 Peer 6 Peer 7 Peer 8 Peer 9 Peer Peer Peer Peer Peer 10 11 12 13 14 10 11 12 13 14 Nonperforming Assets % of Total Loans & OREO NPAs as % of TCE + ALLL 7 6.59 6.62 60 50.3 6 47.9 5.38 50 5.13 4 3.43 3.54 . 30.1 30.2 _ 2.94 _ 20 181 2 10 0 0 Peer 1 MTB Peer 2 Peer 3 Peer 4 Peer 5 Peer 6 Peer 7 Peer 8 Peer 9 Peer Peer Peer Peer Peer Peer 1 Peer 2 Peer 3 Peer 4 MTB Peer 5 Peer 6 Peer 7 Peer 8 Peer 9 Peer Peer Peer Peer Peer ___ 10 11 12 13 14 10 11 12 13 14 f ]VISi] Bunk n Data as of June 30, 2010 FRY9C reports. *YTD Annualized. |
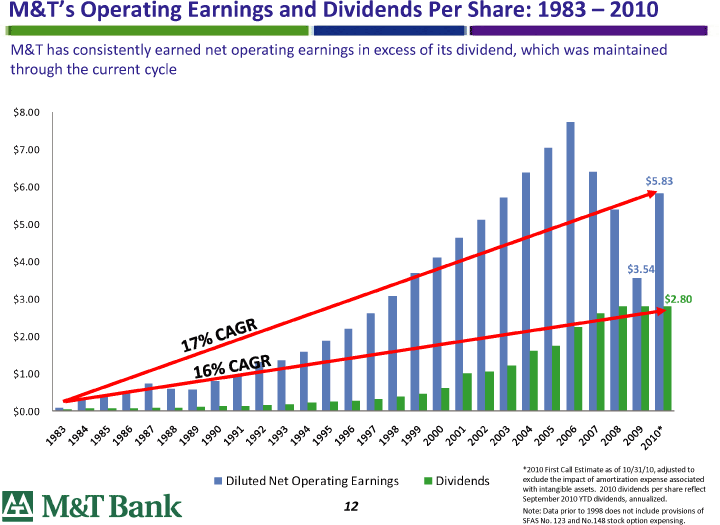
| M&T’s Operating Earnings and Dividends Per Share: 1983 — 2010 M&T has consistently earned net operating earnings in excess of its dividend, which was maintained through the current cycle $8.00 V *2010 First Call Estimate as of 10 31 10, adjusted to Diluted Net Operating Earnings Dividends exclude the impact of amortization expense associated ___ with intangible assets. 2010 dividends per share reflect y, “IV “ O T 1 “ID *- -% II — September 2010 YTD dividends, annualized. rMl IVlOiJ 33.J 1.X Note: Data prior to 1998 does not include provisions of “ SFAS No. 123 and No.148 stock option expensing. |
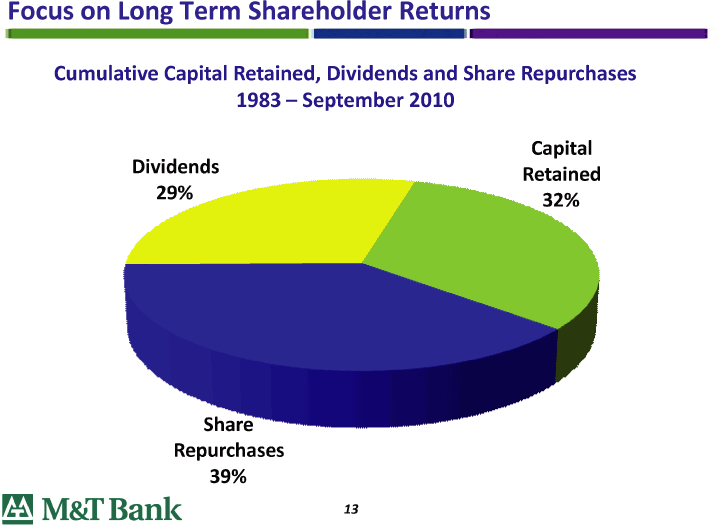
| Focus on Long Term Shareholder Returns Cumulative Capital Retained, Dividends and Share Repurchases 1983 — September 2010 Capital Dividends __ mm Retained 29%H J32% ShareHHIi Repurchases 39% |
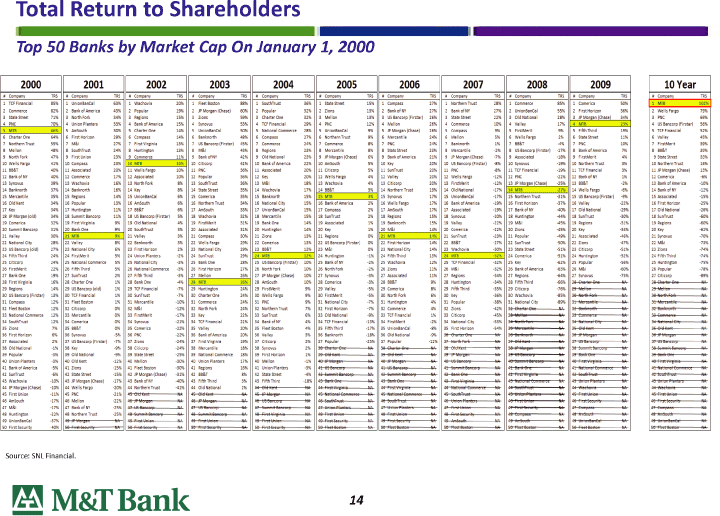
| Total Return to Shareholders Top 50 Banks by Market Cap On January 1, 2000 20002001 2002 2003 2004 2005 2006 2007 2008 2009 10 YearA Company TRS # Company TR5 A Company ~K £ Company TRS tf Company TRS # Company ~R5 it Company ~R5 £ Company TRS tf Company TR5 £ Company TRS ti Company TRSTCF Financial 35% 1 UnionBanCal 53K 1 Wachovia 20% 1 FleetBoston B8% 1 SouthTrust 35% 1 StateStreet 15% 1 Compass 27% 1 Northern Trust 23% 1 Commerce 35% 1 Comerica 50% 1 MTB IOMCommerce 32% 2 Bankof America 43% 2 Popular 19% 2 JP Morgan (Chase) 60% 2 Popular 32% 2 Zions 13% 2 BankofNY 27% 2 BankofNY 27% 2 UnionBanCal 55% 2 FirstHoriion 36% 2 WellsFargo 79% StateStreet 71% 3 North Fork 34% 3 Regions 15% 3 Zions 59% 3 CharterOne 32% 3 Mellon 13% 3 USBancorp [Firstar) 25% 3 StateStreet 22% 3 Old National 23% 3 JP Morgan (Chase] 34%3 PNC 69% PNC 70%4 UnionPlanters 33% 4 Bankof America 15% 4 Synovus 53% 4 TCFFinancial 29% 4 PNC 12% 4 Mellon 26% 4 Commerce 10% 4 Valley 17% 4 MTB 23%4 US Bancorp (Firstar) 56% MTB 65%5 AmSouth 30K 5 CharterOne 14% 5 UnionBanCal 50% 5 National Commerce 23% 5 UnionBanCal 9% 5 JP Morgan [Chase] 25% 5 Compass 9K 5 FlrstMerit 9% 5 Fifth Third 19% 5 TCFFinancial 52% CharterOne 64% 6 FirstHoriion 29% 6 Compass 14% 6 Banknorth 4&% & Compass 27% 5 Northern Trust 9% 6 Mercantile 24% 5 Mellon 5% 6 WellsFargo 2% 6 StateStreet LM 6 Valley 45% Northern Trust 55% 7 Mil 27% 7 First Virginia 13% 7 US Bancorp (Firstar] 45% 7 Commerce 24% 7 Commerce 3% 7 PNC 24% 7 Banknorth 1% 7 BB&T -4% 7 PNC 10% 7 FirstMerit 39% Vie on 43% S SouthTrust 24% S Huntington 13% S MSI 45% S Regions 23% 3 Mercantile 3% 3 StateStreet 23% 3 Mercantile -2% S US Bancorp (Firstar) -17% S Bankof America 7% S BB&T 39% NorthFork 47% 9 First Union 23% 9 Commerce11%_ 9 BankofNY 42% 9- Old National 23% 9 JP Morgan (Chase) 5% 9 Bankof America 21% 9 JP Morgan [Chase] -7% 9 Associated -18% 9 FirstMerit 4% 9StateStreet 33% WellsFargo 41% 10 Compass 23% 10 MTB10%_ 10 Citicorp 42% 10 Bankof America 22% 10 Am5outh 5% 10 Key 20% 10 US Bancorp [Firstar] -3% 10 Synovus -19% 10 Northern Trust 3% 10 Northern Trust 15% B&SlT 40% 11 Associated 20% 11 WellsFargo 10% 11 PNC 36% 11 Associated 20% 11 Citicorp 5% 11 SunTrust 20% 11 PNC -3% 11 TCFFinancial -19% 11 TCFFinancial 3% 11 JP Morgan (Chase) 13% BankofNY 40% 12 Commerce 17% 12 Associated 10% 12 Popular 36% 12 Key 20% 12 WellsFargo 4% 12 Valley 20% 12 WellsFargo -12% 12 PNC -22% 12 BankofNY 1% 12 Comerica -6% Synovus 39% 13 Wachovia 16% 13 North Fork 3% 13 SouthTrust 36% 13 M&l 13% 13 Wachovia 4% 13 Citicorp 20% 13 FirstMerit -12% 13 JP Morgan (Chase] -25%13 B&&T -2% 13 Bankof America -10% Banknorth 37% 14 Banknorth 16% 14 key B% 14 StateStreet 35% 14 Wachovia 17% 14 BB&T3_%_ 14 Northern Trust 19% 14 Old National -17% 14 MTB -27% 14 WellsFargo -5% 14 BankofNY -12% Mercantile 35% 15 Regions 14% 15 UnionBanCal 6% 15 Comerica 35% 15 Banknorth 15% 15 MTB3%_ 15 Synovus 17% 15 UnionBanCal -17% 15 Northern Trust -31% 15 US Bancorp (Firstar) -9% 15 Associated -15% 15 Old Kent 34% 15 Popular 13% 15 AmSouth <5% 15 Northern Trust 34% 16 National City 15% 16 Bankof America 2% 16 WellsFargo 17% 15 Bankof America -19% 15 FirstHoriion -37% 15 Valley -22% 16 First Horizon -25% 17 key 34% 17 Huntington 11% 17 BB&T 6% 17 AmSouth 33% 17 UnionBanCal 15% 17 Compass 2% 17 AmSouth 17% 17 Associated -19% 17 BankofNY -40% 17 Old National -29% 17 Old National -26% 13 JP Morgan (old) 34% 13 Summit Bancorp 11% 13 US Bancorp (Firstar) 5% 13 Wachovia 32% 13 Mercantile 15% IB SunTrust 2% IS Regions 15% IS Synovus -20% 13 Huntington -44% IS SunTrust -30% 13 SunTrust -60% Comerica 32% 19 First Virginia 9% 19 Old National 4% 19 FirstMerit 31% 19 BankOne 14% 19 Associated 1% 19 Banknorth 15% 19 Valley -22% 19 MSI -45% 19 Regions -31% 19 Regions -60% Summit Bancorp 31% 20 BankOne9%_ 20 SouthTrust 3% 20 Associated 31% 20 Huntington 14% 20 Key 1% 20 M&l 14%20 Com erica -22% 20 Zions -45% 20 Key -34% 20 Key -62% Valley 30% 21 MTB9K_ 21 Valley 3% 21 Compass 30% 21 Zions 13% 21 Regions 0% 21 MTB 14%21 5unTrust -23% 21 Popular -49% 21 Associated -45% 21 5ynovus -70% Nationality 23% 22 Valley B% 22 Banknorth 3% 22 WellsFargo 29% 22 Comerica 13% 22 US Bancorp [Firstar) 0% 22 FirstHoriion 14% 22 B&SlT -27% 22 SunTrust -50% 22 Zions -47% 22 M&l -73% US Bancorp (old) 27% 23 Nationality 6% 23 FirstHoriion 2% 23 National City 29% 23 BB&T 13%23 M&l 0% 23 National City 14% 23 Wachovia -30% 23 StateStreet -51% 23 Citicorp -51% 23 Zions -74% Fifth Third 24% 24 FirstMerit 5% 24 Union Planters -2% 24 SunTrust 29% 24 MTB 12%24 Huntington -1% 24 Fifth Third 13% 24 MTB -32%24 Comerica -51% 24 Huntington -52% 24 Fifth Third -74% Citicorp 24% 25 National Commerce 5% 25 National City -3% 25 BankOne 2B% 25 US Bancorp [Firstar] 10% 25 BankofNY -2% 25 Wachovia 12% 25 TCFFinancial -32% 25 Key -52% 25 Popular -55% 25 Huntington -75% 16 : -stMer t 22% 26 Fifth Third 5% 26 National Commerce -3% 26 FirstHoriion 27% 26 NorthFork 10% 26 NorthFork -2% 26 Zions 11% 25 M&l -32% 26 Bankof America -53% 26 M&l -60% 26 Popular -73% 27 BankOne 19% 27 SunTrust 2% 27 Fifth Third -3% 27 Mellon 26%27 JP Morgan [Chase) 10% 27 Synovus -3% 27 Associated 11% 27 Regions -34% 27 Regions -54% 27 Synovus -75% 27 Citicorp -39% 23 FirstVirginia 15% 23 CharterOne 1% 23 BankOne -= : 16%23 AmSouth C?i IS Ccmer’ca -3% 2S BB&T 9% 23 Huntington -34% 23 Fifth Third -56% 26 Charter Ofib NA- 23 CharterOne NA- Regions 14% 29 US Bancorp (old) 1% 29 TCFFinancial -7% 29 Huntington 24% 29 FirstMerit 9% 29 Valley -5% 29 Comerica 8% 29 Fifth Third -35% 29 Citicorp -76% 29 MHtew NA 29-M*Wwi NA- US Bancorp (Firstar) 13% 30 TCFFinancial 1% 30 SunTrust -7% 30 CharterOne 24% 30 WellsFargo 9% 30 FirstMerit -5% 30 NorthFork 5% 30 Key -36K 30 Wachovia -35% 30 North Fork NA- 30 North Fork NA- Compass 12% 31 FleetBoston 1% 31 Mercantile -10% 31 Commerce 24% 31 PNC 9% 31 National City -7% 31 Huntington 4% 31 Popular -33% 31 National City -39% 31 Mcrrantile NA- 31 Mercantile NA- FleetBoston 12% 32 Citicorp 0% 32 M&l -12% 32 NorthFork 24% 32 Northern Trust 7% 32 FirstHoriion -7% 32 Commerce 4% 32 Zions -42% 32 CharterOne NA- 32 Danknerth NA- 32 DdiiknmUi Nft- National Commerce 12% 33 Mercantile 0% 33 FirstMerit -17% 33 Key 22% 33 SunTrust 6% 33 Old National -9% 33 TCFFinancial 1% 33 Citicorp -45% 39 Milluu II, 1 , 25 Cu- ci lp NA- 33 Commerce NA- SouthTrust 12% 34 Comerica 0% 34 Synovus -21% 34 TCFFinancial 21% 34 BankofNY 4% 34 TCFFinancial -13% 34 FirstMerit -2% 34 National City -53% 34 NuilliTuik NA 34 Hdllunal ClLy NAr- 34 National City NAr Zions 7% 35 BB&T 0% 35 Comerica -22% 35 Valley 20% 35 FleetBoston 4% 35 Fifth Third -17% 35 UnionBanCal -3% 35 FirstHoriion -54K 35 Mli luiiLIIl NA- 35 0 i Kerrt NA- 35 Old Kant NA- 35 FirstHoriion 5% 35 Synovus -5% 36 PNC -22% 35 Bankof America 20% 35 Valley 3% 36 Banknorth -13% 36 Old National -9% 3G CliaiLw One NA- 36 Duiil’.nui III HA 3C JPMmgan NA- 3C JPMmgan NAr 37 Associated 2% 37 US Bancorp (Firstar) -7% 37 Zions -24% 37 FirstVirginia 19% 37 Citicorp 3% 37 Popular -25% 37 Popular -12% 37 North Terk NA- 37 OldHtrt NA 37 USBdiiLUip NA- 37 USOdiinjiu NAr 33 Old National -1% 33 Key -9% 3S Citicorp -24% 33 Mercantile 13% 33 Synovus 2% 3D Charter One NA- 33 Charter Ono NA- 33 Old Knit NA- 3C JP Muijuii II, 1 , 33 Su ilUfliiLuiu NA- 33 Summit Bancorp NA- Popular -3% 39 Old National -9% 39 StateStreet -25% 39 National Commerce 13% 39 FirstHoriion 1% 39 Old Kent NA- 39 Old Hint NA- 39 JPMmgan NA- 39 UlQuinuiu NA- 39 BankOne NA- 39 Dank On; NA- Union Planters -3% 40 Old Kent -12% 40 Mellon -30% 40 Union Planters 17% 40 Mellon -1% 40 JP Mergan NA- 40 JP Mergan NA- 40 USQaneerp NA- 40 3u UOuiiuip NA- 40 TirstVirginia NA- 40 TirstVirginia NA- Bankof America -5% 41. Zions -15% 41 FleetBoston -30% 41 Regions 16% 41 Union Planters -3% 41 UJOaneerp NA- 11 U5 Bancorp NA- 41 Summit Oantorp NA- 41 BankOne NA- 41 National Ci> em NA- 41 National Ci> cue NAr SunTrust -5% 42 StateStreet -15% 42 JP Morgan (Chase) -31% 42 BB&T 3% 42 StateStreet -4% 42 Summit Bancorp NA- 42 Summit Oaneorp NA- 42 BankOne NA- 42 rii-.LViijj.ininNA- 42 SouthTrust NA- 42 SuulliTiusl NAr Wachovia -10% 43 JP Morgan (Chase) -17% 43 BankofNY -40% 43 Fifth Third 3% 43 Fifth Third -13% 43 Bank One NA- 43 Bank One NA- Hi FirstVirginia NA- 43 NhUjiibI Cu one NA- 4G Union Hants s NA- 43 Unimi Flaula s NA- JP Morgan (Chase] -10% 44 WellsFargo -20% 44 Northern Trust -41% 44 Old National 2% 44 Old Kent NA- 44 FirstVirginia NA- 44 riisLViiginia NA- 44 Ndtiunal Cu eue NA- 44 SuullfTiujl NA- 44 Wachavia NA- 44 Wachavia NA- First Union -11% 45 PNC -21% 45 Old Kail NAr 45 Old Kent NA- 45 JP Morgan NA- 45 National Commerce NA- 45 National Commerce NA- 45 SouthTrust NA- 45 Unlun TIjiiLlij NAr 45 Hrst Union NA- 45 nret Union NA- AmSouth -17% 46 Mellon -22% 46 JP Mergan NA- 46 JP Morgan NA- 46 UB Banim u NAr 46 SouthTrust NA- 46 3-uuLl iTi us.1 NAr 45 Union Planters NA- 46 m.,1 Uniun NA- 46 Hrst Seeuriey NA- 40 rirst Deeuriey NA- M&l -17% 47 BankofNY -25% 47 U5 Bancorp NA- 4T USOaiiLUiu NA- 47 Summit Oaneorp NA- 17 Union Planters NA- 47 Union Planter NA- 47 rirst Union NA- 4T m.,1 Bum 1L > NA- 47 Compass NA- 47 Compass NA 43 Huntington -22% 43 Northern Trust -25% 46 Summit Oaneorp NA- 18 Summit Bancorp NA- 48 FirstVirginia NA- 4P TirstUnien NA- 4P TirstUnien NA- IS First Security NA- 43 Cmnuass NA- 48 AmSuuth NAr 43 fliiiSuuLli NAr UnionBanCal -37% 43 JP Morgan NA~ 4Q First Union NA- 4Q TirstUnien NA- 4Q TirstUnien NA- 19 FirstSacurity NA- 49 riislSeLUiilv NAr 19 AmSouth NA- 49 AmSuuth NA- 49 UnioiiBaiiCal NA- 49 UnioiiBaiiCal NAr First Security -40% 50 first Secui I Ly -NA— 50 first Diiup’e,- -HA- 50 riislSgiuiUy -NA- 50 First Security -NA- 50 fleet Boston -NA- 50 fleet D-DLlmi -NAr 50 f LDulIuii -NA- 50 fllQusujii -NA- 50 fleet Beaton -NA- 50 fllQusujii -NArSource: SNL Financial. m M&r B&nlc 14 |
| Transaction Highlights Strategic Rationale The M&T Bank Story Wilmington Trust M&T Bank iS Wilmington |
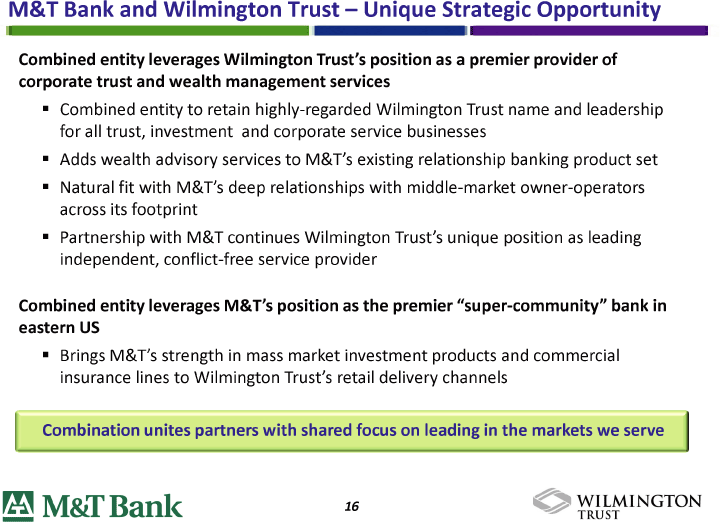
| M&T Bank and Wilmington Trust — Unique Strategic Opportunity Combined entity leverages Wilmington Trust’s position as a premier provider of corporate trust and wealth management services Combined entity to retain highly-regarded Wilmington Trust name and leadership for all trust, investment and corporate service businesses Adds wealth advisory services to M&T’s existing relationship banking product set Natural fit with M&T’s deep relationships with middle-market owner-operators across its footprint Partnership with M&T continues Wilmington Trust’s unique position as leading independent, conflict-free service provider Combined entity leverages M&T’s position as the premier “super-community” bank in eastern US Brings M&T’s strength in mass market investment products and commercial insurance lines to Wilmington Trust’s retail delivery channels Combination unites partners with shared focus on leading in the markets we serve I M&T Bank i 6 ™ INGTON |
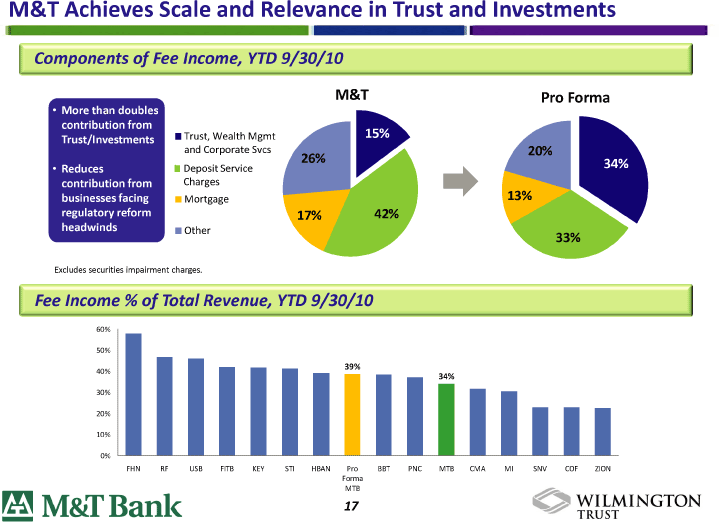
| M&T Achieves Scale and Relevance in Trust and Investments Components of Fee Income, YTD 9 30 10 I M&T Pro Forma Wealth Mgmt S U and Corporate Svcs 20% k Deposit Service 4 k Charges I Mortgage 13% 17% 42% Excludes securities impairment charges. Fee Income % of Total Revenue, YTD 9 30 10 60% 50% “ I I I I I 39% 34% 30% H 20% llllllll llllllll FHN RF USB FITB KEY STI HBAN Pro BBT PNC MTB CMA Ml SNV COF ZION Forma MTB jM&T Bank 17 *0 ™ INGTON |
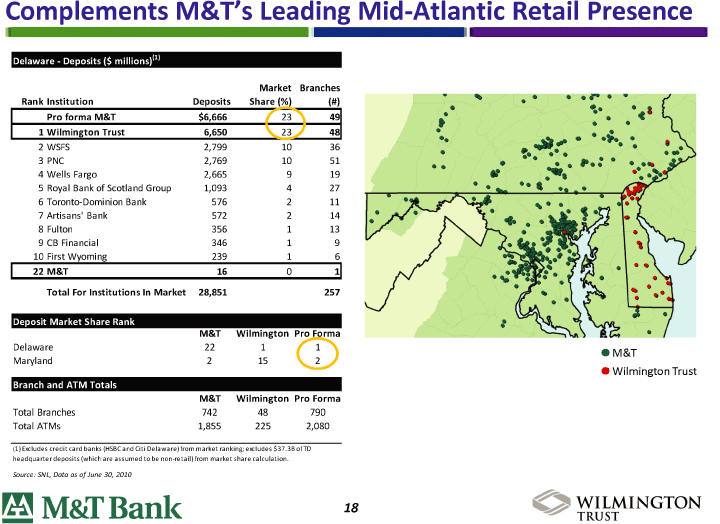
| Complements M&T’s Leading Mid-Atlantic Retail Presence Market Branches Rank Institution Deposits Share (%) (#) * • * * * * * f Pro forma M&T $6,666 23 49 .* ** • # < U Wilmington Trust 6,650 23 48 • * > S WSFS 2,799 10 36 # **•*• * ?« * PNC 2,769 10 51 , *** *, *,• • • . A* 4WellsFargo 2,665 9 19 •? * •$£> Royal Bank of Scotland Group 1,093 4 27 * • w *M •• , • d&J Toronto-Dominion Bank 576 2 11 ] *JK~_ fh * ? V? Artisans’Bank 572 2 14 # * “K. * 4. — **-5 *£t • Fulton 356 1 13 f N. “-v * •* * Jm&ftf ? CB Financial 346 19 N • £# V ll> < *) “ 10 First Wyoming 239 1 6 J *5riclw«,, * •PA? i 22 m&t 16 0 1 a. •vSfZf* • j w * V T> •T’K* * Total For Institutions In Market 28,851 257 %* % P * ***J M&T Wilmington Pro Forma S — = — « fcC* • Delaware 22 1 “ 1 ~” •M&T Maryland 2 15 2 Branch and ATM Totals •Wilmington Trust M&T Wilmington Pro Forma Total Branches 742 48 790 Total ATMs 1,855 225 2,080 (1) Excludes credit card banks (HSBC and Citi Delaware) from market ranking; excludes $37.3B of TD headquarter deposits (which are assumed to be non-retail) from market share calculation. Source: SNL, Data as of June 30, 2010 M&T Bank is ™ INGTON |
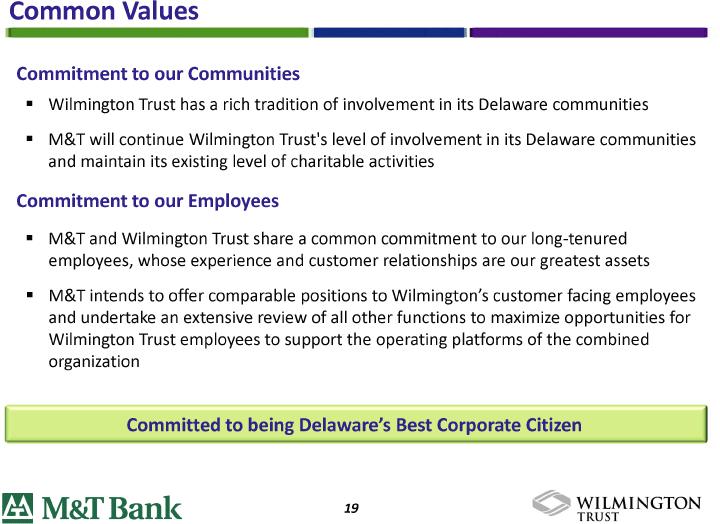
| Common Values Commitment to our Communities Wilmington Trust has a rich tradition of involvement in its Delaware communities M&T will continue Wilmington Trust’s level of involvement in its Delaware communities and maintain its existing level of charitable activities Commitment to our Employees M&T and Wilmington Trust share a common commitment to our long-tenured employees, whose experience and customer relationships are our greatest assets M&T intends to offer comparable positions to Wilmington’s customer facing employees and undertake an extensive review of all other functions to maximize opportunities for Wilmington Trust employees to support the operating platforms of the combined organization Committed to being Delaware’s Best Corporate Citizen M&T Bank i 9 ™ INGTON |
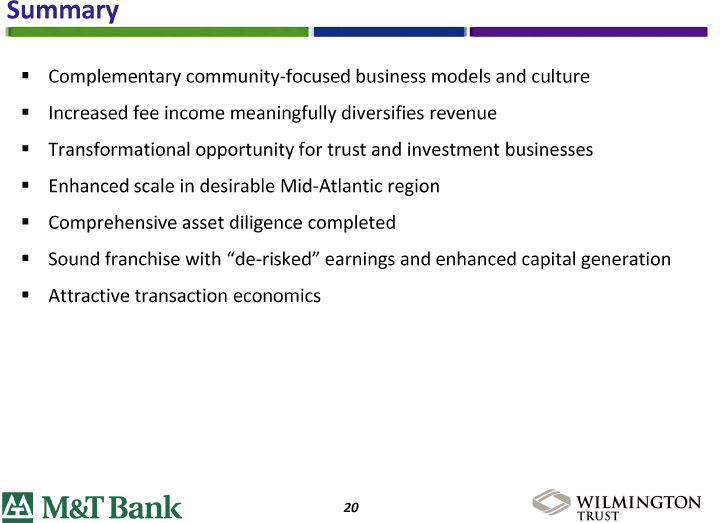
| Summary Complementary community-focused business models and culture Increased fee income meaningfully diversifies revenue Transformational opportunity for trust and investment businesses Enhanced scale in desirable Mid-Atlantic region Comprehensive asset diligence completed Sound franchise with “de-risked” earnings and enhanced capital generation Attractive transaction economics M&T Bank 2 o ™ INGTON |
| Transaction Highlights Strategic Rationale The M&T Bank Story Wilmington Trust M&T Bank 2 i ™ INGTON |
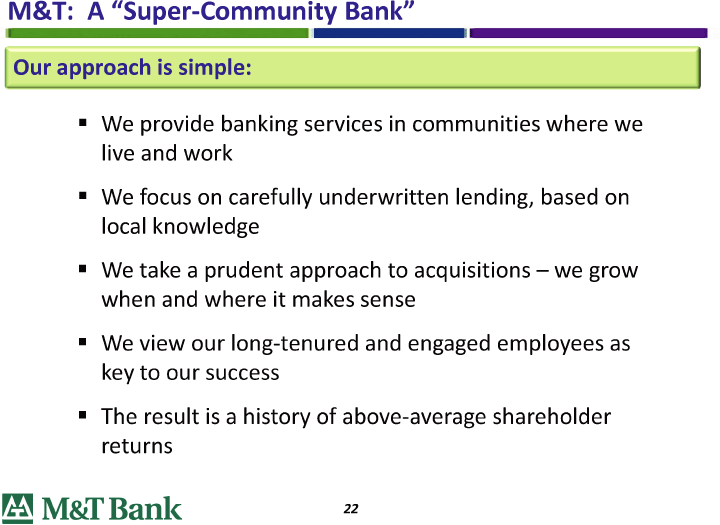
| M&T: A “Super-Community Bank” Our approach is simple: We provide banking services in communities where we live and work We focus on carefully underwritten lending, based on local knowledge We take a prudent approach to acquisitions — we grow when and where it makes sense We view our long-tenured and engaged employees as key to our success The result is a history of above-average shareholder returns |

| Commitment to our communities Hkh s “1 — Pffl 3i <*- : — BliM jj; It Jjt’jIPT B iff. JIM InfllfftVf V VH * £+3fi. vW Bhl 9* r L ( I in rib h m p xfl . Tiftk — M I Hk- i r>*( ‘ • ''' I.. J Millhijii a “ *- “Ei.Hl?irT Westminster Community Charter School ii •* ju, r — n ix- Gettysburg Visitor Center United Way Day of Caring in Baltimore Charitable Giving Donated more than $133 million to community-based organizations over the past 10 years Named one of the nation’s most generous corporate donors in Business Week’s annual survey of “Corporate Philanthropy’s Biggest Givers“ for two consecutive years Community Investment Earned highest possible “Outstanding” Community Reinvestment Act rating on every exam since 1982 Volunteerism 2,700+ M&T Bank employees volunteer their time with 4,700+ community organizations, logging more than 333,000 hours in 2009 Consistent and Conservative Lending Greenwich Excellence National Award Winner: Financial Stability in Middle Market Banking #1 SBA lender in core Mid-Atlantic markets of Baltimore, Washington, DC and Philadelphia — ranked 6th nationally |
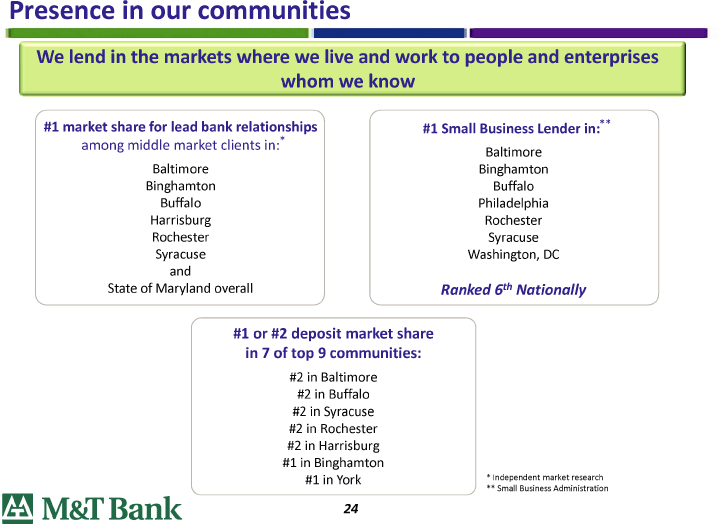
| Presence in our communities We lend in the markets where we live and work to people and enterprises whom we know ‘#1 market share for lead bank relationships ( #1 Small Business Lender in:” among middle market clients in:* Baltimore Baltimore Binghamton Binghamton Buffalo Buffalo Philadelphia Harrisburg Rochester Rochester Syracuse Syracuse Washington, DC and State of Maryland overall Ranked 6 th Nationally #1 or #2 deposit market share in 7 of top 9 communities: #2 in Baltimore #2 in Buffalo #2 in Syracuse #2 in Rochester #2 in Harrisburg #1 in Binghamton #1 in York * Independent market research ) ** Small Business Administration |
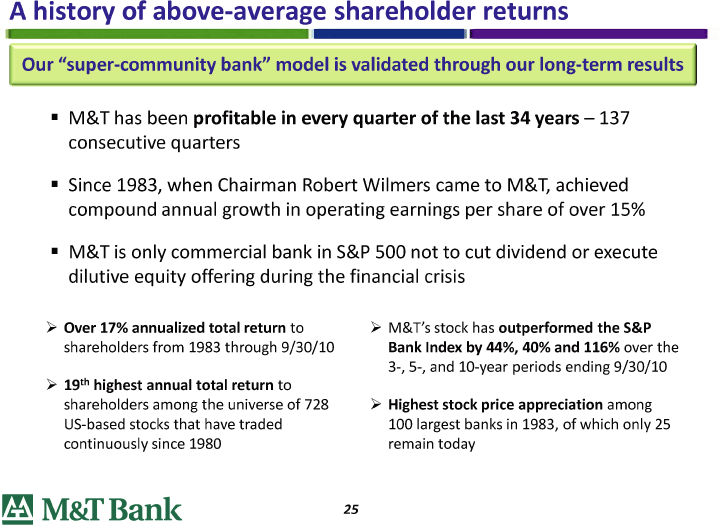
| A history of above-average shareholder returns Our “super-community bank” model is validated through our long-term results M&T has been profitable in every quarter of the last 34 years -137 consecutive quarters Since 1983, when Chairman Robert Wilmers came to M&T, achieved compound annual growth in operating earnings per share of over 15% M&T is only commercial bank in S&P 500 not to cut dividend or execute dilutive equity offering during the financial crisis > Over 17% annualized total return to > M&T’s stock has outperformed the S&P shareholders from 1983 through 9 30 10 Bank Index by 44%, 40% and 116% over the 3-, 5-, and 10-year periods ending 9 30 10 > 19 th highest annual total return to shareholders among the universe of 728 > Highest stock price appreciation among US-based stocks that have traded 100 largest banks in 1983, of which only 25 continuously since 1980 remain today |
| Transaction Highlights Strategic Rationale The M&T Bank Story Wilmington Trust M&T Bank 26 ™ INGTON |
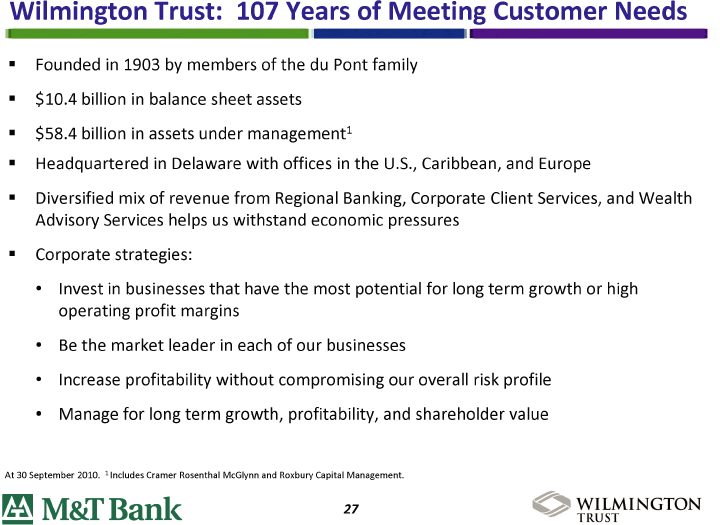
| Wilmington Trust: 107 Years of Meeting Customer Needs Founded in 1903 by members of the du Pont family $10.4 billion in balance sheet assets $58.4 billion in assets under management 1 Headquartered in Delaware with offices in the U.S., Caribbean, and Europe Diversified mix of revenue from Regional Banking, Corporate Client Services, and Wealth Advisory Services helps us withstand economic pressures Corporate strategies: Invest in businesses that have the most potential for long term growth or high operating profit margins Be the market leader in each of our businesses Increase profitability without compromising our overall risk profile Manage for long term growth, profitability, and shareholder value At 30 September 2010. 1 Includes Cramer Rosenthal McGlynn and Roxbury Capital Management. M&T Bank 27 Wilmington |
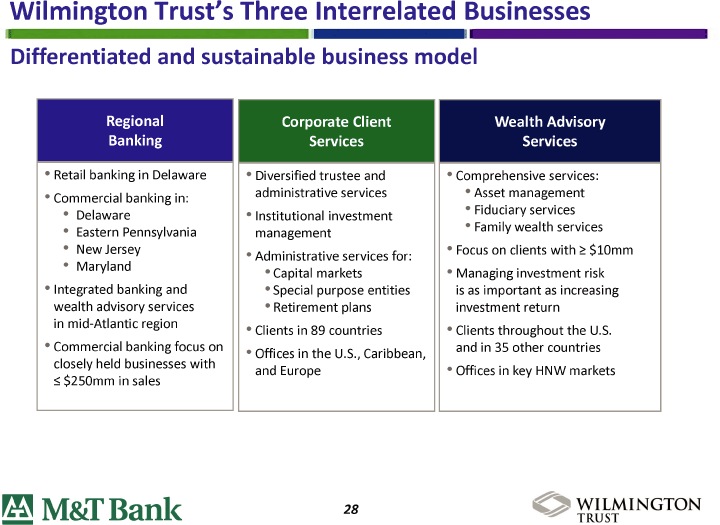
| Wilmington Trust’s Three Interrelated Businesses Differentiated and sustainable business model • Retail banking in Delaware • Diversified trustee and • Comprehensive services: •Commercial banking in: administrative services • Asset management Delaware • Institutional investment • Fiduciary services Eastern Pennsylvania management • Family wealth services New Jersey • Administrative services for: • Focus on clients with = $10mm • Maryland •Capital markets • Managing investment risk • Integrated banking and • Special purpose entities is as important as increasing wealth advisory services • Retirement plans investment return in mid-Atlantic region • Clients in 89 countries • Clients throughout the U.S. •Commercial banking focus on • Offices in the U S Caribbean and in 35 other countries closely held businesses with and . ., , • Offices in key HNW markets = $250mm in sales ra M&T Bank O Wilmington |
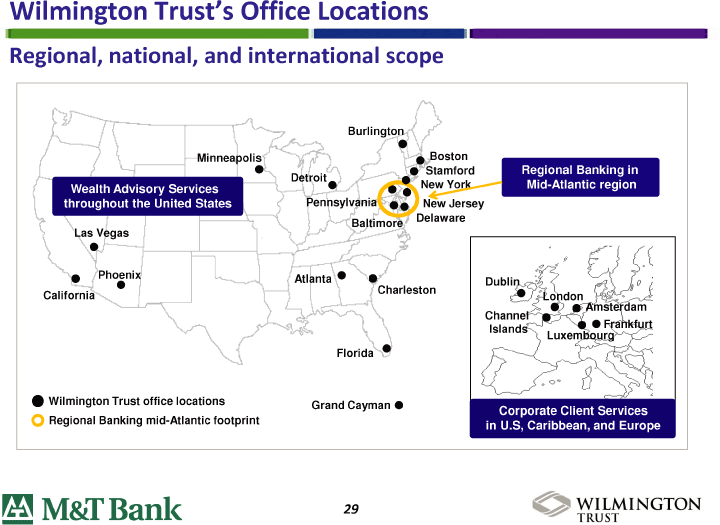
| Wilmington Trust’s Office Locations Regional, national, and international scope Burlington Minneapolis # Boston iHn H «K nLL-t • Stamford H jjl PeWvifflaK aJ NewJeTsey Baltimore Delaware Las Wjgas SyPhoenix AtlantaW # Dublin x >? A California [Charleston Londonfci- ChsIa ndelA* frdam t Islands-x Luxembourgrfur- # Wilmington Trust office locations Grand Cayman • IVVPJPIPYSPPCMIPH Regional Banking mid-Atlantic footprint n Corporate Client Ser E cews M&T Bank 2 5 ™ INGTON |
| Appendix |
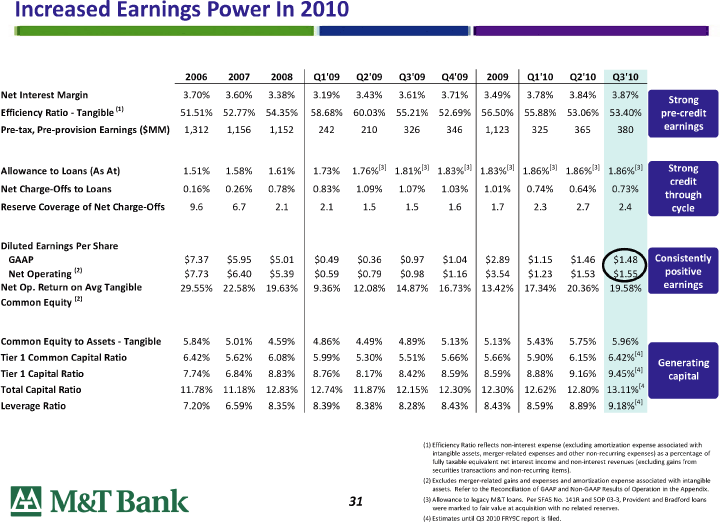
| Increased Earnings Power In 2010 2006 2007 2008 I Q1’09 Q2’09 Q3’09 Q4’09 I 2009 I Q1’10 Q2’10 Q3’10 Net Interest Margin 3.70% 3.60% 3.38% 3.19% 3.43% 3.61% 3.71% 3.49% 3.78% 3.84% 3.87% BBflWWWB Efficiency Ratio-Tangible (1) 51.51% 52.77% 54.35% 58.68% 60.03% 55.21% 52.69% 56.50% 55.88% 53.06% 53.40% I Pre-tax, Pre-provision Earnings ($MM) 1,312 1,156 1,152 242 210 326 346 1,123 325 365 380 Allowance to Loans (As At) 1.51% 1.58% 1.61% 1.73% 1.76% [3] 1.81% [3] 1.83% [3] 1.83% [3] 1.86% [3] 1.86% [3] 1.86% [3] j Effll Net Charge-Offs to Loans 0.16% 0.26% 0.78% 0.83% 1.09% 1.07% 1.03% 1.01% 0.74% 0.64% 0.73% Rttjftfl Reserve Coverage of Net Charge-Offs 9.6 6.7 2.1 2.1 1.5 1.5 1.6 1.7 2.3 2.7 2.4 Diluted Earnings Per Share «B1B« GAAP $7.37 $5.95 $5.01 $0.49 $0.36 $0.97 $1.04 $2.89 $1.15 $1.46 $1.48 Net Operating (2) $7.73 $6.40 $5.39 $0.59 $0.79 $0.98 $1.16 $3.54 $1.23 $1.53 V$1.55 C Net Op. Return on Avg Tangible 29.55% 22.58% 19.63% 9.36% 12.08% 14.87% 16.73% 13.42% 17.34% 20.36% 19.58% rnings Common Equity (2) Common Equity to Assets — Tangible 5.84% 5.01% 4.59% 4.86% 4.49% 4.89% 5.13% 5.13% 5.43% 5.75% 5.96% _ Tier 1 Common Capital Ratio 6.42% 5.62% 6.08% 5.99% 5.30% 5.51% 5.66% 5.66% 5.90% 6.15% 6.42% [4] I Tier 1 Capital Ratio 7.74% 6.84% 8.83% 8.76% 8.17% 8.42% 8.59% 8.59% 8.88% 9.16% 9.45% [4] capital g Total Capital Ratio 11.78% 11.18% 12.83% 12.74% 11.87% 12.15% 12.30% 12.30% 12.62% 12.80% 13.11% [4 1 Leverage Ratio 7.20% 6.59% 8.35% 8.39% 8.38% 8.28% 8.43% 8.43% 8.59% 8.89% 9.18% [4] (1) Efficiency Ratio reflects non-interest expense (excluding amortization expense associated with intangible assets, merger-related expenses and other non-recurring expenses) as a percentage of fully taxable equivalent net interest income and non-interest revenues (excluding gains from securities transactions and non-recurring items). (2) Excludes merger-related gains and expenses and amortization expense associated with intangible n 1 assets. Refer to the Reconciliation of GAAP and Non-GAAP Results of Operation in the Appendix. FaXaI iP l I“XC T“1 f 31(3) Allowance to legacy M&T loans. Per SFAS No. 141R and SOP 03-3, Provident and Bradford loans “ *i.VXOv.X M ‘ I I IV were marked to fair value at acquisition with no related reserves. (4) Estimates until Q3 2010 FRY9C report is filed. |
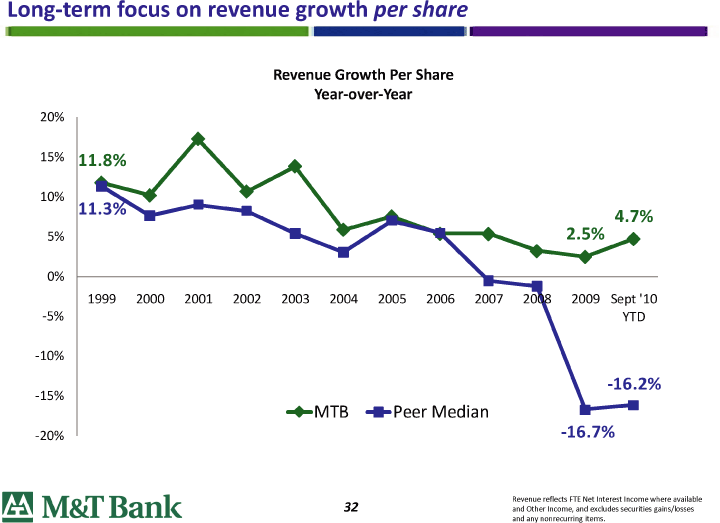
| Long-term focus 20% 150 0 11.8% J 10% S 11.3%V 5% Long-term focus on revenue growth per share Revenue Growth Per Share Year-over-Year 20% 150 0 11.8% X . Jk 1999 2000 2001 2002 2003 2004 2005 2006 2007 2008 2009 Sept ‘10 -?-MTB -B-Peer Median -20% -16.7% IT1 TVOTTJ Revenue reflects FTE Net Interest Income where available fC IVlfSlI I Irll lIC 32 and Other Income, and excludes securities gains losses m *-*- i -” 1 - i ‘**lll and any nonrecurring items. |
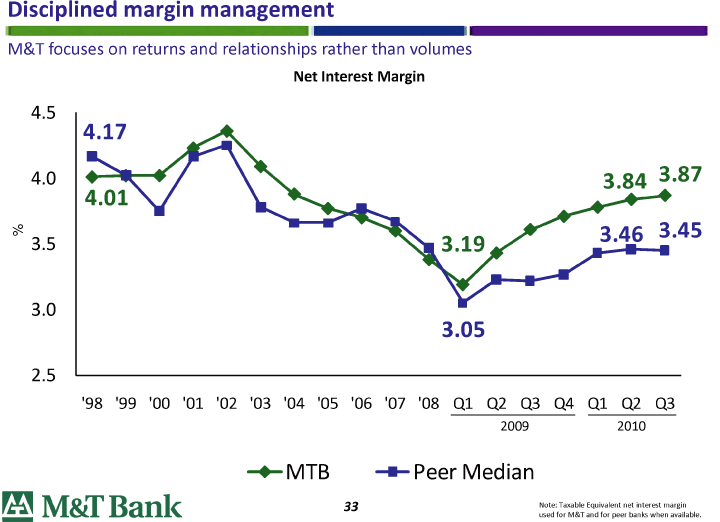
| Disciplined margin management M&T focuses on returns and relationships rather than volumes Net Interest Margin 4.5 4.0 nl *r 3.843.87 3.05 2.5 ‘98 ‘99 ‘00 ‘01 ‘02 ‘03 ‘04 ‘05 ‘06 ‘07 ‘08 Q1 Q2 Q3 Q4 Q1 Q2 Q3 2009 2010 -MTB — -Peer Median HhI l j#l 151 W C 33Note: Taxable Equivalent net interest margin J ItAOcA JJCIAJ..I.V used for M&T and for peer banks when available. |
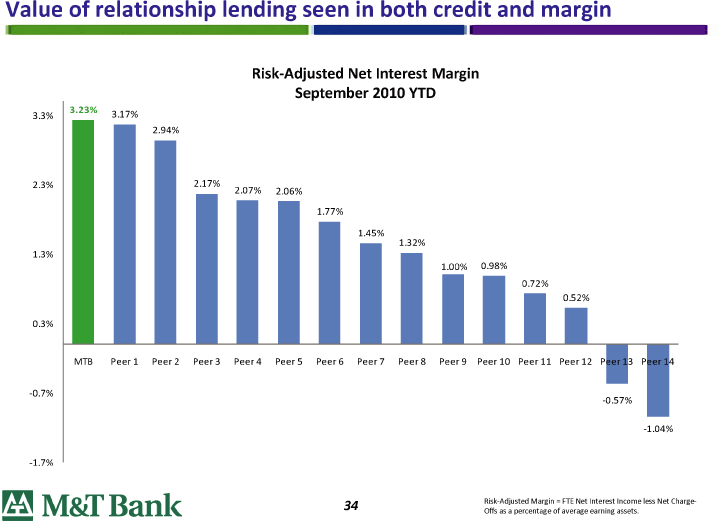
| Value of relationship lending seen in both credit and margin Risk-Adjusted Net Interest Margin September 2010 YTD 3.3% 3% 3.17% 2.94% 2 3% 2.17% 2.07% 2.06% 1.77% 1.45% _ 1.32% 1.3% H 1.00% 0.98% 0.72% 0.52% 0.3% MTB Peer 1 Peer 2 Peer 3 Peer 4 Peer 5 Peer 6 Peer 7 Peer 8 Peer 9 Peer 10 Peer 11 Peer 12 Peer 13 Peer 14 -0.7% -0.57% -1.04% -1.7% yT TV“0 ‘“I”’ TOflly OA Risk-Adjusted Margin = FTE Net Interest Income less Net Charge- rs Aj IVXOiJ 13 ClJ .I.X. Offs as a percentage of average earning assets. |
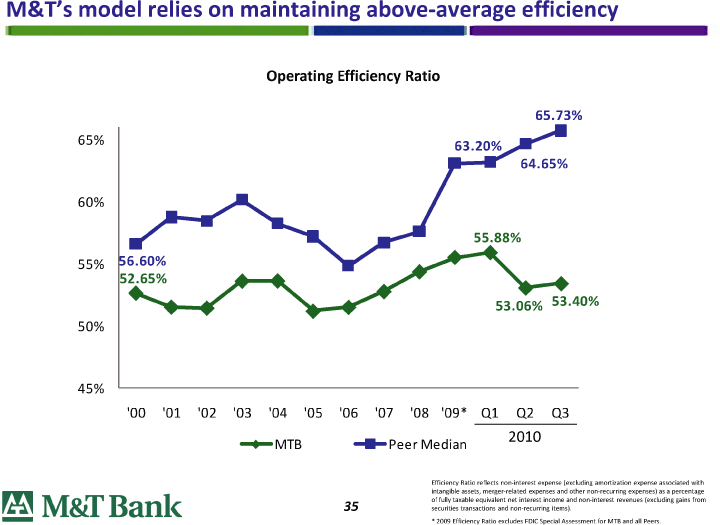
| M&T’s model relies on maintaining above-average efficiency Operating Efficiency Ratio 65.73% 50% 45% ‘00 ‘01 ‘02 ‘03 ‘04 ‘05 ‘06 ‘07 ‘08 ‘09* Q1 Q2 Q3 —MTB Peer Median 2010 Efficiency Ratio reflects non-interest expense (excluding amortization expense associated with ___ intangible assets, merger-related expenses and other non-recurring expenses) as a percentage JT 1Y f £% ‘ I ‘ “13 *-** % 1 — of fully taxable equivalent net interest income and non-interest revenues (excluding gains from FiT]Al f I ACf I I bJII I Iv 35 securities transactions and non-recurring items). “ ‘ * 2009 Efficiency Ratio excludes FDIC Special Assessment for MTB and all Peers. |
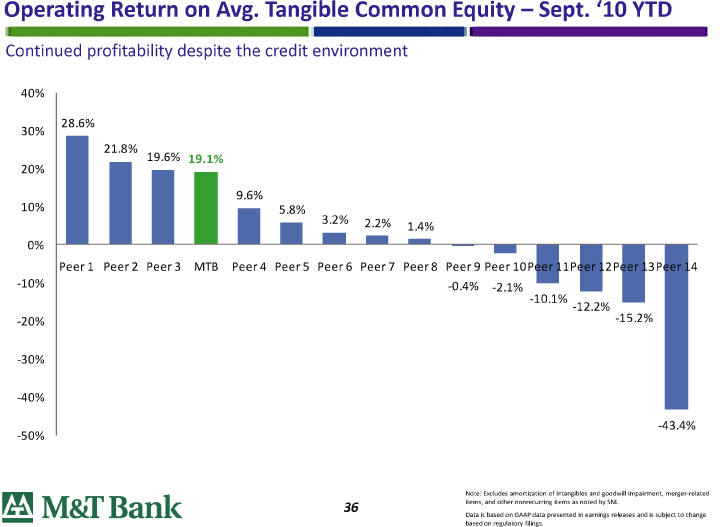
| Operating Return on Avg. Tangible Common Equity — Sept. ‘10 YTD Continued profitability despite the credit environment 40% 30% 28.6% 9.6% _ 5.8% 3.2% 2.2% 1.4% 0 0 — — —— — ——— m —H—H—H—l Peer 1 Peer 2 Peer 3 MTB Peer 4 Peer 5 Peer 6 Peer 7 Peer 8 Peer 9 Peer 10Peer 11Peer 12Peer 13Peer 14 -10% -0.4% -2 1% -10.1% -12.2% “ -20% -15.2% -30% -40% -43.4% -50% VWV — Note: Excludes amortization of intangibles and goodwill impairment, merger-related F.TT% IW f% “1"' “I [5 #"•” “% I .X” OC items, and other nonrecurring items as noted by SNL. £*J l.VXOv.X -DCil. J.-1.V Data is based on GAAP data presented in earnings releases and is subject to change based on regulatory filings. |
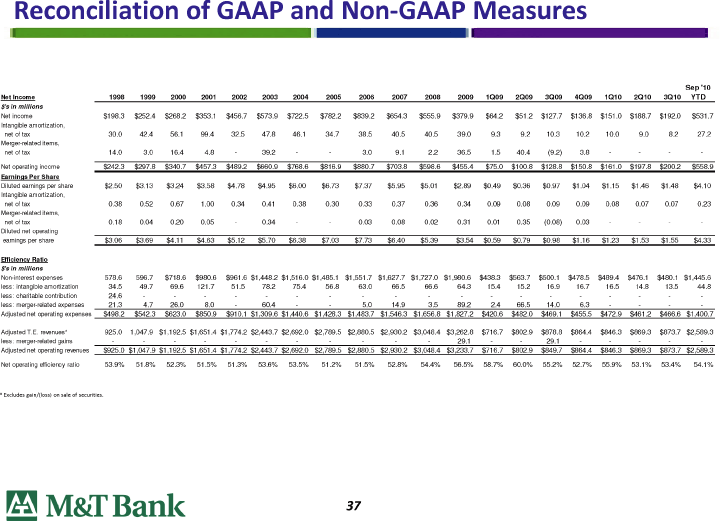
| Reconciliation of GAAP and Non-GAAP Measures Sep’10 Net Income1998 1999 2000 2001 2002 2003 2004 2005 2006 2007 2008 2009 1Q09 2Q09 3Q09 4Q09 1Q10 2Q10 3Q10 YTD $’s in millions Net income $198.3 $252.4 $268.2 $353.1 $456.7 $573.9 $722.5 $782.2 $839.2 $654.3 $555.9 $379.9 $64.2 $51.2 $127.7 $136.8 $151.0 $188.7 $192.0 $531.7 Intangible amortization, net of tax 30.0 42.4 56.1 99.4 32.5 47.8 46.1 34.7 38.5 40.5 40.5 39.0 9.3 9.2 10.3 10.2 10.0 9.0 8.2 27.2 Merger-related items, net of tax 14.0 3.0 16.4 4.8 — 39.2 — - 3.0 9.1 2.2 36.5 1.5 40.4 (9.2) 3.8 Net operating income $242.3 $297.8 $340.7 $457.3 $489.2 $660.9 $768.6 $816.9 $880.7 $703.8 $598.6 $455.4 $75.0 $100.8 $128.8 $150.8 $161.0 $197.8 $200.2 $558.9 Earnings Per ShareDiluted earnings per share $2.50 $3.13 $3.24 $3.58 $4.78 $4.95 $6.00 $6.73 $7.37 $5.95 $5.01 $2.89 $0.49 $0.36 $0.97 $1.04 $1.15 $1.46 $1.48 $4.10 Intangible amortization, net of tax 0.38 0.52 0.67 1.00 0.34 0.41 0.38 0.30 0.33 0.37 0.36 0.34 0.09 0.08 0.09 0.09 0.08 0.07 0.07 0.23 Merger-related items, net of tax 0.18 0.04 0.20 0.05 — 0.34 — - 0.03 0.08 0.02 0.31 0.01 0.35 (0.08) 0.03 —— Diluted net operating earnings per share $3.06 $3.69 $4.11 $4.63 $5.12 $5.70 $6.38 $7.03 $7.73 $6.40 $5.39 $3.54 $0.59 $0.79 $0.98 $1.16 $1.23 $1.53 $1.55 $4.33 Efficiency Ratio$’s in millions Non-interest expenses 5 78.6 5 96.7 $718.6 $980.6 $961.6 $1,448.2 $1,516.0 $1,485.1 $1,551.7 $1,627.7 $1,727.0 $1,980.6 $438.3 $563.7 $500.1 $478.5 $489.4 $476.1 $480.1 $1,445.6 less: intangible amortization 3 4.5 4 9.7 6 9.6 1 21.7 5 1.5 7 8.2 7 5.4 5 6.8 63.0 66.5 66.6 64.3 15.4 15.2 16.9 16.7 16.5 14.8 13.5 44.8 less: charitable contribution 2 4.6 —— - — - — —— less: merger-related expenses 2 1.3 4 .7 2 6.0 8 .0 6 0.4 — 5.0 14.9 3.5 89.2 2.4 66.5 14.0 6.3 — - — Adjusted net operating expenses $498.2 $542.3 $623.0 $850.9 $910.1 $1,309.6 $1,440.6 $1,428.3 $1,483.7 $1,546.3 $1,656.8 $1,827.2 $420.6 $482.0 $469.1 $455.5 $472.9 $461.2 $466.6 $1,400.7 Adjusted T.E. revenues* 9 25.0 1 ,047.9 $1,192.5 $1,651.4 $1,774.2 $2,443.7 $2,692.0 $2,789.5 $2,880.5 $2,930.2 $3,048.4 $3,262.8 $716.7 $802.9 $878.8 $864.4 $846.3 $869.3 $873.7 $2,589.3 less: merger-related gains — - — - — - — - — - — 29.1 — 29.1 — - — - Adjusted net operating revenues $925.0 $1,047.9 $1,192.5 $1,651.4 $1,774.2 $2,443.7 $2,692.0 $2,789.5 $2,880.5 $2,930.2 $3,048.4 $3,233.7 $716.7 $802.9 $849.7 $864.4 $846.3 $869.3 $873.7 $2,589.3 Net operating efficiency ratio 53.9% 51.8% 52.3% 51.5% 51.3% 53.6% 53.5% 51.2% 51.5% 52.8% 54.4% 56.5% 58.7% 60.0% 55.2% 52.7% 55.9% 53.1% 53.4% 54.1% * Excludes gain (loss) on sale of securities. J M&£T Bsnlc 37 |
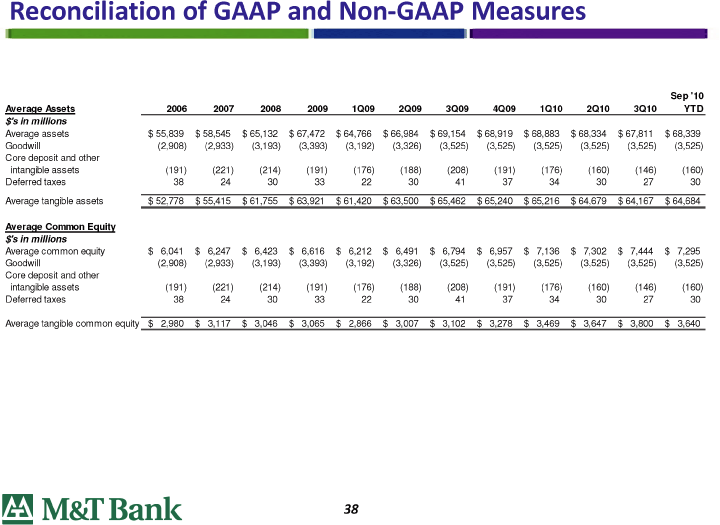
| Reconciliation of GAAP and Non-GAAP Measures Sep’10 Average Assets 2006 2007 2008 2009 1Q09 2Q09 3Q09 4Q09 1Q10 2Q10 3Q10 YTD $’s in millions Average assets $55,839 $58,545 $65,132 $67,472 $64,766 $66,984 $69,154 $68,919 $68,883 $68,334 $67,811 $68,339 Goodwill (2,908) (2,933) (3,193) (3,393) (3,192) (3,326) (3,525) (3,525) (3,525) (3,525) (3,525) (3,525) Core deposit and other intangible assets (191) (221) (214) (191) (176) (188) (208) (191) (176) (160) (146) (160) Deferred taxes 38 24 30 33 22 30 41 37 34 30 27 30 Average tangible assets $52,778 $55,415 $61,755 $63,921 $61,420 $63,500 $65,462 $65,240 $65,216 $64,679 $64,167 $64,684 Average Common Equity $’s in millions Average common equity $6,041 $6,247 $6,423 $6,616 $6,212 $6,491 $6,794 $ 6,957 $7,136 $7,302 $7,444 $7,295 Goodwill ( 2,908) ( 2,933) ( 3,193) ( 3,393) ( 3,192) ( 3,326) ( 3,525) ( 3,525) ( 3,525) ( 3,525) ( 3,525) ( 3,525) Core deposit and other intangible assets ( 191) ( 221) ( 214) ( 191) ( 176) ( 188) ( 208) ( 191) (176) ( 160) ( 146) ( 160) Deferred taxes 3 8 2 4 3 0 3 3 2 2 3 0 4 1 3 7 3 4 3 0 2 7 3 0 Average tangible common equity $2 ,980 $ 3 ,117 $3 ,046 $3 ,065 $2 ,866 $3 ,007 $3 ,102 $3 ,278 $3 ,469 $3 ,647 $3 ,800 $ 3 ,640 J M&£T Bsnlc 38 |
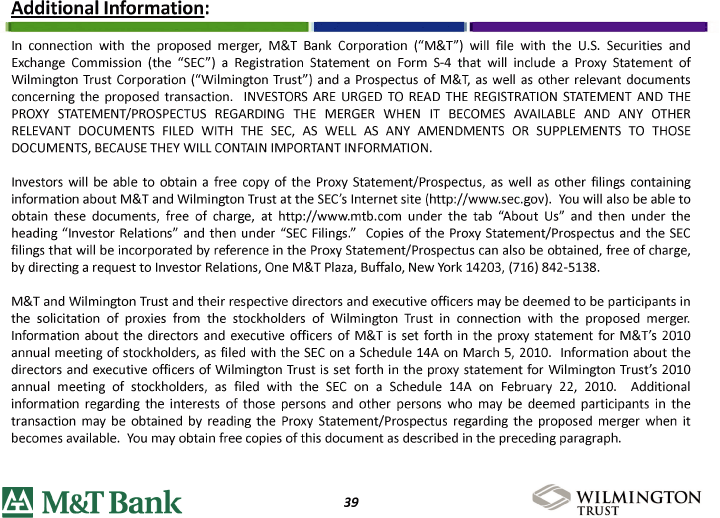
| Additional Information: In connection with the proposed merger, M&T Bank Corporation (“M&T”) will file with the U.S. Securities and Exchange Commission (the “SEC”) a Registration Statement on Form S-4 that will include a Proxy Statement of Wilmington Trust Corporation (“Wilmington Trust”) and a Prospectus of M&T, as well as other relevant documents concerning the proposed transaction. INVESTORS ARE URGED TO READ THE REGISTRATION STATEMENT AND THE PROXY STATEMENT PROSPECTUS REGARDING THE MERGER WHEN IT BECOMES AVAILABLE AND ANY OTHER RELEVANT DOCUMENTS FILED WITH THE SEC, AS WELL AS ANY AMENDMENTS OR SUPPLEMENTS TO THOSE DOCUMENTS, BECAUSE THEY WILL CONTAIN IMPORTANT INFORMATION. Investors will be able to obtain a free copy of the Proxy Statement Prospectus, as well as other filings containing information about M&T and Wilmington Trust at the SEC’s Internet site ( http: www.sec.gov). You will also be able to obtain these documents, free of charge, at http: www.mtb.comunder the tab “About Us” and then under the heading “Investor Relations” and then under “SEC Filings.” Copies of the Proxy Statement Prospectus and the SEC filings that will be incorporated by reference in the Proxy Statement Prospectus can also be obtained, free of charge, by directing a request to Investor Relations, One M&T Plaza, Buffalo, New York 14203, (716) 842-5138. M&T and Wilmington Trust and their respective directors and executive officers may be deemed to be participants in the solicitation of proxies from the stockholders of Wilmington Trust in connection with the proposed merger. Information about the directors and executive officers of M&T is set forth in the proxy statement for M&T’s 2010 annual meeting of stockholders, as filed with the SEC on a Schedule 14A on March 5, 2010. Information about the directors and executive officers of Wilmington Trust is set forth in the proxy statement for Wilmington Trust’s 2010 annual meeting of stockholders, as filed with the SEC on a Schedule 14A on February 22, 2010. Additional information regarding the interests of those persons and other persons who may be deemed participants in the transaction may be obtained by reading the Proxy Statement Prospectus regarding the proposed merger when it becomes available. You may obtain free copies of this document as described in the preceding paragraph. M&T Bank 39 ™s T MINGTON |
