Attached files
| file | filename |
|---|---|
| EX-23.1 - EXHIBIT 23.1 - SafeNet Holding Corp | dex231.htm |
Table of Contents
As filed with the Securities and Exchange Commission on November 2, 2010
Registration No. 333-168067
SECURITIES AND EXCHANGE COMMISSION
Washington, D.C. 20549
Amendment No. 3
to
FORM S-1
REGISTRATION STATEMENT
Under
The Securities Act of 1933
SAFENET HOLDING CORPORATION
(Exact name of Registrant as specified in its charter)
| Delaware | 3577 | 27-2808598 | ||
| (State or other jurisdiction of incorporation or organization) |
(Primary Standard Industrial Classification Code Number) |
(I.R.S. Employer Identification Number) |
4690 Millennium Drive
Belcamp, Maryland 21017
(410) 931-7500
(Address, including zip code, and telephone number, including area code, of Registrant’s principal executive offices)
Mark A. Floyd
Chief Executive Officer
SafeNet Holding Corporation
4690 Millennium Drive
Belcamp, Maryland 21017
(410) 931-7500
(Name, address, including zip code, and telephone number, including area code, of agent for service)
Copies to:
| David J. Segre, Esq. Wilson Sonsini Goodrich & Rosati, Professional Corporation 650 Page Mill Road Palo Alto, California 94304
Mark R. Fitzgerald, Esq. Michael C. Labriola, Esq. Wilson Sonsini Goodrich & Rosati, Professional Corporation 1700 K Street, N.W., Fifth Floor Washington, D.C. 20006 Telephone: (202) 973-8800 Facsimile: (202) 973-8899 |
Kenneth M. Siegel, Esq. Senior Vice President and General Counsel SafeNet Holding Corporation 4690 Millennium Drive Belcamp, Maryland 21017 Telephone: (410) 931-7500 Facsimile: (410) 931-7524 |
Richard D. Truesdell, Jr., Esq. Davis Polk & Wardwell LLP 450 Lexington Avenue New York, New York 10017 Telephone: (212) 450-4674 Facsimile: (212) 701-5674 |
Approximate date of commencement of proposed sale to the public: As soon as practicable after the effective date of this Registration Statement.
If any of the securities being registered on this Form are to be offered on a delayed or continuous basis pursuant to Rule 415 under the Securities Act of 1933, check the following box. ¨
If this Form is filed to register additional securities for an offering pursuant to Rule 462(b) under the Securities Act, please check the following box and list the Securities Act registration statement number of the earlier effective registration statement for the same offering. ¨
If this Form is a post-effective amendment filed pursuant to Rule 462(c) under the Securities Act, check the following box and list the Securities Act registration statement number of the earlier effective registration statement for the same offering. ¨
If this Form is a post-effective amendment filed pursuant to Rule 462(d) under the Securities Act, check the following box and list the Securities Act registration statement number of the earlier effective registration statement for the same offering. ¨
Indicate by check mark whether the registrant is a large accelerated filer, an accelerated filer, a non-accelerated filer, or a smaller reporting company. See the definitions of “large accelerated filer,” “accelerated filer” and “smaller reporting company” in Rule 12b-2 of the Exchange Act.
| Large accelerated filer | ¨ | Accelerated filer | ¨ | |||
| Non-accelerated filer | x (Do not check if a smaller reporting company) | Smaller reporting company | ¨ |
The Registrant hereby amends this Registration Statement on such date or dates as may be necessary to delay its effective date until the Registrant shall file a further amendment which specifically states that this Registration Statement shall thereafter become effective in accordance with Section 8(a) of the Securities Act of 1933 or until the Registration Statement shall become effective on such date as the Commission, acting pursuant to said Section 8(a) may determine.
Table of Contents
The information in this prospectus is not complete and may be changed. We may not sell these securities until the registration statement filed with the Securities and Exchange Commission is effective. This prospectus is not an offer to sell these securities and it is not soliciting an offer to buy these securities in any jurisdiction where the offer or sale is not permitted.
PROSPECTUS (Subject to completion)
Issued November 2, 2010
Shares

This is an initial public offering of shares of common stock of SafeNet Holding Corporation. No public market currently exists for our common stock. We anticipate the initial public offering price per share will be between $ and $ per share.
We are selling shares of common stock and the selling stockholder is selling shares of common stock. We will not receive any of the proceeds from the shares of common stock sold by the selling stockholder.
We have applied to list our common stock on the NASDAQ Global Market under the symbol “SAFE.”
Investing in our common stock involves risks. See “Risk Factors” beginning on page 16.
Price $ Per Share
| Price to Public | Underwriting Discounts and Commissions |
Proceeds to SafeNet |
Proceeds to Selling Stockholder |
|||||||||||||
| Per Share |
$ | $ | $ | $ | ||||||||||||
| Total |
$ | $ | $ | $ | ||||||||||||
The underwriters have a 30-day option to purchase up to an aggregate of additional shares of common stock from on the same terms set forth above.
Neither the Securities and Exchange Commission nor any state securities commission has approved or disapproved of these securities or determined if this prospectus is truthful or complete. Any representation to the contrary is a criminal offense.
The underwriters expect to deliver the shares of common stock to purchasers on or about , 2010.
| Morgan Stanley | Goldman, Sachs & Co. | J.P. Morgan |
| BofA Merrill Lynch | Deutsche Bank Securities |
| Wells Fargo Securities | ||||||
| Lazard Capital Markets | ||||||
| Pacific Crest Securities | ||||||
| RBC Capital Markets |
, 2010
Table of Contents

Our products provide persistent data-centric protection throughout the data lifecycle. The diagram below graphically depicts the nature of information networks and where the SafeNet data protection solution applies products that protect the phases of the data’s lifecycle. In the center of the diagram is a typical data center, comprised of a combination of storage resources, application and web servers, mainframe computers and other core transactional functions. The concentric rings around the data center represent the network edge and the remote users and endpoints that sit beyond the network edge. Also beyond the edge are cloud computing environments and the SafeNet products that extend data protection from the data center into the cloud. Persistent data protection is provided by protecting data regardless of where it sits in, or beyond the edge of, the data network.
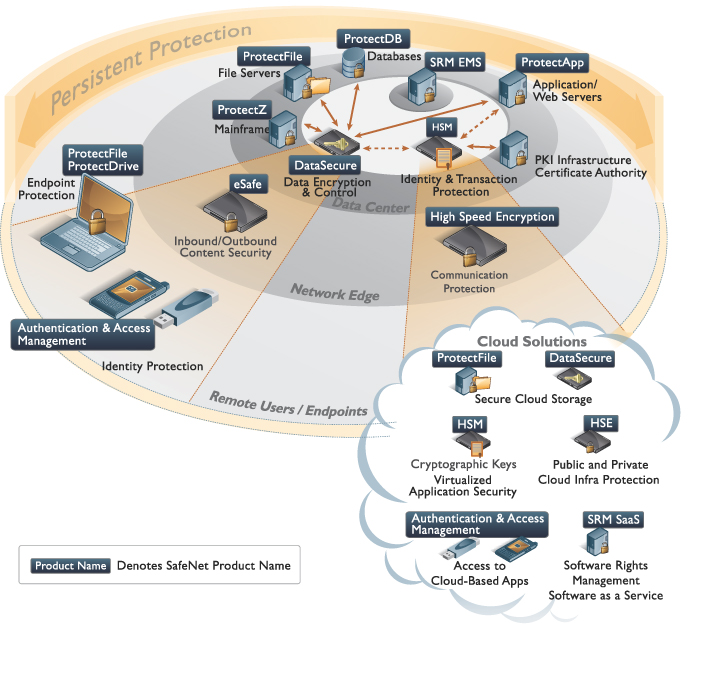
Table of Contents
| Page | ||||
| 1 | ||||
| 16 | ||||
| Cautionary Note Regarding Forward-Looking Statements and Industry Data |
42 | |||
| 43 | ||||
| 44 | ||||
| 45 | ||||
| 46 | ||||
| Unaudited Pro Forma Condensed Consolidated Financial Information |
48 | |||
| 50 | ||||
| Management’s Discussion and Analysis of Financial Condition and Results of Operations |
53 | |||
| 108 | ||||
| 132 | ||||
| 142 | ||||
| 149 | ||||
| 168 | ||||
| 172 | ||||
| 174 | ||||
| 177 | ||||
| Material United States Federal Income Tax and Estate Tax Consequences to Non-U.S. Holders |
179 | |||
| 183 | ||||
| 190 | ||||
| 190 | ||||
| 190 | ||||
| F-1 | ||||
We have not authorized anyone to provide any information other than that contained in this prospectus or in any free writing prospectus prepared by or on behalf of us or to which we have referred you. We take no responsibility for, and can provide no assurance as to the reliability of, any other information that others may give you. We, the underwriters and the selling stockholder are offering to sell, and seeking offers to buy, shares of our common stock only in jurisdictions where offers and sales are permitted. The information in this prospectus is accurate only as of the date of this prospectus, regardless of the time of delivery of this prospectus or any sale of shares of our common stock.
Neither we, the selling stockholder, nor any of the underwriters have done anything that would permit this offering or possession or distribution of this prospectus in any jurisdiction where action for that purpose is required, other than in the United States. Persons outside the United States who come into possession of this prospectus must inform themselves about, and observe any restrictions relating to, the offering of the shares of common stock and the distribution of this prospectus outside of the United States.
Until , 2010 (25 days after the commencement of this offering), all dealers that buy, sell or trade shares of our common stock, whether or not participating in this offering, may be required to deliver a prospectus. This delivery requirement is in addition to the obligation of dealers to deliver a prospectus when acting as underwriters and with respect to their unsold allotments or subscriptions.
We have registered the “SafeNet,” “Aladdin,” “DataSecure,” “eSafe,” “HASP,” “Luna,” and “Sentinel” trademarks in the U.S. in certain classes of goods and services applicable to our business and, in some cases, in certain other countries. Other of our unregistered trademarks and service marks in the U.S. include: “eToken,” “ProtectApp,” “ProtectDatabase,” “ProtectDrive,” “ProtectFile,” “Sentinel HASP,” “Sentinel RMS,” and “Sentinel EMS,” which are protected under common law. Third parties may use trademarks similar to our trademarks in other fields of use. This prospectus also contains trademarks of other persons.
i
Table of Contents
(This page left intentionally blank)
ii
Table of Contents
This summary highlights information contained elsewhere in this prospectus. This summary does not contain all of the information you should consider before buying shares in this offering. Therefore, you should read this entire prospectus carefully, including the “Risk Factors” section beginning on page 16 and our consolidated financial statements and the related notes. As described below in the sections entitled “—Company Information” and “—Corporate Reorganization,” we were incorporated in June 2010 as a Delaware corporation to become a holding company for SafeNet, Inc., which was founded in 1983. The reorganization was completed on June 30, 2010. Prior to and following the reorganization, our operations were and will continue to be conducted through SafeNet, Inc. and its consolidated subsidiaries. Unless the context requires otherwise, the words “we,” “us,” “our” and “SafeNet” refer to SafeNet, Inc. and its consolidated subsidiaries prior to the reorganization and refer to SafeNet Holding Corporation and its consolidated subsidiaries following the reorganization.
SAFENET HOLDING CORPORATION
Overview
SafeNet is a leading provider of high-end data protection solutions to both commercial enterprises and government agencies. Customers trust our comprehensive and flexible solutions to protect their most valuable information assets, including electronic banking transfers, personally identifiable information, electronic medical records, software and intellectual property assets and classified information that is critical for national security. We combine leading-edge commercial technologies with the expertise and credibility developed through our long-standing leadership in the government sector. We offer a lifecycle approach to data protection that:
| • | protects the identities of users, applications and machines; |
| • | secures transactions that are performed by authenticated users; |
| • | encrypts data when it is created and while it is accessed, shared, stored and moved; |
| • | encrypts the communications channels through which data travels; |
| • | controls users’ rights to access software and digital assets; and |
| • | includes management solutions that enable our products to work together. |
We were founded in 1983 and have developed our core encryption and data protection technology into comprehensive and integrated solutions focused on the protection of high-value information assets. Many of our products are certified to the highest security standards. We have established a global channel of resellers, original equipment manufacturers, or OEMs, value-added resellers, or VARs, systems integrators and application and solution providers that provide us extensive geographic reach across multiple commercial verticals.
In 2007 (Predecessor Period)*, 2007 (Successor Period)*, 2008, 2009 and the first nine months of 2010, our total revenue was $73.8 million*, $226.4 million*, $329.0 million, $403.7 million and $334.1 million; our net loss was $50.8 million*, $37.3 million*, $126.5 million, $49.7 million and $8.7 million and our adjusted EBITDA was $(1.0) million*, $41.4 million*, $57.5 million, $85.9 million and $69.3 million. Adjusted EBITDA is not a recognized presentation under accounting principles generally accepted in the United States, or GAAP. For an explanation of the elements of adjusted EBITDA and a full reconciliation of adjusted EBITDA to net loss, the most directly comparable GAAP measure, see “—Summary Historical Financial Data—Definition of Adjusted EBITDA” and “—Summary Historical Financial Data—Definition of Adjusted EBITDA—Reconciliation of Adjusted EBITDA to Net Loss.”
| * | Our consolidated statement of operations data for the calendar year ended December 31, 2007 reflects our activity in both the Predecessor Period during the year (January 1, 2007 to April 11, 2007) and Successor Period during that year (April 12, 2007 to December 31, 2007). For further information on this presentation, see “Management’s Discussion and Analysis of Financial Condition and Results of Operations—Presentation of Financial Statements—Predecessor and Successor Entities.” |
1
Table of Contents
Industry Background
Several key trends are driving the need for high-end data protection solutions.
Proliferation of digital data and increase in high-value digital assets and transactions. Organizations are experiencing an unprecedented and sustained growth in digital assets and electronic transactions, which involves increasingly valuable information such as financial transactions, corporate, state and national security secrets, intellectual property and personal information.
Organizational deployment of new technologies has led to increased vulnerabilities. Innovations in technology have changed the ways in which organizations create, use, store and move their valuable information assets. As organizations deploy new technologies to increase productivity, they also introduce additional security and compliance risks and increase the vulnerability of valuable digital information and assets. Several examples include the increased use of:
| • | collaboration within and across organizations; |
| • | extended enterprise and workforce mobility resources; |
| • | virtualization and cloud computing; |
| • | consumer technologies and personal devices in information technology environments; and |
| • | software-as-a-service, or SaaS. |
Security threats are becoming more frequent, sophisticated and severe. There has been a significant increase in frequency, sophistication and severity of threats, originating inside and beyond an organization’s perimeter, that can compromise national security and lead to severe reputational and financial loss for organizations.
Cyber security has become a top government priority. Cyber security has become a top priority of the U.S. government as cyber attacks on the federal government have increased in volume and sophistication. Such attacks could be catastrophic to national security, defense, financial systems and critical infrastructure.
Government regulations, industry standards and internal risk management policies mandate increased protection of data. Governments are enacting legislation to ensure that individuals and organizations are informed of and protected from losses due to data breaches. In addition, organizations are increasingly implementing internal compliance policies to ensure that their data and underlying information technology, or IT, infrastructure remain protected yet available to authorized users.
The market opportunity for protecting digital assets is large. As organizations continue to increase their spending to protect their high-value digital assets, a large market opportunity has developed for high-end data security solutions. This opportunity includes portions of the broader IT, security, software rights management and government cyber security markets.
Traditional approaches are insufficient for comprehensive data protection. As a result of these trends, there is an increasing need to protect data throughout its lifecycle, which includes establishing the identities of users, applications and machines, verifying electronic transactions, and securing the access, storage, sharing and movement of data. As protection evolves, there is also an increasing need for integrated management systems to coordinate protection across these lifecycle processes. Current solutions are a combination of network perimeter defenses that do not provide comprehensive security and control and point security solutions that do not protect high-value information throughout its lifecycle.
2
Table of Contents
Our Competitive Strengths
We believe our products and services address the increased security challenges that organizations face with respect to their digital assets and the limitations associated with existing security solutions. Our product families provide persistent protection with integrated, centralized management designed to protect the digital information throughout its lifecycle. Our competitive strengths include:
| • | Comprehensive lifecycle approach to data security. Our products provide persistent data-centric protection throughout the data lifecycle. We protect the identities of users, applications and machines, the transactions they perform and the data as it is created, accessed, shared, stored, moved and used, both within and beyond the organization’s network. We believe that this comprehensive lifecycle approach to data security differentiates us from our competitors. |
| • | Proven solutions trusted by customers to protect their most valuable information assets. We have highly sophisticated customers that trust us to protect their most valuable information assets, such as classified information that is critical for national security, electronic banking transfers, proprietary corporate data, personally identifiable information, electronic medical records, software and intellectual property assets. Many of our products have achieved global certifications such as Common Criteria and governmental certifications such as those under the U.S. Federal Information Processing Standard, or FIPS, and National Security Agency Type 1, or Type 1. |
| • | Security solutions engineered to evolve with business needs. Our data-centric security solutions are based on an extensible data protection architecture that is engineered to be adaptable to changing security threats, technologies, business requirements and compliance mandates. Our solutions are modular and integrate with other products and applications in heterogeneous IT environments. This enables customers to leverage existing infrastructure and increase their data security, starting with a single product for a specific use-case and expanding to incorporate additional products and solutions as their security needs evolve. |
| • | Combining the best in commercial and government security. Due to our significant presence in both commercial enterprises and the government sector, we are well positioned to combine leading-edge commercial technologies with the expertise and credibility that we have developed through our leadership in the government sector. |
| • | Highly experienced team with significant security expertise. Our management team has 300 years of combined security and technology industry experience; our sales teams are comprised of subject matter experts; our products are engineered by a world-class research and development organization of over 550 security engineers; and over 300 of our employees hold security clearances. |
We believe that the combination of these strengths creates a significant competitive advantage.
Our Growth Strategy
Our objective is to be the leading provider of comprehensive data protection solutions that protect high-value information throughout its lifecycle. The following are key elements of our strategy:
| • | Continue to develop innovative high-end data protection solutions. We intend to leverage our proven development capabilities and expertise from government and commercial sectors to develop new security technologies that broaden our protection footprint by creating more secure, adaptive and comprehensive solutions. |
| • | Broaden our global distribution by continuing to expand our channel networks and other relationships. We intend to strengthen our existing channel by establishing new product reseller and distribution partnerships that will enable us to extend our customer reach and to target new verticals and geographic regions. |
3
Table of Contents
| • | Continue to increase our sales to new commercial and government customers. We plan to continue to invest in our direct sales force and to leverage our existing global solution partners and channel sales organizations to drive additional sales to new customers. |
| • | Further expand sales into our existing large customer base. We intend to extend our leadership within the U.S. government and the commercial sector by advancing new use cases to our existing customer base and selling new products. |
| • | Capture near term opportunities related to government cyber security initiatives and cloud computing deployments. We intend to continue to focus our resources on capturing increases in spending by our government customers on cyber security related projects and new and existing customers on evolving their IT infrastructure to shared computing environments. |
| • | Pursue selective acquisitions. We have a successful track record of making and integrating acquisitions over time, and intend to continue to pursue selective acquisitions that we expect will enhance our competitive position and financial performance. |
Our Products and Solutions
Our comprehensive and flexible data protection solutions include the following product family portfolios:
| • | Identity protection. We offer our customers identity protection tools that enable them to manage access rights to sensitive information. Our products in this area include USB authenticators, smart cards, one-time-password authenticators and software/mobile authenticators. |
| • | Transaction protection. Our transaction protection solutions provide our commercial enterprise and government customers with a fast, secure and easy way to integrate application and transaction security. Our products in this area include our Luna family of hardware security modules, or HSMs. |
| • | Data encryption and control. Our data encryption and control solutions provide our customers with a unified platform that delivers adaptive data protection and control for information assets. Our products in this area include our DataSecure data center and endpoint product suites. |
| • | Communication protection. We offer high-speed encryptor solutions that combine the highest levels of performance and integrated management capability. Our products in this area include our ethernet and synchronous optical networking encryptors. |
| • | Software rights management. We offer an integrated enforcement and management platform for software licenses and entitlements that has been designed to support a variety of deployment and licensing models. Our products in this area include our Sentinel line of products. |
Finally, each of our comprehensive data protection solutions has a management product through which an authorized administrator provisions, manages and controls deployments across the respective product families.
Our Customers
We serve more than 25,000 customers across both commercial enterprises and government agencies and in over 100 countries. Examples of customer uses of our products and solutions include:
| • | a major global interbank network using our HSMs, authenticators and high-speed encryptors to protect its communications and financial transactions; |
| • | a large government agency using our data encryption product suites to share data with other agencies and outside parties; |
4
Table of Contents
| • | a prominent global airline using our DataSecure family of products to enable compliance with standards for protecting its customers’ personally identifiable information; and |
| • | a leading European-based software provider using our Sentinel solutions to manage licenses for its solutions. |
Risks Related to Our Business
Investing in our common stock involves risk. You should carefully consider all the information in this prospectus prior to investing in our common stock. These risks are discussed more fully in the section entitled “Risk Factors” immediately following this prospectus summary. These risks and uncertainties include, but are not limited to, the following:
| • | our business depends in significant part on sales to U.S. government agencies and changes in U.S. government fiscal policies and appropriations could have a material adverse effect on our business; |
| • | losses, delays or reductions in scope of our primary customer relationships will materially reduce our revenue and profitability; |
| • | we face intense competition in our market, both from larger, better-known companies and more targeted competitors; |
| • | if functionality similar to that offered by our products is incorporated into existing infrastructure products, organizations may decide against adding our solutions to their IT networks; |
| • | defects or vulnerabilities in our products or the failure of our products to adequately prevent a security breach or protect software assets could harm our reputation and divert resources; and |
| • | if we do not accurately predict, prepare for and respond promptly to technological and market developments and changing end-customer needs and develop corresponding products, our competitive position and prospects will be harmed. |
Recent Developments
Acquisition by an Affiliate of Vector Capital
Prior to April 2007, our predecessor entity was a publicly traded company on the Nasdaq Global Market. In April 2007, we were acquired by Vector Stealth Holdings II, L.L.C., or Vector Stealth, a Delaware limited liability company and an affiliate of Vector Capital, a San Francisco-based private equity investment firm specializing in the technology sector. We were acquired through a tender offer consisting principally of $613.2 million paid to purchase all outstanding shares of the common stock of our predecessor entity, $23.4 million paid to the holders of stock options and $1.5 million in equity interests in Vector Stealth issued in lieu of cash for certain outstanding stock options. The transaction was funded by $225.0 million in cash from Vector Stealth as well as through our incurrence of $375.0 million in debt financing in addition to cash on hand. Upon completion of the tender offer, we became a wholly-owned subsidiary of Vector Stealth, and the acquired shares of our predecessor entity were cancelled. As a result of this going private transaction, we ceased to be a public reporting company in 2007.
As a private company, we began a series of steps to improve our growth, profitability and internal controls. Included in these actions were changes in our board of directors and management personnel, including reconstituting our board such that all of our board members have joined our board since 2007, and the appointment of a new chief executive officer in July 2009, a new chief financial officer in October 2009, and a new senior vice president and general counsel in February 2010. In 2009, we began implementation of a new enterprise resource planning system to further improve our efficiency and internal controls.
5
Table of Contents
Strategic Repositioning
As a private company, we made a series of strategic acquisitions and divestitures that enhanced our competitive position. In 2008, we acquired Ingrian Networks, Inc., an enterprise data protection and privacy solutions provider. In 2009, we acquired Assured Decisions, LLC, a cyber security consultancy and provider of high-value solutions for securely sharing confidential information across government agencies.
Most notable among our recent activity was the acquisition on March 24, 2009 of Aladdin Knowledge Systems Ltd., or Aladdin, a developer of data security and software rights management solutions, by an entity affiliated with Vector Capital. Vector Capital placed Aladdin under common control with us at that time. On March 31, 2010, we formally acquired the entity that had acquired Aladdin, which resulted in Aladdin becoming a wholly owned subsidiary of SafeNet, Inc. Combining the two companies enhanced our presence in our target markets, increased our geographic diversity, expanded our reseller and distribution channels and improved operating efficiencies through the reduction or elimination of overlapping products and functions.
In 2009, we divested MediaSentry, which provided network monitoring for copyright enforcement. In 2010, we divested assets of our Embedded Solutions Division product line that we marketed to network equipment manufacturers, ASIC vendors and mobile device providers.
Through these acquisitions and divestitures, we have focused our business on providing integrated high-end data protection solutions that address data security throughout its lifecycle. We unified our marketing and sales focus and targeted our development efforts on the most valuable assets in our portfolio.
Company Information
We were incorporated in 2010 as a Delaware corporation and on June 30, 2010 became a holding company for SafeNet, Inc., a company that was formed in 1983 as a Delaware corporation. As of October 1, 2010, SafeNet, Inc. employed 1,707 people in 24 countries. Our headquarters are located at 4690 Millennium Drive, Belcamp, Maryland 21017 and our telephone number is (410) 931-7500. You can access our Web site at www.safenet-inc.com. Information contained on our Web site is not part of this prospectus and is not incorporated in this prospectus by reference.
Corporate Reorganization
Prior to and following June 30, 2010, we have conducted our business through SafeNet, Inc. and its subsidiaries. SafeNet, Inc. was most recently a wholly owned subsidiary of Vector Stealth, a Delaware limited liability company and an affiliate of Vector Capital. Vector Stealth held no material assets other than SafeNet, Inc. and does not engage in any business operations. Pursuant to the terms of our recent corporate reorganization that was completed on June 30, 2010. Vector Stealth exchanged all of its ownership interest in SafeNet, Inc. for a 100% interest in SafeNet Holding Corporation. As a result of this reorganization, SafeNet, Inc. is wholly owned by SafeNet Holding Corporation, and SafeNet Holding Corporation is wholly owned by Vector Stealth. Certain of our executive officers hold economic interests in Vector Stealth. See “Certain Relationships and Related Person Transactions—Vector Stealth Unit Award Agreements.”
The corporate reorganization does not affect our operations, which we continue to conduct through SafeNet, Inc. and its consolidated subsidiaries, including Aladdin.
6
Table of Contents
Effects of the Proposed Public Offering
The following diagram provides a summary illustration of our ownership and organizational structure immediately before and after giving effect to this offering:
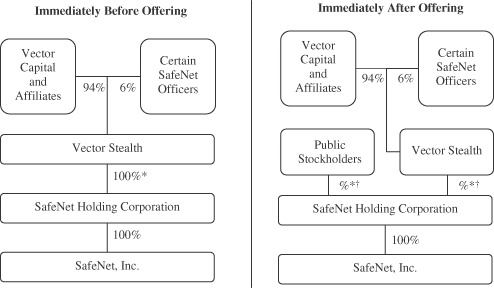
| * | Percentages calculated excluding the effects of outstanding compensatory stock options to purchase shares of our common stock, which will amount to approximately % of our fully diluted shares following this offering. |
| † | Percentages give effect to the sale of shares of common stock by us and the selling stockholder in this offering based on the amount of shares expected to be sold by us and the selling stockholder as indicated on the front cover of this prospectus (excluding the exercise of any over allotment option held by the underwriters). |
As indicated in the diagram above, immediately prior to this offering, Vector Capital and its affiliates hold approximately 94% of the total equity interests of Vector Stealth, which entity in turn holds all of the outstanding common stock in SafeNet Holding Corporation. After this offering, assuming the sale of shares of common stock by us and Vector Stealth in this offering based on the amount of shares expected to be sold as indicated on the front cover of this prospectus (excluding the exercise of any over allotment option held by the underwriters), Vector Stealth will own approximately shares, or approximately %, of our outstanding common stock. As the selling stockholder, Vector Stealth will receive net proceeds of approximately $ million from the sale of shares offered by it in this offering (excluding the exercise of any over allotment option held by the underwriters), after deducting the underwriting discounts and commissions and estimated offering expenses and based on an assumed initial public offering price of $ per share, the mid-point of the range on the front cover of this prospectus.
In addition, prior to the completion of this offering, we and Vector Stealth will enter into a stockholders’ agreement related to a number of board of director, stockholder and related governance matters. Such stockholders’ agreement will provide that Vector Stealth will have the right to designate a majority of the director nominees to our board of directors, subject to their beneficial ownership of at least 40% or more of the total outstanding shares of our capital stock. Vector will continue to have a right to designate director nominees to our board of directors to a lesser degree if their ownership percentage is between 7.5% and 40% of the total outstanding shares of our capital stock. In addition, stockholders will only be allowed to remove directors for
7
Table of Contents
cause, and our board of directors shall designate appointees to fill vacancies (subject to Vector Stealth’s rights to designate members of our board of directors). Furthermore, such stockholders’ agreement will also provide that the following actions by us or any of our subsidiaries require the approval of Vector Stealth for so long as Vector Stealth owns at least 30% or more of our outstanding shares of common stock: (1) termination of our chief executive officer; (2) consummation of a change of control transaction; (3) entering into any agreement providing for acquisitions or divestitures for aggregate consideration in excess of the greater of (i) $50.0 million or (ii) 7.5% of our market capitalization (as determined at the end of each fiscal quarter); and (4) the incurrence of debt (excluding working capital revolvers and the refinancing of any then existing debt) of greater than $50.0 million in excess of our existing indebtedness following the application of proceeds from this offering to the repayment of all or a portion of our debt.
As further described in the section titled “Certain Relationships and Related Person Transactions—Transactions and Relationships with Directors, Officers and 5% Stockholders—Transactions and Relationships with Vector Stealth and its Affiliates—Management Services Agreement,” we are subject to a management services agreement with Vector Capital. Such agreement will terminate upon completion of this offering, and we will be required to pay a termination fee of up to $12 million in connection with the termination.
Finally, as more fully described in “Use of Proceeds,” upon consummation of the offering, we currently intend to use a portion of the net proceeds of the offering to repay a portion of the amounts outstanding under our senior secured credit facilities. Upon the consummation of the offering and application of the net proceeds as described above, we currently intend to repay a portion of our outstanding borrowings under the term loan portion of our first lien credit agreement and to repay in full all of our outstanding borrowings under our second lien credit agreement and to terminate the second lien credit agreement. As more fully described in “Certain Relationships and Related Person Transactions—Transactions and Relationships with Directors, Officers and 5% Stockholders—Transactions and Relationships with Vector Stealth and its Affiliates—Term Loan,” an affiliate of Vector Stealth holds approximately $2.5 million in face value of the second lien debt, of which a total of approximately $131.0 million was outstanding on September 30, 2010. Upon consummation of the offering and application of the net proceeds as described above, we currently intend for the portion of the second lien debt held by such affiliate of Vector Stealth to be repaid in full together with the other second lien debt.
About Vector Capital
Vector Capital is a leading global private equity firm specializing in spinouts, buyouts and recapitalizations of established technology businesses in both the private and public capital markets. Vector Capital strives to actively partner with management teams to develop and execute new financial and business strategies designed to materially improve the competitive standing of those businesses and enhance value for employees, customers and stockholders.
8
Table of Contents
THE OFFERING
| Common stock offered by us |
shares |
| Common stock offered by the selling stockholder |
shares |
| Total common stock offered |
shares |
| Common stock outstanding after this offering |
shares |
| Use of proceeds |
We estimate that we will receive net proceeds of approximately $ million from the sale of the shares offered by us in this offering, after deducting the underwriting discounts and commissions and estimated offering expenses payable by us. We intend to use the net proceeds received by us in connection with this offering for the following purposes and in the following amounts: |
| • | approximately $ million will be used to repay a portion of the amount outstanding under our senior secured credit arrangements, a portion of which is held by an affiliate of Vector Stealth; however, the selection of which indebtedness obligations, the amounts to be repaid with respect to these specific indebtedness obligations, the timing of repayment and the particular method by which we effect repayment, have not yet been determined and will depend, among other things, on market conditions; |
| • | approximately $ million will be paid to Vector Capital Partners III, L.P., an affiliate of Vector Stealth, in connection with the termination of our management services agreement pursuant to its terms; and |
| • | the remainder for general corporate purposes, including working capital and capital expenditures. We may also use a portion of the proceeds for expansion of our current business through acquisitions or investments in other complementary businesses, products or technologies; however, we do not have commitments for any acquisitions at this time. |
We will not receive any proceeds from the sale of shares by the selling stockholder, including from sales of its shares in the event that the underwriters exercise their option to purchase an additional shares of our common stock from the selling stockholder. See “Use of Proceeds” and “Certain Relationships and Related Person Transactions—Transactions and Relationships with Vector Stealth and its Affiliates.”
| Proposed NASDAQ Global Market symbol |
SAFE |
| Risk factors |
See “Risk Factors” and other information included in this prospectus for a discussion of factors you should carefully consider before deciding to invest in shares of our common stock. |
9
Table of Contents
The number of shares of common stock that will be outstanding after this offering is based on the number of shares outstanding as of , 2010. This number:
| • | assumes that the underwriters will not exercise their option to purchase additional shares; |
| • | excludes shares of common stock issuable upon exercise of options outstanding at a weighted-average exercise price of $ per share under our 2007 Equity Plan; and |
| • | excludes shares of common stock reserved for future issuance under our 2010 Equity Incentive Plan. |
Unless otherwise indicated, all information in this prospectus assumes no exercise by the underwriters of their option in this offering to purchase additional shares to cover over-allotments.
10
Table of Contents
SUMMARY HISTORICAL FINANCIAL DATA
You should read the summary historical financial data set forth below in conjunction with our consolidated financial statements, the notes to our consolidated financial statements and “Management’s Discussion and Analysis of Financial Condition and Results of Operations” contained elsewhere in this prospectus.
Pursuant to our acquisition on April 12, 2007 by Vector Stealth, our consolidated financial statements and notes included elsewhere and referenced in this prospectus present information relating to both a “Successor” and “Predecessor” entity. We refer to the period prior to April 12, 2007 as the “Predecessor Period” and the period from April 12, 2007 as the “Successor Period.” The historical financial data for the years ended December 31, 2007, 2008 and 2009 have been derived from our audited consolidated financial statements that are included elsewhere in this prospectus. The historical financial data as of September 30, 2010 and for the nine months ended September 30, 2009 and 2010 have been derived from our unaudited interim consolidated financial statements included elsewhere in this prospectus. We have prepared this unaudited financial information on the same basis as the audited consolidated financial statements and have included all adjustments, consisting only of normal recurring adjustments, that we consider necessary for a fair presentation of our financial position and operating results for such period. Our historical results are not necessarily indicative of results to be expected for future periods. Results for the nine months ended September 30, 2010 are not necessarily indicative of results expected for the full year.
11
Table of Contents
| Predecessor Period | Successor Period | |||||||||||||||||||||||||||
| Period from January 1, 2007 to April 11, 2007 |
Period from April 12, 2007 to December 31, 2007 |
Year Ended December 31, |
Nine Months Ended September 30, |
|||||||||||||||||||||||||
| 2008 | 2009 | 2009 | 2010 | |||||||||||||||||||||||||
| (unaudited) | ||||||||||||||||||||||||||||
| (dollars in millions, except per share data) | ||||||||||||||||||||||||||||
| Consolidated Statement of Operations Data: |
||||||||||||||||||||||||||||
| Revenues: |
||||||||||||||||||||||||||||
| Products |
$ | 63.7 | $ | 197.2 | $ | 283.6 | $ | 348.7 | $ | 254.6 | $ | 283.9 | ||||||||||||||||
| Service and maintenance |
10.1 | 29.2 | 45.4 | 55.0 | 39.3 | 50.2 | ||||||||||||||||||||||
| Total revenues |
73.8 | 226.4 | 329.0 | 403.7 | 293.9 | 334.1 | ||||||||||||||||||||||
| Costs of revenues: |
||||||||||||||||||||||||||||
| Products (excluding amortization and impairment of intangible assets) |
34.1 | 91.1 | 128.7 | 141.9 | 105.5 | 117.6 | ||||||||||||||||||||||
| Service and maintenance (excluding amortization and impairment of intangible assets) |
2.5 | 7.1 | 11.5 | 10.4 | 7.7 | 10.3 | ||||||||||||||||||||||
| Amortization and impairment of intangible assets |
3.7 | 26.4 | 117.2 | 31.9 | 23.7 | 24.6 | ||||||||||||||||||||||
| Total cost of revenues |
40.3 | 124.6 | 257.4 | 184.2 | 136.9 | 152.5 | ||||||||||||||||||||||
| Gross profit |
33.5 | 101.8 | 71.6 | 219.5 | 157.0 | 181.6 | ||||||||||||||||||||||
| Operating expenses: |
||||||||||||||||||||||||||||
| Research and development expenses |
19.3 | 34.0 | 47.9 | 60.6 | 47.5 | 45.4 | ||||||||||||||||||||||
| Sales and marketing expenses |
21.6 | 35.3 | 56.6 | 81.5 | 57.5 | 70.9 | ||||||||||||||||||||||
| General and administrative expenses |
41.1 | 33.8 | 47.2 | 56.0 | 42.7 | 40.3 | ||||||||||||||||||||||
| Class action settlement |
— | — | — | 25.0 | — | — | ||||||||||||||||||||||
| Amortization of intangible assets |
1.9 | 5.1 | 6.8 | 10.4 | 7.6 | 7.5 | ||||||||||||||||||||||
| Impairment of goodwill |
— | — | 42.9 | — | — | — | ||||||||||||||||||||||
| Loss on sale of business and net assets held for sale |
— | — | — | 2.5 | 1.5 | 0.7 | ||||||||||||||||||||||
| Restructuring expenses |
— | — | — | 5.5 | 3.1 | 0.2 | ||||||||||||||||||||||
| Operating (loss) income |
(50.4 | ) | (6.4 | ) | (129.8 | ) | (22.0 | ) | (2.9 | ) | 16.6 | |||||||||||||||||
| Foreign exchange (loss) gain |
(0.3 | ) | — | (2.5 | ) | (0.9 | ) | (0.8 | ) | 0.6 | ||||||||||||||||||
| Interest income (expense), net |
0.9 | (24.1 | ) | (34.2 | ) | (30.3 | ) | (23.0 | ) | (21.9 | ) | |||||||||||||||||
| Other income (expense), net |
— | 0.2 | 0.8 | 2.6 | 2.5 | (0.4 | ) | |||||||||||||||||||||
| (Loss) before income taxes |
(49.8 | ) | (30.3 | ) | (165.7 | ) | (50.6 | ) | (24.2 | ) | (5.1 | ) | ||||||||||||||||
| Income tax expense (benefit) |
1.0 | 7.0 | (39.2 | ) | (0.9 | ) | 0.1 | 3.6 | ||||||||||||||||||||
| Net (loss) |
$ | (50.8 | ) | $ | (37.3 | ) | $ | (126.5 | ) | $ | (49.7 | ) | $ | (24.3 | ) | $ | (8.7 | ) | ||||||||||
| Net loss per common share: |
||||||||||||||||||||||||||||
| Basic and diluted |
$ | (2.41 | ) | $ | (0.41 | ) | $ | (1.10 | ) | $ | (0.34 | ) | $ | (0.16 | ) | $ | (0.06 | ) | ||||||||||
| Weighted average common shares outstanding (in thousands): |
||||||||||||||||||||||||||||
| Basic and diluted |
21,107 | 90,505 | 115,233 | 147,877 | 147,877 | 150,991 | ||||||||||||||||||||||
12
Table of Contents
The following table sets forth summary unaudited consolidated balance sheet data as of September 30, 2010 and as adjusted to give effect to the issuance of common stock in this offering at an assumed initial public offering price of $ per share, the midpoint of the range on the front cover of this prospectus, and application of proceeds from the offering as described in “Use of Proceeds.” The unaudited as adjusted consolidated balance sheet data is presented for informational purposes only and does not purport to represent what our consolidated financial position actually would have been had the transactions reflected occurred on the date indicated or to project our financial condition as of any future date or results of operations for any future period.
| September 30, 2010 | ||||||||
| Actual | As Adjusted(1) |
|||||||
| (unaudited) | ||||||||
| (in millions) | ||||||||
| Consolidated Balance Sheet Data: |
||||||||
| Cash and cash equivalents |
$ | 43.5 | $ | |||||
| Total current assets |
179.9 | |||||||
| Total assets |
726.8 | |||||||
| Total current liabilities |
157.4 | |||||||
| Long-term obligations |
370.4 | |||||||
| Total stockholder’s equity |
127.9 | |||||||
| (1) | Each $1.00 increase or decrease in the assumed initial public offering price of $ per share, the midpoint of the price range set forth on the front cover of this prospectus, would increase or decrease, as applicable, our as adjusted cash, cash equivalents and short-term investments, total current assets, total assets and stockholders’ equity by approximately $ million, assuming that the number of shares offered by us, as set forth on the cover page of this prospectus, remains the same and after deducting the estimated underwriting discounts and commissions and estimated offering expenses payable by us. |
The following table sets forth a number of key financial metrics that we believe are helpful in evaluating growth trends, measuring the effectiveness and efficiency of our operations and gauging our cash generation.
| Predecessor Period* |
Successor Period* | |||||||||||||||||||||||
| Period from January 1, 2007 to April 11, 2007 |
Period from April 12, 2007 to December 31, 2007 |
Year Ended December 31, |
Nine Months Ended September 30, |
|||||||||||||||||||||
| 2008 | 2009 | 2009 | 2010 | |||||||||||||||||||||
| (unaudited) | ||||||||||||||||||||||||
| (dollars in millions) | ||||||||||||||||||||||||
| Products revenues |
$ | 63.7 | $ | 197.2 | $ | 283.6 | $ | 348.7 | $ | 254.6 | $ | 283.9 | ||||||||||||
| Service and maintenance revenues |
$ | 10.1 | $ | 29.2 | $ | 45.4 | $ | 55.0 | $ | 39.3 | $ | 50.2 | ||||||||||||
| Total revenue |
$ | 73.8 | $ | 226.4 | $ | 329.0 | $ | 403.7 | $ | 293.9 | $ | 334.1 | ||||||||||||
| Gross profit margin of products revenues (excluding amortization and impairment of intangible assets)† |
46.4 | % | 53.8 | % | 54.6 | % | 59.3 | % | 58.5 | % | 58.6 | % | ||||||||||||
| Gross profit margin of service and maintenance revenues (excluding amortization and impairment of intangible assets)† |
75.2 | % | 75.9 | % | 74.7 | % | 81.1 | % | 80.4 | % | 79.5 | % | ||||||||||||
| Total gross profit margin |
45.4 | % | 45.0 | % | 21.8 | % | 54.4 | % | 53.4 | % | 54.3 | % | ||||||||||||
| Operating expenses |
$ | 83.9 | 108.2 | $ | 201.4 | $ | 241.5 | $ | 159.9 | $ | 165.0 | |||||||||||||
| Operating (loss) income |
$ | (50.4 | ) | $ | (6.4 | ) | $ | (129.8 | ) | $ | (22.0 | ) | $ | (2.9 | ) | $ | 16.6 | |||||||
| Net cash provided by (used in) operating activities |
$ | 1.4 | 18.2 | $ | 8.0 | $ | 17.5 | $ | 2.9 | $ | 38.5 | |||||||||||||
| Adjusted EBITDA |
$ | (1.0 | ) | $ | 41.4 | $ | 57.5 | $ | 85.9 | $ | 58.4 | $ | 69.3 | |||||||||||
13
Table of Contents
| * | Key financial metrics for the calendar year ended December 31, 2007 reflect our activity in both the Predecessor Period and Successor Period during that year. For further information on this presentation, see “Management’s Discussion and Analysis of Financial Condition and Results of Operations—Presentation of Financial Statements—Predecessor and Successor Entities.” |
| † | For further discussion of our presentation of gross profit margin, including by products revenues (excluding amortization and impairment of intangible assets) and service and maintenance revenues (excluding amortization and impairment of intangible assets), see “Management’s Discussion and Analysis of Financial Condition and Results of Operations—Components of Operations—Gross Profit and Gross Profit Margins.” |
Definition of Adjusted EBITDA
We define adjusted EBITDA as net income (loss), calculated in accordance with GAAP, plus: (i) interest (income) expense, net; (ii) income tax (benefit) expense; (iii) depreciation; (iv) amortization of acquired intangible assets; (v) impairment of acquired intangible assets and goodwill; (vi) stock-based compensation expense; (vii) transaction costs related to acquisitions; (viii) purchase accounting adjustments; (ix) restructuring expenses; (x) principal stockholder management fees; (xi) investigation and restatement related charges; and (xii) costs and benefits of litigation settlements.
Adjusted EBITDA is a performance measure that is not calculated in accordance with GAAP. The table immediately following this discussion provides a reconciliation of this non-GAAP measure to net loss, the most directly comparable measure calculated and presented in accordance with GAAP. Adjusted EBITDA should not be considered as an alternative to net income, income from operations or any other measure of financial performance calculated and presented in accordance with GAAP. Our adjusted EBITDA may not be comparable to similarly titled measures of other companies because other companies may not calculate adjusted EBITDA or similarly titled measures in the same manner as we do. We prepare adjusted EBITDA to eliminate the impact of items that we do not consider indicative of our core operating performance. We encourage you to evaluate these adjustments, the reasons we consider them appropriate and the material limitations of adjusted EBITDA as described in “Management’s Discussion and Analysis of Results of Operations and Financial Condition—Key Metrics—Definition of Adjusted EBITDA—Material Limitations of Adjusted EBITDA.”
Our management uses adjusted EBITDA:
| • | as a measure of operating performance; |
| • | as a factor when determining management’s compensation; |
| • | for planning purposes, including the preparation of our annual operating budget; |
| • | to allocate resources of our business; and |
| • | to evaluate the effectiveness of our business strategies. |
We believe that the use of adjusted EBITDA provides consistency and comparability with our past financial performance and facilitates period to period comparisons of our operating results by management and investors. Although calculation of adjusted EBITDA may vary from company to company, our detailed presentation may facilitate analysis and comparison of our operating results by management and investors with other peer companies, many of which use similar non-GAAP financial measures to supplement their GAAP results in their public disclosures.
14
Table of Contents
Reconciliation of Adjusted EBITDA to Net Loss
The following table presents a reconciliation of adjusted EBITDA to net loss, the most comparable GAAP measure, for each of the periods identified.
| (in millions, unaudited*) | ||||||||||||||||||||||||
| Predecessor Period** |
Successor Period** | |||||||||||||||||||||||
| Period from January 1, 2007 to April 11, 2007 |
Period from April 12, 2007 to December 31, 2007 |
Year Ended December 31, |
Nine Months Ended September 30, |
|||||||||||||||||||||
| 2008 | 2009 | 2009 | 2010 | |||||||||||||||||||||
| Net (loss) |
$ | (50.8 | ) | $ | (37.3 | ) | $ | (126.5 | ) | $ | (49.7 | ) | $ | (24.3 | ) | $ | (8.7 | ) | ||||||
| Interest (income) expense, net |
(0.9 | ) | |
24.1 |
|
34.2 | 30.3 | |
23.0 |
|
|
21.9 |
| |||||||||||
| Income tax expense (benefit) |
1.0 | |
7.0 |
|
(39.2 | ) | (0.9 | ) | |
0.1 |
|
|
3.6 |
| ||||||||||
| Depreciation expense |
1.9 | |
5.0 |
|
6.9 | 8.5 | |
6.2 |
|
|
6.9 |
| ||||||||||||
| Amortization of acquired intangibles |
5.6 | |
31.5 |
|
41.9 | 42.3 | |
31.2 |
|
|
32.1 |
| ||||||||||||
| Impairment of acquired intangibles and goodwill |
— | — | 125.0 | — | |
— |
|
|
— |
| ||||||||||||||
| Stock-based compensation expense |
23.8 | |
0.1 |
|
2.4 | 1.2 | |
0.9 |
|
|
2.9 |
| ||||||||||||
| Transaction costs related to acquisitions and divestitures |
14.0 | 1.2 | 3.9 | 6.1 | |
5.2 |
|
|
1.3 |
| ||||||||||||||
| Purchase accounting adjustments |
— | |
3.6 |
|
1.7 | 9.1 | |
6.6 |
|
|
2.5 |
| ||||||||||||
| Restructuring expense |
— | — | — | 5.5 | |
3.1 |
|
|
0.2 |
| ||||||||||||||
| Management fees |
— | |
1.4 |
|
2.0 | 2.5 | |
1.8 |
|
|
1.8 |
| ||||||||||||
| Investigation and restatement related charges |
4.4 | |
3.6 |
|
5.2 | 6.0 | |
4.6 |
|
|
6.0 |
| ||||||||||||
| Costs (benefits) of litigation settlements |
— | |
1.2 |
|
— | 25.0 | |
— |
|
|
(1.2 |
) | ||||||||||||
| Adjusted EBITDA |
$ | (1.0 | ) | $ | 41.4 | $ | 57.5 | $ | 85.9 | $ | 58.4 | $ | 69.3 | |||||||||||
| * | The amounts indicated are unaudited other than the net loss for the Predecessor Period of 2007, Successor Period of 2007 and years ended December 31, 2008 and 2009. |
| ** | Our results of operations for the calendar year ended December 31, 2007 reflect our activity in both the Predecessor Period and Successor Period during that year. For further information on this presentation, see “Management’s Discussion and Analysis of Financial Condition and Results of Operations—Presentation of Financial Statements—Predecessor and Successor Entities.” |
15
Table of Contents
An investment in our common stock offered by this prospectus involves a substantial risk of loss. You should carefully consider these risk factors, together with all of the other information included in this prospectus, before you decide to purchase shares of our common stock. The occurrence of any of the following risks could materially adversely affect our business, financial condition or operating results. In that case, the trading price of our common stock could decline, and you may lose part or all of your investment.
Risks Related to Our Business and Our Technologies
Our business depends in significant part on sales to U.S. government agencies, and changes in U.S. government fiscal policies could have a material adverse effect on our business.
We have historically derived, and expect to continue to derive, a significant portion of our revenues from sales to agencies of the U.S. federal government, either directly by us or through systems integrators and other resellers, and we believe that the success and growth of our business will continue to depend on successful procurement of government business. For example, approximately 50%, 43% and 39% of our revenue in the years ended December 31, 2008 and 2009 and the nine months ended September 30, 2010 was derived from our direct or indirect sales to agencies, offices and departments of the U.S. federal government, of which the substantial majority was to the Department of Defense. Some or all of the following could cause government agencies to delay or refrain from purchasing products and services that we offer in the future or otherwise have an adverse effect on our business, financial condition and results of operations:
| • | changes in fiscal or contracting policies or decreases in available government funding; |
| • | changes in government programs or applicable requirements; |
| • | changes in the competitive landscape for government contracting; |
| • | the adoption of new laws or regulations or changes to existing laws or regulations; |
| • | potential delays or changes in the government appropriations process; and |
| • | changes with respect to policies and spending for commercial-off-the-shelf, or COTS, solutions. |
Even though some of our U.S. government transactions may involve fixed minimum commitments, other commitments are subject to annual Congressional appropriations and, as a result, U.S. government agencies may not continue to fund these contracts at current or anticipated levels. For example, in fourth quarter 2009, we experienced general delays in U.S. government purchasing following the delay of the approval of the U.S. federal budget appropriations bills until December 2009. As of September 30, 2010, the U.S. Congress had not yet approved several key appropriations bills for the 2011 federal fiscal year. These delays may result in delays in U.S. government purchasing of our solutions and products. In addition, although we anticipate that the U.S. government agencies will continue to purchase from us in the future or after the expiration of any existing contracts, the vast majority of our business with the U.S. government is conducted on a purchase order basis and not under fixed minimum contracts. As such, we cannot assure you that those purchases will continue at historic levels or at all, or that there will not be gaps between the expiration of a prior agreement and entry into any new agreement. If U.S. government agencies terminate, significantly reduce in scope or suspend any of their business with us, or change their policies, priorities, or funding levels, our business, financial condition and results of operations would be materially and adversely affected.
Losses, delays or reductions in scope of our primary customer relationships will materially reduce our revenue and profitability.
We depend on a small number of key customer relationships for a significant portion of our revenues. Our top twenty customers represented over half of our total revenue for the year ended December 31, 2009. In addition, approximately 50%, 43% and 39% of our revenue in the years ended December 31, 2008 and 2009 and the nine months ended September 30, 2010 was derived from our direct or indirect sales to agencies, offices and departments of the U.S. federal government, of which the substantial majority was to the Department of Defense.
16
Table of Contents
An important part of our growth strategy is to increase sales of our products to existing and new large enterprises, service providers and government entities. Sales to enterprises, service providers and government entities involve risks that may not be present (or that are present to a lesser extent) with sales to small-to-mid-sized entities. These risks include:
| • | increased competition from larger competitors that traditionally target enterprises, service providers and government entities and that may already have purchase commitments from those end-customers; |
| • | increased purchasing power and leverage held by large end-customers in negotiating contractual arrangements with us; |
| • | more stringent requirements in our support service contracts, including increased penalties for any failure to meet support requirements; and |
| • | longer sales cycles and the associated risk that substantial time and resources may be spent on a potential end-customer who elects not to purchase our products and services. |
Large enterprises, service providers and government entities often undertake significant evaluation processes that result in lengthy sales cycles, in some cases over twelve months. Due to the lengthy nature, the size and scope, and stringent requirements of these evaluations, we may spend substantial time, effort and money in our sales efforts without being successful in producing any sales. If we are unsuccessful in converting these evaluations into sales, we may experience an increased inventory of used products and potential increased write-offs. In addition, product purchases by enterprises, service providers and government entities are frequently subject to budget constraints, multiple approvals, and unplanned administrative, processing and other delays. Finally, enterprise, service providers and government entities typically have longer implementation cycles; require greater product functionality and scalability and a broader range of services, including design services; demand that vendors take on a larger share of risks; sometimes require acceptance provisions that can lead to a delay in revenue recognition; and expect greater payment flexibility from vendors. All these factors can add further risk to business conducted with these customers. If sales expected from a large end-customer for a particular quarter are not realized in that quarter or at all, our business, operating results and financial condition could be materially and adversely affected.
We face intense competition in our market, both from larger, better-known companies and from more targeted competitors; we may lack sufficient financial or other resources to maintain or improve our competitive position.
The market for high-end data protection solutions is intensely competitive, and we expect competition to intensify in the future. Although we are not aware of a competitor that offers the same array of solutions that we provide, we compete with several companies in various areas of our business. Many competitors that specialize in providing protection from a narrow variety of security threats are often able to deliver specialized security products to the market more quickly than we can.
In addition, large, more established competitors in similar markets with our own competitive space, such as RSA (a division of EMC), Intel, McAfee and Symantec may attempt to further expand their presence in the high-end data protection solutions market and compete more directly against more of our solutions.
Many of these existing and potential competitors enjoy substantial competitive advantages such as:
| • | greater name recognition and longer operating histories; |
| • | larger sales and marketing budgets and resources; |
| • | broader distribution and established relationships with distribution partners and end-customers; |
| • | access to larger customer bases; |
| • | greater customer support resources; |
| • | greater resources to make acquisitions; |
17
Table of Contents
| • | lower labor and development costs or increased economies of scale; and |
| • | substantially greater financial, technical and other resources. |
Some of our competitors have substantially larger installed customer bases beyond the high-end data protection solutions market and leverage their relationships based on other products or incorporate functionality into existing products in a manner that may discourage users from purchasing our products. These larger competitors may also have more diversified businesses that allow them to better withstand significant reduction in capital spending by end-customers in a number of markets.
Conditions in our markets could change rapidly and significantly as a result of technological advancements or continuing market consolidation. Our current and potential competitors may also establish cooperative relationships among themselves or with third parties that may further enhance their resources and product offerings in the markets we address. In addition, current or potential competitors may be acquired by third parties with greater available resources. As a result of such acquisitions, our current or potential competitors might be able to adapt more quickly to new technologies and customer needs, devote greater resources to the promotion or sale of their products and services, initiate or withstand substantial price competition, and more readily develop and expand their product and service offerings. These competitive pressures in our market or our failure to compete effectively may adversely affect our operating results and market share.
If functionality similar to that offered by our products is incorporated into existing infrastructure products, organizations may decide against adding our solutions to their network, which would have an adverse effect on our business.
Providers of services and products outside the data protection market may bundle products and services competitive with ours with existing products and services. For example, large, well-established providers of network and storage equipment, such as Cisco Systems or Hewlett-Packard Company, offer and may continue to introduce, security features that compete with our products, either in stand-alone security products or as additional features in their network infrastructure products. The inclusion of, or the announcement of an intent to include, functionality perceived to be similar to that offered by our data protection and security solutions in existing products that are already generally accepted as necessary components of network architecture may have an adverse effect on our ability to market and sell our products. Furthermore, even if the functionality offered by infrastructure providers is more limited than our products, a significant number of customers may elect to accept such functionality in lieu of adding solutions from an additional vendor. Many organizations have invested substantial personnel and financial resources to design and operate their networks and have established deep relationships with providers of networking products, which may make them reluctant to add new components to their networks, particularly from other vendors such as us. In addition, an organization’s existing vendors or new vendors with a broad product offering may be able to offer sales concessions that we are not able to match due to our product offering or more limited resources. If organizations are reluctant to add additional data protection and security solutions from new vendors or otherwise decide to work with their existing vendors, our business, financial condition and results of operations will be adversely affected.
Defects or vulnerabilities in our products or the failure of our products to adequately prevent a security breach or protect software assets could harm our reputation and divert resources.
Because our products are complex, they have contained and may contain defects, errors or vulnerabilities that are not detected until after their release and deployment by our customers despite our efforts to test those products prior to release. Defects, errors or vulnerabilities may make our products susceptible to hacking or electronic break-ins or otherwise cause them to fail to help secure data. Because the techniques used by attackers to access or sabotage data change frequently and generally are not recognized until launched against a target, we may be unable to anticipate all of these techniques. Our products may also experience technical failures and downtime or fail to meet the increased requirements of a growing customer base. Any such technical failure, downtime, or failures in general may temporarily or permanently expose our end-customers’ data, leaving their data unprotected against the latest security threats.
18
Table of Contents
Our products must also successfully interoperate with products from other vendors. As a result, it may be difficult to identify the sources of problems that may arise through operation. The occurrence of hardware and software errors, whether or not caused by our products, could delay or reduce market acceptance of our products, and have an adverse effect on our business and financial performance, and any necessary revisions may cause us to incur significant expenses.
An actual or perceived security breach of the data of one of our end-customers or our own systems, regardless of whether the breach is attributable to the failure of our products to prevent the security breach, could adversely affect the market’s perception of our security products. We may not be able to correct defects, errors or vulnerabilities promptly, or at all. Any defects, errors or vulnerabilities in our products could result in:
| • | expenditure of significant financial and product development resources in efforts to analyze, correct, eliminate or work-around errors or defects or to address and eliminate vulnerabilities; |
| • | loss of existing or potential end-customers or channel partners; |
| • | loss and/or disclosure of confidential information or our proprietary technology; |
| • | delayed or lost revenue; |
| • | delay or failure to attain market acceptance; |
| • | lost market share; |
| • | negative publicity, which will harm our reputation; and |
| • | litigation, regulatory inquiries or investigations that may be costly and harm our reputation. |
Although we have limitation of liability provisions in our standard terms and conditions of sale, they may not fully or effectively protect us from claims as a result of federal, state or local laws or ordinances or unfavorable judicial decisions in the United States or other countries. In addition, some of our customer agreements may require us to indemnify our customers for any claims or losses resulting from defects, errors or vulnerabilities in our products. The sale and support of our products also entail the risk of product liability claims. We maintain insurance to protect against certain claims associated with the use of our products, but our insurance coverage may not adequately cover any claim asserted against us. In addition, even claims that ultimately are unsuccessful could result in our expenditure of funds in litigation and divert management’s time and other resources.
The data security market is rapidly evolving and the complex technology incorporated in our products makes them difficult to develop. If we do not accurately predict, prepare for and respond promptly to technological and market developments and changing end-customer needs and develop corresponding products, our competitive position and prospects will be harmed.
Our future success depends on our ability to respond to the rapidly changing needs of our customers by developing or introducing new products, product upgrades, and services in a timely manner. We have in the past incurred, and will continue to incur, significant research and development expenses as we strive to remain competitive. New product development and introduction involves a significant commitment of time and resources and is subject to a number of risks and challenges including:
| • | managing the length of the development cycle for new products and product enhancements; |
| • | adapting to emerging and evolving industry standards and to technological developments by our competitors and customers; |
| • | extending the operation of our products and services to new and evolving platforms, operating systems and hardware products, such as virtualization and cloud computing; |
| • | entering into new or unproven markets with which we have limited experience; |
| • | managing new product and service strategies; |
19
Table of Contents
| • | incorporating acquired products and technologies; |
| • | trade compliance issues affecting our ability to ship new or acquired products; |
| • | protecting our intellectual property and other proprietary rights; |
| • | developing or expanding efficient sales channels; and |
| • | obtaining sufficient licenses to technology and technical access from operating system software vendors on reasonable terms to enable the development and deployment of interoperable products, including source code licenses for certain products with deep technical integration into operating systems. |
In addition, the data security market has evolved and is expected to continue to evolve rapidly. Many of our end-customers operate in dynamic and rapidly changing markets that require them to continuously evolve their IT infrastructure, including add numerous network access points and adapt increasingly complex enterprise networks, incorporating a variety of hardware, software applications, operating systems and networking protocols. In addition to the rapidly changing network environments, computer hackers and others who try to attack networks are employing increasingly sophisticated techniques to gain access to and attack systems and networks. In order to remain competitive, we need to accurately anticipate changes in IT infrastructure that our end-customers will deploy, the security vulnerabilities of such infrastructure as well as likely attack techniques, and to continue to develop and introduce solutions that successfully address the evolving threats while minimizing the impact on IT infrastructure performance.
Although the market expects rapid development and commercial introduction of new products or product enhancements to respond to changing infrastructure and evolving threats, the development of these products is difficult and the timeline for their release and availability can be uncertain. Additionally, some of our new products and enhancements may require us to develop new hardware architectures and application-specific integrated circuits, or ASICs, that involve complex, expensive and time consuming research and development processes. We have in the past and may in the future experience unanticipated delays in the availability of new products and services and fail to meet previously announced timetables for such availability. If we do not quickly respond to the rapidly changing and rigorous needs of our end-customers by timely developing and releasing new products and services or enhancements that can respond adequately to new security threats, our competitive position and business prospects will be harmed.
In addition, for certain customers and environments we must obtain certifications for our products such as U.S. Federal Information Processing Standard, or FIPS, or Common Criteria. While we have successfully obtained the requisite certifications for our products in the past, there can be no assurance that we will be able to obtain such certifications on a timely basis or at all for new products. The failure to obtain certifications would preclude us from selling our products to certain customers or for certain applications which could harm our competitive position and our business.
Failure to comply with laws or regulations applicable to our business could cause us to lose U.S. government customers or our ability to contract with the U.S. government
A significant portion of our revenue is derived from sales to U.S. government agencies. In connection with this business, we must comply with laws and regulations relating to the formation, administration and performance of U.S. government contracts. These laws and regulations are complex, and may impose added costs on our business. The failure to comply with these laws and regulations, or violations of other laws and regulations such as those relating to export or the U.S. Foreign Corrupt Practices Act, could lead to claims for damages, penalties, termination of contracts, suspension or debarment from doing business with the U.S. government or loss of export rights. In addition, some of the work we perform in connection with our U.S. government business requires us to maintain securities clearances for both the individuals involved in the work as well as the facilities in which such work is performed. The loss of the requisite securities clearances could exclude us from conducting business with agencies of the U.S. government from which we have in the past received significant business. Any such damages, penalties, disruption or limitation in our ability to do business with the U.S. federal government could have a material adverse effect on our business, operating results and financial condition.
20
Table of Contents
In addition, U.S. government agencies, including the Defense Contract Audit Agency and the Department of Labor, routinely audit and investigate government contractors. These agencies review a contractor’s performance under its contracts, cost structure and compliance with applicable laws, regulations and standards. The U.S. government also may review the adequacy of, and a contractor’s compliance with, its internal control systems and policies, including the contractor’s purchasing, property, estimating, compensation and management information systems. Any costs found to be improperly allocated to a specific contract will not be reimbursed, while such costs already reimbursed must be refunded. If an audit uncovers improper or illegal activities, we may be subject to civil and criminal penalties and administrative sanctions, including termination of contracts, loss of intellectual property rights, forfeiture of profits, suspension of payments, fines and suspension or prohibition from doing business with the U.S. government. In addition, our reputation could suffer serious harm if allegations of impropriety were made against us.
Adverse conditions in the national and global economies and financial markets may adversely affect our business and financial results.
National and global economies and financial markets have experienced a prolonged downturn stemming from a multitude of factors, including adverse credit conditions impacted by the sub-prime mortgage crisis, slower or receding economic activity, concerns about inflation and deflation, fluctuating energy costs, high unemployment, decreased consumer confidence, reduced corporate profits and capital spending, adverse business conditions and liquidity concerns and other factors. The severity or length of time these economic and financial market conditions may persist is unknown. During challenging economic times, periods of high unemployment and in tight credit markets, many customers may delay or reduce technology purchases. This could result in reductions in sales of our products, longer sales cycles, difficulties in collection of accounts receivable, slower adoption of new technologies, lower renewal rates, and increased price competition. These results may persist even if a number of economic conditions improve. Specific economic trends, such as declines or softness in government or corporate information technology spending, would have a more direct impact on our business. Any of these events would likely harm our business, operating results, cash flows and financial condition.
We have a history of losses, and we are unable to predict the extent of any future losses or when, if ever, we will achieve profitability in the future.
We have incurred net losses in recent fiscal years, including net losses of $50.8 million in the Predecessor Period of 2007, $37.3 million in the Successor Period of 2007, $126.5 million in 2008, $49.7 million in 2009 and $8.7 million in the first nine months of 2010. As a result, we had an accumulated deficit of $222.3 million at September 30, 2010. Although we have been profitable in certain periods in the past, we may not be able to achieve or sustain profitability in future periods. Achieving profitability will require us to increase revenue, manage our cost structure, including the borrowing costs on our debt, and not experience unanticipated liabilities. Revenue growth may slow or revenue may decline for a number of possible reasons, including slowing demand for our products or services, increasing competition, a decrease in the growth of our overall market, or if we fail for any reason to continue to capitalize on growth opportunities. Any failure by us to return to and sustain profitability, or to continue our revenue growth, could cause the price of our common stock to materially decline.
Our quarterly operating results are likely to vary significantly and be unpredictable, which could cause the trading price of our stock to decline.
In addition to uncertainty about our future profitability, our financial results may not be consistent from period to period. Our financial results could vary significantly from period to period as a result of a variety of factors, many of which are outside of our control, such as:
| • | the timing of our sales during the quarter, particularly since the loss or delay of a few large sales may have a significant adverse impact on our operating results; |
| • | the timing of satisfying revenue recognition criteria, including the establishment of applicable vendor-specific objective evidence, or VSOE, criteria; |
21
Table of Contents
| • | the budgeting, procurement and work cycles of our customers, including U.S. government agencies; |
| • | our ability to increase sales to existing customers and attract new customers; |
| • | our failure to accurately estimate or control costs—including those incurred as a result of acquisitions, investments and other business development initiatives; |
| • | our ability to estimate revenues and cash flows associated with business operations acquired by us; |
| • | the impact on our sales caused by our customers’ budgetary constraints, competition, customer dissatisfaction, customer corporate restructuring or change in control, or our customers’ actual or perceived lack of need for our products and services; |
| • | the potential loss of significant customers; |
| • | the impact of our decisions to discontinue certain products; |
| • | our ability to protect our intellectual property and other proprietary rights; |
| • | the amount and timing of capital expenditures and operating costs related to the maintenance and expansion of our operations; |
| • | the timing and success of new product introductions by us or our competitors; |
| • | the timing of impairments of goodwill or other intangibles; |
| • | variations in the demand for our solutions and the implementation cycles of our products by our customers; |
| • | changes in our pricing and discounting policies or those of our competitors; |
| • | maintaining appropriate staffing levels and capabilities relative to projected growth, or retaining key personnel as a result of the integration of recent acquisitions; |
| • | adverse judgments or settlements in legal disputes; |
| • | the cost and timing of organizational restructuring, in particular in international jurisdictions; |
| • | the timing of acquisitions and related transactional costs; |
| • | the uncertainties associated with the integration of acquired new lines of business and operations, including in countries in which we may have little or no previous experience; |
| • | changes in applicable tax laws; |
| • | the extent to which certain expenses are deductible for tax purposes, such as share-based compensation that fluctuates based on the timing of vesting and our stock price; |
| • | the timing of any reversal of our deferred tax valuation allowance; |
| • | adoption of new accounting pronouncements; and |
| • | general economic conditions, both domestically and in our foreign markets, and economic conditions specifically affecting industries in which our customers participate. |
Any one of the factors above or the cumulative effect of some of the factors referred to above may result in significant fluctuations in our quarterly operating results. This variability and unpredictability could result in our failing to meet our revenue or operating results expectations or those of securities analysts or investors for any period. If we fail to meet or exceed such expectations for these or any other reasons, the market price of our shares could fall substantially and we could face costly lawsuits, including securities class action suits. In addition, a significant percentage of our operating expenses are fixed in nature and based on forecasted revenue trends. Accordingly, in the event of revenue shortfalls, we are generally unable to mitigate the negative impact on our profitability in the short term.
22
Table of Contents
Our sales cycle is long and unpredictable, and our sales efforts require considerable time. As a result, our revenues are difficult to predict and may vary substantially from quarter to quarter, which may cause our operating results to fluctuate.
Our operating results may fluctuate, in part, because of the intensive nature of our sales efforts, as well as the length and variability of the sales cycle. Because decisions to purchase products such as ours frequently involve significant capital commitments by customers, potential customers generally have our products evaluated at multiple levels within an organization or government entity, each often having specific and conflicting requirements. As a result, the sales cycle for our products may be lengthy or may vary significantly. Our sales efforts involve educating our customers, who are frequently relatively unfamiliar with our brand and the value of our products, including their technical capabilities and potential value to the organization. We spend substantial time, effort and money in our sales efforts without any assurance that our efforts will produce any sales.
The length of our sales cycle is dependent on the product line and market segment from initial evaluation to delivery. and varies substantially from customer to customer. Overall, the sales cycle for our products is typically six months but can extend to more than one year. We typically recognize about half of our product revenues in the last four weeks of a quarter. It is difficult to predict exactly when, or even if, we will actually complete a sale with a potential customer. As a result, large individual sales have, in some cases, occurred in quarters subsequent to those we anticipated, or have not occurred at all. The loss or delay of one or more large product transactions in a quarter would impact our operating results for that quarter and any future quarters into which revenues from that transaction are delayed. As a result of these factors, it increases the difficulty for us to accurately forecast product revenues in any quarter. Because a substantial portion of our expenses are relatively fixed in the short term, our operating results will suffer if revenues fall below our expectations in a particular period, which could cause the price of our common stock to materially decline.
We have grown, and may continue to grow, through acquisitions that give rise to risks and challenges that could adversely affect our future financial results.
We have in the past acquired, and we expect to acquire in the future, other businesses, business units, and technologies, including most recently, Ingrian Networks in 2008 and Aladdin Knowledge Systems and Assured Decisions in 2009. Acquisitions can involve a number of special risks and challenges, including:
| • | complexity, time, and costs associated with these acquisitions, including the integration of acquired business operations, workforce, products, and technologies into our existing business, sales force, employee base, product lines, and technology; |
| • | diversion of management time and attention from our existing business and other business opportunities; |
| • | difficulties in retaining key personnel of the acquired business and additional costs that may be incurred as a result; |
| • | loss or termination of employees, including costs associated with the termination or replacement of those employees; |
| • | assumption of debt or other liabilities of the acquired business, including litigation related to the acquired business and/or intellectual property assets acquired in connection with such acquisitions; |
| • | incurrence of unforeseen liabilities related to the acquisitions or acquired business, including liabilities arising out of litigation or failure to comply with applicable statutory or regulatory requirements such as export controls and anti-corruption and environmental laws; |
| • | increased expenses and working capital requirements; |
| • | the addition of acquisition-related debt; |
| • | dilution of stock ownership of existing stockholders; |
23
Table of Contents
| • | increased costs and efforts in connection with compliance with Section 404 of the Sarbanes-Oxley Act, which may be especially pronounced for acquired companies that may not have compliant internal controls; and |
| • | substantial accounting charges for restructuring and related expenses, impairment of goodwill, amortization of intangible assets and stock-based compensation expense, such as the $42.9 million goodwill impairment we recorded during 2008. |
Integrating acquired businesses has been and will continue to be a complex, time consuming, and expensive process, and can also impact the effectiveness of our internal control over financial reporting. To integrate acquired businesses, we must implement our technology systems in the acquired operations and integrate and manage the personnel of the acquired operations. We also must effectively integrate the different cultures of acquired business organizations into our own in a way that aligns various interests, and may need to enter new markets in which we have no or limited experience and where competitors in such markets have stronger market positions.
Any of the foregoing, and other factors, could harm our ability to achieve anticipated levels of profitability from acquired businesses or to realize other anticipated benefits of such acquisitions. In addition, because acquisitions of high technology companies are inherently risky, no assurance can be given that our previous or future acquisitions will be successful and will not adversely affect our business, operating results, or financial condition.
We are dependent on contract manufacturers and changes to those relationships, expected or unexpected, may result in delays or disruptions that could cause us to lose revenue and damage our customer relationships.
We rely entirely on contract manufacturers to manufacture and assemble our products. This gives us less control over the manufacturing process and exposes us to significant risks, including limited control over capacity, late delivery, quality and costs. Moreover, because our products are very complex to manufacture, transitioning manufacturing activities from one location to another, or from one manufacturing partner to another, is complicated. Although we have contracts with our contract manufacturers, those contracts do not require them to manufacture our products on a long-term basis in any specific quantity or at any specific price, and any order that we would submit by purchase order is generally subject to acceptance of the manufacturer. In addition, it is time consuming and costly to qualify and implement additional contract manufacturer relationships. Moreover, manufacturing of Type 1 products may only be performed in facilities that meet certain security requirements and locating and qualifying alternative contract manufacturers for these products would require additional time and resources. Therefore, if we fail to effectively manage our contract manufacturer relationships or if one or more of them should experience delays, disruptions or quality control problems, or if we had to change or add additional contract manufacturers or contract manufacturing sites, our ability to ship products to our customers could be delayed. The occurrence of any of these events would be disruptive to us and could seriously harm our business. Any interruption or delay in the supply of any of these parts or components would harm our ability to meet our scheduled product deliveries to our distributors, resellers and end-customers. This could harm our relationships with our channel partners and end-customers and could cause delays in shipment of our products and adversely affect our results of operations.
Because some of the key components in our products come from limited sources of supply, we are susceptible to supply shortages or supply changes, which could disrupt or delay our scheduled product deliveries to our customers and may result in the loss of sales and customers.
Several key parts and components used in our products such as microcontrollers and integrated circuits, field-programmable gate arrays, or FPGAs, power supplies and batteries are available only from single sources. In addition, many of our products incorporate application-specific integrated circuits, or ASICs, that are manufactured by sole-source third-parties.
We have faced component shortages in the past and are subject to the risk of shortages in supply of these components in the future. We are also subject to the risk that component suppliers may discontinue or modify
24
Table of Contents
components used in our products, which could require us to expend significant resources to incorporate these new components into our products or to find alternative suppliers and components which can be time-consuming and expensive. Other risks of relying on sole-source suppliers include:
| • | financial or other difficulties faced by our suppliers; |
| • | price increases; |
| • | failure of a component to meet environmental or other regulatory requirements; and |
| • | failure in component quality. |
The occurrence of any of these would be disruptive to us and could seriously harm our business. Any interruption or delay in the supply of any of these parts or components would harm our ability to meet our scheduled product deliveries to our distributors, resellers and end-customers. This could harm our relationships with our channel partners and end-customers and could cause delays in shipment of our products and adversely affect our results of operations.
In the future, we may not be able to secure financing necessary to operate and grow our business as planned.
We expect that the net proceeds from this offering, together with our current cash and cash equivalents, should be sufficient to meet our anticipated cash needs for working capital and capital expenditures for at least the next 12 months. However, our business and operations may consume resources faster than we anticipate. We also may require additional funding to expand our sales and marketing and research and development efforts or to make acquisitions. Additional financing may not be available on favorable terms, if at all. If adequate funds are not available on acceptable terms, we may be unable to fund the expansion of our sales and marketing and research and development efforts or take advantage of acquisition or other opportunities, which could seriously harm our business and operating results. If we issue debt, the debt holders would have rights senior to common stockholders to make claims on our assets and the terms of any debt could impose restrictions on our operations and impose limits on our liquidity. Furthermore, if we issue additional equity securities, stockholders will experience dilution, and the new equity securities could have rights senior to those of our common stock.
In addition, we are subject to certain restrictions on our ability to raise additional capital pursuant to our credit agreements and our stockholder agreement with Vector Stealth. We are restricted from incurring additional indebtedness without prior approval from our lenders in many cases. We are also prohibited pursuant to our stockholder agreement with Vector Stealth from incurring additional indebtedness (excluding working capital revolvers and the refinancing of any then existing debt) of greater than $50.0 million in excess of our existing indebtedness following the application of proceeds from this offering to the repayment of a portion of our debt as described in “Use of Proceeds” without prior approval from Vector Stealth.
If we are unable to attract and retain qualified employees, lose key personnel, fail to integrate replacement personnel successfully, or fail to manage our employee base effectively, we may be unable to develop new and enhanced products and services, effectively manage or expand our business, or increase our revenues.
Our future success depends upon our ability to recruit and retain our key management, technical, sales, marketing, finance, and other critical personnel to execute on our business plan, and to identify and pursue new opportunities and product innovations. The loss of services of senior management, particularly Mark A. Floyd, our chief executive officer, and Chris Fedde, our president and chief operating officer, could significantly delay or prevent the achievement of our development and strategic objectives. Our officers and other key personnel are “at-will” employees, and we cannot assure you that we will be able to retain them. Competition for people with the specific skills and in some cases, security clearances, that we require is significant. In order to attract and retain personnel in a competitive marketplace, we believe that we must provide a competitive compensation package, including cash and equity-based incentives. Stock price volatility may from time to time adversely affect our ability to recruit or retain employees. As a result, we may be impaired in our efforts to attract and
25
Table of Contents
retain necessary personnel. If we are unable to hire and retain qualified employees, or conversely, if we fail to manage employee performance or reduce staffing levels when required by market conditions, our business and operating results could be adversely affected.
If we fail to further develop and manage our distribution channels, our revenues could decline and our growth prospects could suffer.
We derive a significant portion of our revenues from sales of our products and related services through channel partners, such as resellers and systems integrators, amounting to approximately 13% and 17% of our revenue in 2008 and 2009 and approximately 22% of our revenue in the nine months ended September 30, 2010. In particular, systems integrators are an important source of sales for us in the U.S. public sector, as government agencies often rely on them to meet IT needs. We also use resellers to augment our internal resources in international markets and, to a lesser extent, domestically. We anticipate that we will continue to derive a substantial portion of our sales through channel partners, including parties with which we have not yet developed relationships. We expect that channel sales will represent a substantial portion of our U.S. government and international revenues for the foreseeable future and, we believe, a growing portion of our U.S. commercial revenues. We may be unable to recruit additional channel partners and successfully expand our channel sales program. If we do not successfully execute our strategy to increase channel sales, particularly to further penetrate the mid-market and sell our products, our growth prospects may be materially and adversely affected.
Our agreements with our channel partners are generally non-exclusive and many of our channel partners have more established relationships with our competitors. If our channel partners do not effectively market and sell our products, if they choose to place greater emphasis on products of their own or those offered by our competitors, or if they fail to meet the needs of our customers, our ability to grow our business and sell our products may be adversely affected, particularly in the public sector, the mid-market and internationally. Similarly, the loss of a substantial number of our channel partners, which may cease marketing our products and services with limited or no notice and with little or no penalty, and our possible inability to timely replace them, the failure to recruit additional channel partners, or any reduction or delay in their sales of our products and services or conflicts between channel sales and our direct sales and marketing activities could materially and adversely affect our results of operations. In addition, changes in the proportion of our revenues attributable to sales by channel partners, which involve different costs and risks than our direct sales, may cause our operating results to fluctuate from period to period.
Managing inventory of our products and product components is complex; insufficient inventory may result in lost sales opportunities or delayed revenue, while excess inventory may harm our gross margins.
Overall, the sales cycle for our products is typically six months but can extend to more than one year. As such, it is difficult to predict exactly when, or even if, we will actually complete a sale with a potential customer. As a result, we may have substantial difficulty accurately predicting the levels of inventory we may require at a given time. Although we believe we have sufficient capacity with our existing contract manufacturers to meet demand, we typically require as many as three months lead time to substantially increase production.
In addition, our channel partners may increase orders during periods of product shortages, or delay or cancel orders if their inventory is too high in anticipation of new products. They also may adjust their orders in response to the supply of our products and the products of our competitors that are available to them and in response to seasonal fluctuations in end-customer demand. Management of our inventory is further complicated by the significant number of different products that we sell.
Our inventory management systems and related supply chain visibility tools may be inadequate to enable us to effectively manage inventory. Inventory management remains an area of focus as we balance the need to maintain inventory levels for timely customer shipment against the risk of inventory obsolescence because of rapidly changing technology and customer requirements. If we ultimately determine that we have excess
26
Table of Contents
inventory, we may have to write-down inventory, which in turn would result in lower gross margins. Alternatively, insufficient inventory levels may lead to shortages that result in delayed revenue or loss of sales opportunities altogether as potential end-customers turn to competitors’ products that are readily available. If we are unable to effectively manage our inventory and that of our distribution partners, our results of operations could be adversely affected.
Our business may be adversely affected if we encounter difficulties as we implement an enterprise resource planning system.
We are in the process of implementing an ERP system. However, we do not have substantial experience with the numerous processes and procedures required for the effective use of this system or with running our business using this system. Because we are still in the process of implementing this system and because we lack this experience with using the system, this ERP implementation poses a risk to our internal controls over financial reporting and to our business operations. Disruptions or difficulties in implementing this system or the related procedures or controls could adversely affect both our internal and disclosure controls and harm our business, including our ability to forecast or make sales, manage our supply chain and collect our receivables. Moreover, such a disruption could result in unanticipated costs or expenditures and a diversion of management’s attention and resources.
Establishing, maintaining and improving our financial controls and the requirements of being a public company may strain our resources and divert management’s attention, and if we fail to establish and maintain proper internal controls, our ability to produce accurate financial statements or comply with applicable regulations could be impaired.
As a public company, we will be subject to the reporting requirements of the Securities Exchange Act of 1934, or the Exchange Act, the Sarbanes-Oxley Act of 2002, or the Sarbanes-Oxley Act, and the rules and regulations of the NASDAQ Stock Market LLC. As a privately held company, we have not been subject to these reporting requirements, and so have not yet performed procedures to determine our compliance with Section 404 of the Sarbanes-Oxley Act. The requirements of these rules and regulations will increase our legal, accounting and financial compliance costs, will make some activities more difficult, time-consuming and costly and may also place undue strain on our personnel, systems and resources.
Section 404 of the Sarbanes-Oxley Act requires that beginning with our annual report for the year ended December 31, 2011, management report annually on the effectiveness of our internal control over financial reporting and identify any material weaknesses in our internal control and financial reporting environment. Prior to this offering, we have not been required to comply with Section 404 of the Sarbanes-Oxley Act. As a result, we have not evaluated our compliance with Section 404 of the Sarbanes-Oxley Act, although we have separately identified a significant deficiency and a material weakness as further described in the immediately following risk factor. There can be no assurance that we will not identify one or more material weaknesses in our internal controls in connection with evaluating our compliance with Section 404 of the Sarbanes-Oxley Act. The presence of material weaknesses could result in financial statement errors which, in turn, could require us to restate our operating results. In order to maintain and improve the effectiveness of our disclosure controls and procedures and internal control over financial reporting, we will need to expend significant resources and provide significant management oversight. We have a substantial effort ahead of us to implement appropriate processes, document our system of internal control over relevant processes, assess their design, remediate any deficiencies identified and test their operation. As a result, management’s attention may be diverted from other business concerns, which could harm our business, operating results and financial condition. These efforts will also involve substantial accounting-related costs. In addition, if we are unable to meet the requirements of Section 404 of the Sarbanes-Oxley Act, we may not be able to remain listed on the NASDAQ Global Market.
Implementing any appropriate changes to our internal controls may require specific compliance training of our directors, officers and employees, entail substantial costs in order to modify our existing accounting systems, and
27
Table of Contents
take a significant period of time to complete. These changes may not, however, be effective in maintaining the adequacy of our internal controls, and any failure to maintain that adequacy, or consequent inability to produce accurate financial statements on a timely basis, could increase our operating costs and could materially impair our ability to operate our business. In the event that we are not able to demonstrate compliance with Section 404 of the Sarbanes-Oxley Act in a timely manner, that our internal controls are perceived as inadequate or that we are unable to produce timely or accurate financial statements, investors may lose confidence in our operating results, our stock price could decline and may potentially subject us to litigation.
We have identified a significant deficiency and a material weakness in our internal controls over financial reporting. If we fail to remediate these items or any significant deficiencies or material weaknesses that may arise in the future, and maintain proper and effective internal controls, our ability to produce accurate and timely financial statements could be impaired, which could adversely affect our business, operating results and financial condition.
In connection with the audit of our consolidated financial statements for the year ended December 31, 2009, we identified a significant deficiency in our internal controls over financial reporting for the year ended December 31, 2009. In addition, we identified a control deficiency that represented a material weakness in our internal controls over financial reporting with respect to the three months ended March 31, 2010. Our failure to implement and maintain effective internal controls in our business could have a material adverse effect on our business, financial condition, results of operations and stock price. A material weakness is a deficiency or a combination of deficiencies in internal control over financial reporting such that there is a reasonable possibility that a material misstatement of our financial statements will not be prevented or detected.
The significant deficiency in our internal controls over financial reporting was as follows:
| • | For and as of the year ended December 31, 2009 inadequate controls were applied at our Aladdin subsidiary that resulted in inaccurate accounting for income taxes in 2009 related to Aladdin’s 2008 acquisition of another company. |
The material weakness in our internal controls over financial reporting was as follows:
| • | For the three months ended March 31, 2010, we did not maintain effective controls over certain expense accruals and intercompany charges, which resulted in the initial understatement of payroll expense and certain other expenses in the period and the overstatement of certain expenses due to the failure to appropriately account for certain intercompany charges. |
Although we are taking steps designed to remediate these control deficiencies, including increased staffing and training, as well as the use of improved analytics in our accounting function, there are no assurances that the measures we are taking to remediate these internal control deficiencies will be completely effective or that similar or other deficiencies will not occur, either before or following completion of this offering.
Our inability to effectively manage our expected headcount growth and expansion and our additional obligations as a public company could seriously harm our ability to effectively run our business.
Our historical growth has placed, and our intended future growth is likely to continue to place, a significant strain on our management, financial, personnel and other resources. We have grown from 1,040 employees at January 12, 2007 to over 1,700 employees at October 1, 2010. Since January 1, 2007, we have acquired several businesses and have significantly expanded our operations. In addition to managing our expected growth, we will have substantial additional obligations and costs as a result of being a public company. These obligations include investor relations, preparing and filing periodic Securities and Exchange Commission, or SEC, reports, developing and maintaining internal controls over financial reporting and disclosure controls, compliance with corporate governance rules and other requirements imposed on public companies by the SEC and the NASDAQ Global Market. Fulfilling these additional obligations will make it more difficult to operate a growing company.
28
Table of Contents
Any failure to effectively manage growth or fulfill our obligations as a public company could seriously harm our ability to respond to customers, the quality of our software and services and our operating results. To effectively manage growth and operate a public company, we will need to implement additional management information systems, improve our operating, administrative, financial and accounting systems and controls, train new employees and maintain close coordination among our executive, engineering, accounting, finance, marketing, sales and operations organizations. Additionally, we cannot be assured that implementation of such changes will not encounter unforeseen delays or challenges that may adversely affect the existing business.
Our directors and executive officers may have conflicts of interest because of their ownership of equity interests of, and their employment with, our parent company and our affiliates.
A number of our directors and executive officers hold equity ownership interests in our parent company, Vector Stealth. Ownership interests in our parent company by our directors and officers could create, or appear to create, potential conflicts of interest when our directors and officers are faced with decisions that could have different implications for us and for Vector Stealth or its affiliates. We cannot assure you that any conflicts of interest will be resolved in our favor.
For a further description of our relationship with Vector Stealth, see “Certain Relationships and Related Person Transactions—Transactions and Relationships with Directors, Officers and 5% Shareholders—Transactions and Relationships with Vector Stealth and its Affiliates.”
We sell our products and services worldwide, and our business is subject to risks inherent in conducting business activities in geographies outside of the United States.
Sales to customers located outside of the United States, including in North America, South America, Europe, the Middle East, Asia and Australia, accounted for approximately 23% and 30% of our total revenue in the years ended December 31, 2008 and 2009 and approximately 34% of our total revenue in the nine months ended September 30, 2010. We are subject to risks associated with having worldwide operations, including:
| • | difficulties in managing geographically disparate operations; |
| • | potential greater difficulty and longer time in collecting accounts receivable from customers located abroad; |
| • | difficulties in enforcing agreements through non-U.S. legal systems; |
| • | unexpected changes in regulatory requirements that may limit our ability to export our products or sell into particular jurisdictions or impose multiple conflicting tax laws and regulations; |
| • | political and economic instability, civil unrest or war; |
| • | terrorist activities and health risks such as the “flu epidemic” and SARS that impact international commerce and travel; |
| • | difficulties in protecting our intellectual property rights, particularly in countries where the laws and practices do not protect proprietary rights to as great an extent as do the laws and practices of the United States; |
| • | restrictions on our ability to repatriate earnings; |
| • | changing laws and policies affecting economic liberalization, foreign investment, currency convertibility or exchange rates, taxation or employment; and |
| • | nationalization of foreign owned assets, including intellectual property. |
In addition, we are exposed to foreign currency exchange movements versus the U.S. dollar, particularly the euro, British pound, Israeli shekel and Japanese yen. With respect to revenue, our primary exposure exists during the period between execution of a purchase order denominated in a foreign currency and collection of the related receivable. During this period, changes in the exchange rates of the foreign currency to the U.S. dollar will affect
29
Table of Contents
our revenue, cost of sales and operating margins and could result in exchange gains or losses. We incur a variety of costs in foreign currencies, including some of our manufacturing costs, component costs and sales costs. Therefore, as we expand our operations outside the U.S., we may become more exposed to a strengthening of currencies in the region against the U.S. dollar. At this time, we use a limited number of derivative instruments in an attempt to hedge our foreign currency exchange risk, and we may increase the use of derivative instruments in the future to help further manage foreign currency exchange rate risk.
We are subject to governmental export and import controls that could subject us to liability or impair our ability to compete in international markets.
Certain of our products incorporate encryption technology and are therefore subject to export controls and may be exported outside the U.S. only with the required export license or through an export license exception. If we were to fail to comply with U.S. export licensing, U.S. Customs regulations, U.S. economic sanctions and other laws we could be subject to substantial civil and criminal penalties, including fines for the Company and incarceration for responsible employees and managers, and the possible loss of export or import privileges. In addition, if our channel partners fail to obtain appropriate import, export or re-export licenses or permits, we may also be adversely affected, through reputational harm and penalties. Obtaining the necessary export license for a particular sale may be time-consuming, and may result in the delay or loss of sales opportunities.
Furthermore, U.S. export control laws and economic sanctions prohibit the shipment of certain products to U.S. embargoed or sanctioned countries, governments and persons. Even though we take precautions to prevent our products from being shipped to U.S. sanctions targets, our products could be shipped to those targets by our channel partners, despite such precautions. Any such shipment could have negative consequences including government investigations, penalties and reputational harm. In addition, various countries regulate the import of certain encryption technology, including import permitting/licensing requirements, and have enacted laws that could limit our ability to distribute our products or could limit our customers’ ability to implement our products in those countries. Changes in our products or changes in export and import regulations may create delays in the introduction of our products in international markets, prevent our customers with international operations from deploying our products globally or, in some cases, prevent the export or import of our products to certain countries, governments or persons altogether. Any change in export or import regulations, economic sanctions or related legislation, shift in the enforcement or scope of existing regulations, or change in the countries, governments, persons or technologies targeted by such regulations, could result in decreased use of our products by, or in our decreased ability to export or sell our products to, existing or potential customers with international operations. Any decreased use of our products or limitation on our ability to export or sell our products would likely adversely affect our business, financial condition and results of operations.
Our government contracts may limit our ability to move development activities overseas, which may impair our ability to optimize our software development costs and compete for non-government contracts.
Increasingly, software development is being shifted to lower-cost countries, such as India. However, some contracts with U.S. government agencies require that at least 50% of the components of each of our products be of U.S. origin. Consequently, our ability to optimize our research and development by conducting it overseas may be hampered. Some of our competitors do not rely on contracts with the U.S. government to the same degree as we do and may develop software off-shore. If we are unable to develop our commercial products and solutions as cost-effectively as our competitors, our ability to compete for our non-government customers may be materially and adversely affected.
Our business in countries with a history of corruption and transactions with foreign governments increases the risks associated with our international activities.
As we operate and sell internationally, we are subject to the U.S. Foreign Corrupt Practices Act, or the FCPA, and other laws that prohibit improper payments or offers of payments to foreign governments and their officials and political parties by U.S. and other business entities for the purpose of obtaining or retaining business. We
30
Table of Contents
have operations, deal with and make sales to governmental customers in countries known to experience corruption, particularly certain emerging countries in East Asia, Eastern Europe, the Middle East and South America. Our activities in these countries create the risk of illegal or unauthorized payments or offers of payments or other things of value by our employees, consultants, sales agents or channel partners that could be in violation of applicable anti-corruption laws including the FCPA, even though these parties are not always subject to our control. We have taken certain actions to discourage and prevent illegal practices and are in the process of implementing anti-corruption compliance policies and procedures. However, the actions taken to safeguard against illegal practices, and any future improvements in our anti-corruption compliance policies and procedures, may not be effective, and our employees, consultants, sales agents or channel partners may engage in illegal conduct for which we might be held responsible. Violations of the FCPA may result in severe criminal or civil sanctions, including suspension or debarment from U.S. government contracting, and we may be subject to other liabilities and significant costs for investigations, litigation and fees, which could negatively affect our business, operating results and financial condition. In addition, the failure to create and maintain accurate books and records or the failure to maintain a system of internal accounting controls may subject us to sanctions.
We have and may in the future continue to have a substantial amount of indebtedness, which may adversely affect our cash flow and our ability to operate our business, including our ability to incur additional indebtedness.
As of September 30, 2010, our total indebtedness pursuant to our senior secured credit agreements was $372.9 million. Following this offering and the application of its net proceeds to the repayment of certain of our debt obligations, we expect to have total indebtedness of $ million on a pro forma basis as of September 30, 2010. Our substantial amount of indebtedness increases the possibility that we may be unable to generate sufficient cash to pay, when due, the principal of, interest on or other amounts due with respect to our indebtedness.
Our substantial indebtedness could have other important consequences for you, including:
| • | increasing our vulnerability to adverse economic, industry or competitive developments; |
| • | requiring a substantial portion of cash flow from operations to be dedicated to the payment of principal and interest on our indebtedness, therefore reducing our ability to use our cash flow to fund our operations, capital expenditures and future business opportunities; |
| • | restricting us from making strategic acquisitions or causing us to make non-strategic divestitures; |
| • | limiting our ability to obtain additional financing for working capital, capital expenditures, product development, debt service requirements, acquisitions and general corporate or other purposes; and |
| • | limiting our flexibility in planning for, or reacting to, changes in our business or the industry in which we operate, placing us at a competitive disadvantage compared to our competitors who are less highly leveraged and who, therefore, may be able to take advantage of opportunities that our leverage prevents us from exploiting. |
Our credit facilities contain a number of restrictions and covenants that, among other things, limit our ability to incur additional indebtedness, make investments, pay dividends or make distributions to our stockholders, grant liens on our assets, sell assets, enter into a new or different line of business, enter into transactions with our affiliates, merge or consolidate with other entities or transfer all or substantially all of our assets, and enter into sale and leaseback transactions. In addition, our credit facilities require us to comply with a quarterly maximum permitted leverage ratio at any time amounts are outstanding under our revolving credit facility. Credit market turmoil, adverse events affecting our business or industry, the tightening of lending standards or other factors could negatively impact our ability to obtain future financing or to refinance our outstanding indebtedness on terms acceptable to us or at all. For further discussion of our credit facilities, see “Management’s Discussion and Analysis and Results of Operations and Financial Condition—Liquidity and Capital Resources—Financing Activities—Secured Credit Agreements.”
31
Table of Contents
Our ability to comply with these restrictions and covenants in the future is uncertain and will be affected by the levels of cash flow from our operations and events or circumstances beyond our control. Our failure to comply with any of the restrictions and covenants under our credit facilities could result in a default under such facilities, which could cause all of our existing indebtedness to be immediately due and payable. If our indebtedness is accelerated, we may not be able to repay our indebtedness or borrow sufficient funds to refinance it. In addition, in the event of an acceleration, our lenders could proceed against the collateral securing our credit facilities, which includes nearly all of our assets, including the shares of capital stock of our subsidiaries. Even if we are able to obtain new financing, it may not be on commercially reasonable terms or on terms that are acceptable to us. If our indebtedness is in default for any reason, our business, financial condition and results of operations could be materially and adversely affected. In addition, complying with these restrictions and covenants may also cause us to take actions that are not favorable to our stockholders and may make it more difficult for us to successfully execute our business plan and compete against companies that are not subject to such restrictions and covenants.
We face numerous risks relating to the enforceability of our intellectual property rights and our use of third-party intellectual property, many of which could result in the loss of our intellectual property rights as well as other material adverse impacts on our business and financial results and condition.
We rely on a combination of contractual rights, trademarks, trade secrets, patents and copyrights to establish and protect our intellectual property rights in our technology and products. However, despite these measures, our intellectual property rights could be challenged, invalidated, circumvented or misappropriated. Competitors may independently develop technologies or products that are substantially equivalent or superior to our products or that inappropriately incorporate our proprietary technology into their products. Competitors may hire our former employees who may misappropriate our proprietary technology. Certain jurisdictions may not provide adequate legal infrastructure for effective protection of our intellectual property rights. Changing legal interpretations of liability for unauthorized use of our technologies or products or lessened sensitivity by corporate, government or institutional users to refraining from intellectual property piracy or other infringements of intellectual property could also harm our business. We also rely on key technologies developed or licensed by third parties, and we may not be able to obtain or renew such licenses from these third parties at all or on reasonable terms.
With respect to some of our proprietary technologies, we have filed patent applications and obtained patents to protect our intellectual property rights in these technologies as well as the interests of our licensees. There can be no assurance that our patent applications will be approved, that any patents issued will adequately protect our intellectual property rights, or that such patents will not be challenged by third parties or found by a judicial authority to be invalid or unenforceable.
We rely on several registered and unregistered trademarks to protect our brand. Third parties may use trademarks similar to our trademarks in different fields of use and any potential confusion as to the source of goods or services could have an adverse effect on our financial condition and results of operation.
The frequency, expense and risks of intellectual property litigation in the security market are increasing. Litigation may be necessary to enforce and protect our trade secrets, patents and other intellectual property rights. Similarly, we may be required to defend against claimed infringement.
In order to enforce and protect our intellectual property rights, it may be necessary for us to initiate litigation against third parties, such as patent infringement suits or interference proceedings. Any lawsuits that we initiate could be expensive, take significant time and divert management’s attention from other business concerns. Litigation also puts our patents at risk of being invalidated or interpreted narrowly and our patent applications at risk of not issuing. Additionally, we may provoke third parties to assert counterclaims against us. We may not prevail in any lawsuits that we initiate and the damages or other remedies awarded, if any, may not be commercially valuable. The occurrence of any of these events may adversely affect our financial condition and results of operations.
32
Table of Contents
Some of our products have been, and in the future could be, alleged to infringe existing patents of third parties. Even if we believe that such claims are without merit, we cannot be certain that we will prevail in any intellectual property dispute. Although we have been able to resolve some prior claims or potential claims without a material adverse affect on us, other claims have resulted in adverse decisions or settlements. For a further discussion of certain intellectual property disputes that are currently pending, see “Business—Legal Proceedings.”
The costs of defending litigation, and engaging in intellectual property litigation generally, may be substantial regardless of the merit of the claim or the outcome. Defending such intellectual property litigation can also distract management’s attention and resources. Successfully prosecuted claims of intellectual property infringement against us might also cause us to lose our proprietary rights, prevent us from manufacturing or selling our products, redesign affected products, require us to enter into costly settlement agreements or to obtain licenses to patents or other intellectual property rights that our products are alleged to infringe (licenses may not be available on reasonable commercial terms or at all), and subject us to significant liabilities, any of which would adversely affect our business, financial condition and results of operations.
The security technology industry has increasingly been subject to patent and other intellectual property rights litigation, particularly from special purpose or so-called “non-practicing” entities that seek to monetize their intellectual property rights by asserting claims against others. We expect this trend to continue and, as we become a larger and more visible company, we expect this trend may accelerate. The litigation process is costly and subject to inherent uncertainties, so we may not prevail in litigation matters regardless of the merits of our position.
In addition, because we incorporate technology from third parties in our products, our exposure to infringement actions may increase because we must rely upon these third parties to verify the origin and ownership of such technology. Even if we have an agreement to indemnify us against such costs, the indemnifying party may be unable to uphold its contractual obligations. If we cannot or do not license the infringed technology at all or on reasonable terms, or substitute similar technology from another source, our revenue and earnings could be adversely impacted.
If we are unable to protect the confidentiality of our proprietary information and know-how, the value of our products could be adversely affected.
In addition to patented technology, we rely on our unpatented proprietary technology, trade secrets, processes and know-how. We generally seek to protect this information by confidentiality, non-disclosure and assignment of invention agreements with our employees, consultants, scientific advisors and third parties. However, these agreements may be inadequate to protect our proprietary information and intellectual property rights. Moreover, those agreements may be breached, and we may not have adequate remedies for any such breach. In addition, our trade secrets may be disclosed to or otherwise become known or be independently developed by competitors. To the extent that our employees, consultants or contractors use intellectual property owned by others in their work for us, disputes may arise as to the rights in related or resulting know-how and inventions. If, for any of the above reasons, our intellectual property is disclosed or misappropriated, it would harm our ability to protect our intellectual property rights and adversely affect our financial condition.
We may be subject to claims that our employees or we have inadvertently or otherwise used or disclosed alleged trade secrets or other proprietary information of former employers of our employees.
We employ individuals who were previously employed at other technology companies, including our competitors or potential competitors. Therefore, we face exposure to infringement actions if those employees inadvertently or deliberately incorporate proprietary technology of our competitors into our products despite efforts by our competitors and us to prevent such misuse. Litigation may be necessary to defend against such claims, which could be costly and divert management’s attention.
33
Table of Contents
Indemnity provisions in various agreements potentially expose us to substantial liability for intellectual property infringement and other losses.
Our agreements with customers and channel partners include indemnification provisions under which we agree to indemnify them for losses suffered or incurred as a result of claims of intellectual property infringement and, in some cases, for damages caused by us to property or persons. The term of these indemnity provisions is generally perpetual after execution of the corresponding product sale agreement. Large indemnity payments could harm our business, operating results and financial condition. From time to time, we are requested by customers to indemnify them for matters that may involve our products even when there was no contractual obligation. Although we have not historically agreed to such requests, the existence of such a dispute with a customer may have adverse effects on our customer relationships and reputation.
Our tentative settlement of a stockholder class action suits requires the court’s preliminary and final approval, and may not be approved by the court.
In August 2006, certain of our former stockholders brought class action lawsuits against us in connection with prior alleged stock option backdating. Defending such litigation has been costly and has required significant management attention. On July 9, 2010, we entered into a binding term sheet that tentatively settles and resolves the consolidated class actions in exchange for a payment in the amount of $25.0 million. This tentative settlement requires final approval of the court before it becomes final, although the court has given preliminary approval. If the court does not approve the tentative settlement, the parties may elect or be required to continue litigating the matter. For a further description of these lawsuits, see “Business—Legal Proceedings.” There can also be no assurance that we would not be subject to similar lawsuits in the future.
Pending or future litigation could have a material adverse impact on our results of operation, financial condition and liquidity.
In addition to intellectual property litigation, from time to time, we have been, and may be in the future, subject to other litigation including stockholder derivative actions or actions brought by current or former employees. If we continue to make acquisitions in the future, we also are more likely to be subject to acquisition related stockholder derivative actions and actions resulting from the use of earn-outs, purchase price escrow holdbacks and other similar arrangements. Where we can make a reasonable estimate of the liability relating to pending litigation and determine that an adverse liability resulting from such litigation is probable, we record a related liability. To date, we have accrued approximately $28.3 million related to currently pending litigation matters. As additional information becomes available, we assess the potential liability and revise estimates as appropriate. However, because of the inherent uncertainties relating to litigation, the amount of our estimates could be wrong. In addition to the related cost and use of cash, pending or future litigation could cause the diversion of management’s attention. Managing, defending and indemnity obligations related to these actions have caused significant diversion of management’s and the board of directors’ time and resulted in material expense to us. See “Business—Legal Proceedings” for additional information with respect to certain currently pending legal matters.
Some of our products contain “open source” software, and any failure to comply with the terms of one or more of these open source licenses could negatively affect our business.
Certain of our products are distributed with software licensed by its authors or other third parties under “open source” licenses. Some of these licenses contain requirements that we make available our proprietary source code for modifications or derivative works we create based upon the open source software, and that we license such modifications or derivative works under the terms of a particular open source license or other license granting third parties certain rights of further use. If we combine our proprietary software with open source software in a certain manner, we could, under certain of the open source licenses, be required to release the source code of our proprietary software. In addition to risks related to license requirements, usage of open source software can lead to greater risks than use of third party commercial software, as open source licensors generally do not provide
34
Table of Contents
warranties or controls on origin of the software. We have established processes to help alleviate these risks, including a review process for screening requests from our development organizations for the use of open source, but we cannot be sure that all open source is submitted for approval prior to use in our products. In addition, many of the risks associated with usage of open source cannot be eliminated, as use of open source in our products could inadvertently occur, in part because open source license terms are often ambiguous. Companies that incorporate open source software into their products have, in the past, faced claims seeking enforcement of open source license provisions and claims asserting ownership of open source software incorporated into their products. Defending such claims or being required to disclose or make available our proprietary source code pursuant to an open source license could adversely affect our business.
Forecasting our estimated annual effective tax rate is complex and subject to uncertainty, and there may be material differences between our forecasted and actual tax rates.
Forecasts of our income tax position and effective tax rate for financial accounting purposes are complex and subject to uncertainty because our income tax position for each year combines the effects of a mix of profits earned and losses incurred by us in various tax jurisdictions with a broad range of income tax rates, as well as changes in the valuation of deferred tax assets and liabilities, the impact of various accounting rules and changes to these rules and tax laws, the results of examinations by various tax authorities, and the impact of any acquisition, business combination or other reorganization or financing transaction. To forecast our global tax rate, we estimate our pre-tax profits and losses by jurisdiction and forecast our tax expense by jurisdiction. If the mix of profits and losses, our ability to use tax credits, or effective tax rates by jurisdiction is different than those estimated, our actual tax rate could be materially different than forecasted, which could have a material impact on our results of business, financial condition and results of operations.
As a multinational corporation, we conduct our business in many countries and are subject to taxation in many jurisdictions. The taxation of our business is subject to the application of multiple and sometimes conflicting tax laws and regulations as well as multinational tax conventions. Our effective tax rate is highly dependent upon the geographic distribution of our worldwide earnings or losses, the tax regulations and tax holidays in each geographic region, the availability of tax credits and carry-forwards, and the effectiveness of our tax planning strategies. The application of tax laws and regulations is subject to legal and factual interpretation, judgment and uncertainty. Tax laws themselves are subject to change as a result of changes in fiscal policy, changes in legislation, and the evolution of regulations and court rulings. Consequently, taxing authorities may impose tax assessments or judgments against us that could materially impact our tax liability and/or our effective income tax rate.
In addition, we may be subject to examination of our income tax returns by the Internal Revenue Service and other tax authorities. If tax authorities challenge the relative mix of U.S. and international income, our future effective income tax rates could be adversely affected. While we regularly assess the likelihood of adverse outcomes from such examinations and the adequacy of our provision for income taxes, there can be no assurance that such provision is sufficient and that a determination by a tax authority will not have an adverse effect on our business, financial condition and results of operations.
We may not be able to utilize a significant portion of our net operating loss carry-forwards, which could adversely affect our operating results.
Due to losses recognized for federal and state income tax purposes in prior periods, we have generated significant federal and state net operating loss carry-forwards that may expire before we are able to utilize them. In addition, under U.S. federal and state income tax laws, if over a rolling three-year period, the cumulative change in our ownership exceeds 50%, our ability to utilize our net operating loss carry-forwards to offset future taxable income may be limited. Changes in ownership can occur due to transactions in our stock or the issuance of additional shares of our common stock or, in certain circumstances, securities convertible into our common stock. We have exceeded this 50% cumulative change threshold in prior periods, which has limited our ability to
35
Table of Contents
use a portion of our net operating loss carry-forwards. The effect of these transactions or future transactions on our cumulative change in ownership may further limit our ability to utilize our net operating loss carry-forwards to offset future taxable income. Furthermore, it is possible that transactions in our stock that may not be within our control may cause us to exceed the 50% cumulative change threshold and may impose a limitation on the utilization of our net operating loss carry-forwards in the future. Also, the existing net operating loss carry-forwards of corporations we have acquired may be subject to substantial limitations arising from ownership changes prior to or in connection with their acquisition by us or may expire prior to our ability to utilize them. In the event the usage of our net operating loss carry-forwards is subject to limitation and we are profitable, our operating results could be adversely affected.
If we fail to comply with environmental requirements, our business, financial condition, operating results and reputation could be adversely affected.
We are subject to various environmental laws and regulations including laws governing the hazardous material content of our products and laws relating to the recycling of electrical and electronic equipment. The laws and regulations to which we are subject include the European Union’s, or EU, Restriction of Hazardous Substances Directive, or RoHS, and Waste Electrical and Electronic Equipment Directive, or WEEE, as implemented by EU member states. Similar laws and regulations exist or are pending in other regions, including in the United States, and we are, or may in the future be, subject to these laws and regulations.
RoHS restricts the use of certain hazardous materials, including lead, mercury and cadmium, in the manufacture of certain electrical and electronic products, including some of our products. We have incurred, and expect to incur in the future, costs to comply with these laws, including research and development costs, costs associated with assuring the supply of compliant components and costs associated with writing off noncompliant inventory. Certain of our products are eligible for an exemption for lead used in network infrastructure equipment. If this exemption is revoked, or if there are other changes to RoHS (or its interpretation) or if similar laws are passed in other jurisdictions, we may be required to reengineer our products to use components compatible with these regulations. This reengineering and component substitution could result in additional costs to us or disrupt our operations or logistics.
WEEE requires producers of electrical and electronic equipment to be responsible for the collection, reuse, recycling and treatment of their products. Currently, our supply channel partners and suppliers are generally responsible for this requirement as they are often the importer of record. However, changes to WEEE and existing or future laws similar to WEEE may require us to incur additional costs in the future.
Any failure to comply with current and future laws could result in the incurrence of fines or penalties and could adversely affect the demand for or sales of our products.
Risks Related to this Offering
Because Vector Capital, through its ownership of Vector Stealth as well as through our related stockholders agreement, will continue to hold a controlling interest in us, the influence of our public stockholders over significant corporate actions will be limited.
After this offering, affiliates of Vector Capital will directly or indirectly own approximately % of our outstanding common stock through their ownership of Vector Stealth. As a result, after this offering, Vector Capital will continue to have the power to:
| • | control all matters submitted to our stockholders; |
| • | elect our directors; and |
| • | exercise control over our business, policies and affairs. |
36
Table of Contents
In addition, prior to the completion of this offering, we and Vector Stealth will enter into a stockholders’ agreement related to a number of board of director, stockholder and related governance matters. Such stockholders’ agreement will provide that Vector Stealth will have the right to designate a majority of the director nominees to our board of directors, subject to their beneficial ownership of at least 40% or more of the total outstanding shares of our capital stock. Vector Stealth will continue to have a right to designate director nominees to our board of directors to a lesser degree if their ownership percentage is between 7.5% and 40% of the total outstanding shares of our capital stock. In addition, stockholders will only be allowed to remove directors for cause, and our board of directors shall designate appointees to fill vacancies (subject to Vector Stealth’s rights to designate members of our board of directors). Furthermore, such stockholders’ agreement will also provide that the following actions by us or any of our subsidiaries require the approval of Vector Stealth for so long as Vector Stealth owns at least 30% or more of our outstanding shares of common stock:
| • | termination of our chief executive officer; |
| • | consummation of a change of control transaction; |
| • | entering into any agreement providing for acquisitions or divestitures for aggregate consideration in excess of the greater of (i) $50.0 million or (ii) 7.5% of our market capitalization (as determined at the end of each fiscal quarter); and |
| • | the incurrence of debt (excluding working capital revolvers and the refinancing of any then existing debt) of greater than $50.0 million in excess of our existing indebtedness following the application of proceeds from this offering to the repayment of all or a portion of our debt. |
Vector Stealth is not prohibited from selling a controlling interest in us to a third party.
Accordingly, our ability to engage in significant transactions, such as a merger, acquisition or liquidation, is limited without the consent of members of Vector Capital. Conflicts of interest could arise between us and Vector Capital, and any conflict of interest may be resolved in a manner that does not favor us. Vector Capital may continue to retain control of us for the foreseeable future and may decide not to enter into a transaction in which you would receive consideration for your common shares that is much higher than the cost to you or the then-current market price of those shares. In addition, Vector Capital could elect to sell a controlling interest in us and you may receive less than the then-current fair market value or the price you paid for your shares. Any decision regarding their ownership of us that Vector Capital may make at some future time will be in their absolute discretion.
In addition, pursuant to the terms of our certificate of incorporation, Vector Stealth and its affiliates have the right to, and have no duty to abstain from, exercising such right to, engage or invest in the same or similar business as us, do business with any of our clients, customers or vendors or employ or otherwise engage any of our officers, directors or employees. If Vector Stealth and its affiliates or any of their officers, directors or employees acquire knowledge of a potential transaction that could be a corporate opportunity, they have no duty to offer such corporate opportunity to us, our stockholders or affiliates. We have renounced any interest or expectancy in, or in being offered an opportunity to participate in, such corporate opportunities in accordance with Section 122(17) of the Delaware General Corporation Law. In the event that any of our directors and officers who is also a director, officer or employee of Vector Stealth or its affiliates acquires knowledge of a corporate opportunity or is offered a corporate opportunity, provided that this knowledge was not acquired solely in such person’s capacity as our director or officer and such person acted in good faith, then such person is deemed to have fully satisfied such person’s fiduciary duty and is not liable to us if Vector Stealth or its affiliates pursues or acquires such corporate opportunity or if such person did not present the corporate opportunity to us.
37
Table of Contents
Provisions in our certificate of incorporation and bylaws and under Delaware law might discourage, delay or prevent a change of control of our company or changes in our management and, therefore, depress the trading price of our common stock.
Our certificate of incorporation and bylaws contain provisions that could depress the trading price of our common stock by acting to discourage, delay or prevent a change of control of our company or changes in our management that our stockholders may deem advantageous. These provisions include:
| • | establishing a classified board of directors so that not all members of our board of directors are elected at one time; |
| • | authorizing “blank check” preferred stock that our board of directors could issue to increase the number of outstanding shares to discourage a takeover attempt; |
| • | limiting the ability of stockholders to call a special stockholder meeting to Vector Capital and its affiliates so long as they hold at least 15% of our outstanding common stock; |
| • | limiting the ability of stockholders to act by written consent to such periods during which Vector Capital and its affiliates control our company; |
| • | providing that the board of directors is expressly authorized to make, alter or repeal our bylaws; |
| • | establishing advance notice requirements for nominations for elections to our board of directors or for proposing matters that can be acted upon by stockholders at stockholder meetings; and |
| • | requiring the approval by holders of at least two-thirds of our outstanding capital stock entitled to vote generally in the election of directors to amend any of the foregoing provisions. |
We will be a “controlled company” within the meaning of the NASDAQ Marketplace rules and, as a result, will qualify for and will rely on exemptions from certain corporate governance requirements.
After completion of this offering, Vector Capital will continue to control a majority of the voting power of our outstanding common stock. As a result, we will be a “controlled company” within the meaning of the corporate governance standards of the NASDAQ Stock Market LLC. Under NASDAQ Marketplace rules, a company of which more than 50% of the voting power is held by another person or group of persons acting together is a “controlled company” and may elect not to comply with certain corporate governance requirements of the NASDAQ Stock Market LLC, including the requirements that:
| • | a majority of the board of directors consist of independent directors; |
| • | the nominating and corporate governance committee be composed entirely of independent directors with a written charter addressing the committee’s purpose and responsibilities; |
| • | the compensation committee be composed entirely of independent directors with a written charter addressing the committee’s purpose and responsibilities; and |
| • | there be an annual performance evaluation of the nominating and corporate governance and compensation committees. |
Following this offering, we intend to elect to be treated as a controlled company and utilize these exemptions, including the exemption for a board of directors composed of a majority of independent directors. In addition, although we will have adopted charters for our audit, nominating and corporate governance and compensation committees and intend to conduct annual performance evaluations for these committees, none of these committees will be composed entirely of independent directors immediately following the completion of this offering. We will rely on the phase-in rules of the SEC and the NASDAQ Stock Market LLC with respect to the audit committee. These rules permit us to have an audit committee that has one member that is independent upon the effectiveness of the registration statement of which this prospectus forms a part, a majority of members that are independent within 90 days thereafter and all members that are independent within one year thereafter. Accordingly, you may not have the same protections afforded to stockholders of companies that are subject to all of the corporate governance requirements of the NASDAQ Stock Market LLC.
38
Table of Contents
We cannot assure you that a market will develop for our common stock or what the market price of our common stock will be.
Prior to this offering, there was no public trading market for our common stock, and we cannot assure you that a liquid trading market will develop or be sustained after this offering. If such a market does not develop or is not sustained, it may be difficult for you to sell your shares of common stock at an attractive price or at all. We cannot predict the prices at which our common stock will trade.
The initial public offering price for our common stock will be determined through our negotiations with the underwriters, and may not bear any relationship to the market price at which our common stock will trade after this offering or to any other established criteria of the value of our business. The price of our common stock that will prevail in the market after this offering may be higher or lower than the price you pay, depending on many factors, many of which are beyond our control and may not be related to our operating performance. It is possible that, in future quarters, our operating results may be below the expectations of securities analysts or investors. As a result of these and other factors, the price of our common stock may decline, possibly materially. These fluctuations could cause you to lose all or part of your investment in our common stock. The public trading price for our common stock after this offering will be affected by a number of factors, including:
| • | price and volume fluctuations in the overall stock market from time to time; |
| • | volatility in the market price and trading volume of technology companies and of companies in our industry; |
| • | actual or anticipated changes or fluctuations in our operating results; |
| • | actual or anticipated changes in expectations regarding our performance by investors or securities analysts; |
| • | the failure of securities analysts to cover our common stock after this offering or changes in financial estimates by analysts; |
| • | actual or anticipated developments in our competitors’ businesses or the competitive landscape; |
| • | litigation involving us, our industry or both; |
| • | regulatory developments; |
| • | the budgeting, procurement and work cycles of our customers, including U.S. government agencies; |
| • | the impact on our sales caused by our customers’ budgetary constraints, competition, customer dissatisfaction, customer corporate restructuring or change in control, or our customers’ actual or perceived lack of need for our products and services; |
| • | the potential loss of significant customers; |
| • | the timing of impairments of goodwill or other intangibles; |
| • | our failure to accurately estimate or control costs—including those incurred as a result of acquisitions, investments and other business development initiatives; |
| • | general economic conditions and trends; |
| • | major catastrophic events; |
| • | sales of large blocks of our stock; |
| • | the timing and success of new product introductions or upgrades by us or our competitors; |
| • | changes in our pricing policies or payment terms or those of our competitors; |
| • | concerns relating to the security of our solutions; |
| • | our ability to expand our operations, domestically and internationally, and the amount and timing of expenditures related to this expansion; |
| • | our ability to protect our intellectual property and other proprietary rights; or |
| • | departures of key personnel. |
39
Table of Contents
In addition, the stock prices of many technology companies have experienced wide fluctuations that have often been unrelated to the operating performance of those companies.
In the past, following periods of volatility in the market price of a company’s securities, securities class action litigation has often been brought against that company. If our stock price is volatile, we may become the target of securities litigation, which could result in substantial costs and divert our management’s attention and resources from our business.
Our stock price could decline due to the large number of outstanding shares of our common stock eligible for future sale.
Sales of substantial amounts of our common stock in the public market following this offering, or the perception that these sales could occur, could cause the market price of our common stock to decline. These sales could also make it more difficult for us to sell equity or equity-related securities in the future at a time and price that we deem appropriate.
Upon completion of this offering, we will have outstanding shares of common stock based on the number of shares outstanding on September 30, 2010 and assuming no exercise of the underwriters’ over-allotment option and no exercise of outstanding options after September 30, 2010. The shares sold pursuant to this offering will be immediately tradable without restriction. Of the remaining shares:
| • | no shares will be eligible for sale immediately upon completion of this offering; |
| • | shares will become eligible for sale, subject to the provisions of Rule 144 or Rule 701, upon the expiration of agreements not to sell such shares entered into between the underwriters and such stockholders beginning 180 days after the date of this prospectus, subject to extension in certain circumstances; and |
| • | additional shares will be eligible for sale from time to time thereafter upon expiration of their respective one-year holding periods, but could be sold earlier if the holders exercise any available registration rights. |
We and all of our directors and officers, as well as the selling stockholder, have agreed that, without the prior written consent of Morgan Stanley & Co. Incorporated, Goldman, Sachs & Co. and J.P. Morgan Securities LLC on behalf of the underwriters, we and they will not, during the period ending 180 days after the date of this prospectus:
| • | offer, pledge, sell, contract to sell, sell any option or contract to purchase, purchase any option or contract to sell, grant any option, right or warrant to purchase, lend, or otherwise transfer or dispose of, directly or indirectly, any shares of our common stock or securities convertible into or exercisable or exchangeable for our common stock; or |
| • | enter into any swap or other arrangement that transfers to another, in whole or in part, any of the economic consequences of ownership of our common stock; |
whether any transaction described above is to be settled by delivery of shares of our common stock or such other securities, in cash or otherwise. This agreement is subject to certain exceptions, and is also subject to extension for up to an additional 34 days, as set forth in the section entitled “Underwriters.”
The representatives of the underwriters may, in their sole discretion and at any time without notice, release all or any portion of the securities subject to lock-up agreement. After the closing of this offering, we intend to register approximately shares of common stock that have been reserved for future issuance under our stock incentive plans.
No later than upon the expiration of the lock-up agreements entered into in connection with this public offering or 181 days after this initial public offering, whichever date is later, we shall file a shelf registration statement
40
Table of Contents
with the SEC covering the resale of all of our registrable securities held by Vector Stealth. We shall use our best efforts to cause such shelf registration statement to become effective on or prior to the 90th day following the filing of the shelf registration statement and to keep such shelf registration statement in effect until all of the registrable securities held by Vector Stealth have been resold. In addition, beginning six months after the completion of this initial public offering, Vector Stealth will have two (2) demand registration rights, which, when and if exercised, will require us to register shares of the common stock held by Vector Stealth with the SEC for sale by them to the public. We are not obligated to file a registration statement relating to any request to register shares pursuant to such demand registration rights within a period of 180 days after the effective date of any other registration statement we file pursuant to such demand registration rights (including the registration statement of which this prospectus is a part). In addition, we are required to give notice of registration of shares held by Vector Stealth to all members of our executive management who receive shares of common stock in exchange for their interests in Vector Stealth formerly held by them, and such persons have so-called “piggyback” registration rights providing them the right to have us include the shares of common stock owned by them in any such registration.
The filing of this shelf registration statement and the existence or exercise of these registration rights may result in the perception of or actual sales of substantial amounts of our common stock in the public market following this offering, which may make it difficult for us to raise additional capital.
Our management will have broad discretion over the use of the proceeds from this offering and may not apply the proceeds of this offering in ways that increase the value of your investment.
Our management will have broad discretion to use the net proceeds we receive from this offering, and you will be relying on its judgment regarding the application of these proceeds. We expect to use the net proceeds from this offering as described under the heading “Use of Proceeds.” However, management may not apply the net proceeds of this offering in ways that increase the value of your investment.
If you purchase shares of our common stock in this offering, you will experience substantial and immediate dilution.
If you purchase shares of our common stock in this offering, you will experience substantial and immediate dilution of $ per share based on an assumed initial public offering price of $ per share, the mid-point of the range shown on the cover of this prospectus, because the price that you pay will be substantially greater than the net tangible book value per share of the common stock that you acquire. This dilution is due in large part to the fact that our earlier investors paid substantially less than the initial public offering price when they purchased their shares of our capital stock. You will experience additional dilution upon the exercise of options to purchase common stock under our equity incentive plans, if we issue restricted stock to our employees under these plans or if we otherwise issue additional shares of our common stock. See “Dilution.”
Since we do not expect to pay any dividends for the foreseeable future, investors in this offering may be forced to sell their stock in order to realize a return on their investment.
We do not anticipate that we will pay any dividends to holders of our common stock for the foreseeable future. Any payment of cash dividends will be at the discretion of our board of directors and will depend on our financial condition, capital requirements, legal requirements, earnings and other factors. Our ability to pay dividends is restricted by the terms of our senior secured credit facilities and might be restricted by the terms of any indebtedness that we incur in the future. Consequently, you should not rely on dividends in order to receive a return on your investment. See “Dividend Policy.”
41
Table of Contents
CAUTIONARY NOTE REGARDING FORWARD-LOOKING STATEMENTS
AND INDUSTRY DATA
This prospectus contains forward-looking statements. These statements may relate to, but are not limited to, expectations of future operating results or financial performance, capital expenditures, use of proceeds from this offering, introduction of new products, regulatory compliance, plans for growth and future operations, as well as assumptions relating to the foregoing. Forward-looking statements are inherently subject to risks and uncertainties, some of which cannot be predicted or quantified. These risks and other factors include, but are not limited to, those listed under “Risk Factors.” In some cases, you can identify forward-looking statements by terminology such as “may,” “will,” “should,” “could,” “expect,” “plan,” “anticipate,” “believe,” “estimate,” “predict,” “intend,” “potential,” “might,” “would,” “continue” or the negative of these terms or other comparable terminology. Actual events or results may differ from those expressed in these forward-looking statements, and these differences may be material and adverse.
We believe that it is important to communicate our future expectations to our investors. However, there may be events in the future that we are not able to accurately predict or control and that may cause our actual results to differ materially from the expectations we describe in our forward-looking statements. Except as required by applicable law, including the securities laws of the United States and the rules and regulations of the SEC, we do not plan to publicly update or revise any forward-looking statements after we distribute this prospectus, whether as a result of any new information, future events or otherwise. Potential investors should not place undue reliance on our forward-looking statements. Before you invest in our common stock, you should be aware that the occurrence of any of the events described in the “Risk Factors” section and elsewhere in this prospectus could harm our business, prospects, operating results and financial condition.
This prospectus also contains estimates and other information concerning our industry, including market size and growth rates of the markets in which we participate, that are based on industry publications, surveys and forecasts, including those generated by IDC and INPUT. This information involves a number of assumptions and limitations, and you are cautioned not to give undue weight to these estimates. The industry in which we operate is subject to a high degree of uncertainty and risk due to a variety of factors, including those described in “Risk Factors.” These and other factors could cause actual results to differ from those expressed in these publications, surveys and forecasts.
42
Table of Contents
We estimate that the net proceeds we receive in this offering will be approximately $ million, based on an assumed initial public offering price of $ per share, the mid-point of the range on the front cover of this prospectus, after deducting underwriting discounts and commissions and estimated offering expenses payable by us. If we were to price the offering at $ per share, the low end of the range on the cover of this prospectus, we estimate that we would receive net proceeds of $ million, assuming the total number of shares offered by us remains the same and after deducting underwriting discounts and commissions and estimated offering expenses payable by us. If we were to price the offering at $ per share, the high end of the range on the cover of this prospectus, then we estimate that we would receive net proceeds of $ million, assuming the total number of shares offered by us remains the same and after deducting underwriting discounts and commissions and estimated offering expenses payable by us.
If the underwriters’ option to purchase additional shares in this offering from us is exercised, our estimated net proceeds will be approximately $ million after deducting the estimated underwriting discounts and commissions and estimated offering expenses payable by us. We will not receive any proceeds from any sale of shares of our common stock by the selling stockholder in this offering.
We currently intend to use the net proceeds of this offering for the following purposes and in the following amounts:
| • | approximately $ million will be used to repay a portion of the amount outstanding under our senior secured credit arrangements, a portion of which is held by an affiliate of Vector Stealth, which include our first lien term loan facility maturing April 12, 2014, our second lien term loan facility maturing April 12, 2015, and our revolving credit facility expiring April 12, 2013. We expect to repay approximately $ million of our first lien term loan facility, approximately $ million of our second lien term loan facility, $ million of our interest rate swap agreement, and any amounts then outstanding under our revolving credit facility, which presently has no balance. As of September 30, 2010, the average interest rate on our first lien term loan and the revolving credit facility was approximately 3.0%, and the average interest rate on our second lien term loan was approximately 6.3%. In addition, we hold a variable rate interest rate swap agreement on $200.0 million of outstanding debt that replaces the three-month variable rate LIBOR with 5.21% fixed interest. In March 2010, we borrowed an aggregate of $15.0 million under our revolving credit facility to partially fund the retirement of debt in connection with consummating the combination with Aladdin. As of September 30, 2010, no balance remained outstanding on this revolving credit facility. As more fully described in “Certain Relationships and Related Person Transactions—Transactions and Relationships with Directors, Officers and 5% Stockholders—Transactions and Relationships with Vector Stealth and its Affiliates—Term Loan,” an affiliate of Vector Stealth holds approximately $2.5 million in face value of the second lien debt, of which a total of approximately $131.0 million was outstanding on September 30, 2010. Upon consummation of the offering and application of the net proceeds, we currently intend for the portion of the second lien debt held by such affiliate of Vector Stealth to be repaid in full together with the other second lien debt. The selection of which indebtedness obligations, the amounts to be repaid with respect to specific indebtedness obligations, the timing of repayment and the particular method by which we effect repayment, have not yet been determined and will depend, among other things, on market conditions; |
| • | approximately $ million will be paid to Vector Capital Partners III, L.P., an affiliate of Vector Stealth, in connection with the termination of our management services agreement pursuant to its terms. See “Certain Relationships and Related Person Transactions—Transactions and Relationships with Vector Stealth and its Affiliates”; and |
| • | the remainder of the net proceeds will be used for general corporate purposes, including working capital and capital expenditures. We may also use a portion of the proceeds for expansion of our current business |
43
Table of Contents
| through acquisitions or investments in other complementary strategic businesses, products or technologies. We have no commitments with respect to any acquisitions at this time. We will have broad discretion in the way we use the net proceeds. |
An underwriter holds a portion of our senior secured credit arrangements. As a result, such underwriter or its affiliates may receive part of the proceeds of the offering by reason of the repayment of a portion of the amount outstanding under our senior secured credit arrangements. See “Underwriting.”
We intend to invest the net proceeds in short- and intermediate-term interest-bearing obligations, investment-grade instruments, certificates of deposit or guaranteed obligations of the U.S. government, pending their use as described above.
Prior to our acquisition by Vector Stealth in April 2007, we had not paid dividends on our capital stock. We have not declared or paid recurring dividends since that date. However, our board of directors declared special dividends on our outstanding common stock of $9.0 million in 2008 and $3.0 million in 2009 with cash generated from operations.
Following completion of this offering, we have no current plans to pay any cash dividends on our common stock for the foreseeable future and instead may retain earnings, if any, for future operation, expansion and debt repayment. Any decision to declare and pay dividends in the future will be made at the discretion of our board of directors and will depend on, among other things, our results of operations, cash requirements, financial condition, contractual restrictions and other factors that our board of directors may deem relevant. In addition, our ability to pay dividends is currently limited by covenants in our secured credit agreements.
44
Table of Contents
The following table sets forth our cash and cash equivalents and our overall capitalization as of September 30, 2010:
| • | on an actual basis without any adjustments to reflect subsequent or anticipated events; |
| • | on an as-adjusted basis to give effect to the issuance of common stock in this offering and the application of proceeds from the offering as described in “Use of Proceeds” as if each had occurred on September 30, 2010. |
You should read this table in conjunction with “Management’s Discussion and Analysis of Financial Condition and Results of Operations” and our consolidated financial statements and related notes included elsewhere in this prospectus.
| As of September 30, 2010 | ||||||||
| Actual | As Adjusted(1) | |||||||
| (in millions, except share and per share data) |
||||||||
| (Unaudited) | ||||||||
| Cash and cash equivalents |
$ | 43.5 | $ | |||||
| Long-term obligations: |
||||||||
| First lien term loans, including current portion |
$ | 241.9 | $ | |||||
| Second lien term loans |
131.0 | |||||||
| Stockholders’ equity: |
||||||||
| Preferred stock, $0.001 par value per share; no shares authorized, issued or outstanding, actual; 5,000,000 shares authorized, no shares issued and outstanding, as adjusted |
— | — | ||||||
| Common stock, $0.001 par value per share; 200,000,000 shares authorized actual, 500,000,000 shares authorized as adjusted; and 151,761,840 shares issued and outstanding actual and shares issued and outstanding as adjusted |
0.2 | |||||||
| Additional paid-in capital |
367.6 | |||||||
| Accumulated other comprehensive loss |
(17.6 | ) | ||||||
| Accumulated deficit |
(222.3 | ) | ||||||
| Total stockholders’ equity |
127.9 | |||||||
| Total capitalization |
$ | 500.8 | $ | |||||
| (1) | Adjustments made to the “Actual” column to arrive at the “As Adjusted” column are as follows: |
| • | Decrease in long-term obligations of $ million in the aggregate based upon repayment of a portion of the amount outstanding under our senior secured credit arrangements. |
| • | Increase in common stock of $ million based upon the issuance of million shares with a par value of $0.001 per share. |
| • | Increase in additional paid in capital of $ million based upon the portion of the net proceeds of the offering attributable to paid in capital, equal to $ million. |
| • | Decrease in retained earnings of $ million based upon (a) losses, net of income taxes, on the repayment of all or portions of amounts outstanding under our senior secured credit arrangements, a portion of which is held by an affiliate of Vector Stealth, which include our first lien term loan facility maturing April 12, 2014, our second lien term loan facility maturing April 12, 2015, and our revolving credit facility expiring April 12, 2013 (including the premium paid, the write-off of the related debt acquisition costs, and the write-off of the related discount) and (b) the expense, net of income taxes, of the fee of approximately $ million to be paid to Vector Capital Partners III, L.P., an affiliate of Vector Stealth, in connection with the termination of our management services agreement pursuant to its terms. |
The preceding table is based on the number of shares of our common stock outstanding as of September 30, 2010. This table does not reflect:
| • | shares of common stock issuable upon exercise of options outstanding under our 2007 Equity Plan at a weighted-average exercise price of $ per share; and |
| • | shares of common stock reserved for future issuance under our 2010 Equity Incentive Plan. |
45
Table of Contents
If you invest in our common stock, your interest will be diluted to the extent of the difference between the public offering price per share of our common stock and the as adjusted net tangible book value per share of our common stock after this offering. Our net tangible book value as of September 30, 2010 was $(371.2) million, or $(2.45) per share of common stock. Net tangible book value per share represents total tangible assets less total liabilities, divided by the number of shares of common stock outstanding. After giving effect to the sale by us of shares of our common stock in this offering at the assumed initial public offering price of $ per share, the mid-point of the range on the front cover of this prospectus, and after deducting the underwriting discounts and commissions and our estimated offering expenses, our as adjusted net tangible book value as of September 30, 2010 would have been $ million, or $ per share. This represents an immediate increase in net tangible book value of $ per share to our existing stockholders and an immediate dilution of $ per share to our new investors purchasing shares of common stock in this offering. The following table illustrates this dilution on a per share basis:
| Assumed initial public offering price per share |
$ | |||||||
| Actual net tangible book value per share as of September 30, 2010 |
$ | (2.45 | ) | |||||
| Increase in actual net tangible book value per share attributable to this offering per share to existing investors |
||||||||
| As adjusted net tangible book value per share after this offering |
||||||||
| Dilution per share to new investors |
$ | |||||||
A $1.00 increase (decrease) in the assumed initial public offering price of $ per share, which is the mid-point of the price range on the front cover of this prospectus, would increase (decrease) our as adjusted net tangible book value per share after this offering by $ and increase (decrease) the dilution to new investors in this offering by $ .
The following table illustrates the differences between the number of shares of common stock purchased from us, the total consideration paid, and the average price per share paid by existing stockholders and new investors purchasing shares of our common stock in this offering based on an assumed initial public offering price of $ per share, the mid-point of the range on the front cover of this prospectus, and before deducting underwriting discounts and commissions and estimated offering expenses as of September 30, 2010 on an as adjusted basis.
| Shares Purchased | Total Consideration | Average Price Per Share |
||||||||||||||||||
| Number | Percent | Amount | Percent | |||||||||||||||||
| Existing Investors |
% | $ | % | $ | ||||||||||||||||
| New Investors |
||||||||||||||||||||
| Total |
% | $ | % | $ | ||||||||||||||||
A $1.00 increase (decrease) in the assumed initial public offering price of $ per share, which is the mid-point of the price range on the front cover of this prospectus, would increase (decrease) total consideration paid by new investors in this offering and by all investors by $ , and would increase (decrease) the average price per share paid by new investors by $1.00, assuming the number of shares of common stock offered by us, as set forth on the front cover of this prospectus, remains the same and without deducting the estimated underwriting discounts and offering expenses payable by us in connection with this offering.
If the underwriters exercise their over-allotment option in full, the percentage of shares of common stock held by existing stockholders will decrease to approximately % of the total number of shares of our common stock outstanding after this offering, and the number of shares held by new investors will be increased to , or approximately % of the total number of shares of our common stock outstanding after this offering.
46
Table of Contents
The preceding table excludes, as of September 30, 2010:
| • | shares of common stock issuable upon exercise of options outstanding under our 2007 Equity Plan at a weighted-average exercise price of $ per share; and |
| • | shares of common stock reserved for future issuance under our 2010 Equity Incentive Plan. |
47
Table of Contents
UNAUDITED PRO FORMA CONDENSED CONSOLIDATED FINANCIAL
INFORMATION
The following unaudited pro forma condensed consolidated financial information for the period indicated below have been derived by the application of pro forma adjustments that give effect to (a) the March 24, 2009 acquisition by an affiliate of Vector Capital of all the ordinary issued and outstanding share capital of Aladdin for $164.1 million in cash and (b) borrowings of $50.0 million to finance the acquisition of Aladdin. The unaudited pro forma condensed consolidated statement of operations for the year ended December 31, 2009 gives effect to the acquisition of Aladdin as if it occurred on January 1, 2009.
The unaudited pro forma condensed consolidated statement of operations for the year ended December 31, 2009 has been prepared based on our historical condensed consolidated statement of operations for the year ended December 31, 2009 and the historical condensed consolidated statement of operations of Aladdin from January 1, 2009 through March 23, 2009. The unaudited pro forma adjustments are based upon available information and assumptions that we believe are reasonable under the circumstances.
The unaudited pro forma condensed consolidated financial information is presented for informational purposes only and does not purport to represent the financial position and results of operations that would have been achieved had the acquisition been completed as of the dates indicated or our future financial position or results of operations. The unaudited pro forma condensed consolidated financial information should be read in conjunction with our consolidated financial statements included elsewhere in this prospectus. Note 3 of the our consolidated financial statements includes further description of the accounting for the acquisition of Aladdin, assumptions used to value the acquired assets and liabilities and recorded goodwill.
Unaudited Pro Forma Condensed Consolidated Statement of Operations Data
Year Ended December 31, 2009
(dollars in millions, except per share data)
| SafeNet Holding Corporation Twelve Months Ended December 31, 2009 |
Aladdin Period of January 1, to March 23, 2009 |
Pro Forma Adjustments |
Notes | Pro Forma Consolidated |
||||||||||||||||
| Net revenues |
$ | 403.7 | $ | 22.8 | $ | — | $ | 426.5 | ||||||||||||
| Cost of revenues |
184.2 | 7.7 | 1.1 | A | 193.0 | |||||||||||||||
| Gross profit |
219.5 | 15.1 | (1.1 | ) | 233.5 | |||||||||||||||
| Operating expenses |
241.5 | 27.2 | (6.9 | ) | B | 261.9 | ||||||||||||||
| Operating income (loss) |
(22.0 | ) | (12.1 | ) | 5.8 | (28.4 | ) | |||||||||||||
| Other (loss) |
(28.6 | ) | (1.3 | ) | (2.9 | ) | C | (32.7 | ) | |||||||||||
| (Loss) before income taxes |
(50.6 | ) | (13.4 | ) | 2.9 | (61.1 | ) | |||||||||||||
| Income tax (benefit) expense |
(0.9 | ) | 0.2 | 0.9 | D | 0.2 | ||||||||||||||
| Net (loss) |
$ | (49.7 | ) | $ | (13.6 | ) | $ | 2.0 | $ | (61.3 | ) | |||||||||
| Earnings per share |
||||||||||||||||||||
| Basic and diluted |
|
$ | (0.41 | ) | ||||||||||||||||
| Weighted average shares outstanding (shares in thousands) |
||||||||||||||||||||
| Basic and diluted |
|
147,877 | ||||||||||||||||||
48
Table of Contents
The following pro forma adjustments are included in our unaudited pro forma condensed consolidated statements of operations:
| A. | Represents the increase in amortization expense associated with technology intangible assets reflecting the additional amortization expense that would have been incurred if the acquisition had been completed on January 1, 2009. The technology intangible asset was valued at $30.1 million and is being amortized over seven years on an accelerated basis. |
| B. | Represents: |
| a. | Adjustment to reverse $6.5 million of transaction costs that were paid by Aladdin associated with the acquisition of Aladdin by an entity affiliated with Vector Capital in 2009. These are one time costs directly related to the acquisition, which are therefore excluded; and |
| b. | Adjustment to record $0.4 million of stock-based compensation expense relating to the acceleration of options resulting from the acquisition of Aladdin. These are one time costs directly related to the acquisition, and therefore are excluded. |
| C. | Represents: |
| a. | $0.8 million of interest expense on the $50.0 million long-term debt borrowed for the acquisition of Aladdin, reflecting the additional interest expense that would have been incurred had the debt agreement been entered into on January 1, 2009. Interest rates under the new Aladdin debt bore an interest rate of either (i) the Base Rate plus 1.50% or (ii) LIBOR plus 3.50%, which was 6.0% throughout the period from March 24, 2009 to December 31, 2009. Aladdin did not carry any debt prior to its acquisition by Vector Capital. An increase in the interest rate by 1/8% would change each of pro forma interest expense and pro forma net income by $0.1 million during the period from January 1, 2009 to March 23, 2009; and |
| b. | $2.1 million reversal of realized gain on Aladdin shares as a result of the purchase of the remaining 86% interest in Aladdin by an entity affiliated with Vector Capital on March 24, 2009. Accounting rules require that any interest held in an acquired entity be remeasured to fair value at the time control is obtained. This gain is deemed one time and directly related to the acquisition. |
| D. | Represents the net of tax expenses of pro forma increase in intangible assets amortization and incremental tax expense attributable to pro forma reversal of transaction costs paid by Aladdin associated with our acquisition of Aladdin using a statutory tax rate of 17%. |
49
Table of Contents
SELECTED CONSOLIDATED FINANCIAL DATA
You should read the selected consolidated financial data set forth below in conjunction with our consolidated financial statements, the notes to our consolidated financial statements and “Management’s Discussion and Analysis of Financial Condition and Results of Operations” contained elsewhere in this prospectus.
Pursuant to our acquisition on April 12, 2007 by Vector Stealth, our consolidated financial statements and notes included elsewhere and referenced in this prospectus present information relating to both a “Predecessor” and “Successor” entity. We refer to the period prior to April 12, 2007 as the “Predecessor Period” and the period from April 12, 2007 as the “Successor Period.”
The financial data as of December 31, 2008 and 2009, for the period from January 1 through April 11, 2007 of the Predecessor Period, for the period from April 12 through December 31, 2007 of the Successor Period and for the years ended December 31, 2008 and 2009 have been derived from our audited consolidated financial statements that are included elsewhere in this prospectus. The selected historical consolidated financial data as of December 31, 2006 and 2007 and for the year ended December 31, 2006 have been derived from audited consolidated financial information not included in this prospectus. The selected consolidated financial data as of December 31, 2005 and for the year ended December 31, 2005 have been derived from our unaudited consolidated financial statements that are not included elsewhere in this prospectus.
The financial data as of September 30, 2010 and for the nine months ended September 30, 2009 and 2010 have been derived from our unaudited interim consolidated financial statements included elsewhere in this prospectus. We have prepared this unaudited financial information on the same basis as the audited consolidated financial statements and have included all adjustments, consisting only of normal recurring adjustments, that we consider necessary for a fair presentation of our financial position and operating results for such period. Our historical results are not necessarily indicative of results to be expected for future periods. Results for the nine months ended September 30, 2010 are not necessarily indicative of results expected for the full year.
The pro forma basic and diluted earnings per share for the year ended December 31, 2009 and nine months ended September 30, 2010 are unaudited and reflect the pro forma effect of the issuance of additional shares by us in this offering at an assumed price of $ per share, the midpoint of the range of the front cover of this prospectus, which amount represents the proportionate number of shares allocated to the repayment of outstanding indebtedness and related prepayment fees, and the application of the net proceeds of this offering to repay $ million in principal amount of outstanding indebtedness and related prepayment fees, as if the offering and repayment of outstanding indebtedness had occurred at the beginning of the respective period. As a result of this repayment of indebtedness, our net loss would have decreased by approximately $ million and $ million, respectively, for the year ended December 31, 2009 and the nine months ended September 30, 2010, primarily driven by a decrease in interest expense of approximately $ million and $ million, respectively, as well as a decrease in deferred financing costs of approximately $ million and $ million, respectively. See “Use of Proceeds” in this prospectus for additional details.
50
Table of Contents
| Predecessor Period | Successor Period | |||||||||||||||||||||||||||||||||||
| Year Ended December 31, |
Period from January 1,2007 to April 11, 2007 |
Period
from April 12,2007 to December 31, 2007 |
Year Ended December 31, |
Nine
Months Ended September 30, |
||||||||||||||||||||||||||||||||
| 2005 | 2006 | 2008 | 2009 | 2009 | 2010 | |||||||||||||||||||||||||||||||
| (unaudited) | (unaudited) | |||||||||||||||||||||||||||||||||||
| (dollars in millions, except per share data) |
(dollars in millions, except per share data) |
|||||||||||||||||||||||||||||||||||
| Consolidated Statement of Operations Data: |
||||||||||||||||||||||||||||||||||||
| Revenues: |
||||||||||||||||||||||||||||||||||||
| Products |
$ | 228.3 | $ | 252.3 | $ | 63.7 | $ | 197.2 | $ | 283.6 | $ | 348.7 | $ | 254.6 | $ | 283.9 | ||||||||||||||||||||
| Service and maintenance |
21.5 | 34.5 | 10.1 | 29.2 | 45.4 | 55.0 | 39.3 | 50.2 | ||||||||||||||||||||||||||||
| Total revenues |
249.8 | 286.8 | 73.8 | 226.4 | 329.0 | 403.7 | 293.9 | 334.1 | ||||||||||||||||||||||||||||
| Costs of revenues: |
||||||||||||||||||||||||||||||||||||
| Products (excluding amortization and impairment of intangible assets) |
113.3 | 131.6 | 34.1 | 91.1 | 128.7 | 141.9 | 105.5 | 117.6 | ||||||||||||||||||||||||||||
| Service and maintenance (excluding amortization and impairment of intangible assets) |
6.2 | 7.9 | 2.5 | 7.1 | 11.5 | 10.4 | 7.7 | 10.3 | ||||||||||||||||||||||||||||
| Amortization and impairment of intangibles assets |
14.2 | 13.1 | 3.7 | 26.4 | 117.2 | 31.9 | 23.7 | 24.6 | ||||||||||||||||||||||||||||
| Total cost of revenues |
133.7 | 152.7 | 40.3 | 124.6 | 257.4 | 184.2 | 136.9 | 152.5 | ||||||||||||||||||||||||||||
| Gross profit |
116.1 | 134.2 | 33.5 | 101.8 | 71.6 | 219.5 | 157.0 | 181.6 | ||||||||||||||||||||||||||||
| Operating expenses: |
||||||||||||||||||||||||||||||||||||
| Research and development expenses |
34.3 | 39.8 | 19.3 | 34.0 | 47.9 | 60.6 | 47.5 | 45.4 | ||||||||||||||||||||||||||||
| Sales and marketing expenses |
51.5 | 53.0 | 21.6 | 35.3 | 56.6 | 81.5 | 57.5 | 70.9 | ||||||||||||||||||||||||||||
| General and administrative expenses |
30.6 | 53.3 | 41.1 | 33.8 | 47.2 | 56.0 | 42.7 | 40.3 | ||||||||||||||||||||||||||||
| Class action settlement |
— | — | — | — | — | 25.0 | |
— |
|
— | ||||||||||||||||||||||||||
| Amortization of intangible assets |
9.1 | 7.8 | 1.9 | 5.1 | 6.8 | 10.4 | 7.6 | 7.5 | ||||||||||||||||||||||||||||
| Impairment of goodwill |
— | — | — | — | 42.9 | — | — | — | ||||||||||||||||||||||||||||
| Loss on sale of business and net assets held for sale |
— | — | — | — | — | 2.5 | 1.5 | 0.7 | ||||||||||||||||||||||||||||
| Restructuring expenses |
2.4 | 0.2 | — | — | — | 5.5 | 3.1 | 0.2 | ||||||||||||||||||||||||||||
| Operating (loss) income |
(11.8 | ) | (19.9 | ) | (50.4 | ) | (6.4 | ) | (129.8 | ) | (22.0 | ) | (2.9 | ) | 16.6 | |||||||||||||||||||||
| Foreign exchange gain (loss) |
1.2 | (1.5 | ) | (0.3 | ) | — | (2.5 | ) | (0.9 | ) | (0.8 | ) | 0.6 | |||||||||||||||||||||||
| Interest income (expense), net |
4.1 | (5.6 | ) | 0.9 | (24.1 | ) | (34.2 | ) | (30.3 | ) | (23.0 | ) | (21.9 | ) | ||||||||||||||||||||||
| Other income (expense), net |
0.4 | 5.7 | — | 0.2 | 0.8 | 2.6 | 2.5 | (0.4 | ) | |||||||||||||||||||||||||||
| (Loss) before income taxes |
(6.1 | ) | (21.3 | ) | (49.8 | ) | (30.3 | ) | (165.7 | ) | (50.6 | ) | (24.2 | ) | (5.1 | ) | ||||||||||||||||||||
| Income tax expense (benefit) |
4.2 | 7.0 | 1.0 | 7.0 | (39.2 | ) | (0.9 | ) | 0.1 | 3.6 | ||||||||||||||||||||||||||
| Net (loss) |
$ | (10.3 | ) | $ | (28.3 | ) | $ | (50.8 | ) | $ | (37.3 | ) | $ | (126.5 | ) | $ | (49.7 | ) | $ | (24.3 | ) | $ | (8.7 | ) | ||||||||||||
| Net loss per common share: |
||||||||||||||||||||||||||||||||||||
| Basic |
$ | (0.42 | ) | $ | (1.31 | ) | $ | (2.41 | ) | $ | (0.41 | ) | $ | (1.10 | ) | $ | (0.34 | ) | $ | (0.16 | ) | $ | (0.06 | ) | ||||||||||||
| Diluted |
(0.40 | ) | (1.31 | ) | (2.41 | ) | (0.41 | ) | (1.10 | ) | (0.34 | ) | (0.16 | ) | (0.06 | ) | ||||||||||||||||||||
| Weighted average common shares outstanding (in thousands): |
||||||||||||||||||||||||||||||||||||
| Basic |
24,751 | 22,435 | 21,107 | 90,505 | 115,233 | 147,877 | 147,877 | 150,991 | ||||||||||||||||||||||||||||
| Diluted |
25,659 | 22,435 | 21,107 | 90,505 | 115,233 | 147,877 | 147,877 | 150,991 | ||||||||||||||||||||||||||||
| Unaudited pro forma net loss per common share: |
||||||||||||||||||||||||||||||||||||
| Basic and diluted |
$ | $ | $ | |||||||||||||||||||||||||||||||||
| Unaudited pro forma weighted average common shares outstanding (in thousands): |
||||||||||||||||||||||||||||||||||||
| Basic and diluted |
||||||||||||||||||||||||||||||||||||
51
Table of Contents
The following table presents consolidated balance sheet data as of December 31, 2005, 2006, 2007, 2008 and 2009 and September 30, 2010.
| Predecessor Period | Successor Period | |||||||||||||||||||||||||||
| December 31, | December 31, | September
30, 2010 |
||||||||||||||||||||||||||
| 2005 | 2006 | 2007 | 2008 | 2009 | ||||||||||||||||||||||||
| (unaudited) | (unaudited) | |||||||||||||||||||||||||||
| (in millions) | (in millions) | |||||||||||||||||||||||||||
| Consolidated Balance Sheet Data: |
||||||||||||||||||||||||||||
| Cash and cash equivalents |
$ | 341.1 | $ | 85.4 | $ | 40.7 | $ | 22.6 | $ | 45.9 | $ | 43.5 | ||||||||||||||||
| Total current assets |
439.6 | 171.4 | 130.0 | 129.5 | 177.5 | 179.9 | ||||||||||||||||||||||
| Total assets |
919.5 | 624.6 | 738.4 | 589.1 | 759.3 | 726.8 | ||||||||||||||||||||||
| Total current liabilities |
80.9 | 87.5 | 98.8 | 115.8 | 153.2 | 157.4 | ||||||||||||||||||||||
| Long-term obligations |
254.5 | 1.1 | 366.9 | 364.0 | 407.5 | 370.4 | ||||||||||||||||||||||
| Total stockholder’s equity |
570.0 | 515.9 | 177.5 | 55.1 | 131.7 | 127.9 | ||||||||||||||||||||||
52
Table of Contents
MANAGEMENT’S DISCUSSION AND ANALYSIS OF
FINANCIAL CONDITION AND RESULTS OF OPERATIONS
The following discussion and analysis of our financial condition and results of operations should be read in conjunction with our consolidated financial statements and the related notes to those statements included elsewhere in this prospectus. In addition to historical financial information, the following discussion and analysis contains forward-looking statements that involve risks, uncertainties and assumptions. Our actual results and timing of selected events may differ materially from those anticipated in these forward-looking statements as a result of many factors, including those discussed under “Risk Factors” and elsewhere in this prospectus. See “Cautionary Note Regarding Forward-Looking Statements.”
Overview
We are a leading provider of high-end data protection solutions to both commercial enterprises and government agencies. Customers trust our comprehensive and flexible solutions to protect their most valuable information assets, including electronic banking transfers, personally identifiable information, electronic medical records, software and intellectual property assets and classified information that is critical for national security. We combine leading-edge commercial technologies with the expertise and credibility developed through our long-standing leadership in the government sector. We offer a lifecycle approach to data protection that:
| • | protects the identities of users, applications and machines; |
| • | secures any transactions that are performed by authenticated users; |
| • | encrypts data when it is created and while it is accessed, shared, stored and moved; |
| • | encrypts the communications channels through which data travels; |
| • | controls users’ rights to access software and digital assets; and |
| • | includes management solutions that enable our products to work together. |
Several key trends are driving the need for our high-end data protection solutions. Organizations are experiencing an unprecedented and sustained growth in digital assets and electronic transactions, which has increased the amount of high-value information that needs to be protected. Additionally, organizations are continually evolving how they communicate and organize their workforce and IT infrastructure, including increasing their use of collaboration among and within organizations, enabling workforce mobility, adopting virtualization and cloud computing based resources, opening networks for personal computing devices, and the adoption of Software as a Service, or SaaS, applications. These initiatives have introduced additional security and compliance risks and increased the vulnerability of valuable information. At the same time, the significant increase in frequency, sophistication and severity of threats to data security is causing tangible, far-reaching monetary and reputational damage to organizations of all types, both from external threats, such as hackers and espionage, and from internal threats, both malicious and inadvertent. As cyber attacks on the federal government have also increased in volume and sophistication, cyber security has become a top priority of the U.S. government. Government agencies have responded to the increased threat environment by enacting regulations mandating increased protection of data and corresponding notifications upon data breaches.
We were founded in 1983 and have developed our core encryption and data protection technology into comprehensive and integrated solutions focused on the protection of high-value information assets. Many of our products are certified to the highest security standards. We have established a global channel of over 1,000 resellers, original equipment manufacturers, or OEMs, value-added resellers, or VARs, and systems integrators and over 200 application and solution providers that provide us extensive geographic reach across multiple commercial verticals including the financial services, retail, healthcare, software and technology industries. We serve more than 25,000 commercial enterprises and government agencies in over 100 countries. As of October 1, 2010, we had 1,707 employees. We have grown both organically and through a series of complementary acquisitions, including the acquisitions of Ingrian Networks in April 2008, Aladdin Knowledge Systems in March 2009 and Assured Decisions in December 2009.
53
Table of Contents
Background and Recent Developments
Early History
Our company was originally founded in 1983 as Information Resource Engineering, Inc. We conducted an initial public offering in 1989, and our common stock subsequently traded on the NASDAQ Stock Market until April 2007. From 1983 to 1995, our business was focused on data security for the financial services industry. We released our first broad-based commercial product offering, a virtual private network system called SafeNet, in 1995. In 1999, we renamed our company SafeNet, Inc. Between 2002 and 2005, we acquired several other information security providers including Cylink, Securelink, Rainbow Technologies, Datakey and MediaSentry, all of which resulted in significant growth of our overall business and our range of product and service offerings.
In 2006, several then-members of our board of directors and management, including Anthony Caputo, our former chief executive officer, Carole Argo, our former president and chief financial officer, and Kenneth Mueller, our former chief financial officer, were named in stock option backdating and earnings management investigations. All of the individuals named in those investigations terminated their employment and/or directorships with us prior to our acquisition by Vector Stealth in April 2007. We have restated previously reported financial information for the years ended December 31, 2005 and 2006 to reflect the findings of the investigations, and we have a completely new board of directors and added a new senior management team since the events prompting the investigations. We incurred substantial expenses in connection with investigations by the SEC as well as in connection with certain stockholder lawsuits arising out of these matters against our company and against those former officers and directors with whom we have contractual obligations to provide indemnification. For example, in 2009, we incurred approximately $6.0 million in legal, accounting and professional services fees and related expenses due to these investigations and the resulting restatement. In November 2009, the SEC settled its claims against SafeNet and certain of our former employees of the company arising out of these matters. In July 2010, we entered into a preliminary agreement for settlement of the stockholder lawsuits. For more information on these matters, see “Business—Legal Proceedings.”
Acquisition by an Affiliate of Vector Capital
In April 2007, we were acquired by Vector Stealth, an affiliate of Vector Capital, a San Francisco-based private equity investment firm specializing in the technology sector. As a result of this going-private transaction, we ceased to be a public reporting company. As a private company, we began a series of steps to improve our growth, profitability and internal controls. Included in these actions were changes in our board of directors and management personnel, including reconstituting our board such that all of our board members have joined our board since 2007, and the appointment of a new chief executive officer in July 2009, a new chief financial officer in October 2009 and a new senior vice president and general counsel in February 2010. We also embarked on a thorough review of our accounting policies, practices and systems resulting in significant administrative expenses in 2007, 2008 and 2009. In 2009, we began implementation of a new ERP system to further improve our efficiency and internal controls.
Strategic Repositioning
As a private company, we made a series of strategic acquisitions and divestitures that enhanced our competitive position. In 2008, we acquired Ingrian Networks, Inc., an enterprise data protection and privacy solutions provider. In 2009, we acquired Assured Decisions, LLC, a cyber security consultancy and provider of high-value solutions for securely sharing confidential information across government agencies.
Most notable among our recent activity was the March 24, 2009 acquisition of Aladdin Knowledge Systems Ltd., or Aladdin, a developer of data security and software rights management solutions, by a fund affiliated with Vector Capital. Vector Capital placed Aladdin under common control with us at that time. On March 31, 2010, we formally acquired the entity that had acquired Aladdin, which resulted in Aladdin becoming a wholly owned subsidiary of SafeNet, Inc.
54
Table of Contents
Aladdin’s existing solution offerings included both software rights management and authentication data protection products. Sales of those products historically generated gross profit margins that were on average greater than our existing products. The acquisition of Aladdin also allowed us to expand our geographic reach by enhancing our presence in the Europe, Middle East and Africa and Asia Pacific regions. Aladdin had historically invested more heavily than SafeNet in sales and marketing, particularly in direct and channel-based sales capacity. As part of the integration of Aladdin, we undertook efforts designed to optimize our combined sales and marketing activities. In addition, we sought to rationalize our product development activities, removing redundant efforts across our combined product portfolio.
Recent Trends
Our revenues have grown from $249.8 million for the year ending December 31, 2005 to $403.7 million for the year ending December 31, 2009. Our revenues for the nine months ended September 30, 2010 were $334.1 million as compared to $293.9 million for the nine months ended September 30, 2009. The growth in our revenues during this period was the result of acquisitions, including those of Aladdin, Ingrian Networks and Assured Decisions. These acquisitions complemented our core business and allowed us to increase our sales to existing customers, add new customer sales, drive sales of new products and solutions and increase our sales outside of the U.S.
Our revenue growth from 2005 through 2009 demonstrated the resiliency of our product portfolio and diversity of our customer base. During 2007 and early 2008, revenue growth continued across our product portfolio despite the global economic turmoil beginning in 2008. The general downturn in sales of enterprise software in the latter half of 2008 and 2009 had a corresponding effect on sales of our software rights management products. Sales of our commercial data protection products grew at a slower rate during this time frame as well. Despite the slowdown in these areas, sales to U.S. government customers continued apace throughout 2008 and into 2009. In addition, our acquisitions during this time period bolstered our growth rates by providing a broader product portfolio and enhancing our sales resources and distribution channels.
Our operating loss grew from $11.8 million for the year ending December 31, 2005 to $22.0 million for the year ending December 31, 2009. For the nine months ended September 30, 2010, we generated operating income of $16.6 million. Our net loss has grown from $10.3 million for the year ending December 31, 2005 to $49.7 million for the year ending December 31, 2009. For the nine months ended September 30, 2010, our net loss was $8.7 million. The increase in both our net operating loss and our net loss from 2005 to 2009 reflects several factors, including increased operating expenditures to support the growth and scale of our business, the effects of the restatement of our financial statements and the related costs and litigation settlements that occurred between 2006 and 2009, and the impacts of our acquisition by Vector Stealth in 2007, which resulted in increased amortization of intangible assets following the revaluation of certain of our assets in connection with our acquisition and increased interest expense from the long-term debt incurred in connection with our acquisition. The improvement in our operating income and reduction in our net loss for the nine months ended September 30, 2010 reflects our increased revenue and an improvement in our cost and expense structure as a percentage of revenue.
Presentation of Financial Statements
Our Business
We have one business and operate in one industry: developing, marketing, distributing and supporting security data solutions for commercial enterprises and government agencies. We sell our products and services in the Americas, EMEA and Asia Pacific.
Predecessor and Successor Entities
Pursuant to our acquisition on April 11, 2007 by Vector Stealth, our consolidated financial statements and notes included elsewhere and referenced in this prospectus present information relating to both a “Predecessor” and “Successor” entity. We refer to the period prior to April 12, 2007 as the “Predecessor Period” and the period from April 12, 2007 as the “Successor Period.”
55
Table of Contents
Presentation of Aladdin Acquisition
The initial investment in Aladdin was accomplished using an entity affiliated with Vector Capital that was established in 2008 and subsequently placed under common control with us. This entity subsequently acquired all of the outstanding shares of Aladdin on March 24, 2009. Accordingly, the financial statements, analysis and management discussion included in this prospectus include our standalone financials through 2007, incorporate the entity affiliated with Vector Capital beginning in 2008 and include Aladdin in its entirety from its date of acquisition on March 24, 2009. On March 31, 2010, we formally acquired the entity that had acquired Aladdin, which resulted in Aladdin becoming a wholly owned subsidiary of SafeNet. For further information, see Note 3 of our consolidated financial statements included elsewhere in this prospectus.
Key Metrics
We monitor a number of key financial metrics as shown below to help us evaluate growth trends, measure the effectiveness and efficiency of our operations and gauge our cash generation. We discuss revenue, gross profit margin, operating expense in the “—Components of Operating Results” and discuss net cash provided by operating activities under “—Liquidity and Capital Resources.” Adjusted EBITDA is not a recognized presentation under GAAP. An explanation of the elements of adjusted EBITDA and a full reconciliation of adjusted EBITDA to net loss, net income, the most directly comparable GAAP measure, as well as a discussion of the material limitations of adjusted EBITDA, follows the table below.
| Predecessor Period* |
Successor Period* | |||||||||||||||||||||||
| Period from January 1, 2007 to April 11, 2007 |
Period from April 12, 2007 to December 31, 2007 |
Year Ended December 31, |
Nine Months Ended September 30, |
|||||||||||||||||||||
| 2008 | 2009 | 2009 | 2010 | |||||||||||||||||||||
| (unaudited) | ||||||||||||||||||||||||
| (dollars in millions) | ||||||||||||||||||||||||
| Products revenues |
$ | 63.7 | $ | 197.2 | $ | 283.6 | $ | 348.7 | $ | 254.6 | $ | 283.9 | ||||||||||||
| Service and maintenance revenues |
$ | 10.1 | $ | 29.2 | $ | 45.4 | $ | 55.0 | $ | 39.3 | $ | 50.2 | ||||||||||||
| Total revenue |
$ | 73.8 | $ | 226.4 | $ | 329.0 | $ | 403.7 | $ | 293.9 | $ | 334.1 | ||||||||||||
| Gross profit margin of products revenues (excluding amortization and impairment of intangible assets)† |
46.4 | % | 53.8 | % | 54.6 | % | 59.3 | % | 58.5 | % | 58.6 | % | ||||||||||||
| Gross profit margin of service and maintenance revenues (excluding amortization and impairment of intangible assets)† |
75.2 | % | 75.9 | % | 74.7 | % | 81.1 | % | 80.4 | % | 79.5 | % | ||||||||||||
| Total gross profit margin |
45.4 | % | 45.0 | % | 21.8 | % | 54.4 | % | 53.4 | % | 54.3 | % | ||||||||||||
| Operating expenses |
$ | 83.9 | 108.2 | $ | 201.4 | $ | 241.5 | $ | 159.9 | $ | 165.0 | |||||||||||||
| Operating income (loss) |
$ | (50.4 | ) | $ | (6.4 | ) | $ | (129.8 | ) | $ | (22.0 | ) | $ | (2.9 | ) | $ | 16.6 | |||||||
| Net cash provided by (used in) operating activities |
$ | 1.4 | 18.2 | $ | 8.0 | $ | 17.5 | $ | 2.9 | $ | 38.5 | |||||||||||||
| Adjusted EBITDA |
$ | (1.0 | ) | $ | 41.4 | $ | 57.5 | $ | 85.9 | $ | 58.4 | $ | 69.3 | |||||||||||
| * | Our key metrics for the calendar year ended December 31, 2007 reflect our activity in both the Predecessor Period and Successor Period during that year. For further information on this presentation, see “—Presentation of Financial Statements—Predecessor and Successor Entities.” |
| † | For further discussion of our presentation of gross profit margin, including by products revenues (excluding amortization and impairment of intangible assets) and service and maintenance revenues (excluding amortization and impairment of intangible assets), see “—Components of Operations—Gross Profit and Gross Profit Margins.” |
56
Table of Contents
Definition of Adjusted EBITDA
We define adjusted EBITDA as net income (loss), calculated in accordance with GAAP plus: (i) interest expense (income), net; (ii) income tax (benefit) expense; (iii) depreciation; (iv) amortization of acquired intangible assets; (v) impairment of acquired intangible assets and goodwill; (vi) stock-based compensation expense; (vii) transaction costs related to acquisitions; (viii) purchase accounting adjustments; (ix) restructuring expenses; (x) principal stockholder management fees; (xi) investigation and restatement related charges; and (xii) costs and benefits of litigation settlements.
Adjusted EBITDA is a performance measure that is not calculated in accordance with GAAP. The table immediately following this discussion provides a reconciliation of this non-GAAP measure to net loss, the most directly comparable measure calculated and presented in accordance with GAAP. Adjusted EBITDA should not be considered as an alternative to net income, income from operations or any other measure of financial performance calculated and presented in accordance with GAAP. Our adjusted EBITDA may not be comparable to similarly titled measures of other companies because other companies may not calculate adjusted EBITDA or similarly titled measures in the same manner as we do. We prepare adjusted EBITDA to eliminate the impact of items that we do not consider indicative of our core operating performance. We encourage you to evaluate these adjustments and the reasons we consider them appropriate.
Our management uses adjusted EBITDA:
| • | as a measure of operating performance; |
| • | as a factor when determining management’s compensation; |
| • | for planning purposes, including the preparation of our annual operating budget; |
| • | to allocate resources of our business; and |
| • | to evaluate the effectiveness of our business strategies. |
We believe that the use of adjusted EBITDA provides consistency and comparability with our past financial performance and facilitates period-to-period comparisons of our operating results by management and investors. Although calculation of adjusted EBITDA may vary from company to company, our presentation of adjusted EBITDA may facilitate analysis and comparison of our operating results by management and investors with other peer companies, many of which use similar non-GAAP financial measures to supplement their GAAP results in their public disclosures. While we believe adjusted EBITDA is a useful measure for our management and investors in evaluating our operating performance and business trends, there are material limitations to the use of adjusted EBITDA. For a further discussion of these limitations, see “—Material Limitations of Adjusted EBITDA” following this subsection.
We believe that it is useful to exclude non-cash charges for depreciation, amortization of acquired intangible assets, impairment of acquired intangible assets and goodwill and stock-based compensation from adjusted EBITDA because (i) the amount of such non-cash expenses in any specific period may not directly correlate to the underlying operational performance of our business and (ii) such expenses can vary significantly between periods as a result of new acquisitions, the application of impairment tests in a given period, full amortization of previously acquired intangible assets or the timing of new stock-based awards.
More specifically, we believe it is useful in evaluating our financial performance to exclude stock-based compensation expense from adjusted EBITDA because non-cash equity grants made at various points in time based on the value of our stock do not necessarily reflect how our business is performing at any particular time. While we believe that investors should have information about any dilutive effect of outstanding options and the cost of that compensation, we also believe that investors should have the ability to view adjusted EBITDA as a non-GAAP financial measure that excludes these costs. The determination of stock-based compensation expense is based on many subjective inputs at a point in time and many of these inputs are not necessarily directly related
57
Table of Contents
to the performance of our business. Due to subjective assumptions that underlie valuation methodologies used in the calculation of this expense and the variety of stock award types that companies employ, as well as the impact of non-operational factors such as our share price, on the magnitude of this expense, management believes that providing adjusted EBITDA as a non-GAAP financial measure that excludes this stock-based compensation expense allows investors to make meaningful comparisons between our operating results and those of other companies.
We believe it is useful to exclude depreciation and amortization from adjusted EBITDA because depreciation is a function of our capital expenditures, while amortization reflects other asset acquisitions and their associated costs made at a prior point or points in time. In analyzing the performance of our business currently, management believes it is helpful also to consider the business without taking into account costs or benefits accruing from historical decisions on infrastructure and capacity. While these expense and related investments affect the overall financial health of our company, they are separately evaluated and relate to historic decisions. Further, depreciation and amortization do not result in ongoing cash expenditures. Investors should note that the use of assets being depreciated or amortized contributed to revenues earned during the periods presented and will continue to contribute to future period revenues. This depreciation and amortization expense will recur in future periods for GAAP purposes.
We believe it is useful to exclude impairment of intangible assets and goodwill from adjusted EBITDA because these charges relate to specific past events. In analyzing the performance of our business currently, management believes it is helpful also to consider the business without taking into account costs or benefits accruing from historical decisions or acquisitions. Further, these charges do not result in ongoing cash expenditures.
We believe it is useful to exclude certain transaction costs related to acquisitions and divestitures when evaluating our ongoing business performance. These items vary significantly in size and amount and are excluded by our management when evaluating and predicting earnings trends because these charges are unique to specific acquisitions or divestitures. We therefore exclude these charges when presenting non-GAAP earnings. These charges include transaction costs such as transaction fees, due diligence costs, retention bonuses, severance charges and legal costs.
We believe it is useful to exclude certain purchase accounting adjustments related to our acquisitions and divestitures as well. Acquisition-related adjustments include purchase accounting adjustments such as revaluation of deferred revenue. This deferred revenue generally results from annual (or longer) maintenance contracts wherein deferred revenue is established upon sale and revenue is recognized over the term of the contract. Upon acquisition, GAAP requires that this deferred revenue be recorded at its fair value, which is typically less than the book value. In presenting non-GAAP earnings we add back the reduction in revenue that results from this revaluation on the expectation that the vast majority of these maintenance contracts will be renewed in the future and therefore the revaluation is not helpful in predicting our ongoing revenue trends. Divestiture-related adjustments also include the gain or loss on sale or disposal of assets or entire businesses. Often these transactions will result in sale prices that are different from the total carrying cost of the assets or business, resulting in a gain or loss in the period of sale or when the asset is identified as held for sale. Our management excludes these gains or losses when evaluating the ongoing performance of our business and believes it is useful to investors to highlight the specific impact of these amounts on its operating results.
We believe it is useful to exclude restructuring charges from adjusted EBITDA because these charges relate to specific actions taken at a point in time to address our ongoing business operations. We exclude these costs when evaluating our ongoing performance and predicting our earnings trends and therefore exclude these charges when presenting adjusted EBITDA. Restructuring charges include excess facility and asset-related restructuring charges as well as severance costs resulting from reductions of personnel. These charges are generally driven by modifications to our business strategy, which may include acquisitions or divestitures.
We believe it is useful to exclude management fees paid to our principal stockholders because these charges relate to fees under our management services agreement that do not correlate to our operating activities. These
58
Table of Contents
fees are presently payable to an entity affiliated with Vector Capital, and are expected to terminate upon the completion of this offering. We exclude these costs when evaluating our ongoing performance and predicting our earnings trends and therefore exclude these charges when presenting non-GAAP financial measures.
We believe it is useful to exclude investigation and restatement related expenses when evaluating our ongoing business performance. These are charges related to discrete and unusual events which have resulted in significant expenses that are, in management’s view, not part of the ordinary course of operations. This expense category specifically includes the legal and settlement expenses associated with the SEC’s investigation into stock option backdating and earnings management, which was concluded in November 2009. It also includes the ongoing legal expenses associated with stockholder litigation arising out of these matters. In addition, this category includes the restatement-related fees associated with preparing our 2006 financial statements and significant expenses associated with preparing our 2007 and 2008 financial statements.
We believe it is useful to exclude costs and benefits of other litigation settlements when evaluating our ongoing business performance as the timing of such settlements is not predictable and does not correlate with our operating activities. These represent the cost or benefit to us of settlement for certain significant legal matters. We exclude these costs and benefits when evaluating our ongoing performance and predicting our earnings trends and therefore exclude these amounts when presenting adjusted EBITDA.
Material Limitations of Adjusted EBITDA
Although adjusted EBITDA measures are frequently used by investors and securities analysts in their evaluations of companies, adjusted EBITDA measures each have limitations as an analytical tool, and you should not consider them in isolation or as a substitute for analysis of our results of operations as reported under GAAP.
A number of the material limitations of our use and presentation of adjusted EBITDA include:
| • | adjusted EBITDA does not reflect our future requirements for contractual commitments and capital expenditures; |
| • | adjusted EBITDA does not reflect cash interest income or expense; |
| • | adjusted EBITDA does not reflect cash outflows for income taxes; |
| • | adjusted EBITDA does not reflect the stock-based component of employee compensation; |
| • | although depreciation, amortization and impairment of intangible assets are non-cash charges that are excluded from adjusted EBITDA, the assets being depreciated or amortized will often have to be replaced in the future, and adjusted EBITDA does not reflect any current cash requirements for these replacements; |
| • | adjusted EBITDA does not reflect goodwill or other intangible asset impairment that may substantially reduce our GAAP net income in a given period; |
| • | adjusted EBITDA does not reflect cash payments for acquisition and divestiture-related costs, restructuring charges or acquisition related accounting adjustments, all of which reduce our GAAP net income in a given period; |
| • | adjusted EBITDA does not reflect cash payments for restatement and investigation costs and costs or benefits of litigation settlements; and |
| • | other companies in our industry may calculate adjusted EBITDA or similarly titled measures differently from the manner in which we do, limiting their usefulness as comparative measures by our management or investors. |
Management addresses the inherent limitations associated with using the adjusted EBITDA measure through disclosure of such limitations, presentation of our financial statements in accordance with GAAP and reconciliation of adjusted EBITDA to the most directly comparable GAAP measure, net loss. Further, management also reviews GAAP measures, and evaluates individual measures that are not included in adjusted EBITDA such as our level of capital expenditures and interest expense, among other items.
59
Table of Contents
Reconciliation of Adjusted EBITDA to Net Loss
The following table presents a reconciliation of adjusted EBITDA to net loss, the most comparable GAAP measure, for each of the periods identified.
| (in millions, unaudited*) | ||||||||||||||||||||||||
| Predecessor Period** |
Successor Period** | |||||||||||||||||||||||
| Period from January 1, 2007 to April 11, 2007 |
Period from April 12, 2007 to December 31, 2007 |
Year Ended December 31, |
Nine Months Ended September 30, |
|||||||||||||||||||||
| 2008 | 2009 | 2009 | 2010 | |||||||||||||||||||||
| Net (loss) |
$ | (50.8 | ) | $ | (37.3 | ) | $ | (126.5 | ) | $ | (49.7 | ) | $ | (24.3 | ) | $ | (8.7 | ) | ||||||
| Interest (income) expense, net |
(0.9 | ) | 24.1 | 34.2 | 30.3 | 23.0 | 21.9 | |||||||||||||||||
| Income tax expense (benefit) |
1.0 | 7.0 | (39.2 | ) | (0.9 | ) | 0.1 | 3.6 | ||||||||||||||||
| Depreciation expense |
1.9 | 5.0 | 6.9 | 8.5 | 6.2 | 6.9 | ||||||||||||||||||
| Amortization of acquired intangibles |
5.6 | 31.5 | 41.9 | 42.3 | 31.2 | 32.1 | ||||||||||||||||||
| Impairment of acquired intangibles and goodwill |
— | — | 125.0 | — | — | — | ||||||||||||||||||
| Stock-based compensation expense |
23.8 | 0.1 | 2.4 | 1.2 | 0.9 | 2.9 | ||||||||||||||||||
| Transaction costs related to acquisitions and divestitures |
14.0 | 1.2 | 3.9 | 6.1 | 5.2 | 1.3 | ||||||||||||||||||
| Purchase accounting adjustments |
— | 3.6 | 1.7 | 9.1 | 6.6 | 2.5 | ||||||||||||||||||
| Restructuring expense |
— | — | — | 5.5 | 3.1 | 0.2 | ||||||||||||||||||
| Management fees |
— | 1.4 | 2.0 | 2.5 | 1.8 | 1.8 | ||||||||||||||||||
| Investigation and restatement related charges |
4.4 | 3.6 | 5.2 | 6.0 | 4.6 | 6.0 | ||||||||||||||||||
| Costs (benefits) of litigation settlements |
— | 1.2 | — | 25.0 | — | (1.2 | ) | |||||||||||||||||
| Adjusted EBITDA |
$ | (1.0 | ) | $ | 41.4 | $ | 57.5 | $ | 85.9 | $ | 58.4 | $ | 69.3 | |||||||||||
| * | The amounts indicated are unaudited other than the net loss for the Predecessor Period of 2007, Successor Period of 2007, and years ended December 31, 2008 and 2009. |
| ** | Our results of operations for the calendar year ended December 31, 2007 reflect our activity in both the Predecessor Period and Successor Period during that year. For further information on this presentation, see “Management’s Discussion and Analysis of Financial Condition and Results of Operations—Presentation of Financial Statements—Predecessor and Successor Entities.” |
Components of Operating Results
Revenue
We derive our revenue from product sales and services and maintenance contracts, which are sold by our direct sales force and indirect channels, including distributors, value-added resellers, system integrators and strategic outsourcers.
| • | Product Revenue. Our product revenues include sales of hardware appliances, software licenses and solutions that combine SafeNet software with industry-standard hardware. Hardware appliances are a combination of custom integrated circuits and proprietary firmware designed to provide the customer with a turnkey solution. |
60
Table of Contents
| • | Services and Maintenance Revenue. Our services and maintenance revenues are derived from customer contracts that generally provide for technical support, software upgrades and repair or replacement of purchased products. These contracts generally have a term of one year. Services and maintenance revenue also includes revenues derived from our consulting services. |
Our customers typically deploy our products in high-end, mission critical applications, where security is of paramount importance. As a result, while the markets for data security and software rights management products are competitive, pricing is often secondary to functionality for our customers.
Cost of Revenue
Our total cost of revenue is generally comprised of the following:
| • | Cost of product revenue (excluding amortization and impairment of intangible assets). The substantial majority of the cost of product revenue consists of third-party manufacturing costs and fulfillment, as we rely on contract manufacturers to manufacture our products. Our cost of product revenue also includes product testing costs, write-offs for excess and obsolete inventory, royalty payments, warranty costs, shipping and allocated facilities costs and personnel costs associated with logistics and quality control. Personnel costs include salary, bonus and benefits costs as well as stock-based compensation costs. |
When selling certain products to the U.S. government, GAAP requires that cost of product revenue include certain items that would traditionally be categorized as sales, marketing, development and general and administrative expenses in a comparable non-government transaction. As a result of this accounting treatment, our government sales contracts result in higher costs of revenues and lower gross profit margins than a non-government transaction. However, such government transactions also result in correspondingly lower operating expense and thus no net difference in operating income as a result of this accounting treatment.
| • | Cost of service and maintenance revenue (excluding amortization and impairment of intangible assets). Cost of service and maintenance revenue is primarily comprised of personnel costs for our technical support, professional services, consulting and training teams. Personnel costs included salary, bonus and benefits costs as well as stock-based compensation costs. In addition, cost of maintenance and services revenue includes depreciation, supplies and allocated information technology and facility-related costs. |
| • | Cost of revenues—amortization and impairment of intangible assets. Our acquisition by Vector Stealth, along with our acquisition of Ingrian Networks in 2008, Aladdin in 2009 and Assured Decisions in 2009 resulted in the creation of certain intangible assets on our balance sheet that we generally amortize over three to seven years. Part of the amortization of these intangible assets is appropriately applied to our costs of revenues. In 2008, this cost also included an $82.1 million charge for the impairment of certain intangible assets that were originally related to our acquisition by Vector Stealth. |
Gross Profit and Gross Profit Margins
Gross profit as a percentage of revenue, or gross profit margin, has been and will continue to be affected by a variety of factors, including the average sales price of our products, manufacturing and support costs, the mix of revenue between products and service and maintenance contracts, the mix of revenue between government and commercial sales, any excess inventory write-offs, and currency fluctuations.
Our product mix and resulting gross profit margins have changed as a result of acquisitions in recent periods. For example, our acquisition of Aladdin in March 2009 increased the percentage of high-margin products in our product mix. This resulted in an increase in our overall gross profit margin.
In addition to total gross profit and total gross profit margin, we discuss the gross profit margin for product revenue separately from the gross profit margin for services and maintenance revenue in the section titled
61
Table of Contents
“—Results of Operations.” In calculating these measures, we include only those costs attributable to delivering the product or service, irrespective of past investments in intangible assets, excluding both amortization and impairment of intangible assets. We identify the cost of revenue resulting from amortization and impairment of intangible assets separately in these measurements since they do not vary directly with revenue and are not affected by the factors mentioned above.
We calculate our gross profit and gross margin of product revenues by subtracting cost of product revenues (excluding amortization and impairment of intangibles) from product revenues. We calculate our gross profit and gross margin of service and maintenance revenues by subtracting cost of service and maintenance revenues (excluding amortization and impairment of intangibles) from service and maintenance revenues. We believe that the use of these gross profit and gross margin measures allows the comparison of gross profit contribution of our product revenues, which carry significantly lower margins, to that of our service and maintenance revenues, which carry higher margins.
Operating Expenses
Our operating expenses include research and development, sales and marketing and general and administrative expenses. Personnel costs are the primary component of each of these operating expense categories. Personnel costs consist of cash-based personnel costs such as salaries, benefits, bonuses and non-cash stock-based compensation. In addition, allocated costs of facilities and information technology, travel and professional services are included in each of these operating expense items. In addition to each of these elements, our operating expense items consist of the following:
| • | Research and development expenses. Research and development expenses include government and industry-based certification-related expenses and depreciation of specific development capital equipment. We record all research and development expenses as incurred, except for capital equipment, which we depreciate ratably over time. In addition, once a software product achieves technological feasibility, we capitalize future research and development costs and amortize those amounts as a component of cost of product revenues beginning with the general release of our products, which is usually associated with our first product shipment. We expect research and development expenses to increase in total dollar amount in future periods as we continue to invest in our technology and product development. |
| • | Sales and marketing expenses. Sales and marketing expenses include sales commissions, as well as trade show, promotional and other marketing expenses. We expect sales and marketing expenses to moderately increase in dollar amount in future periods as we continue to invest in brand awareness, increased sales reach and expanded reseller and distribution channels. |
| • | General and administrative expenses. General and administrative expenses include expenses and professional fees incurred by or on behalf of our executive, finance, human resources, information technology and legal support departments. Professional fees included in general and administrative expenses principally consist of outside legal, auditing, accounting, information technology and other consulting costs. We anticipate general and administrative expenses to increase in total dollar amount in future periods as we incur additional costs of being a public reporting company. In addition, we expect to incur up to $12.0 million in management fees payable to an entity affiliated with Vector Capital in the quarter in which we become a public reporting company as part of our management agreement as described in “Use of Proceeds.” Finally, future acquisitions and litigation-related expenses will introduce additional general and administrative expenses in the periods in which they are incurred. |
In addition to the above categories, we also incur expenses for amortization of intangible assets. Our acquisition by Vector Stealth, along with the acquisitions of Ingrian Networks in 2008, Aladdin in 2009 and Assured Decisions in 2009 resulted in certain intangible assets that we generally amortize over three to seven years. Part of the amortization of these intangible assets is appropriately applied to our operating expenses. Absent additional acquisitions, we expect modest declines in amortization of intangible assets expense as certain intangible assets are fully amortized in coming quarters.
62
Table of Contents
Finally, we have also incurred operating expenses primarily related to our acquisition and disposition activities. We have classified these as separate elements of our operating expenses on our statement of operations included elsewhere in this prospectus. A description of the elements of these expenses is as follows:
| • | Impairment of goodwill. In connection with our acquisitions, including our own acquisition by Vector Stealth in 2007, as well as our acquisitions of Ingrian Networks in 2008, and Aladdin and Assured Decisions in 2009, we have recorded significant goodwill on our balance sheet. We do not amortize goodwill but rather review the carrying value of goodwill at least annually. We perform our annual impairment analysis in the fourth quarter of each fiscal year, at which time we determine if the carrying value of certain assets exceed their fair value. If the fair value of these assets does not exceed our recorded carrying value and a resulting impairment adjustment to goodwill is deemed necessary, we record an impairment of goodwill for such adjustment. |
| • | Loss on sale of business and net assets held for sale. These losses related to the disposition of our MediaSentry assets in 2009 and our Embedded Solutions Division in 2010, including associated intangible assets and goodwill, for prices that were less than our carrying value at the time of sale. |
| • | Restructuring expenses. Restructuring expenses include expenses incurred to improve efficiencies and eliminate redundancies in the sales, marketing, development, production and administrative functions. Theses expenses include severance costs, lease termination costs, contract cancellation fees and changes in production operations. We expect to incur modest restructuring expenses on an ongoing basis as we continue to optimize our cost and expense structure. |
Other Income and Expenses
Our other income and expenses consists principally of foreign exchange gain or loss and interest income and expense.
| • | Foreign exchange gain or loss. Foreign exchange gain or loss relates to changes in exchange rates between currencies occurring between the time we enter into a transaction and the time that we settle the transaction in cash for transactions denominated in currencies other than the functional currency of the associated entity. The majority of these gains and losses result from fluctuations between the U.S. dollar, euro, British pound, Israeli shekel and Japanese yen. |
| • | Interest income and expense, net. Interest income and expense, net, primarily consists of the interest charges associated with our secured credit agreements, including our variable-for-fixed interest rate swap arrangement. Our credit facilities provide for a variable interest rate, and we use a variable-for-fixed swap interest rate arrangement for at least half of the total debt outstanding in order to reduce the volatility associated with fluctuating interest rates. This line item also includes amortization of deferred financing costs associated with our secured credit agreements. In addition, interest income and expense, net, also includes the write-off of unamortized deferred financing costs upon early retirement of our credit facilities, as was the case in connection with the repayment of the credit facility held directly by Aladdin in March 2010. This amount also generally includes a nominal amount of interest income generated from our cash holdings in interest-bearing accounts. We expect interest expense to decline following the offering contemplated by this prospectus as we apply a portion of the proceeds from the offering to the repayment of significant principal amounts of our outstanding debt as described in “Use of Proceeds.” |
In addition, total other income and expense includes gains or losses on marketable securities held by us in certain years.
Provision for Income Taxes
We are subject to taxation in the United States as well as other jurisdictions or countries in which we conduct business. Earnings from our non-U.S. activities are subject to local country income tax and may be subject to current U.S. income tax. In particular, the Aladdin acquisition increased our non-U.S. revenues and profits,
63
Table of Contents
resulting in increased foreign taxes. In addition, our decision in April 2010 to outsource our manufacturing activity in Israel resulted in the loss of certain tax benefits in Israel, which is expected to increase our overall foreign tax rate in future periods.
Our effective tax rates differ from the statutory rate primarily due to the valuation allowance on our deferred taxes, state taxes, foreign taxes and nondeductible compensation. For periods subsequent to the date on which we fully reverse our deferred tax asset valuation allowance, we expect our effective tax rate will be less than or approximate to the U.S. federal statutory tax rates before adjusting for the effects of state taxes.
As of December 31, 2009, we had $129.5 million of federal and $51.1 million of state net operating loss carry-forwards available to reduce future taxable income. These net operating loss carry-forwards begin to expire in 2017 for both U.S. federal and state income tax purposes, respectively, and may fully expire by 2028. Our ability to use our net operating loss carry-forwards to offset any future taxable income may currently, or in the future be subject to limitations in the event that we experience a change of ownership as defined by Section 382 of the Internal Revenue Code of 1986, as amended, or the Internal Revenue Code.
In addition, as of December 31, 2009, we had $32.6 million of non-U.S. net operating loss carry-forwards available to reduce future taxable income in certain foreign jurisdictions. These net operating loss carry-forwards begin to expire in 2011, and as many as $16.5 million will expire by 2015. The remaining balance is not subject to expiration.
We make estimates and judgments about our future taxable income that are based on assumptions that are consistent with our plans and estimates. Should the actual amounts differ from our estimates, the amount of our valuation allowance could be materially affected. Any adjustment to the deferred tax asset valuation allowance would be recorded in the income statement in the periods in which the adjustment is determined to be required.
Under current tax law, if cash and cash equivalents and investments held outside the United States are distributed to the United States in the form of dividends or otherwise, we may be subject to additional U.S. income taxes (subject to an adjustment for foreign tax credits) and foreign withholding taxes.
For further information, see Note 16 of our consolidated financial statements included elsewhere in this prospectus.
Critical Accounting Policies and Estimates
Our discussion and analysis of our financial condition and results of operations are based upon our financial statements, which have been prepared in accordance with GAAP. These principles require us to make estimates and judgments that affect the reported amounts of assets, liabilities, revenue and expenses, cash flow and related disclosure of contingent assets and liabilities. Our key estimates include those related to revenue recognition, stock-based compensation, inventory and reserves for obsolescence, excess and slow moving goods, derivative financial instruments, goodwill and other intangible assets and income taxes. We base our estimates on historical experience and on various other assumptions that we believe to be reasonable under the circumstances. Actual results may differ from these estimates. To the extent that there are material differences between these estimates and our actual results, our future financial statements will be affected.
We believe that of our significant accounting policies that are described in Note 2 of our consolidated financial statements included elsewhere in this prospectus, the following accounting policies involve a greater degree of judgment and complexity. Accordingly, we believe these are the most critical to fully understand and evaluate our financial condition and results of operations.
64
Table of Contents
Revenue Recognition
We derive revenue from sales of software and technology licenses, products, maintenance agreements (post-contract customer support), hardware- and software-based products that contain a software content that is more than incidental to the product as a whole, development arrangements and services. Software and technology licenses and certain product sales typically contain multiple elements, including the product or license, maintenance and/or other services. For arrangements that include multiple elements, the revenue is allocated to the various elements based on vendor specific objective evidence of fair value for software and technology licenses or objective and reliable evidence of the fair value of the undelivered items for other multiple element arrangements, collectively referred to as VSOE, regardless of any separate prices stated within the contract for each element.
If VSOE does not exist for all delivered elements, but VSOE exists for the undelivered elements, we apply the residual method, provided that: (i) all other applicable revenue recognition criteria are met; and (ii) the fair value of all of the undelivered elements is less than the arrangement fee. Under the residual method, the arrangement fee is recognized as follows: (i) the total fair value of the undelivered elements, as indicated by VSOE, is deferred, and (ii) the difference between the total arrangement fee and the amount deferred for the undelivered elements is recognized as revenue related to the delivered elements. Generally, in our software and software related arrangements, we have established VSOE for maintenance and therefore recognize revenue under these arrangements using the residual method when the only remaining undelivered element is maintenance.
Multiple contracts with a single customer that are determined to be so closely related that they are in effect part of a single arrangement are accounted for as one multiple-element arrangement.
Products and Licenses
Product revenue consists primarily of sales of hardware appliances, software licenses and solutions that combine SafeNet software with industry-standard hardware. For product arrangements that include our software, where:
| • | the software is more than incidental to the product, |
| • | the arrangement contains multiple elements, and |
| • | VSOE exists for all undelivered elements, |
we recognize revenue for the delivered elements using the residual method. For arrangements containing multiple elements where VSOE does not exist for all undelivered elements, we defer the revenue for the delivered and undelivered elements until VSOE exists or all elements have been delivered.
License revenue is comprised of perpetual and term license fees, which are derived from arrangements with end users, OEMs and resellers or partners. We are generally able to recognize license revenue based on the residual method as discussed above. License revenue is primarily derived from perpetual licenses, but some licenses involve a fixed term. Revenue derived from term licenses sold with software maintenance is recognized ratably over the license term.
Development Arrangements
We enter into certain arrangements with respect to product development. Based on their terms and conditions, these transactions are categorized into one of the following categories:
Contract Accounting Arrangements
Revenues that are earned under certain long-term contracts to develop customer specific technology are recognized using contract accounting and are included in product revenue. Revenue from these arrangements is generally recognized using the percentage-of-completion method. Progress to completion is principally measured
65
Table of Contents
using either labor hours or contract milestones based on our determination of which would be the best available measure of progress on the contracts. Any estimated losses are provided for in their entirety in the period they are first identified. Where reasonably dependable estimates cannot be made or where inherent hazards make estimates doubtful, we use the completed-contract method.
Certain products are designed, developed and produced for use in U.S. government and commercial enterprise applications that consist of application specific integrated circuits, modules, electronic assemblies and stand-alone products to protect information. Catalog product revenues and revenues under certain fixed-price contracts are recognized as deliveries are made, provided all other revenue recognition criteria have been met. Revenues under cost-reimbursement contracts are recognized as costs are incurred and include estimated earned fees in the proportion that costs incurred to date bear to total estimated costs. Certain contracts are awarded on a fixed-price incentive fee basis. Incentive fees on such contracts are considered when estimating revenues and profit rates are recognized when the amounts can reasonably be determined. The costs attributed to units delivered under fixed- price contracts are based on the estimated average cost per unit at contract completion. Profits expected to be realized on long-term contracts are based on total revenues and estimated costs at completion. Revisions to contract profits are recorded in the accounting period in which the revisions are known. Estimated losses on contracts are recorded when identified. We recognize contract earnings using the percentage-of-completion method for cost-plus-fee type contracts.
Funded Research and Development Arrangements
We enter into arrangements where funding is received from others to offset the cost of research and development activities. As a result, we do not recognize research and development expense incurred as a direct result of such funding. In these agreements we generally retain ownership of the intellectual property being developed. The funding party generally receives the right to use the developed product royalty-free or receives a royalty when we sell the product. Provided that technological feasibility has not been established prior to entering into the arrangement, funding which is potentially refundable based on the outcome of the research and development is deferred until such time as the outcome of the development has been determined. Funding which is not potentially refundable is recognized as an offset to research and development expenses as such expenses are incurred. Funding received in these arrangements in excess of costs incurred is deferred until such costs are incurred.
During 2007, 2008, 2009 and the nine months ended September 30, 2010, we recorded $1.7 million, $6.4 million, $5.5 million and $0.9 million, respectively, of funding as an offset to research and development expenses. Approximately $2.7 million, $0.4 million, $0.4 million and $0.2 million of funding was deferred pending incurrence of costs or the outcome of the development project at December 31, 2007, 2008, and 2009 and September 30, 2010, respectively.
Non-Recurring Engineering Arrangements
We also enter into certain development arrangements that generate revenue and gross profit. These arrangements are classified as Non-Recurring Engineering, or NRE, arrangements with subsequent manufacturing and may or may not include additional minimum purchase commitments. NRE arrangements with subsequent manufacturing occur when we create a product for a customer either from inception or develop a new product based on an already existing product within our product portfolio. In situations in which we retain all rights to the developed product and the customer enters into an arrangement to purchase a minimum quantity of products once development effort has been completed, we defer all revenue and cost associated with the NRE and recognize the revenue and cost based on a units delivered methodology over the minimum quantity commitment. The basis for this determination is that the value of the transaction, from the customer perspective, is in the final developed units. In such situations, the customer does not typically have the ability to, at any point, terminate the contract and enter into an arrangement with another vendor to produce the transacted unit since the customer does not have rights to our product or developed intellectual property. Where no minimum order quantity exists, revenue and related costs generally are recognized straight line over the remaining term of the agreement, once development has been completed.
66
Table of Contents
Maintenance, Subscription and Other Services
Maintenance revenue is derived from support arrangements. Maintenance arrangements provide technical customer support and the right to unspecified upgrades on an if-and-when-available basis. The maintenance term is typically one year in duration and maintenance revenue is recognized ratably over the maintenance term. Maintenance arrangements can be renewed for additional periods. Unrecognized maintenance fees are included in “deferred revenue” in our consolidated balance sheets included elsewhere in this prospectus.
Other service revenue is primarily comprised of fees associated with consulting and training services. These revenues, when provided on a stand-alone basis, are recognized as the services are provided to the customer. If such services are provided as part of a multi-element arrangement, and are the only remaining undelivered element, revenue from the entire arrangement is deferred until the earlier of (i) the establishment of the applicable measurement of fair value for the services; or (ii) as the services are delivered.
Certain of our software products are bundled with maintenance and post-contract support services that provide for numerous updates to the software within a short period of time over the term of the arrangement. These arrangements are accounted for as “in-substance” subscription arrangements in accordance with applicable accounting guidance. Revenue for such arrangements is recognized ratably over the subscription period beginning with the delivery of the software.
Stock-Based Compensation
Common Stock
We recognize stock-based compensation expense for stock-based compensation awards granted to our employees, consultants and other service providers that can be settled in shares of our common stock or in equity interests in Vector Stealth, our sole stockholder. Compensatory stock options issued prior to our reorganization in June 2010 that can presently be settled in shares of our common stock could be settled in SafeNet, Inc., our wholly owned subsidiary, prior to June 2010. For a further description of our benefit plans and compensatory arrangements with our named executive officers, see the section titled “Executive Compensation—Benefit Plans.”
Compensation expense for all stock-based compensation awards granted is based on the grant date fair value estimate for each award. We recognize these compensation costs on a straight-line basis over the requisite service period of the award, which is generally four years. As stock-based compensation expense recognized is based on awards ultimately expected to vest, such expense is reduced for estimated forfeitures. Stock-based compensation expense related to employee stock options that can be settled in our common stock during 2007 Predecessor Period, 2007 Successor Period, the years ended December 31, 2008 and 2009 and the nine months ended September 30, 2010 was $23.8 million, $0.1 million, $1.3 million, $0.8 million and $2.9 million, respectively. The sizable charge in 2007 Predecessor Period related to the automatic acceleration in vesting of then-unvested options to purchase our common stock in connection with our acquisition by Vector Stealth. In addition, we recorded compensation expense of $1.1 million, $0.4 million and $1.1 million during the years ended December 31, 2008 and 2009 and the nine months ended September 30, 2010, respectively, relating to awards to certain of our management that can be settled in equity interests in our sole stockholder, Vector Stealth.
As of September 30, 2010 there was approximately $5.5 million of unrecognized stock-based compensation expense related to non-vested stock option awards that we expect to be recognized over a weighted average vesting period of 2.4 years.
We estimate the fair value of stock-based compensation awards as of the date of grant applying the Black-Scholes-Merton option pricing model, which was developed for use in estimating the value of traded options that have no vesting restrictions and are freely transferable, and using the assumptions in the following table. The Black-Scholes-Merton option pricing model considers, among other factors, the expected life of the award and
67
Table of Contents
the expected volatility of our stock price. The fair values generated by the model may not be indicative of the actual fair values of our awards as it does not consider other factors important to those share-based payment awards, such as continued employment, periodic vesting requirements and limited transferability.
| Successor Period | ||||||||||||||||
| Period from April 11, 2007 to December 31, 2007 |
Year Ended December 31, | Nine Months Ended September 30, |
||||||||||||||
| 2008 | 2009 | 2010 | ||||||||||||||
| Expected stock price volatility |
66.00 | % | 60.00-66.00 | % | 60.00 | % | 60.00 | % | ||||||||
| Expected option life in years |
5.78 | 5.62-6.08 | 6.02-6.11 | 6.11-6.14 | ||||||||||||
| Risk-free interest rate |
3.70 | % | 3.23-3.32 | % | 2.26-3.27 | % | 1.60%-2.90 | % | ||||||||
| Dividend yield |
0.00 | % | 0.00 | % | 0.00 | % | 0.00 | % | ||||||||
| Range of fair value of granted stock options |
$ | 1.50 | $ | 0.39-$1.48 | $ | 0.27-$1.24 | $ | 1.26-$1.81 | ||||||||
As of each stock option grant date, we considered the fair value of the underlying common stock, determined as described below, in order to establish the option fair value. As of each stock option grant date, we reviewed an average of the disclosed year-end volatility of a group of companies that we considered peers based on a number of factors including, but not limited to, similarity to us with respect to industry, business model, stage of growth, financial risk and other factors, to determine the appropriate volatility. The expected life was based on the average of the vesting period and the contractual life of the options as we have no historical experience with the exercise of options to purchase our common stock. The risk-free interest rate was determined by reference to the then applicable United States Treasury rates with the remaining term approximating the expected life assumed at the date of grant. In addition, we are required to estimate the expected forfeiture rate and only recognize expense for those options expected to vest. We estimate the forfeiture rate based on our historical employee attrition experience. Further, to the extent our actual forfeiture rate is different from our estimate, stock-based compensation expense is adjusted accordingly.
The following table sets forth information for all stock option grants since January 1, 2009 through September 30, 2010:
| Grant Date |
Number of Shares Underlying Options Granted |
Exercise Price Per Share |
Common Stock Fair Value Per Share at Grant Date |
Intrinsic Value Per Share at Grant Date(1) |
||||||||||||
| April 26, 2009 |
813,000 | $ | 2.64 | $ | 0.86 | $ | — | |||||||||
| August 11, 2009 |
37,879 | 2.64 | 0.86 | — | ||||||||||||
| December 22, 2009 |
946,965 | 2.64 | 2.28 | — | ||||||||||||
| December 29, 2009 |
750,000 | 2.64 | 2.28 | — | ||||||||||||
| February 18, 2010 |
1,289,840 | 2.64 | 2.30 | — | ||||||||||||
| April 22, 2010 |
2,429,973 | 2.64 | 2.42 | — | ||||||||||||
| August 4, 2010 |
160,000 | 3.50 | 3.50 | — | ||||||||||||
| September 29, 2010 |
2,500 | 4.00 | 4.00 | — | ||||||||||||
| (1) | Intrinsic value per share represents the amount by which the fair value per share of our common stock on the grant date exceeded the exercise price per share on the grant date. |
Assuming an initial public offering price of $ per share, the midpoint of the price range set forth on the cover page of this prospectus, the intrinsic value of stock options outstanding at September 30, 2010, was $ , of which $ related to the options that were vested and $ related to the options that were not vested.
68
Table of Contents
Since our common stock is not publicly traded, we considered numerous objective and subjective factors in connection with valuations of our common stock at each valuation date in accordance with the guidance in the American Institute of Certified Public Accountants Practice Aid Valuation of Privately-Held-Company Equity Securities Issued as Compensation, or the Practice Aid.
Valuation Methodology
For each common stock valuation occurring between January 1, 2009 and July 12, 2010, the fair value of our common stock was determined by taking the average value calculated under the “income approach” and “market approach,” with each method weighted equally. The equal weighting of these two approaches reflected our view that both these valuation methods provide a reasonable estimate of fair value, are equally reliable and resulted in similar values.
For each common stock valuation occurring after July 12, 2010, the fair value of our common stock was determined by using a combination of “income approach” and “market approach” methods. However, the valuation evaluated the income and market approaches in two separate scenarios: upon a liquidity event and without a liquidity event. This change was prompted by the July 12, 2010 filing of the initial registration statement for this offering with the SEC. The valuations assumed an increased probability of a liquidity event within six to twelve months of the valuation date and then considered the income and market approaches with various weights within that scenario. In addition, the market approach methodology was further elaborated to also include estimated valuations based on both trading multiples of a peer group of companies and multiples of a peer group of companies that were recently acquired.
The “income approach” quantified the present value of the future cash flows that management expected to achieve. Underlying variables utilized in the income approach included:
| • | our expected revenue, operating performance, cash flow and EBITDA for the current and future years, determined as of the valuation date based on our estimates; |
| • | a discount rate, which is applied to discretely forecasted future cash flows in order to calculate the present value of those cash flows; and |
| • | a terminal value estimate, which is applied to our last year of discretely forecasted cash flows to calculate the residual value of our future cash flows. |
The “market approach: publicly traded peer companies” considered multiples of financial metrics based on trading multiples of a peer group of companies. This approach was used for all valuations since January 1, 2009. The “market approach: recent peer company transactions” considered multiples of financial metrics based on acquisition multiples of a peer group of companies. This approach was used for all valuations since July 12, 2010. Underlying variables utilized in these market approaches included:
| • | our historical and projected revenue and EBITDA; and |
| • | multiples of market value to historical and projected revenue and EBITDA, determined as of the valuation date, based on a group of comparable companies we identified. |
The relative weightings of the various methodologies at each valuation date from January 1, 2009 through July 12, 2010 were as follows:
| Methodology |
Methodology weight |
|||||||
| Income approach |
50.0 | % | ||||||
| Market approach: publicly traded peer group |
50.0 | % | ||||||
69
Table of Contents
The relative weightings of the various scenarios and methodologies at each valuation date after July 12, 2010 were as follows:
| Scenario |
Scenario |
Methodology |
Methodology | |||
| Liquidity event within six to twelve months of valuation date |
80.0% | • Income approach |
33.3% | |||
| • Market approach: publicly traded peer group |
33.3% | |||||
| • Market approach: recent peer company transactions |
33.3% | |||||
| No liquidity event within six to twelve months of valuation date |
20.0% | • Income approach |
50.0% | |||
| • Market approach: publicly traded peer group |
50.0% |
The significant assumed variables used in determining fair value under the foregoing approaches were as follows at each valuation date:
| Market approach: publicly traded peer group | ||||||||||||||||||||||||||||||||
| Revenue | EBITDA | |||||||||||||||||||||||||||||||
| Date of Valuation |
Last Fiscal Year |
Last Twelve Months |
Remaining Fiscal Year Forecast |
Next Fiscal Year Forecast |
Last Fiscal Year |
Last Twelve Months |
Remaining Fiscal Year Forecast |
Next Fiscal Year Forecast |
||||||||||||||||||||||||
| April 26, 2009 |
1.0x | 1.0x | 0.9x | 0.9x | N/A | N/A | 6.5x | 5.7x | ||||||||||||||||||||||||
| December 22, 2009 |
N/A | N/A | 1.4x | 1.3x | N/A | N/A | 9.2x | 6.7x | ||||||||||||||||||||||||
| February 18, 2010 |
N/A | N/A | 1.6x | 1.3x | N/A | N/A | 9.0x | 6.6x | ||||||||||||||||||||||||
| March 31, 2010 |
1.7x | N/A | 1.6x | 1.4x | 12.0x | N/A | 8.9x | 9.1x | ||||||||||||||||||||||||
| August 4, 2010 |
1.5x | 1.5x | 1.4x | 1.3x | 9.8x | 13.1x | 8.6x | 7.9x | ||||||||||||||||||||||||
| September 29, 2010 |
1.7x | 1.7x | 1.6x | 1.4x | 10.7x | 9.5x | 7.9x | 7.8x | ||||||||||||||||||||||||
| Market approach: recent peer company transactions | ||||||||||||||||||||||||||||||||
| Revenue | EBITDA | |||||||||||||||||||||||||||||||
| Date of Valuation |
Last Fiscal Year |
Last Twelve Months |
Remaining Fiscal Year Forecast |
Next Fiscal Year Forecast |
Last Fiscal Year |
Last Twelve Months |
Remaining Fiscal Year Forecast |
Next Fiscal Year Forecast |
||||||||||||||||||||||||
| April 26, 2009 |
N/A | N/A | N/A | N/A | N/A | N/A | N/A | N/A | ||||||||||||||||||||||||
| December 22, 2009 |
N/A | N/A | N/A | N/A | N/A | N/A | N/A | N/A | ||||||||||||||||||||||||
| February 18, 2010 |
N/A | N/A | N/A | N/A | N/A | N/A | N/A | N/A | ||||||||||||||||||||||||
| March 31, 2010 |
N/A | N/A | N/A | N/A | N/A | N/A | N/A | N/A | ||||||||||||||||||||||||
| August 4, 2010 |
2.0x | 2.0x | 1.8x | 1.7x | 16.1x | 13.6x | 10.6x | 9.4x | ||||||||||||||||||||||||
| September 29, 2010 |
2.3x | 2.3x | 2.1x | 1.9x | 16.2x | 15.2x | 12.1x | 11.0x | ||||||||||||||||||||||||
70
Table of Contents
| Income |
||||||
| Date of Valuation |
Weighted |
|||||
| April 26, 2009 |
17.0% | |||||
| December 22, 2009 |
15.5% | |||||
| February 18, 2010 |
15.0% | |||||
| March 31, 2010 |
13.5% | |||||
| August 4, 2010 |
13.5% | |||||
| September 29, 2010 |
13.5% | |||||
The resulting fair values, based upon the weighted average of the various scenarios and methodologies at each date, were then discounted to reflect the minority position of the optionee as well as the probability of a liquidity event establishing a public market for our common stock as follows:
| Date of Valuation |
Control and |
|||||
| April 26, 2009 |
39.0% | |||||
| December 22, 2009 |
24.0% | |||||
| February 18, 2010 |
24.0% | |||||
| March 31, 2010 |
15.0% | |||||
| August 4, 2010 |
15.0% | |||||
| September 29, 2010 |
15.0% | |||||
These valuation determinations were made on a retrospective basis for grants made prior to December 2009, and on a contemporaneous basis beginning in December 2009. As noted above, the exercise price for stock option grants has equalled or exceeded the fair value of our common stock, determined as described above, for each grant made since our acquisition by Vector Stealth.
The factors considered in determining the valuation of our common stock were as follows at each valuation date:
April 26, 2009 Valuation
Several objective and subjective factors were considered in the course of the valuation performed on April 26, 2009. Most importantly, although Aladdin was under common control with us beginning on March 24, 2009, our valuation efforts did not include Aladdin until its formal acquisition as a subsidiary on March 31, 2010.
With respect to the “income approach” financial results from our 2008 acquisitions of BEEP Science AS and Ingrian Networks, Inc. were included in our projected financial results but those of Aladdin were not. Additionally, our “income approach” financial projections reflected a challenging environment given the macroeconomic conditions present and expected to continue at that time.
For the “market approach: publicly traded peer group,” a peer group consisting of Blue Coat Systems, Inc., Check Point Software Technologies Ltd., VASCO Data Security International, Inc., ViaSat, Inc., Harris Corporation and Sypris Solutions, Inc. was used to establish median comparable multiples. Our assessment of the “market approach: publicly traded peer group,” also considered that the comparables used were generally valuations using non-controlling stockholders. As such, a 10.0% control premium was applied to reflect the controlling ownership position of Vector Stealth as our sole stockholder.
The average estimated enterprise value of the income and market approaches was then adjusted for our working capital and for the fair value of our then-outstanding debt to reach an estimated total equity value. A combined discount of approximately 39.0% of the total equity value was applied, reflecting a combination of both the control discount of the optionees as well as an adjustment for expected lack of marketability due to the absence of a public market or imminent exit event. Based on the foregoing factors, our board of directors determined the resulting stock value to be $0.86 per share as of April 26, 2009.
71
Table of Contents
December 22, 2009 Valuation
Several factors varied in the December 22, 2009 valuation from the previous valuation. With respect to the “income approach,” our financial projections also again reflected a challenging macroeconomic environment, although the projections were more optimistic in December 2009 than the projections used in April 2009.
For the “market approach: publicly traded peer group,” the multiples of the same perceived peer group used in the April 26, 2009 valuation were used. These multiples were generally better than early 2009, when market values of publicly-traded companies were at significant historic lows. In addition, our own revenue performance growth continued, which further enhanced the effect of the increased multiples on our resulting enterprise value. Our assessment of this approach again also applied a 10.0% control premium to reflect the controlling ownership position of Vector Stealth.
The average enterprise value of the income and market approaches was then adjusted for our working capital and for the fair value of our then-outstanding debt to reach an estimated total equity value. A combined discount of approximately 24.0% of the total equity value was applied, reflecting a combination of both the control discount of the minority stockholders as well as an adjustment for expected lack of marketability due to the absence of a public market and the likelihood of an exit event. The discount for lack of marketability was reduced as we began considering the process to enter the public market within the coming year. Based on the foregoing factors, our board of directors determined the resulting stock value to be $2.28 per share as of December 22, 2009.
February 18, 2010 Valuation
Several factors varied in the February 18, 2010 valuation from the previous valuation. Our financial projections for the “income approach” continued to reflect challenging macroeconomic conditions expected at that time, although the projections again were more optimistic than the projections used in December 2009.
For the “market approach: publicly traded peer group,” the multiples of the same perceived peer group used in the previous valuation was used. These multiples were generally better than they were in early 2009, when market values of publicly-traded companies were at significant lows, and continued to improve modestly over the multiples determined for December 2009, reflecting the continued recovery of the public markets. In addition, our own revenue growth continued, which further enhanced the effect of the increased multiples. We again applied a 10.0% control premium to reflect the controlling ownership position of Vector Stealth to our market approach estimated enterprise value.
The average enterprise value of the income and market approaches was then adjusted for our working capital and for the fair value of our then-outstanding debt to reach an estimated total equity value. A combined discount of approximately 24.0% of the total equity value was applied, reflecting a combination of both the control discount of the minority stockholders as well as an adjustment for expected lack of marketability due to the absence of a public market and the likelihood of an exit event. The discount for lack of marketability again assumed a potential liquidity event within the coming year although no material change in the immediate likelihood of such event at that time as compared to December 2009. Based on the foregoing factors, our board of directors determined the resulting stock value to be $2.30 per share at February 18, 2010.
March 31, 2010 Valuation
Several factors varied in the March 31, 2010 valuation from the prior valuation. Most significantly, our March 31, 2010 valuation included the complete integration of Aladdin into our operating results, as Aladdin formally became a subsidiary on March 31, 2010.
Projections for integration of our December 2009 acquisition of Assured Decisions as well as of Aladdin were included in our financial projections for the income approach as of March 31, 2010. Our financial projections again reflected a challenging environment in light of the macroeconomic conditions present and expected to continue at that time.
72
Table of Contents
For the “market approach: publicly traded peer group,” given certain changes in the public markets, a new peer group of comparables was used to establish median multiples, which consisted of Blue Coat Systems Inc., Vasco Data Security International Inc., Fortinet Inc., Websense, Inc., Sonicwall, Inc., ICF International, Inc., L-1 Identity Solutions Inc., Stanley Inc., Argon ST, Inc. and Applied Signal Technology, Inc. The resulting multiples were slightly lower than our previous estimates as the expanded pool also included more government and defense contractors with lower multiples than commercial providers. Despite the lower multiples, our own revenue growth continued and included the presence of Aladdin, both of which offset the effect of the decreased multiples. Our assessment of the market approach again also applied a 10.0% control premium to reflect the controlling ownership position of Vector Stealth given that the new peer group again reflected non-controlling ownership values.
The average enterprise value of the income and market approaches was then adjusted for our working capital and for the fair value of our then-outstanding debt to reach an estimated total equity value. A combined discount of approximately 15.0% of the total equity value was applied, reflecting a combination of both the control discount of the minority stockholders as well as an adjustment for expected lack of marketability due to the absence but increasing possibility of a public market or imminent exit event. The discount for lack of marketability again assumed a potential liquidity event within the coming year. Based on the foregoing factors, our board of directors determined the resulting stock value to be $2.42 per share at March 31, 2010.
August 4, 2010
Several factors were considered in our August 4, 2010 valuation. Most significantly, we filed a registration statement with the SEC for this public offering on July 12, 2010.
For the “market approach: publicly traded peer group,” a peer group was used to establish median multiples. The peer group comprised of Blue Coat Systems Inc., Vasco Data Security International Inc., Fortinet Inc., Websense, Inc., Sonicwall, Inc., ICF International, Inc., L-1 Identity Solutions Inc. and Applied Signal Technology, Inc. The resulting multiples were slightly improved from previous levels as overall macroeconomic conditions had improved somewhat since our last valuation. In addition, our own revenue growth added to the effects of the increased multiples.
The weighted average enterprise value of the income and market approaches as adjusted for the liquidity scenario probabilities, was then adjusted for our working capital and for the fair value of our then-outstanding debt to reach an estimated total equity value. A combined discount of approximately 15.0% of the total equity value was applied, reflecting a combination of both the control discount of the minority stockholders as well as an adjustment for expected lack of marketability due to the absence but increasing possibility of a public market or imminent exit event. The discount for lack of marketability again assumed a potential liquidity event within the coming year. Based on the foregoing factors and the judgement and expertise of our board of directors, the resulting value of our common stock was determined to be $3.50 per share, a value somewhat higher than the analytical models described in the foregoing alone would have indicated as of August 4, 2010.
September 29, 2010
Several factors were considered in our September 29, 2010 valuation. Most significantly, we continued with our efforts to complete this offering.
For the “market approach: publicly traded peer group” a peer group was used to establish median multiples. This peer group consisted of Blue Coat Systems Inc., ViaSat, Inc., Harris Corporation, Sypris Solutions, Inc., Check Point Software Technologies, Vasco Data Security International Inc., ArcSight, Inc., ActivIdentity Corp., F5 Networks, Inc. Sourcefire, Inc. McAfee, Inc., Symantec Corporation, EMC Corporation, Fortinet Inc., Websense, Inc., Sonicwall, Inc., L-3 Communications Holdings, Inc., General Dynamics Corporation, ICF International, Inc., L-1 Identity Solutions Inc., NCI, Inc., Stanley, Inc., ManTech International Corporation, CACI International Inc., Argon ST, Inc., Dynamics Research Corporation, Applied Signal Technology, Inc., SAIC, Inc., Kratos
73
Table of Contents
Defense & Security Solutions, Inc., Globalcomm Systems Inc. and SRA International, Inc. The resulting multiples were again slightly improved from our previous estimates as overall macroeconomic conditions had improved somewhat since our last valuation. In addition, our own revenue growth added to the effects of the increased multiples.
The weighted average enterprise value of the income and market approaches, as adjusted for the liquidity scenario probabilities was then adjusted for our working capital and for the fair value of our then-outstanding debt to reach an estimated total equity value. A combined discount of approximately 15.0% of the total equity value was applied, reflecting a combination of both the control discount of the minority stockholders as well as an adjustment for expected lack of marketability due to the absence but increasing possibility of a public market or imminent exit event. The discount for lack of marketability again assumed a potential liquidity event within the coming year. Based on the foregoing factors and the judgement and expertise of our board of directors, the resulting value of our common stock was determined to be $4.00 per share, a value somewhat higher than the analytical models described in the foregoing alone would have indicated at September 29, 2010.
Vector Stealth Equity Grants to Certain Employees
Vector Stealth is a Delaware limited liability company, the membership interests in which are denominated in units (the “Units”) of which there are three classes: Class A Units, Class B Units and Class C Units. Vector Stealth has granted Class C Units to certain of our employees as compensation. Those grants of Class C Units are subject to the terms of the respective agreements and the terms of the Vector Stealth Holdings II, L.L.C. Amended and Restated 2007 Equity Plan as further described in the section titled “Executive Compensation—Benefit Plans—Vector Stealth Holdings II, L.L.C. 2007 Equity Plan” of this prospectus.
The Class C Units represent an interest in the appreciation in value of SafeNet over a baseline established at the date of award and generally vest as to 25% of the total units on the first anniversary of the vesting commencement date and as to the remaining 75% of the total units monthly thereafter over the succeeding three years following the vesting commencement date based on the individual continuing to provide services to us.
As described below, certain Class C Units awarded in 2010 vest only upon completion of an initial public offering or sale of SafeNet at or above a stated valuation. No Class C Unit were issued in 2007 or 2009. The following table reflects the Class C Units issued under the Vector Stealth Holdings II, L.L.C. Amended and Restated 2007 Equity Plan and the number of Class C Units vested at the end of each period:
| Year ended December 31 | Nine months ended September 30, 2010 |
|||||||||||||||
| 2007 | 2008 | 2009 | ||||||||||||||
| Class C units outstanding at beginning of period |
— | — | |
10,139,811 |
|
10,139,811 | ||||||||||
| Class C units awarded |
— | |
10,139,811 |
|
— | 12,286,837 | ||||||||||
| Class C units outstanding at end of period |
— | 10,139,811 | 10,139,811 | 22,426,648 | ||||||||||||
| Class C units vested at end of period |
— | 6,753,114 | 9,284,011 | 12,502,664 | ||||||||||||
During the nine months ended September 30, 2010, Vector Stealth issued an aggregate of 12,286,837 Class C Units to certain of our executive officers, including 1,890,283 Class C Units that only vest upon the completion of our initial public offering or certain change in control events, as defined in the agreement. We expect to recognize the compensation expense of approximately $0.7 million related to such contingent Class C Units at the time we deem probable that such event will be completed.
Also during the nine months ended September 30, 2010, our board of directors authorized the issuance of 3,885,178 of additional shares of our common stock to Vector Stealth in consideration for the Class C Units issued to our executive officers during such period.
The 10,139,811 Class C Units issued and outstanding as of December 31, 2009 were deemed to be an equivalent economic interest in SafeNet Holding Corporation of approximately 4,102,872 shares of our common stock, assuming a complete liquidation of Vector Stealth and a distribution of its interest in us to its members according to its operating agreement.
74
Table of Contents
The 22,426,648 Class C Units issued and outstanding as of September 30, 2010 were deemed to be an equivalent economic interest in SafeNet Holding Corporation of approximately 7,324,484 shares of our common stock, assuming a complete liquidation of Vector Stealth and a distribution of its interest in us to its members according to its operating agreement.
The Class C Units had no intrinsic value at the grant date, December 31, 2009 and September 30, 2010. The fair value of Class C Units awarded during the year ended December 31, 2008 and the nine months ended September 30, 2010 was estimated by application of the Black-Scholes-Merton option pricing model using the fair value of our common stock at the date of grant and the following assumptions:
| Year ended December 31, 2008 |
Nine months ended September 30, 2010 |
|||||||
| Risk-free interest rate |
3.23 | % | 2.90 | % | ||||
| Dividend yield |
0.00 | % | 0.00 | % | ||||
| Expected option life in years |
5.89 | 4.2 to 4.4 | ||||||
| Expected stock price volatility |
60.00 | % | 60.00 | % | ||||
| Fair value of underlying SafeNet common stock |
$ | 1.07 | $ | 2.30 | ||||
| Weighted average fair value of granted stock options |
$ | 0.39 | $ | 1.34 | ||||
We recognize compensation expense in respect of the Class C Units with an equal offsetting charge to “Additional paid-in capital.” Such compensation expense is reflected in our financial results because the awards of Class C Units relate to services provided to us. At December 31, 2009 and September 30, 2010, $0.1 million and $2.3 million, respectively, of total unrecognized compensation cost related to the Class C Units.
Inventories and Reserves for Obsolescence, Excess and Slow Moving Goods
Inventories are stated at the lower of cost or market. Cost is primarily determined based on the first-in first-out method, or FIFO, with the exception of costs associated with our government solutions business, which was acquired in 2004 and has consistently applied the weighted-average method, which has historically approximated FIFO, and Aladdin, which has consistently applied the moving-average cost method.
We establish reserves for slow moving, excess and obsolete inventory. The amounts of the required reserves are estimated based on past experience, sales projections and other factors such as potential technological obsolescence and market acceptance.
Derivative Financial Instruments
Our credit facilities provide for a variable interest rate and require our use of a variable-for-fixed interest rate swap arrangement in order to reduce the volatility associated with fluctuating interest rates for a portion of the total debt outstanding under such credit facilities. Derivative instruments for hedging activities such as our interest rate swap are recognized in the balance sheet and measured at fair value. Gains or losses resulting from changes in the fair value of derivatives are recognized in earnings or recorded in other comprehensive income (loss) and recognized in the consolidated statement of operations when the hedged item affects earnings, depending on the purpose of the derivatives and whether they qualify for, and we have applied hedge accounting treatment.
When applying hedge accounting, our policy is to designate, at a derivative’s inception, the specific assets, liabilities or future commitments being hedged, and to assess the hedge’s effectiveness at inception and on an ongoing basis. We may elect not to designate the derivative as a hedging instrument where the same financial effect is achieved in the financial statements. We do not enter into or hold derivatives for trading or speculative purposes.
The fair value of the interest rate swap agreements is determined using an income approach pricing model prescribed by the Financial Accounting Standards Board, or FASB, based on market-observable inputs, including interest rate curves and market-observable indices. To comply with the provisions of the amended FASB guidance, we have incorporated credit valuation adjustments to appropriately reflect our nonperformance risk.
75
Table of Contents
Recoverability of Intangible Assets, Including Goodwill
We review our indefinite-lived intangible assets for impairment at least annually or more frequently if indicators of impairment exist. Goodwill is currently our only indefinite-lived intangible asset. Our goodwill impairment test requires the use of fair-value techniques, which are inherently subjective. We estimate fair value using an equal weighting of the income and market value approaches for our company. The equal weighting of these two approaches reflects our view that both these valuation methods provided a reasonable estimate of fair value and were equally reliable methods.
Under the income approach, we calculate the fair value based on the present value of estimated future cash flows. Under the market approach, we estimate the fair value based on market multiples of revenue and earnings for comparable publicly traded companies. The estimates and assumptions used in our calculations include revenue growth rates, expense growth rates, expected capital expenditures to determine projected cash flows, expected tax rates and an estimated discount rate to determine present value of expected cash flows. These estimates are based on historical experience, our projections of future operating activity and our weighed average cost of capital based on returns on interest bearing debt and common stock.
The valuation of goodwill could be affected if actual results differ substantially from our estimates. Circumstances that could affect the valuation of goodwill include, among other things, a significant change in our business climate and buying habits of our customers along with increased costs to provide our products and services. Based on our analysis in the fourth quarter of 2008, we recorded an impairment of goodwill of $42.9 million, which was included in operating expenses for the year ended December 31, 2008. Based on our analysis in the fourth quarter of 2009, no impairment of goodwill was indicated for the year ended December 31, 2009.
We also evaluate the recoverability of our long-lived assets. GAAP requires recognition of impairment of long-lived assets in the event that the net book value of such assets exceeds the future undiscounted net cash flows attributable to such assets. We recognize impairment, if any, in the period of identification to the extent the carrying amount of an asset exceeds the fair value of such asset. Based on our analysis, we recorded an impairment of approximately $82.1 million in cost of revenues—amortization and impairment of intangible assets for the year ended December 31, 2008. We did not identify a similar impairment in 2009, as the fair value of the reporting unit substantially exceeded its carrying value.
As of September 30, 2010, based on our projections and performance of our business, there was no indication that we needed to perform an impairment assessment prior to the fourth quarter of 2010.
Income Taxes
We use the asset and liability method in accounting for income taxes. Under this method, deferred income tax assets and liabilities are determined on the difference between financial reporting and tax bases of assets and liabilities and are measured using the enacted tax rates and laws that will be in effect when the differences are expected to reverse.
The calculation of our tax assets and liabilities involves dealing with uncertainties in the application of complex tax regulations. We recognize liabilities for uncertain tax positions based on the two-step process prescribed by applicable accounting principles. The first step is to evaluate the tax position for recognition by determining if the weight of available evidence indicates that it is more likely than not that the position will be sustained on audit, including resolution of related appeals or litigation processes, if any. The second step requires us to estimate and measure the tax benefit as the largest amount that is more likely than not of being realized upon ultimate settlement. It is inherently difficult and subjective to estimate such amounts, as this requires us to determine the probability of various possible outcomes. We reevaluate these uncertain tax positions on a quarterly basis. This evaluation is based on factors including, but not limited to, changes in facts or circumstances, changes in tax law, effectively settled issues under audit, and new audit activity. Such a change in recognition or measurement could result in the recognition of a tax benefit or an additional charge to the tax provision in the relevant period.
76
Table of Contents
As of December 31, 2009, we had $129.5 million of federal and $51.1 million of state net operating loss carry-forwards available to reduce future taxable income. These net operating loss carry-forwards begin to expire in 2017 for both U.S. federal and state income tax purposes and may fully expire by 2028. Our ability to use our net operating loss carry-forwards to offset any future taxable income may currently or in the future be subject to limitations in the event we experience a change of ownership as defined by Section 382 of the Internal Revenue Code.
In addition, as of December 31, 2009, we had $32.6 million of non-U.S. net operating loss carry-forwards available to reduce future taxable income in certain foreign jurisdictions. These net operating loss carry-forwards begin to expire in 2011, and as many as $16.5 million will expire by 2015. The remaining balance is not subject to expiration.
As of December 31, 2009 and 2008, we recorded valuation allowances against certain deferred tax assets of $52.6 million and $31.4 million, respectively. At December 31, 2009 and 2008, the valuation allowances were primarily related to our inability to recognize tax benefits associated with U.S. net operating losses and certain non-U.S. net operating losses.
Prior to our acquisition by Vector Stealth in April 2007, we asserted that all investments in our foreign subsidiaries were permanent in nature and accordingly did not record deferred taxes. Subsequent to the acquisition, we reevaluated this assertion based on our debt servicing cash needs. As a result, from the period immediately following our acquisition until December 31, 2008, we reestablished deferred taxes for substantially all of the tax basis differences in foreign subsidiaries. Following December 31, 2008, we have deemed our earnings as permanently reinvested in those foreign subsidiaries, excluding those repatriated under other anti-deferral provisions of the Internal Revenue Code. Statutes of limitations and lack of liquid assets inhibited the ability to repatriate funds from these foreign subsidiaries in 2009. We will continue to evaluate future years to determine annually whether the outside basis differences in foreign subsidiaries give rise to additional deferred tax liabilities.
Recent Accounting Pronouncements
On January 1, 2009, we adopted the authoritative guidance issued by the FASB on business combinations. This guidance addresses the manner in which the acquirer of a business recognizes and measures in its financial statements the identifiable assets acquired, the liabilities assumed, and any non-controlling interest in the acquired business. This guidance also provides standards for recognizing and measuring the goodwill acquired in the business combination and for disclosure of information to enable users of the financial statements to evaluate the nature and financial effects of the business combination. We adopted this guidance for all business combinations completed as of January 1, 2009. The adoption of this guidance increased our losses due to required recognition of acquisition and restructuring costs through operating losses.
In April 2009, the FASB issued new guidance that redefines what constitutes an other-than-temporary impairment, defines credit and non-credit components of an other-than-temporary impairment, prescribes their financial statement treatment, and requires enhanced disclosures relating to such impairments. This guidance was effective for the interim and annual reporting periods ending after June 15, 2009, and was adopted as of the annual reporting period ending December 31, 2009. The adoption of this guidance did not have a material impact on our results of operations or financial position.
In June 2009, the FASB issued a new accounting standard related to the consolidation of variable interest entities. The standard eliminates the quantitative approach previously required for determining the primary beneficiary of a variable interest entity and requires ongoing qualitative reassessments of whether an enterprise is the primary beneficiary of a variable interest entity. This new standard also requires additional disclosures about an enterprise’s involvement in variable interest entities. We adopted this standard effective January 1, 2010. The adoption of this guidance did not materially impact our results of operations, financial position or related disclosures.
77
Table of Contents
In August 2009, the FASB issued authoritative guidance to improve the consistency with which companies apply fair value measurements guidance to liabilities. This guidance is effective for interim and annual periods beginning after September 30, 2009. The adoption of this guidance did not materially impact our results of operations, financial position or related disclosures.
In September 2009, the FASB also ratified the final consensus reached by the EITF that modifies the scope of the software revenue recognition guidance to exclude (a) non-software components of tangible products and (b) software components of tangible products that are sold, licensed or leased with tangible products when the software components and non-software components of the tangible product function together to deliver the tangible product’s essential functionality. The guidance will be effective for our fiscal 2011 beginning January 1, 2011 with early adoption permitted. The guidance may be applied retrospectively or prospectively for new or materially modified arrangements. We are in the process of evaluating the effects, if any, the adoption of the guidance will have on our consolidated financial statements.
In January 2010, the FASB issued authoritative guidance for fair value measurements, which requires new disclosures regarding significant transfers in and out of Level 1 and 2 fair value measurements and gross presentation of activity within the reconciliation for Level 3 fair value measurements. The guidance also clarifies existing requirements on the level of disaggregation and required disclosures regarding inputs and valuation techniques for both recurring and nonrecurring Level 2 and 3 fair value measurements. The guidance is effective for interim and annual reporting periods beginning after December 15, 2009, with the exception of gross presentation of Level 3 activity, which is effective for interim and annual reporting periods beginning after December 15, 2010. The adoption of this guidance did not have a material effect on our financial condition, or results of operations.
78
Table of Contents
Results of Operations
The following table sets forth selected consolidated statements of operations data for each of the periods indicated.
| Predecessor Period* |
Successor Period* | |||||||||||||||||||||||
| Period from January 1, 2007 to April 11, 2007 |
Period from April 12, 2007 to December 31, 2007 |
Year Ended December 31, |
Nine Months Ended September 30, |
|||||||||||||||||||||
| 2008 | 2009 | 2009 | 2010 | |||||||||||||||||||||
| (unaudited) | ||||||||||||||||||||||||
| (dollars in millions, except per share data) |
||||||||||||||||||||||||
| Consolidated Statement of Operations Data: |
||||||||||||||||||||||||
| Revenues: |
||||||||||||||||||||||||
| Products |
$ | 63.7 | $ | 197.2 | $ | 283.6 | $ | 348.7 | $ | 254.6 | $ | 283.9 | ||||||||||||
| Service and maintenance |
10.1 | 29.2 | 45.4 | 55.0 | 39.3 | 50.2 | ||||||||||||||||||
| Total revenues |
73.8 | 226.4 | 329.0 | 403.7 | 293.9 | 334.1 | ||||||||||||||||||
| Costs of revenues: |
||||||||||||||||||||||||
| Products (excluding amortization and impairment of intangible assets) |
34.1 | 91.1 | 128.7 | 141.9 | 105.5 | 117.6 | ||||||||||||||||||
| Service and maintenance (excluding amortization and impairment of intangible assets) |
2.5 | 7.1 | 11.5 | 10.4 | 7.7 | 10.3 | ||||||||||||||||||
| Amortization and impairment of intangible assets |
3.7 | 26.4 | 117.2 | 31.9 | 23.7 | 24.6 | ||||||||||||||||||
| Total cost of revenues |
40.3 | 124.6 | 257.4 | 184.2 | 136.9 | 152.5 | ||||||||||||||||||
| Gross profit |
33.5 | 101.8 | 71.6 | 219.5 | 157.0 | 181.6 | ||||||||||||||||||
| Operating expenses: |
||||||||||||||||||||||||
| Research and development expenses |
19.3 | 34.0 | 47.9 | 60.6 | 47.5 | 45.4 | ||||||||||||||||||
| Sales and marketing expenses |
21.6 | 35.3 | 56.6 | 81.5 | 57.5 | 70.9 | ||||||||||||||||||
| General and administrative expenses |
41.1 | 33.8 | 47.2 | 56.0 | 42.7 | 40.3 | ||||||||||||||||||
| Class action settlement |
— | — | — | 25.0 | — | — | ||||||||||||||||||
| Amortization of intangible assets |
1.9 | 5.1 | 6.8 | 10.4 | 7.6 | 7.5 | ||||||||||||||||||
| Impairment of goodwill |
— | — | 42.9 | — | — | — | ||||||||||||||||||
| Loss on sale of business and net assets held for sale |
— | — | — | 2.5 | 1.5 | 0.7 | ||||||||||||||||||
| Restructuring expenses |
— | — | — | 5.5 | 3.1 | 0.2 | ||||||||||||||||||
| Operating (loss) income |
(50.4 | ) | (6.4 | ) | (129.8 | ) | (22.0 | ) | (2.9 | ) | 16.6 | |||||||||||||
| Foreign exchange (loss) gain |
(0.3 | ) | — | (2.5 | ) | (0.9 | ) | (0.8 | ) | 0.6 | ||||||||||||||
| Interest income (expense), net |
0.9 | (24.1 | ) | (34.2 | ) | (30.3 | ) | (23.0 | ) | (21.9 | ) | |||||||||||||
| Other income (expense), net |
— | 0.2 | 0.8 | 2.6 | 2.5 | (0.4 | ) | |||||||||||||||||
| (Loss) before income taxes |
(49.8 | ) | (30.3 | ) | (165.7 | ) | (50.6 | ) | (24.2 | ) | (5.1 | ) | ||||||||||||
| Income tax expense (benefit) |
1.0 | 7.0 | (39.2 | ) | (0.9 | ) | 0.1 | 3.6 | ||||||||||||||||
| Net (loss) |
$ | (50.8 | ) | $ | (37.3 | ) | $ | (126.5 | ) | $ | (49.7 | ) | $ | (24.3 | ) | $ | (8.7 | ) | ||||||
| Net loss per common share: |
||||||||||||||||||||||||
| Basic and diluted |
$ | (2.41 | ) | $ | (0.41 | ) | $ | (1.10 | ) | $ | (0.34 | ) | $ | (0.16) | $ | (0.06) | ||||||||
| Weighted average common shares outstanding: |
||||||||||||||||||||||||
| Basic and diluted |
21,107 | 90,505 | 115,233 | 147,877 | 147,877 | 150,991 | ||||||||||||||||||
| * | Our consolidated statement of operations data for the calendar year ended December 31, 2007 reflect our activity in both the Predecessor Period and Successor Period during that year. For further information on this presentation, see “—Presentation of Financial Statements—Predecessor and Successor Entities.” |
79
Table of Contents
The following table sets forth selected consolidated statements of operations data as a percentage of total revenues for each of the periods indicated.
| Predecessor Period* |
Successor Period* | |||||||||||||||||||||||
| Period from January 1, 2007 to April 11, 2007 |
Period from April 12, 2007 to December 31, 2007 |
Year Ended December 31, |
Nine Months Ended September 30, |
|||||||||||||||||||||
| 2008 | 2009 | 2009 | 2010 | |||||||||||||||||||||
| (unaudited) | ||||||||||||||||||||||||
| Revenues: |
||||||||||||||||||||||||
| Products |
86.3 | 87.1 | 86.2 | 86.4 | 86.6 | 85.0 | ||||||||||||||||||
| Service and maintenance |
13.7 | 12.9 | 13.8 | 13.6 | 13.4 | 15.0 | ||||||||||||||||||
| Total revenues |
100.0 | % | 100.0 | % | 100.0 | % | 100.0 | % | 100.0 | % | 100.0 | % | ||||||||||||
| Costs of revenues: |
||||||||||||||||||||||||
| Products (excluding amortization and impairment of intangible assets) |
46.2 | 40.2 | 39.1 | 35.1 | 35.9 | 35.2 | ||||||||||||||||||
| Service and maintenance (excluding amortization and impairment of intangible assets) |
3.4 | 3.1 | 3.5 | 2.6 | 2.6 | 3.1 | ||||||||||||||||||
| Amortization and impairment of intangible assets |
5.0 | 11.7 | 35.6 | 7.9 | 8.1 | 7.4 | ||||||||||||||||||
| Total cost of revenues |
54.6 | 55.0 | 78.2 | 45.6 | 46.6 | 45.6 | ||||||||||||||||||
| Gross profit margin |
|
45.4 |
|
|
45.0 |
|
21.8 | 54.4 | 53.4 | 54.4 | ||||||||||||||
| Operating expenses: |
||||||||||||||||||||||||
| Research and development expenses |
26.2 | 15.0 | 14.6 | 15.0 | 16.2 | 13.6 | ||||||||||||||||||
| Sales and marketing expenses |
29.3 | 15.6 | 17.3 | 20.2 | 19.6 | 21.2 | ||||||||||||||||||
| General and administrative expenses |
55.7 | 14.9 | 14.3 | 13.9 | 14.5 | 12.1 | ||||||||||||||||||
| Class action settlement |
— | — | — | 6.2 | — | — | ||||||||||||||||||
| Amortization of intangible assets |
2.6 | 2.3 | 2.1 | 2.6 | 2.6 | 2.2 | ||||||||||||||||||
| Impairment of goodwill |
— | — | 13.0 | — | — | — | ||||||||||||||||||
| Loss on sale of business and net assets held for sale |
— | — | — | 0.6 | 0.5 | 0.2 | ||||||||||||||||||
| Restructuring expenses |
— | — | — | 1.4 | 1.1 | 0.1 | ||||||||||||||||||
| Operating (loss) income |
(68.3 | ) | (2.8 | ) | (39.5 | ) | (5.5 | ) | (1.0 | ) | 5.0 | |||||||||||||
| Foreign exchange (loss) gain |
(0.4 | ) | — | (0.8 | ) | (0.2 | ) | (0.3 | ) | 0.2 | ||||||||||||||
| Interest (expense) income, net |
1.2 | (10.6 | ) | (10.3 | ) | (7.5 | ) | (7.8 | ) | (6.6 | ) | |||||||||||||
| Other income (expense), net |
— | |
0.1 |
|
0.2 | 0.6 |
|
0. 9 |
|
(0.1 | ) | |||||||||||||
| (Loss) before income taxes |
(67.5 | ) | (13.4 | ) | (50.4 | ) | (12.6 | ) | (8.2 | ) | (1.5 | ) | ||||||||||||
| Income tax expense (benefit) |
1.4 | 3.1 | (12.0 | ) | (0.3 | ) | — | 1.1 | ||||||||||||||||
| Net (loss) |
(68.8 | )% | (16.5 | )% | (38.4 | )% | (12.3 | )% | (8.3 | )% | (2.6 | )% | ||||||||||||
| * | Our consolidated statement of operations data for the calendar year ended December 31, 2007 reflects our activity in both the Predecessor Period and Successor Period during that year. For further information on this presentation, see “—Presentation of Financial Statements—Predecessor and Successor Entities.” |
80
Table of Contents
Nine Months Ended September 30, 2010 as Compared to Nine Months Ended September 30, 2009
Revenues
| Nine Months Ended September 30, |
Change | |||||||||||||||
| (dollars in millions) |
2009 | 2010 | $ | % | ||||||||||||
| Products |
$ | 254.6 | $ | 283.9 | $ | 29.3 | 11.5 | % | ||||||||
| Service and maintenance |
39.3 | 50.2 | 10.9 | 27.7 | ||||||||||||
| Total revenues |
$ | 293.9 | $ | 334.1 | $ | 40.2 | 13.7 | % | ||||||||
Products revenues increased for the nine months ended September 30, 2010 as compared to the nine months ended September 30, 2009. Revenue derived from sales of our data protection products grew approximately $5.6 million, or 2.7%, to approximately $212.0 million for the nine months ended September 30, 2010 as compared to the nine months ended September 30, 2009, driven by increased sales volume of our authentication and HSM solutions as well as the Aladdin acquisition. Revenues derived from sales of our software rights management products grew approximately $23.6 million, or 48.9%, to approximately $71.9 million for the nine months ended September 30, 2010 as compared to the nine months ended September 30, 2009, driven primarily by improved sales distribution channels, which improved our revenue realization from transactions with end customers. In addition, our acquisition of Aladdin contributed to increased revenues from sales of our software rights management products. These increases were partially offset by the divestitures of our MediaSentry assets and our Embedded Solutions Division, the declining sales of a single mature product to the U.S. government and certain delays in government purchasing related to budget approvals.
Total service and maintenance revenues increased for the nine months ended September 30, 2010 as compared to the nine months ended September 30, 2009, primarily as a result of the acquisitions of Aladdin and Assured Decisions.
As noted above, our year-over-year revenue growth was affected by several acquisitions and divestitures. Aladdin was acquired as of March 24, 2009, Assured Decisions was acquired on December 22, 2009, our MediaSentry assets were divested on March 30, 2009, and our Embedded Solutions Division was divested on February 26, 2010. Revenues of Aladdin included in our consolidated results of operations during the nine months ended September 30, 2009 were approximately $52.1 million as compared to approximately $81.2 million during the nine months ended September 30, 2010. No revenues of Assured Decisions were included in our consolidated results of operations during the nine months ended September 30, 2009 as compared to approximately $5.0 million during the nine months ended September 30, 2010. Revenues related to MediaSentry included in our consolidated results of operations during the nine months ended September 30, 2009 were approximately $1.1 million. There was no MediaSentry revenue during the nine months ended September 30, 2010. Revenues related to our Embedded Solutions Division included in our consolidated results of operations during the nine months ended September 30, 2009 were approximately $16.4 million as compared to approximately $3.0 million during the nine months ended September 30, 2010.
Changes in our revenues by geography were as follows:
| Nine Months Ended September 30, |
Change | |||||||||||||||
| (dollars in millions) |
2009 | 2010 | $ | % | ||||||||||||
| Americas |
$ | 212.0 | $ | 221.2 | $ | 9.2 | 4.3 | % | ||||||||
| Europe, Middle East and Africa |
55.6 | 81.7 | 26.1 | 46.9 | ||||||||||||
| Asia Pacific |
26.3 | 31.2 | 4.9 | 18.6 | ||||||||||||
These increases from the nine months ended September 30, 2009 to the nine months ended September 30, 2010 were driven by market demand for our software rights management and data protection products as indicated above, coupled with the inclusion of revenues from our Aladdin acquisition. For further information with respect to our geographic markets, see Note 22 to our consolidated financial statements included elsewhere in this prospectus.
81
Table of Contents
Cost of Revenues and Gross Profit Margins
| Nine Months Ended September 30, |
Change | |||||||||||||||||||||||||||
| (dollars in millions) |
2009 | 2010 | $ | % | ||||||||||||||||||||||||
| Cost of products revenues (excluding amortization and impairment of intangible assets) |
$ | 105.5 | $ | 117.6 | $ | 12.1 | 11.5 | % | ||||||||||||||||||||
| Gross profit of products revenues (excluding amortization and impairment of intangible assets) |
$ | 149.1 | $ | 166.3 | $ | 17.2 | 11.5 | % | ||||||||||||||||||||
| Gross profit margin of products revenues (excluding amortization and impairment of intangible assets) |
58.5 | % | 58.6 | % | ||||||||||||||||||||||||
| Cost of service and maintenance revenues (excluding amortization and impairment of intangible assets) |
$ | 7.7 | $ | 10.3 | $ | 2.6 | 33.8 | % | ||||||||||||||||||||
| Gross profit of service and maintenance revenues (excluding amortization and impairment of intangible assets) |
$ | 31.6 | $ | 39.9 | $ | 8.3 | 1,980 | $ | — | $ | — | $ | 1,980 | |||||||||||||||
| Liabilities |
||||||||||||||||||||||||||||
| Term loans (a) |
— | 340,821 | — | 340,821 | ||||||||||||||||||||||||
| Interest rate swap agreements |
— | 18,252 | — | 18,252 | ||||||||||||||||||||||||
| December 31, 2009 |
||||||||||||||||||||||||||||
| Assets |
||||||||||||||||||||||||||||
| Foreign currency derivative contract |
— | 74 | — | 74 | ||||||||||||||||||||||||
| Liabilities |
||||||||||||||||||||||||||||
| Term loans (a) |
— | 337,496 | — | 337,496 | ||||||||||||||||||||||||
| Interest rate swap agreements |
— | 18,845 | — | 18,845 | ||||||||||||||||||||||||
| December 31, 2008 |
||||||||||||||||||||||||||||
| Assets |
||||||||||||||||||||||||||||
| Available for sale securities—investment in Aladdin Knowledge Systems |
8,748 | — | — | 8,748 | ||||||||||||||||||||||||
| Liabilities |
||||||||||||||||||||||||||||
| Term loans (a) |
— | 276,233 | — | 276,233 | ||||||||||||||||||||||||
| Interest rate swap agreements |
— | 21,766 | — | 21,766 | ||||||||||||||||||||||||
| (a) | The carrying value of current and long-term portions consolidated as of December 31, 2008 and 2009 and September 30, 2010 (unaudited) was $366.3 million, $412.5 million and $372.9 million, respectively. |
The Company determined that the fair value of the Long-Term Loan discussed in Note 10 at December 31, 2009 of $48.8 million approximates fair value.
F-49
Table of Contents
SafeNet Holding Corporation Consolidated Financial Statements
Notes to Consolidated Financial Statements—Continued
(13) RESTRUCTURING ACCRUAL
The following is a summary of changes in the restructuring accrual liability during the years ended December 31, 2008 and 2009 and the unaudited nine month period ended September 30, 2010 (in thousands):
| Year Ended December 31, |
Nine
months Ended September 30, 2010 |
|||||||||||
| 2008 | 2009 | |||||||||||
| (unaudited) | ||||||||||||
| Balances at January 1, 2008, 2009, and 2010 respectively |
$ | 3,168 | $ | 1,485 | $ | 2,155 | ||||||
| Liability accretion |
154 | 58 | 89 | |||||||||
| Foreign exchange (loss) |
(225 | ) | (134 | ) | (226 | ) | ||||||
| Cash reductions |
(1,612 | ) | (4,536 | ) | (1,586 | ) | ||||||
| Additions |
— | 5,282 | — | |||||||||
| Balances at December 31, 2008, 2009 and September 30, 2010 |
$ | 1,485 | $ | 2,155 | $ | 432 | ||||||
The restructuring accrual consists of unpaid amounts relating to lease termination liabilities (net of sublease income) and severance liabilities initially recorded by the Company. Severance liabilities pertain to amounts owed to employees that were made redundant as a result of the acquisition of Aladdin. At December 31, 2008 and 2009 and September 30, 2010 (unaudited), $1.1 million, $0.7 million and $0.2 million (unaudited), respectively, of lease termination liabilities are classified as current liabilities and are included in “Accrued expenses and other current liabilities.” The long-term liability of the restructuring accrual was $0.4 million and $1.6 million at December 31, 2008 and 2009. No amount was accrued as a long-term liability for restructuring as of September 30, 2010 (unaudited). The 2008 balance is included in “Other liabilities” in the accompanying consolidated balance sheets. The balances represent the Company’s current expectation that it has to pay the lease payments over the remaining lease terms through 2010.
(14) STOCKHOLDER’S EQUITY
Common Stock, Stock Split and Additional Paid-In Capital
Upon the Merger of SafeNet and SAC, SafeNet’s capitalization consisted of 100 shares of common stock, $0.001 par value authorized, issued and outstanding, all of which were owned by Vector Stealth.
On April 16, 2007, SafeNet returned to Vector Stealth $1.0 million of capital it had received upon the Merger.
On December 17, 2007, the Board of Directors approved amended and restated articles of incorporation for SafeNet to (i) increase the authorized shares of common stock to 100,000,000 shares of $0.001 par value common stock, and (ii) authorize a 905,054.12 for one stock split of the common stock of SafeNet pursuant to which each one share of common stock was converted to 905,054.12 shares of common stock. As a result of the stock split, SafeNet issued 90,504,512 shares to Vector Stealth.
During 2008 and 2009 the Company made restricted junior payments of $9.0 million and $3.0 million, respectively to Vector Stealth. These payments are reflected as a return of capital in the accompanying consolidated statements of stockholder’s equity.
In February 2010, the Company issued to Vector Stealth 4,736,843 shares of common stock as consideration for Vector Stealth’s $12.5 million capital contribution made in connection with the Ingrian acquisition completed in April 2008. For accounting purposes, the shares were treated as issued and outstanding as of April 2008.
F-50
Table of Contents
SafeNet Holding Corporation Consolidated Financial Statements
Notes to Consolidated Financial Statements—Continued
The Board of Directors also authorized the issuance of 3,885,178 of additional shares to Vector Stealth in consideration for Vector Stealth interests issued to certain SafeNet executive officers (See Note 15).
In February 2010, the Board of Directors approved, amended and restated the articles of incorporation for SafeNet to increase the authorized shares to 200,000,000 shares of $0.001 par value common stock.
Beginning in August 2008 and through March 24, 2009, Parent made capital contributions of $135.1 million to Jasmine to fund the purchase price and transaction costs for the Aladdin acquisition (see Note 3). On March 31, 2010, the Company issued 52,635,307 shares of common stock to Vector Stealth, and paid $39.6 million to Aladdin’s debt holder, to acquire Jasmine and its subsidiaries, Magic Lamp and Aladdin, and pay off the existing debt obligations of Aladdin. As of March 31, 2010, Jasmine and its subsidiaries, Magic Lamp and Aladdin, became wholly owned subsidiaries of SafeNet. Since the Company and Jasmine were entities under common control since August 2008, and the financial position and results of operations and cash flows of both entities were retrospectively combined as from such date, the 52,635,307 shares issued to Vector Stealth were retrospectively recorded in the consolidated statement of stockholder’s equity at August 2008.
Accumulated Other Comprehensive Loss
Accumulated other comprehensive loss consists of the following (in thousands):
| December 31, 2008 |
December 31, 2009 |
September 30, 2010 |
||||||||||
| (unaudited) | ||||||||||||
| Foreign currency translation adjustment (1) |
$ | 402 | $ | 1,449 | $ | 1,276 | ||||||
| Interest rate swap agreements (2) |
(21,766 | ) | (19,131 | ) | (18,257 | ) | ||||||
| Foreign currency hedge |
— | — | 110 | |||||||||
| Unrealized gain (loss) on available-for-sale-securities |
(4,843 | ) | 49 | (766 | ) | |||||||
| Balances at December 31, 2008 and 2009, respectively |
$ | (26,207 | ) | $ | (17,633 | ) | $ | (17,637 | ) | |||
| (1) | The foreign currency translation adjustment in accumulated other comprehensive loss at December 31, 2008 is net of tax expense of $0.4 million. No tax effect was included in foreign currency translation adjustment at December 31, 2009 and September 30, 2010. |
| (2) | The net unrealized loss related to interest rate swap agreements in accumulated other comprehensive loss at the years ended December 31, 2008 and 2009 and September 30, 2010 (unaudited) is net of a tax benefit of $8.5 million, $7.8 million and $6.9 million, respectively, offset by valuation allowance of $8.5 million, $7.8 million and $6.9 million, respectively (See Note 11). |
(15) STOCK INCENTIVE PLAN
On December 17, 2007 SafeNet adopted a Stock Incentive Plan (the “2007 Equity Plan”) pursuant to which SafeNet may issue options and/or stock or stock units. The purpose of the 2007 Equity Plan is to promote the success of SafeNet and the interests of its stockholders by providing a means through which SafeNet may grant equity-based incentives to attract, motivate, retain and reward certain officers, employees, directors and other eligible persons and to further link the interests of award recipients with those of SafeNet’s stockholders generally.
Awards may be granted under the 2007 Equity Plan to officers and employees of SafeNet, any member of the Board of Directors of SafeNet or its affiliates, and to consultants and advisors for services provided to SafeNet or one of its affiliates.
F-51
Table of Contents
SafeNet Holding Corporation Consolidated Financial Statements
Notes to Consolidated Financial Statements—Continued
A total of 2,703,020 shares of common stock were originally authorized for issuance under the 2007 Equity Plan. This amount was increased by 2,055,439 shares in 2008 and by a further 4,855,128 shares in 2009, bringing the total number of shares authorized under the plan through December 31, 2009 to 9,613,587 shares. Shares deliverable under the 2007 Equity Plan may be authorized but unissued shares or treasury shares.
Options granted under the stock option grant program may be either non-qualified stock options or “incentive stock options” as defined under the Internal Revenue Code of 1986, as amended (the “Code”).
The exercise price of a stock option shall be determined by SafeNet at the time of each grant. In no case shall the exercise price of an option be less than the greater of (i) the par value of the common stock, and (ii) in the case of incentive stock options, 100% of the fair market value of the common stock on the date of grant (110% for any persons who, at the time of grant, own more than 10% of the consolidated voting power of SafeNet). The contractual term of options granted is generally ten years, except in the case of incentive stock options issued to persons owning more than 10% of the consolidated voting power of SafeNet, in which case the incentive stock option is not exercisable more than five years after the date of grant. Options generally vest over a term of four years as follows: 25% on the first anniversary of the vesting commencement date, and 75% on an equal basis over the succeeding twelve quarters.
Stock awards may be restricted or unrestricted. The restrictions imposed on the shares of common stock subject to a restricted stock award may be based on performance criteria, passage of time or other factors or any combination thereof. A stock award shall either vest or be forfeited not more than 10 years after the date of grant. Unless otherwise specified, upon termination of employment, restricted shares that remain subject to vesting conditions will be reacquired by SafeNet at a price equal to the lower of (a) the fair market value of the restricted shares at the time of the termination, or (b) the original purchase price of the restricted shares, without interest, to the participant to the extent not prohibited by law. Unless otherwise provided, participants are entitled to cash dividend and voting rights for all restricted shares issued even though they are not vested, but such rights will terminate immediately as to any restricted shares which cease to be eligible for vesting.
Outstanding awards under the 2007 Equity Plan (issued under both the option grant program and stock award program) are subject to certain acceleration clauses relating to a change of control of SafeNet as defined in the 2007 Equity Plan. The Company may, at its option, acquire or settle rights under the outstanding awards in cash, stock of equivalent value or other consideration.
During the 2007 Successor Period, the years ended December 31, 2008 and 2009, and the unaudited nine months ended September 30, 2010, options to purchase 1,886,937, 1,833,398, 2,547,844 and 3,882,273 shares of common stock were issued to employees under the stock option program, respectively. There were 3,925,616 and 461,115 unused shares of common stock available to be granted under the 2007 Equity Plan as of December 31, 2009, and September 30, 2010 (unaudited), respectively.
The Company accounts for stock awards issued under the 2007 Equity Plan in accordance with fair value recognition principles. Stock-based compensation expense for all share-based payment awards granted is based on the grant date fair value. The Company recognizes compensation costs net of an estimated forfeiture rate and recognizes the compensation costs for only those shares expected to vest on a straight line basis over the requisite service period of the award, which is generally the option vesting term. The Company estimates forfeiture rates based on historical attrition rates by equal employment opportunity commission category.
Stock-based compensation expense is generally recognized ratably from the date of grant over the vesting period of the award. Where an award is fully or partially vested at the date of grant, the compensation associated with the vested portion of the award is recognized at the date of grant based upon the grant-date fair value. The
F-52
Table of Contents
SafeNet Holding Corporation Consolidated Financial Statements
Notes to Consolidated Financial Statements—Continued
options granted on April 29, 2008 and December 17, 2007 vested as to 25% of the shares subject to such options on April 11, 2008. Because 25% of the options granted on April 29, 2008 were vested at the date of grant, SafeNet recognized compensation cost for the vested portion of the options at the date of grant. For the options issued on December 17, 2007, the first 25% of the compensation cost was recognized over the period from the issuance date through April 11, 2008.
The Company used the Black-Scholes-Merton option pricing model to value the options issued. The expected life computation is based on the average of the vesting period and the contractual life of the options. This average results in an estimated expected life of approximately six years. The interest rate for periods within the contractual life of the award is based on the U.S. Treasury yield curve in effect at the time of grant.
All of SafeNet’s publicly traded shares of common stock were tendered and cancelled effective April 11, 2007 pursuant to the acquisition of SafeNet by Vector Stealth, and new shares then authorized and issued, as well as subsequent issuances and stock split of such shares, and are no longer publicly traded. For purposes of determining a volatility factor, because the shares are not publicly traded, and due to the relatively short amount of time such shares have been outstanding, there is not sufficient historical information available. As an alternative, SafeNet accounted for options based on a value calculated by substituting the historical volatility of an appropriate industry sector index for expected volatility of its share price. In determining SafeNet’s equity value, the market approach and income approach methods were used. The market approach provides an indication of value by relating the equity or invested capital (debt plus equity) of guideline companies to various measures of their earnings and cash flow, and then applying such multiples to the business being valued. The market approach makes use of market price data of stocks of corporations engaged in the same or a similar line of business as that of the subject company. Stocks of these corporations are actively traded in a public, free, and open market, either on an exchange or over the counter. Although it is clear no two companies are entirely alike, the only restrictive requirement imposed by this method is that the corporations selected as guideline companies be engaged in the same or a similar lines of business, or are subject to similar financial business risks, including the opportunity for growth. Similar to SafeNet, the selected group of guideline companies falls under the industry sector for software and programming; however, more specifically, these companies provide technologies for enterprise and network security for commercial and government applications. In the income approach, the value is dependent on the present worth of future economic benefits to be derived from ownership. Future net cash flows available for distribution are discounted at market-based rates of return to provide an indication of value. The future cash flows of a business enterprise are estimated, and then individually discounted back to present value.
The fair value of share-based payment awards was estimated using the Black-Scholes-Merton option pricing model with the following assumptions and weighted average fair value for the options issued, as follows:
| Successor Period | ||||||||
| Period from April 11, 2007 to December 31, 2007 |
Year Ended December 31, |
Nine Months Ended | ||||||
| 2008 | 2009 | |||||||
| (unaudited) | ||||||||
| Risk-free interest rate |
3.70% | 3.23% - 3.32% | 2.26 - 3.27% | 1.60% - 2.90% | ||||
| Dividend yield |
0.00% | 0.00% | 0.00% | 0.00% | ||||
| Expected option life in years |
5.78 | 5.62 - 6.08 | 6.02 - 6.11 | 6.11 - 6.14 | ||||
| Expected stock price volatility |
66.00% | 60.00% - 66.00% | 60.00% | 60.00% | ||||
| Weighted average fair value of granted stock options |
$1.50 | $0.39 - $1.48 | $0.27 -$1.24 | $1.26 - $1.81 | ||||
F-53
Table of Contents
SafeNet Holding Corporation Consolidated Financial Statements
Notes to Consolidated Financial Statements—Continued
Option activity under the 2007 Equity Plan is as follows:
| Number of Shares (thousands) |
Weighted Average Exercise Price |
Weighted Average Remaining Contractual Terms (years) |
||||||||||
| Outstanding at April 12, 2007 |
— | |||||||||||
| Granted |
1,887 | $ | 2.64 | |||||||||
| Exercised |
— | |||||||||||
| Cancelled or forfeited |
— | |||||||||||
| Outstanding at December 31, 2007 |
1,887 | $ | 2.64 | 9.96 | ||||||||
| Granted |
1,833 | $ | 2.64 | |||||||||
| Exercised |
— | |||||||||||
| Cancelled or forfeited |
(208 | ) | ||||||||||
| Outstanding at December 31, 2008 |
3,512 | $ | 2.64 | 9.19 | ||||||||
| Granted |
2,548 | $ | 2.64 | |||||||||
| Exercised |
— | |||||||||||
| Cancelled or forfeited |
(372 | ) | ||||||||||
| Outstanding at December 31, 2009 |
5,688 | $ | 2.64 | 8.50 | ||||||||
| Vested and expected to vest at December 31, 2009 |
5,029 | $ | 2.64 | 8.50 | ||||||||
| Exercisable at December 31, 2009 |
1,810 | $ | 2.64 | 8.50 | ||||||||
Intrinsic value represents the difference between the fair value per share of SafeNet’s stock price at the respective balance sheet date and the exercise price, multiplied by the number of in-the-money options that would have been received by the option holders had all option holders exercised their options at such dates. Aggregate intrinsic value varies pursuant to changes in the fair market value of SafeNet’s stock. During the 2007 Successor Period, and the years ended December 31, 2008 and 2009, the exercise price of all shares issued under the 2007 Equity Plan exceeded the fair value of the Company’s common stock.
The Company also granted 250,000 stock options to certain executives that only vest upon the completion of the Company’s initial public offering or certain change in control events, as defined in the agreement. The Company will recognize the compensation expense related to these stock options of $0.3 million at the time the Company deems probable that such event will be completed.
The weighted average remaining contractual life of options outstanding at the 2007 Successor Period and at December 31, 2009 and 2008 is consistent with the weighted average remaining contractual life for fully vested share options and share options expected to vest.
At December 31, 2009 and September 30, 2010 (unaudited), $2.8 million and $5.5 million, respectively, of total unrecognized compensation cost related to stock options is expected to be recognized over a weighted-average period of 1.9 years and 2.4 years, respectively.
F-54
Table of Contents
SafeNet Holding Corporation Consolidated Financial Statements
Notes to Consolidated Financial Statements—Continued
Vector Stealth Equity Grants to Key Personnel of the Company
Vector Stealth, the Company’s sole stockholder, is a Delaware limited liability company the membership interests in which are denominated in units (the “Units”) of which there are three classes: Class A Units, Class B Units and Class C Units. Vector Stealth has granted Class C Units (the “Class C Unit Grants”) to certain key employees of the Company. The Class C Unit Grants are subject to the terms of the respective agreements and the terms of the Vector Stealth Holdings II, L.L.C. Amended and Restated 2007 Equity Plan (the “Class C Unit Plan”).
The Class C Units are membership interests that entitle holders to receive their allocable percentage of the appreciation in value of Vector Stealth in excess of a designated value representing the liquidation value of Vector Stealth’s assets as of the grant date. The fair value of the Class C Units was determined by application of the Black-Scholes-Merton option pricing model using the fair value of the Company’s common stock at the date of grant. The Class C Units were granted for services rendered and have no purchase or exercise price and an initial capital account balance of $0. Class C Units are generally non-transferable and have a contractual expiration date of 10 years. Class C Units are subject to a service-based risk of forfeiture that generally lapses as to 25% of the Class C Units on the first anniversary of the vesting commencement date and as to the remaining 75% monthly over the three years following the vesting commencement date, subject to the holder’s continued service with SafeNet or a subsidiary through such vesting dates. Upon a holder’s termination of service, unvested Class C Units are forfeited without consideration at the time of termination and Vector Stealth has a 90-day right to repurchase vested Class C Units at the then fair market value. Certain Class C Units Grants awarded in 2008 also provided for partial accelerated vesting in the event that the Company achieved certain financial performance milestones. Such milestones were not met, and the standard time-based vesting continued to apply. In addition, as described below, certain Class C Units Grants awarded in 2010 vest only upon completion of an initial public offering or sale of SafeNet at or above a stated valuation.
No Class C Unit Grants were issued in 2007 or 2009. The following table reflects the Class C Unit Grants issued under the Class C Unit Plan and the number of Class C Units vested at the end of each period:
| Year Ended December 31, | Nine Months Ended September 30, 2010 |
|||||||||||||||
| 2007 | 2008 | 2009 | ||||||||||||||
| Class C units outstanding at beginning of period |
— | — | 10,139,811 | 10,139,811 | ||||||||||||
| Class C units awarded |
— | 10,139,811 | — | |
12,286,837 |
| ||||||||||
| Class C units outstanding at end of period |
— | 10,139,811 | 10,139,811 | 22,426,648 | ||||||||||||
| Class C units vested at end of period |
— | 6,753,114 | 9,284,011 | |
12,502,664 |
| ||||||||||
During the nine months ended September 30, 2010, Vector Stealth issued an aggregate of 12,286,837 Class C Units to certain of our executive officers, including 1,890,283 Class C Units (the “Contingent Class C Units”) that only vest upon the completion of the Company’s initial public offering or certain change in control events, as defined in the agreement. The Company will recognize the compensation expense related to the Contingent Class C Units of $0.7 million at the time the Company deems probable that such event will be completed.
Also during the nine months ended September 30, 2010, the Board of Directors authorized the issuance of 3,885,178 of additional shares of SafeNet common stock to Vector Stealth in consideration for the Class C Units issued to our executive officers during such period.
The 10,139,811 Units issued and outstanding as of December 31, 2009 are deemed to be an equivalent economic interest in SafeNet Holdings of approximately 4,102,872 shares of common stock of SafeNet Holdings, assuming a complete liquidation of Vector Stealth and a distribution of its interest in SafeNet Holdings to its members according to its operating agreement.
F-55
Table of Contents
SafeNet Holding Corporation Consolidated Financial Statements
Notes to Consolidated Financial Statements—Continued
The 22,426,648 Units issued and outstanding as of September 30, 2010 are deemed to be an equivalent economic interest in SafeNet Holdings of approximately 7,324,484 shares of common stock of SafeNet Holdings, assuming a complete liquidation of Vector Stealth and a distribution of its interest in SafeNet Holdings to its members according to its operating agreement.
The Units had no intrinsic value at the grant date, December 31, 2009 and September 30, 2010.
The fair value of Unit Grants awarded during the year ended December 31, 2008 and nine months ended September 30, 2010 (unaudited) was estimated using the Black-Scholes-Merton option pricing model with the following assumptions:
| 2008 | 2010 | |||||||
| (unaudited) | ||||||||
| Risk-free interest rate |
3.23 | % | 2.90 | % | ||||
| Dividend yield |
0.00 | % | 0.00 | % | ||||
| Expected option life in years |
5.89 | 4.2 to 4.4 | ||||||
| Expected stock price volatility |
60.00 | % | 60.00 | % | ||||
| Weighted average fair value of granted stock options |
$ | 0.39 | $ | 1.34 | ||||
Compensation expense is recognized by the Company, with an equal offsetting charge to “Additional paid-in capital.” Such compensation expense is reflected in the Company’s financial results because the Unit Grants relates to services provided to the Company. At December 31, 2009 and at September 30, 2010 (unaudited), $0.1 million and $0.2 million, respectively, of total unrecognized compensation cost related to Unit Grants is expected to be recognized during 2010. The total amount of stock-based compensation expense recognized by the Company is as follows:
| Predecessor Period |
Successor Period | |||||||||||||||||||||||
| January 1 to April 11, 2007 |
April 12 to December 31, 2007 |
Year Ended December 31, |
Nine Months Ended September 30, |
|||||||||||||||||||||
| 2008 | 2009 | 2009 | 2010 | |||||||||||||||||||||
| (unaudited) |
||||||||||||||||||||||||
| Company awards |
$ | 23.8 | $ | 0.1 | $ | 1.3 | $ | 0.8 | $ | 0.6 | $ | 1.8 | ||||||||||||
| Vector Stealth awards to company personnel |
— | — | 1.1 | 0.4 | 0.3 | 1.1 | ||||||||||||||||||
| Total |
$ | 23.8 | $ | 0.1 | $ | 2.4 | $ | 1.2 | $ | 0.9 | $ | 2.9 | ||||||||||||
2007 Predecessor Period
Stock Option Plans
During the 2007 Predecessor Period, the Predecessor Company had several stock-based employee compensation plans as described below. The total compensation expense related to these plans was $23.8 million before and after tax for the period. This amount includes charges to compensation expense of: (i) $21.2 million, before and after tax, for the accelerated portion of the option vesting triggered by the acquisition of the SafeNet Predecessor Company by Vector Stealth (see below and Note 1) on April 11, 2007; and (ii) $2.6 million, before and after tax, for the non-accelerated portion of the option vesting for the 2007 Predecessor Period. There was no material tax effect as SafeNet provided a valuation allowance for all deferred taxes arising from net operating losses in the 2007 Predecessor Period.
F-56
Table of Contents
SafeNet Holding Corporation Consolidated Financial Statements
Notes to Consolidated Financial Statements—Continued
The SafeNet Predecessor Company accounted for awards issued under its stock-based employee compensation plans in accordance with the applicable amended guidance. Stock-based compensation expense for all share-based payment awards granted was based on the grant date fair value estimated in accordance with the provisions of this guidance. The SafeNet Predecessor Company recognized compensation costs net of a forfeiture rate and recognized the compensation costs for only those shares expected to vest on a straight-line basis over the requisite service period of the award, which was generally the option vesting term. The SafeNet Predecessor Company estimated the forfeiture rate based on analysis of historical trends.
Incentive Compensation Plans
The SafeNet Predecessor Company’s stock option plans included principal plans adopted in 2000 and 2001 (“Principal Option Plans”), as well as various other stock option plans assumed through acquisitions (“Acquired Option Plans,” collectively with the Principal Option Plans, the “Option Plans”). Options granted under the Principal Option Plans were generally non-qualified stock options but such plans permitted some options granted to qualify as “incentive stock options” under the Internal Revenue Code. The exercise price of a stock option generally was equal to the fair market value of the Predecessor Company’s common stock on the option grant date except for certain option grants guaranteed in prior years. The contractual term of options granted was generally ten years.
Stock Purchase Plan
The SafeNet Predecessor Company sponsored an Employee Stock Purchase Plan, the “ESPP”, pursuant to which eligible employees could contribute up to 10% of their base compensation, subject to certain income limits, to purchase shares of the SafeNet Predecessor Company’s common stock. Employees were able to purchase stock semi-annually at a price equal to 85% of the fair market value of the SafeNet Predecessor Company’s common stock as of certain plan defined dates. During the 2007 Predecessor Period, the SafeNet Predecessor Company received $0.5 million and issued 32,113 shares pursuant to the ESPP.
When related FASB share-based payment guidance was adopted, the SafeNet Predecessor Company examined its historical pattern of option exercises in an effort to determine if there were any discernable activity patterns based on certain employee populations. From this analysis, the SafeNet Predecessor Company identified two employee populations: stock option holders and ESPP participants. The SafeNet Predecessor Company used the Black-Scholes-Merton option pricing model to value the options for each of the employee populations. The table below presents the weighted-average expected life in months of the two identified employee populations. The expected life computation is based on historical exercise patterns and post-vesting termination behavior within each of the populations identified. The interest rate for periods within the contractual life of the award was based on the U.S. Treasury yield curve in effect at the time of grant. The volatility factor was determined by an analysis of the SafeNet Predecessor Company’s historical stock price for periods that approximated the expected life of the options.
The fair value of all share-based payment awards was estimated using the Black-Scholes-Merton option pricing model with the following assumptions and weighted average fair value for the 2007 Predecessor Period:
| Risk-free interest rate |
4.14% | |||
| Dividend yield |
0.0% | |||
| Expected option life |
4.26 years | |||
| Expected stock price volatility |
51.93% | |||
| Weighted average fair value of granted stock options and ESPP |
$ | 12.83 |
F-57
Table of Contents
SafeNet Holding Corporation Consolidated Financial Statements
Notes to Consolidated Financial Statements—Continued
(16) INCOME TAXES
Income (loss) before the provision for income taxes is attributable to the following jurisdictions (in thousands):
| Predecessor Period |
Successor Period | |||||||||||||||||||||||
| Period from January 1, to April 11, 2007 |
Period from April 12, to December 31 2007 |
Year Ended December 31, |
Nine Months Ended September 30 |
|||||||||||||||||||||
2008 |
2009 |
2009 |
2010 |
|||||||||||||||||||||
| (unaudited) | ||||||||||||||||||||||||
| Domestic |
$ | (47,437 | ) | $ | (43,485 | ) | $ | (172,262 | ) | $ | (46,989 | ) | $ | (20,025 | ) | $ | (21,951 | ) | ||||||
| Foreign |
(2,400 | ) | 13,200 | 6,557 | (3,663 | ) | (4,167 | ) | 16,866 | |||||||||||||||
| $ | (49,837 | ) | $ | (30,285 | ) | $ | (165,705 | ) | $ | (50,652 | ) | $ | (24,192 | ) | $ | (5,085 | ) | |||||||
Significant components of income tax expense (benefit) are as follows (in thousands):
| Predecessor Period |
Successor Period | |||||||||||||||||||||||
| Period from January 1, to April 11, 2007 |
Period from April 12, to December 31 2007 |
Year Ended December 31, |
Nine Months Ended September 30 |
|||||||||||||||||||||
| 2008 | 2009 | 2009 |
2010 | |||||||||||||||||||||
| (unaudited) | ||||||||||||||||||||||||
| Current: |
||||||||||||||||||||||||
| Domestic |
$ | 552 | $ | 1,334 | $ | 3,252 | $ | 1,696 | $ | 1,512 | $ | 16 | ||||||||||||
| Foreign |
699 | 5,095 | 4,256 | 2,726 | 2,478 | 2,803 | ||||||||||||||||||
| 1,251 | 6,429 | 7,508 | 4,422 | 3,990 | 2,819 | |||||||||||||||||||
| Deferred: |
||||||||||||||||||||||||
| Domestic |
250 | — | (46,157 | ) | (393 | ) | (488 | ) | — | |||||||||||||||
| Foreign |
(502 | ) | 619 | (567 | ) | (4,954 | ) | (3,384 | ) | 805 | ||||||||||||||
| (252 | ) | 619 | (46,724 | ) | (5,347 | ) | (3,872 | ) | 805 | |||||||||||||||
| Income tax expense (benefit) |
$ | 999 | $ | 7,048 | $ | (39,216 | ) | $ | (925 | ) | $ | 118 | $ | 3,624 | ||||||||||
F-58
Table of Contents
SafeNet Holding Corporation Consolidated Financial Statements
Notes to Consolidated Financial Statements—Continued
Deferred tax assets and liabilities are comprised of the following (in thousands):
| Year Ended December 31, |
Nine Months Ended September 30, 2010 |
|||||||||||
| Deferred tax assets: |
2008 | 2009 | ||||||||||
| (unaudited) | ||||||||||||
| Inventories |
$ | 4,310 | $ | 3,350 | $ | 3,502 | ||||||
| Net operating loss carry-forwards |
55,701 | 58,411 | 71,740 | |||||||||
| Compensation and accrued reserves |
4,858 | 16,392 | 7,026 | |||||||||
| Property and equipment |
489 | 1,376 | 827 | |||||||||
| Other |
2,685 | 5,154 | 5,346 | |||||||||
| Total deferred tax assets |
$ | 68,043 | $ | 84,683 | $ | 88,441 | ||||||
| Year Ended December 31, |
Nine Months Ended September 30, 2010 |
|||||||||||
| Deferred tax liabilities: |
2008 | 2009 | ||||||||||
| (unaudited) | ||||||||||||
| Unremitted foreign earnings |
$ | (14,546 | ) | $ | (16,537 | ) | $ | (15,782 | ) | |||
| Intangible assets |
(37,439 | ) | (29,431 | ) | (21,302 | ) | ||||||
| Total deferred tax liabilities |
(51,985 | ) | (45,968 | ) | (37,084 | ) | ||||||
| Net future income tax assets |
16,058 | 38,715 | 51,357 | |||||||||
| Valuation allowance |
(31,449 | ) | (52,618 | ) | (66,065 | ) | ||||||
| Net deferred tax liabilities |
$ | (15,391 | ) | $ | (13,903 | ) | $ | (14,708 | ) | |||
The reconciliation of the reported income tax expense (benefit) to the amount that would result by applying the U.S. federal statutory tax rate of 34% to “(Loss) before income taxes” is as follows (in thousands):
| Predecessor Period |
Successor Period | |||||||||||||||||||||||
| Period from January 1, to April 11, 2007 |
Period from April 12, to December 31, 2007 |
Year Ended December 31, |
Nine Months Ended September 30, |
|||||||||||||||||||||
| 2008 | 2009 | 2009 | 2010 | |||||||||||||||||||||
| (unaudited) | ||||||||||||||||||||||||
| Tax benefit at U. S. statutory rate |
$ | (16,945 | ) | $ | (10,297 | ) | $ | (56,339 | ) | $ | (17,221 | ) | $ | (8,225) | $ | (1,729 | ) | |||||||
| Effect of permanent differences: |
||||||||||||||||||||||||
| Sub-part F income |
406 | — | — | — | — | — | ||||||||||||||||||
| Goodwill impairment |
— | — | 14,581 | — | — | — | ||||||||||||||||||
| Loss on net assets held for sale |
— | — | — | 352 | — | 1,011 | ||||||||||||||||||
| Non-deductible amounts related to stock options |
1,072 | — | 825 | 401 | 300 | 900 | ||||||||||||||||||
| Non-deductible acquisition costs |
2,270 | — | — | — | — | — | ||||||||||||||||||
| Severance payment |
— | 1,088 | — | — | — | — | ||||||||||||||||||
| Other |
170 | (189 | ) | — | — | — | 68 | |||||||||||||||||
| Loss on sale of MediaSentry |
— | — | — | (5,384 | ) | (5,384 | ) | — | ||||||||||||||||
| Tax effect of international operations |
(436 | ) | (3,394 | ) | 1,331 | 198 | 42 | (1,109 | ) | |||||||||||||||
| State income tax (benefit) expense, net of federal effect |
650 | 1,334 | (3,707 | ) | (655 | ) | (283 | ) | 91 | |||||||||||||||
| Change in valuation allowance |
13,706 | 18,436 | 3,404 | 20,845 | 12,365 | 5,933 | ||||||||||||||||||
| Effect of tax rate change |
(80 | ) | — | — | (827 | ) | — | (1,780 | ) | |||||||||||||||
| Other |
186 | 70 | 689 | 1,366 | 1,303 | 239 | ||||||||||||||||||
| Income tax expense (benefit) |
$ | 999 | $ | 7,048 | $ | (39,216 | ) | $ | (925 | ) | $ | 118 | $ | 3,624 | ||||||||||
F-59
Table of Contents
SafeNet Holding Corporation Consolidated Financial Statements
Notes to Consolidated Financial Statements—Continued
In assessing the realization of deferred tax assets, management considers whether it is more likely than not that all or some portion of the deferred tax assets will not be realized. The ultimate realization of the deferred tax assets is dependent upon the reversal of existing deferred tax liabilities as well as the generation of future taxable income during the periods in which temporary differences are deductible and net operating losses are utilized. Based on consideration of these factors, the Company established valuation allowances of $31.4 million, $52.6 million and $66.1 million at December 31, 2008 and 2009 and September 30, 2010, respectively. These valuation allowances substantially consisted of deferred tax assets in excess of deferred tax liabilities as well net operating losses associated with operations in the U.S., Germany, and United Kingdom.
At December 31, 2009, the Company had net operating loss carry-forwards for U.S. income tax purposes of $129.5 million, of which none expires by 2015, $7.9 million expires by 2020 and the remainder $121.6 million will expire by 2029. These losses are subject to varying limitations as to use under Section 382 of the Internal Revenue Code due to changes in control of the Company or its acquired companies over time. Specifically, the 2008 acquisition of Ingrian, the 2004 acquisitions of Rainbow Technologies, Inc. and Datakey, Inc., and the 2003 acquisitions of Cylink Corporation, and Raqia Networks, Inc., increased the Company’s net operating loss carry-forwards for U.S. income tax purposes, as well as the 2009 acquisition of Aladdin’s U.S. operations by Parent.
| Predecessor Period |
Successor Period | |||||||||||||||||||
| Period from January 1, to April 11, 2007 |
Period from April 12, to December 31, 2007 |
Year Ended December 31, |
||||||||||||||||||
| 2008 | 2009 | |||||||||||||||||||
| Valuation allowance beginning of period |
$ | 37,684 | $ | 7,144 | $ | 24,659 | $ | 31,449 | ||||||||||||
| Tax expense |
13,706 | 18,436 | 3,404 | 20,845 | ||||||||||||||||
| Purchase accounting adjustments |
— | — | 2,827 | — | ||||||||||||||||
| Acquired subsidiary |
— | — | — | 163 | ||||||||||||||||
| Write-off of deferred tax asset and related valuation allowance due to expired net operating loss carry-forwards |
— | (2,357 | ) | — | — | |||||||||||||||
| Other |
(822 | ) | 1,436 | 559 | 161 | |||||||||||||||
| Valuation allowance end of period |
$ | 50,568 | $ | 24,659 | $ | 31,449 | $ | 52,618 | ||||||||||||
At December 31, 2009, the Company had total net operating loss carry-forwards attributable to non-U.S. subsidiaries of $32.6 million. Of such total, $16.1 million have an unlimited carry-forward period and the remaining $16.5 million will expire by 2015.
In the 2007 Predecessor Period, the Company asserted that all investments in foreign subsidiaries were permanent in nature and accordingly no deferred taxes were provided. FASB amended guidance dictates that if there is an assertion of indefinite reinvestment, deferred taxes will not be established for outside basis differences in foreign subsidiaries. In the 2007 Successor Period through the year ended December 31, 2008, this assertion was no longer valid given the debt servicing needs of the Company because of the Vector Stealth purchase, and deferred taxes were re-established related to substantially all of the outside basis differences in foreign subsidiaries. The Company continues to evaluate the outside basis differences attributable to foreign subsidiaries for the purpose of their permanent reinvestment assertion. As a result, post-2008 earnings, including all earnings in Israel and Aladdin Germany subsidiaries, are viewed as permanently re-invested, excluding those deemed repatriated under other anti-deferral provisions of the Internal Revenue Code. Statutory limitations and lack of liquid assets inhibited the ability to repatriate funds from these foreign subsidiaries during 2009. Management will continue to evaluate future years to determine annually whether the outside basis differences in foreign subsidiaries give rise to additional deferred tax liabilities.
F-60
Table of Contents
SafeNet Holding Corporation Consolidated Financial Statements
Notes to Consolidated Financial Statements—Continued
The Company adopted ASC 740-10-5 (previously FIN 48) amended guidance pertaining to uncertain tax positions on January 1, 2007. As a result of the adoption, SafeNet Holdings recognized no material adjustment in the liability for unrecognized income tax benefits. At the adoption date of January 1, 2007, the Company had $3.8 million of unrecognized tax benefits, all of which would affect the Company’s effective tax rate if recognized. At September 30, 2010, the Company had $12.5 million of liabilities recorded for unrecognized tax benefits. The unrecognized tax benefit balance is entirely composed of uncertain tax positions that would affect the Company’s effective tax rate if recognized. It is reasonably possible that the Company’s unrecognized tax benefits may decrease within the next twelve months by $0.8 million as a result of the lapse of statute of limitations.
The Company recognizes accrued interest and penalties related to unrecognized income tax benefits in income tax expense. In conjunction with the adoption of FASB amended guidance for uncertain tax positions, the total amount of accrued interest and penalties resulting from such unrecognized tax benefits was $1.7 million. During the year ended December 31, 2009 and unaudited nine months ended September 30, 2010, the Company recognized interest expense of approximately $0.5 million and $0.6 million, respectively.
A reconciliation of the change in unrecognized tax benefits is as follows (in thousands):
| Predecessor Period |
Successor Period | |||||||||||||||||||||||
| Period from January 1, to April 23, 2007 |
Period from April 24, to December 31, 2007 |
Year Ended December 31, |
Nine
Months Ended September 30, 2010 |
|||||||||||||||||||||
| 2008 | 2009 | |||||||||||||||||||||||
| (unaudited) | ||||||||||||||||||||||||
| Unrecognized tax benefits at the beginning of the period |
$ | 3,792 | $ | 4,043 | $ | 5,205 | $ | 7,967 | $ | 12,968 | ||||||||||||||
| Additions based on tax provisions related to current year |
251 | 1,162 | 2,762 | 1,702 | — | |||||||||||||||||||
| Additions/reductions for tax positions of prior years |
— | — | — | 447 | — | |||||||||||||||||||
| Reductions relating to settlements with taxing authorities |
— | — | — | (396 | ) | — | ||||||||||||||||||
| Reductions to unrecognized tax benefits as a result in lapse in statute of limitations |
— | — | — | (378 | ) | (449 | ) | |||||||||||||||||
| Tax positions assumed from acquired subsidiaries |
— | — | — | 3,626 | — | |||||||||||||||||||
| Unrecognized benefits at end of period |
$ | 4,043 | $ | 5,205 | $ | 7,967 | $ | 12,968 | $ | 12,519 | ||||||||||||||
The tax return years since 2006 in the Company’s major tax jurisdictions, both federal and various states, have not been audited and are not currently under audit, except that Israel’s tax returns have been audited through 2004 and are under audit currently for the period 2005 to 2008. Due to the existence of tax attribute carryforwards, which are predominantly U.S. net operating losses, the Company treats certain post-2002 tax positions as open to adjustment due to the taxing authorities’ ability to make adjustments to those tax attributes if they will be used to offset future income.
The Company’s Israeli production facilities were previously granted tax benefits under the Law for the Encouragement of Capital Investments, 1959 (the “Law”). The tax benefits are as follows: Income derived from the investment programs is fully tax exempt for the first two years of the 10-year tax benefit period and is entitled to a reduced tax rate of 10%-25% during the remaining benefit period based on the percentage of foreign ownership in each taxable year. Management believes that as of December 31, 2009 and prior years that the Company met all the conditional requirements under the Law for these tax benefits. Earnings accumulated under
F-61
Table of Contents
SafeNet Holding Corporation Consolidated Financial Statements
Notes to Consolidated Financial Statements—Continued
the fully tax exempt regime (which totaled $50.3 million at December 31, 2009) would be subject to regular Israeli corporate tax, currently at 25% for 2010, upon repatriation. However, since it is unlikely such fully tax exempt earnings can be repatriated since taxed earnings exceed statutory reserves permissible for distribution, no deferred taxes have been provided on the accumulated fully tax exempt earnings.
During the first quarter of 2010, the Company concluded its intention to discontinue production activities in Israel. As a result, effective January 1, 2010, the income of its Israeli operations will be taxed at the regular rate of 25%. Accordingly deferred taxes related to Israel have been adjusted for this change.
(17) SIGNIFICANT CUSTOMER
For 2008 and 2009, a major U.S. government agency accounted for 40.4% and 33.7%, respectively, of the Company’s consolidated revenues. At December 31, 2008 and 2009, a major U.S. government agency accounted for 47.4% and 15.5% of consolidated accounts receivable, respectively. No other customer accounted for 10% or more of revenue for such periods.
(18) RETIREMENT PLANS
Domestic
SafeNet sponsors a Section 401(k) defined contribution retirement plan (the “Plan”) for U.S. employees who have completed at least three months of service. The Plan permits pretax contributions by participants of 1% to 100% of base compensation up to the maximum allowable contributions as determined by the Internal Revenue Code. Matching contributions may be made at SafeNet’s discretion. SafeNet’s matching contributions vest over a five-year period on a pro rata basis, except in the case of one of SafeNet’s subsidiaries where contributions vest immediately. As of September 30, 2009 and 2010 (unaudited), SafeNet has accrued for matching contributions of $1.4 million and $1.6 million, respectively. The 2009 matching contributions were funded to the Plan in the first quarter of 2010. If the Company determines that it will make a discretionary match for 2010, the match will be funded to the Plan in first quarter 2011. The amount accrued but unfunded at September 30, 2010 represents management’s intention to fund a match in the first quarter of 2011; however, management’s intention is not a guarantee as to whether a match will occur or as to the level of any such matching contribution. SafeNet made contributions of $0.5 million, $0.9 million, $1.2 million and $1.7 million during the 2007 Predecessor Period, the 2007 Successor Period, and the years ended December 31, 2008 and 2009, respectively.
Foreign
The Company sponsors several defined contribution retirement plans for non-U.S. employees. The Company made contributions of $0.4 million, $1.3 million, $1.5 million, $1.8 million, $1.5 million and $1.4 million during the 2007 Predecessor Period, the 2007 Successor Period, the years ended December 31, 2008 and 2009 and the unaudited nine month periods ended September 30, 2009 and 2010, respectively.
(19) COMMITMENTS AND CONTINGENCIES
Operating Leases
The Company leases office facilities, equipment and motor vehicles under non-cancelable operating leases expiring at various dates through 2015. The facility leases require the Company to pay a proportionate share of real estate taxes, insurance and common area maintenance which is not included in rent expense or the future minimum rental payments set forth below. The Company recognizes rent expense on a straight-line basis taking into account escalating rent provisions and rent holidays over the respective term of the leases.
F-62
Table of Contents
SafeNet Holding Corporation Consolidated Financial Statements
Notes to Consolidated Financial Statements—Continued
The future minimum payments due under non-cancelable operating leases with initial or remaining lease terms in excess of one year at December 31, 2009 are as follows (in thousands):
| 2010 |
$ | 10,099 | ||
| 2011 |
7,086 | |||
| 2012 |
4,057 | |||
| 2013 |
3,159 | |||
| 2014 |
1,611 | |||
| Thereafter |
463 | |||
| Total |
$ | 26,475 | ||
The Company has sublease arrangements for certain locations. The future minimum payments to be received under the subleases are as follows (in thousands) (1):
| December 31, 2009 |
September 30, 2010 |
|||||||
| (unaudited) | ||||||||
| 2010 |
$ | 523 | $ | 275 | ||||
| Total |
$ | 523 | $ | 275 | ||||
| (1) | The above tables include future payments and sublease arrangements relating to one leased facility which comprises the Company’s restructuring accrual. Future payments of and receipt of sublease income related to this lease will be accounted for as net reductions of the restructuring accrual. See Note 13 for further details. |
Rent expense under all operating leases, including equipment rentals and motor vehicles was $2.1 million, $5.5 million, $7.5 million, $11.5 million, $7.8 million and $7.3 million during the 2007 Predecessor Period, the 2007 Successor Period, the years ended December 31, 2008 and 2009 and the unaudited nine month periods ended September 30, 2009 and 2010, respectively.
Contingent liability
Under Israeli law, exports from Israel are generally exempt from Israeli value added taxation (VAT). In November 2009, the Company determined that the documentation provided to Israeli Customs Authorities in connection with certain export transactions was inaccurate. The Company has elected to disclose the matter to the Israeli VAT authorities. Although the export transactions are believed to be exempt from VAT, notwithstanding the defects in documentation, and the likelihood of a VAT assessment is remote, it is reasonably possible that interest and/or penalties may be assessed by the Israeli Customs Authorities. The potential assessment ranges from $0 million to $0.3 million. As no amount within that range is considered more likely than another, no accrual has been made in our financial statements with respect to this matter.
Litigation
Protegrity Corporation Litigation
Protegrity Corporation (“Protegrity”) filed a suit against our subsidiary, Ingrian Networks, or Ingrian, in the United States District Court for the District of Connecticut. The Company acquired Ingrian on April 3, 2008. Protegrity’s complaint, filed April 25, 2008, alleges that Ingrian has made, used or sold database security systems
F-63
Table of Contents
SafeNet Holding Corporation Consolidated Financial Statements
Notes to Consolidated Financial Statements—Continued
that infringe upon three U.S. patents relating to database encryption owned by Protegrity. The complaint seeks injunctive relief, unspecified damages, attorneys’ fees and costs. The Company answered the complaint on September 24, 2008, denying that Ingrian’s products infringe the identified patents and other material allegations of the complaint and asserting further defenses. The Company also filed counterclaims against Protegrity, seeking declaratory judgments that Ingrian has not infringed the patents and that the patents are invalid or unenforceable. The initial phase of the case focused on identification and briefing of claim construction issues. A hearing and argument on these issues was held on January 11, 2010, and on March 2, 2010 the court issued oral rulings. Those rulings did not entirely favor either party and will allow the case to proceed on at least one if not more of the patents in suit. On August 16, 2010, Protegrity amended its complaint to add SafeNet as an additional defendant in the case. The case is now in the discovery phase and no trial date has been set. The Company believes that the Ingrian products do not infringe Protegrity’s patents, and intend to continue to defend the matter vigorously. The Company has certain rights of indemnification under the agreement by which the Company acquired Ingrian and expect to be indemnified for expenses and losses, if any, in this matter up to the limits set forth in that agreement. There can be no assurance, however, that the Company will prevail in this matter or that, if we are found liable, the available indemnification will be sufficient to cover our liability. Moreover, any adverse ruling in this matter may have a significant impact on our business and results of operations, and the Company may continue to incur significant legal fees in connection with this matter until it is resolved.
Cloakworks Litigation
On April 8, 2010, Cloakworks, Inc. (“Cloakworks”) filed suit against the Company in the United States District Court for the Northern District of California. Cloakworks’s complaint alleges that certain of the Company’s software rights management products infringe upon a U.S. patent held by Cloakworks relating to obscuring or “cloaking” software to protect the software against reverse engineering or tampering. The complaint seeks injunctive relief, damages and attorneys’ fees and costs. The Company answered the complaint on June 1, 2010, denying that the Company’s products infringe the Cloakworks patent and other material allegations of the complaint, and asserting several affirmative defenses. Although the case is in the very preliminary stages, the Company believes that the allegations of infringement are without foundation and intends to defend the matter vigorously. There can be no assurance, however, that the Company will prevail in this matter and any adverse ruling may have a significant impact on our business and results of operation. In addition, if this matter proceeds to trial, the Company may incur significant legal fees until this matter is resolved.
Wordcheck Tech Litigation
On September 7, 2010, WordCheck Tech LLC (“WordCheck”) filed suit against the Company in United States District Court for the Eastern District of Texas. WordCheck’s complaint alleges infringement of a U.S. patent by certain of the Company’s data protection products. The complaint seeks injunctive relief, unspecified damages and attorneys’ fees and costs. By agreement of the parties, the Company has until November 18, 2010 to answer the complaint. The Company believes that it has meritorious defenses against WordCheck’s claims, and intends to vigorously defend the matter. There can be no assurance, however, that the Company will prevail in this matter and any adverse ruling may have a significant impact on our business and operating results. In addition, regardless of the outcome of the matter, the Company may incur significant legal fees defending the action until it is resolved.
Uniloc Litigation
On September 14, 2010, Uniloc USA, Inc. and Uniloc (Singapore) Private Limited (collectively, “Uniloc”), filed suit against the Company and its wholly-owned subsidiaries Aladdin Knowledge Systems, Inc. and Aladdin Knowledge Systems Ltd. (collectively, “Aladdin”) in the United States District Court for the Eastern District of
F-64
Table of Contents
SafeNet Holding Corporation Consolidated Financial Statements
Notes to Consolidated Financial Statements—Continued
Texas. Uniloc’s complaint alleges infringement of a U.S. patent by certain of the Company’s and Aladdin’s software rights management products. The complaint seeks injunctive relief, unspecified damages and attorneys’ fees and costs. By agreement of the parties and as ordered by the court, the Company has until November 19, 2010 to answer the complaint. The Company believes that it has meritorious defenses against Uniloc’s claims, and intends to vigorously defend the matter. There can be no assurance, however, that the Company will prevail in this matter and any adverse ruling may have a significant impact on our business and operating results. In addition, regardless of the outcome of the matter, the Company may incur significant legal fees defending the action until it is resolved.
United States District Court for the Southern District of New York Investigation
On May 17, 2006, the Company was served with a grand jury subpoena from the United States District Court for the Southern District of New York, or SDNY, demanding that it produce all documents referring to, relating to or involving the granting of stock options from 2000 to that date. By agreement with the U.S. Attorney’s Office for the SDNY, which is investigating the matter, the Company produced certain documents, interview memoranda and information concerning stock options, its accounting and internal controls, its revenue recognition procedures, including certain contracts, its external audits, communications with investors, its draft public filings and its compensation for senior executives during the period in question. The U.S. Attorney’s Office for the SDNY has interviewed a number of the Company’s present and former employees. The Company is cooperating fully with the U.S. Attorney’s Office for the SDNY in its investigation. Although the Company is not presently receiving requests for additional information, the Company has not received any notice that the matter is closed.
While no claims or actions have been asserted by the U.S. Attorney’s Office for the SDNY in these matters at this time, the Company has concluded that an unfavorable outcome in the form of fines, penalties or other action in this matter is not probable at this time. Accordingly, the Company has not reserved any amounts for potential losses in our accompanying financial statements. Additionally, the Company is presently unable to estimate the potential losses in the event of an unfavorable outcome in this matter.
Federal Securities Law Complaints
On August 1, 2006 and on August 15, 2006, certain of the Company’s stockholders and former stockholders filed two separate class action lawsuits against us and Anthony Caputo, the Company’s former chief executive officer, Carole Argo, the Company’s former president and chief financial officer, and Kenneth Mueller, the Company’s former chief financial officer as well as against the Company’s former directors in the SDNY alleging violations of federal securities laws. The purported classes consist of stockholders who acquired the Company’s common stock during the period March 31, 2003 to May 18, 2006. These class actions contain identical factual allegations relating to the defendants’ stock option practices and compensation related disclosures.
On February 21, 2007, the SDNY combined the separate class actions and named a lead plaintiff. On August 1, 2008, the lead plaintiff filed an amended Complaint on behalf of the classes naming the Company as well as certain individual former officers, former members of the compensation committee of the Company’s board of directors and former members of the Company’s board of directors as defendants.
The amended complaint asserts the following claims against the Company and certain or all of the individual defendants: (i) violation of Section 10(b) of the Exchange Act and Rule 10b-5 promulgated thereunder for alleged misrepresentations related to stock option back dating and non-stock option accounting fraud; (ii) violation of Section 14(a) of the Exchange Act and Rule 14A-9 promulgated thereunder for alleged misrepresentations contained in our proxy statements for the years 2003 through 2005; (iii) violation of
F-65
Table of Contents
SafeNet Holding Corporation Consolidated Financial Statements
Notes to Consolidated Financial Statements—Continued
Section 14(a) of the Exchange Act and Rule 14A-9 promulgated thereunder for alleged misrepresentations contained in the proxy statements and the prospectus used in connection with our acquisition of Rainbow Technologies, Inc., or Rainbow; (iv) violation of Section 11 of the Securities Act of 1933, as amended, or the Securities Act, for alleged misrepresentations contained in the registration statement used in connection with our acquisition of Rainbow; and (v) violation of Section 12(a)(2) of the Securities Act for alleged misrepresentations contained in the proxy statements and the prospectus used in connection with our acquisition of Rainbow. In addition, the amended complaint asserts the following additional claims against certain or all of the individual defendants without naming the Company: (i) violation of Section 20(a) of the Exchange Act arising from alleged stock option back-dating and non-stock option accounting fraud and (ii) violation of Section 15 of the Securities Act for alleged misrepresentations contained in the registration statement used in connection with our acquisition of Rainbow. The amended complaint requests unspecified compensatory damages, interest, attorneys’ fees, costs, injunctive relief in the form of a constructive trust over the individual defendants’ unjust enrichment, disgorgement, rescission of unexercised options and unspecified other relief.
On September 30, 2008, the defendants each filed motions to dismiss the amended complaint for failure to state a claim on which relief can be granted. On August 6, 2009, the court dismissed certain of the claims not related to alleged stock options back-dating issues. The court also dismissed from the case all the individual defendants other than Mr. Caputo and Ms. Argo. Document production was substantially completed in December 2009.
On February 1, 2010, plaintiffs moved for leave to file a Second Amended Complaint adding Mr. Mueller back into the case and supplementing the plaintiffs’ non-options and options-related claims to include allegations made in the SEC’s November 10, 2009 complaint against SafeNet. On March 8, 2010, the parties stipulated to the dismissal of the non-options-related claims contained in the Second Amended Complaint on the same grounds as set forth in the court’s August 6, 2009 opinion, with plaintiffs reserving all rights to request the court to reconsider that decision or to appeal that decision in the future and defendants reserving all rights to continue to assert its loss causation defenses.
On March 11, 2010, Mr. Mueller filed a motion to dismiss the Second Amended Complaint insofar as it revived claims against him that had already been dismissed in the court’s August 6, 2006 opinion. Plaintiffs filed an opposition to Mr. Mueller’s motion on March 26, 2010, and Mr. Mueller filed a reply in further support of his motion on April 6, 2010. No hearing date for the motion has been set.
On July 9, 2010, the Company entered into a binding term sheet that tentatively settles and resolves the consolidated class actions in exchange for a payment in the amount of $25.0 million, which amount is recorded as additional general and administrative expenses in the year ended December 31, 2009. On September 13, 2010, the Company entered into a stipulation and agreement of settlement that confirms the settlement amount and provides additional detail regarding settlement mechanics. On October 7, 2010, the court gave its preliminary approval of the settlement and authorized the parties to begin to notify class participants. The settlement requires final court approval before it becomes final. A hearing for final approval is scheduled for December 20, 2010.
Securities and Exchange Commission Action
On November 12, 2009, the Securities and Exchange Commission filed a civil injunctive action against SafeNet, Mr. Caputo, Mr. Mueller, and three former SafeNet accountants, Clinton Ronald Greenman, John Wilroy, and Gregory Pasko. The complaint filed in the United States District Court for the District of Columbia alleged that, during the period from the fourth quarter of 2000 through May 2006, SafeNet engaged in two fraudulent schemes, one involving the backdating of options and the other earnings management. Each scheme allegedly resulted in SafeNet materially misstating financial results and disseminating materially false and misleading information concerning its financial condition.
F-66
Table of Contents
SafeNet Holding Corporation Consolidated Financial Statements
Notes to Consolidated Financial Statements—Continued
Without admitting or denying the allegations in the complaint, except as to jurisdiction, all of the defendants, including SafeNet, agreed to settle the action concurrently with the initial filing of the action on November 12, 2009. SafeNet consented to the entry of a judgment (i) permanently enjoining it from violating the antifraud provisions of the federal securities laws (Section 17(a) of the Securities Act, Section 10(b) of the Exchange Act and Rule 10b-5), the rule relating to the use of non-GAAP financial measures of Regulation G, the reporting, books and records and internal controls provisions of the Exchange Act (Sections 13(a), 13(b)(2)(A) and 13(b)(2)(B) and Rules 12b-20, 13a-1, 13a-11, and 13a-13), and the proxy solicitation provisions (Section 14(a) of the Exchange Act and Exchange Act Rule 14a-9) and (ii) ordering SafeNet to pay a civil penalty of $1,000,000.
Secure Computing Escrow Settlement
On August 16, 2010, the Company signed an agreement to settle outstanding disputes over the validity and amount of indemnification claims between Aladdin and Secure Computing Corporation. As part of the agreement the Company received $1.6 million and released all claims against Secure Computing Corporation. Upon receipt, the Company recorded a $0.4 million decrease to prepaid expense and other current assets, $0.5 million decrease to cost of sales, and $0.7 million decrease to operating expenses.
(20) RELATED PARTY TRANSACTIONS
Management Fees
The Company pays to an affiliate of Vector Stealth a management fee of $0.5 million per quarter. Jasmine paid its parent a management fee of $0.3 million per quarter. Included in the accompanying consolidated statements of operations for the 2007 Successor Period, the years ended December 31, 2008 and 2009, and the unaudited nine month periods ended September 30, 2009 and 2010, is $1.4 million, $2.0 million, $2.5 million, $1.8 million and $1.8 million in such fees, respectively, of which $1.5 million, $2.1 million and $2.0 million was unpaid at December 31, 2008 and 2009 and September 30, 2010 (unaudited), respectively. The unpaid amounts are included in “Accounts payable” in the accompanying consolidated balance sheets. Jasmine also paid its parent $3.2 million for transaction fees in conjunction with the acquisition of Aladdin.
The Company also purchases certain components and research and development services from an affiliate.
Management Services Agreement
On June 3, 2010, the Company signed an agreement with an affiliate of Vector Stealth whereby the affiliate will provide financial advisory, consulting and other management services to the Company and its subsidiaries. Under the agreement the Company will pay quarterly management fees to the affiliate of $0.5 million, pay a disposition fee of 2.0% of the total consideration received from third parties, pay a debt refinancing fee equal to 2.0% of the amount refinanced should a refinancing be required, and reimburse the affiliate for reasonable out-of-pocket fees and expenses incurred in connection with the management services being provided. The agreement expires on April 11, 2017; however, may be terminated early should certain conditions be met. In the event of a termination of the agreement, the Company is required to pay the affiliate the lesser of $12.0 million or the present value of the financial advisory fees that would have been earned had the agreement remained in effect its fully term.
Other
During the years ended December 31, 2008 and 2009 and the unaudited nine month periods ended September 30, 2009 and 2010, the Company reimbursed Vector Stealth $0.2 million, and $0.6 million, $0.2 million and $0.2 million, respectively for expenses incurred on behalf of the Company. At December 31, 2009 and September 30,
F-67
Table of Contents
SafeNet Holding Corporation Consolidated Financial Statements
Notes to Consolidated Financial Statements—Continued
2010 (unaudited), respectively, Vector Stealth owed the Company $0.5 million and $0.5 million, respectively, for payments made by the Company on behalf of Vector Stealth. No amounts were owed by Vector Stealth to the Company at December 31, 2008.
At December 31, 2008, the Company accrued for and had related expenses of $1.8 million payable to Vector Stealth in relation to costs associated with the acquisition of Aladdin by Vector Stealth.
The Company also recorded revenues of an immaterial amount in 2008 and 2009 from sales to a company owned by Vector Stealth.
(21) EARNINGS PER SHARE
The Company calculates basic earnings per share based on earnings available to common stockholders. The calculation uses the weighted average number of common shares outstanding during each period. Diluted earnings per share is computed in a similar manner using the weighted average number of common shares and dilutive potential common shares outstanding. Dilutive potential common shares are outstanding dilutive stock options and performance share awards that are assumed to be fully vested and paid out in shares of common stock.
The Company retroactively adjusted the weighted-average number of shares outstanding used in the calculation of earnings per share to give effect to the 4,736,843 shares issued on February 24, 2010 related to the Ingrian acquisition by including them in the shares issued and outstanding as of April 2008.
The following table sets forth the computation of basic and diluted loss per common share (in thousands except per share amounts):
| Predecessor Period |
Successor Period | |||||||||||||||||||||||
| Period January 1 to April 11, 2007 |
Period April 12 to December 31, 2007 |
Year Ended December 31, | Nine Months Ended September 30, |
|||||||||||||||||||||
| 2008 | 2009 | 2009 | 2010 | |||||||||||||||||||||
| Numerator—basic and diluted: |
(unaudited) | |||||||||||||||||||||||
| Net loss attributable to common stockholders |
$ | (50,836 | ) | $ | (37,333 | ) | $ | (126,489 | ) | $ | (49,727 | ) | $ | (24,310 | ) | $ | (8,709 | ) | ||||||
| Denominator: |
||||||||||||||||||||||||
| Weighted-average number of shares outstanding |
21,107 | 90,505 | 115,233 | 147,877 | 147,877 | 150,991 | ||||||||||||||||||
| Basic and diluted loss per share |
$ | (2.41 | ) | $ | (0.41 | ) | $ | (1.10 | ) | $ | (0.34 | ) | $ | (0.16 | ) | $ | (0.06 | ) | ||||||
Stock options representing 1.9 million, 3.5 million, 5.7 million, 4.0 million and 9.2 million shares of common stock were outstanding for each of the 2007 Successor Period, the years ended December 31, 2008 and 2009, and the unaudited nine month periods ended September 30, 2009 and 2010 respectively, but were excluded from the computation of diluted loss per share because their effect would be anti-dilutive.
F-68
Table of Contents
SafeNet Holding Corporation Consolidated Financial Statements
Notes to Consolidated Financial Statements—Continued
(22) SEGMENT REPORTING
The Company develops, markets, sells and supports a portfolio of hardware and software information security products and services that protect and secure digital content, identities, communications and applications. The Company provides its network security solutions worldwide for financial, enterprise, telecommunications and government use. In addition, the Company provided anti-piracy and business management services for the recording and motion picture industries through March 31, 2009. The Company’s technology is sold and licensed in various formats, including software, hardware and intellectual property licensing. The Company’s worldwide sales are concentrated in North and South America (“Americas”), Europe and the Middle East (“EMEA”) and in the Asia Pacific region (“APAC”).
The accounting policies of the operating segments are the same as described in the Summary of Significant Accounting Policies. The Company’s revenues are comprised of two primary product categories: data protection and software rights management. Data protection products include hardware and software solutions designed to protect identities and transactions, encrypt and control data and protect communications. Software rights management products provide an integrated enforcement and management platform for software licenses and entitlements. Other revenue within the table below represents revenues not specific to a product category and includes revenues related to shipping and miscellaneous items.
The following table sets forth revenues by product category:
| Predecessor Period |
Successor Period | |||||||||||||||||||||||
| Period from January 1 to April 11, 2007 |
Period from April 12 to December 31, 2007 |
Year Ended December 31, | Nine Months Ended September 30, |
|||||||||||||||||||||
| 2008 | 2009 | 2009 | 2010 | |||||||||||||||||||||
| Product category: |
|
(unaudited) |
| |||||||||||||||||||||
| Data protection |
$ | 60,706 | $ | 191,375 | $ | 283,108 | $ | 330,653 | $243,232 | $ | 259,901 | |||||||||||||
| Software rights management |
12,809 | 35,553 | 46,603 | 72,600 | 50,573 | 73,256 | ||||||||||||||||||
| Other |
252 | (552 | ) | (681 | ) | 441 | 97 | 921 | ||||||||||||||||
| Total revenues |
$ | 73,767 | $ | 226,376 | $ | 329,030 | $ | 403,694 | $293,902 | $ | 334,078 | |||||||||||||
F-69
Table of Contents
SafeNet Holding Corporation Consolidated Financial Statements
Notes to Consolidated Financial Statements—Continued
The following table sets forth geographic information about the Company’s reportable segment for each period presented. Revenues have been attributed to regions based on the location of the sale. Intercompany revenues and adjustments to the value associated with long-lived assets not specified to a specific region have been eliminated through “Intercompany eliminations” in the table below.
| Predecessor Period |
Successor Period | |||||||||||||||||||||||
| Period from January 1 to April 11, 2007 |
Period from April 12 to December 31, 2007 |
Year Ended December 31, |
Nine Months Ended
September 30, |
|||||||||||||||||||||
| 2008 | 2009 | 2009 | 2010 | |||||||||||||||||||||
| Revenues: |
|
(unaudited) |
| |||||||||||||||||||||
| Americas |
$ | 57,584 | $ | 173,575 | $ | 254,841 | $ | 281,651 | $212,225 | $ | 221,583 | |||||||||||||
| Europe, Middle East and Africa |
9,669 | 32,389 | 45,380 | 84,917 | 55,662 | 81,856 | ||||||||||||||||||
| Asia Pacific |
6,683 | 20,261 | 29,055 | 36,894 | 26,319 | 31,275 | ||||||||||||||||||
| Intercompany eliminations |
(169) | 151 | (246) | 232 | (304) | (636) | ||||||||||||||||||
| Total |
$ | 73,767 | $ | 226,376 | $ | 329,030 | $ | 403,694 | $293,902 | $ | 334,078 | |||||||||||||
| Long-lived assets: |
||||||||||||||||||||||||
| Americas |
$ | 416,826 | $ | 574,392 | $ | 432,799 | $ | 405,777 | $ | 408,360 | $ | 382,309 | ||||||||||||
| Europe, Middle East and Africa |
20,689 | 28,718 | 27,866 | 180,528 | 184,651 | 165,226 | ||||||||||||||||||
| Asia Pacific |
2,614 | 2,445 | 1,991 | 1,598 | 1,544 | 2,941 | ||||||||||||||||||
| Intercompany eliminations |
8,530 | 2,420 | (3,064) | (6,044) | (4,025) | (3,532) | ||||||||||||||||||
| Total |
$ | 448,659 | $ | 607,975 | $ | 459,592 | $ | 581,859 | $ | 590,530 | $ | 546,943 | ||||||||||||
F-70
Table of Contents
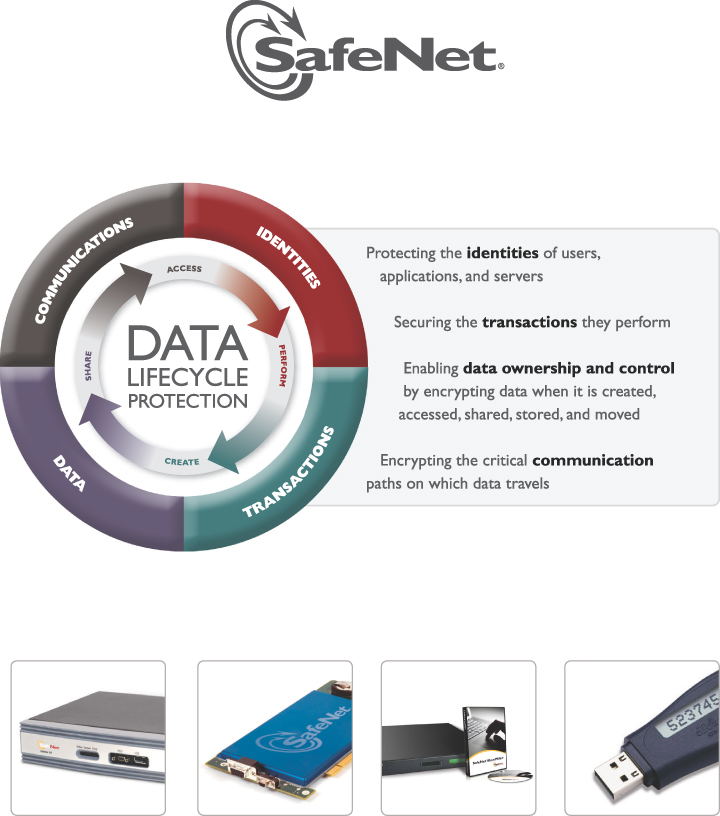
Table of Contents
Table of Contents
EXHIBIT INDEX
| Exhibit Number |
Description | |
| 1.1* | Form of Underwriting Agreement | |
| 2.1* | Stock Purchase Agreement dated March 31, 2010 by and between Magic Lamp Corporation and the Registrant | |
| 2.2* | Stock Purchase Agreement dated March 31, 2010 by and between Vector Stealth Holdings II, L.L.C. and the Registrant | |
| 3.3* | Amended and Restated Certificate of Incorporation of the Registrant | |
| 3.4* | Amended and Restated Bylaws of the Registrant | |
| 4.1** | Specimen Common Stock Certificate | |
| 4.2** | Stockholders Agreement dated , 2010 by and between the Registrant and Vector Stealth Holdings II, L.L.C. | |
| 4.3** | Registration Rights Agreement dated , 2010 by and between the Registrant and Vector Stealth Holdings II, L.L.C. | |
| 5.1** | Opinion of Wilson Sonsini Goodrich & Rosati, Professional Corporation | |
| 10.1* | Form of Indemnification Agreement for directors and executive officers | |
| 10.2* | Stock Incentive Plan | |
| 10.3* | Form of Stock Option Agreement under Stock Incentive Plan | |
| 10.4** | 2010 Equity Incentive Plan | |
| 10.5** | Form of Notice of Grant of Stock Option under 2010 Equity Incentive Plan | |
| 10.6** | Form of Notice of Grant of Restricted Stock under 2010 Equity Incentive Plan | |
| 10.7** | Form of Notice of Grant of Restricted Stock Units under 2010 Equity Incentive Plan | |
| 10.8* | Vector Stealth Holdings II, L.L.C. 2007 Equity Plan | |
| 10.9* | Form of Notice of Class C Unit Agreement under Vector Stealth Holdings II, L.L.C. 2007 Equity Plan | |
| 10.10* | Form of Notice of Class C Unit Agreement under Amended and Restated Vector Stealth Holdings II, L.L.C. 2007 Equity Plan | |
| 10.11* | Form of Vector Stealth Holdings II, L.L.C. 2007 Class B Member Admission Agreement | |
| 10.12* | Management Services Agreement dated June 3, 2010 between SafeNet and Vector Capital III | |
| 10.13* | Employment Agreement by and between the Registrant and Mark Floyd dated June 4, 2009, as further amended October 22, 2009, May 13, 2010 and June 2, 2010 | |
| 10.14* | Employment Agreement by and between the Registrant and Chris Fedde dated April 12, 2007 | |
| 10.15* | Employment Agreement by and between the Registrant and Charles J. Neral dated October 10, 2009 | |
| 10.16* | Employment Agreement by and between the Registrant and Philip Saunders dated April 12, 2007 | |
| 10.17* | Employment Agreement by and between the Registrant and James Summers dated February 26, 2008 | |
| 10.18* | Employment Agreement by and between the Registrant and Aviram Shemer dated June 4, 2009 | |
| 10.19* | First Lien Credit Agreement dated as of April 12, 2007 among Stealth Acquisition Corp. (merged with and into Safenet, Inc.), Vector Stealth Holdings II, L.L.C., the financial institutions listed therein as lenders, Deutsche Bank Trust Company Americas, as administrative agent and collateral agent, Citibank, N.A., as syndication agent, and Deutsche Bank Securities Inc. and Citigroup Global Markets Inc., as joint lead arrangers and joint bookrunners | |
Table of Contents
| Exhibit Number |
Description | |
| 10.20* | Amendment No. 1 dated as of May 16, 2007 to First Lien Credit Agreement dated as of April 12, 2007 among Stealth Acquisition Corp. (merged with and into Safenet, Inc.), Vector Stealth Holdings II, L.L.C., the financial institutions listed therein as lenders, Deutsche Bank Trust Company Americas, as administrative agent and collateral agent, Citibank, N.A., as syndication agent, and Deutsche Bank Securities Inc. and Citigroup Global Markets Inc., as joint lead arrangers and joint bookrunners | |
| 10.21* | Amendment No. 2 dated as of March 3, 2010 to First Lien Credit Agreement dated as of April 12, 2007 among Stealth Acquisition Corp. (merged with and into Safenet, Inc.), Vector Stealth Holdings II, L.L.C., the financial institutions listed therein as lenders, Deutsche Bank Trust Company Americas, as administrative agent and collateral agent, Citibank, N.A., as syndication agent, and Deutsche Bank Securities Inc. and Citigroup Global Markets Inc., as joint lead arrangers and joint bookrunners | |
| 10.22* | Second Lien Credit Agreement dated as of April 12, 2007 among Stealth Acquisition Corp. (merged with and into Safenet, Inc.), Vector Stealth Holdings II, L.L.C., the financial institutions listed therein as lenders, Deutsche Bank Trust Company Americas, as administrative agent and collateral agent, Citibank, N.A., as syndication agent, and Deutsche Bank Securities Inc. and Citigroup Global Markets Inc., as joint lead arrangers and joint bookrunners | |
| 10.23* | Amendment No. 1 dated as of May 16, 2007 to Second Lien Credit Agreement dated as of April 12, 2007 among Stealth Acquisition Corp. (merged with and into Safenet, Inc.), Vector Stealth Holdings II, L.L.C., the financial institutions listed therein as lenders, Deutsche Bank Trust Company Americas, as administrative agent and collateral agent, Citibank, N.A., as syndication agent, and Deutsche Bank Securities Inc. and Citigroup Global Markets Inc., as joint lead arrangers and joint bookrunners | |
| 10.24* | Amendment No. 2 dated as of March 3, 2010 to Second Lien Credit Agreement dated as of April 12, 2007 among Stealth Acquisition Corp. (merged with and into Safenet, Inc.), Vector Stealth Holdings II, L.L.C., the financial institutions listed therein as lenders, Deutsche Bank Trust Company Americas, as administrative agent and collateral agent, Citibank, N.A., as syndication agent, and Deutsche Bank Securities Inc. and Citigroup Global Markets Inc., as joint lead arrangers and joint bookrunners | |
| 10.25* | Incremental Amendment dated as of March 31, 2010 to Second Lien Credit Agreement dated as of April 12, 2007 among Stealth Acquisition Corp. (merged with and into Safenet, Inc.), Vector Stealth Holdings II, L.L.C., the financial institutions listed therein as lenders, Deutsche Bank Trust Company Americas, as administrative agent and collateral agent, Citibank, N.A., as syndication agent, and Deutsche Bank Securities Inc. and Citigroup Global Markets Inc., as joint lead arrangers and joint bookrunners | |
| 10.26* | Term Sheet for Settlement of Class Action dated as of July 9, 2010 among SafeNet, Inc., Anthony Caputo, Carole Argo, Kenneth Mueller and the lead plaintiffs and members of the class and subclass in that certain class action complaint filed on or about March 10, 2010 in the matter of Police & Fire Retirement Sys. of Detroit, et al., v. SafeNet, Inc., et al. | |
| 10.27* | License Agreement dated December 22, 1999 and Amendment No. 1 dated as of October 20, 2005 among Howard Delman and Secure Computing Corporation | |
| 10.28* | OEM License Agreement dated as of October 10, 2006 among Net Report S.A.S. and Aladdin Knowledge Systems Ltd. | |
| 10.29* | License Agreement dated as of October 12, 2006 among KK Athena Smartcard Solutions and Aladdin Knowledge Systems Ltd. | |
| 10.30* | OEM Agreement dated as of September 23, 2006 among Microdasys Inc. and Aladdin Knowledge Systems Ltd. | |
Table of Contents
| Exhibit Number |
Description | |
| 10.31* | Settlement Agreement dated as of August 16, 2010 among Secure Computing, LLC and Aladdin Knowledge Systems Ltd. | |
| 21.1* | List of Subsidiaries | |
| 23.1 | Consent of PricewaterhouseCoopers LLP | |
| 23.2** | Consent of Wilson Sonsini Goodrich & Rosati, Professional Corporation (included in Exhibit 5.1) | |
| 24.1* | Power of Attorney | |
| * | Previously filed |
| ** | To be filed by amendment |
Table of Contents
PART II
INFORMATION NOT REQUIRED IN PROSPECTUS
| ITEM 13. | Other Expenses of Issuance and Distribution |
The following table sets forth all expenses to be paid by the registrant, other than estimated underwriting discounts and commissions, in connection with this offering. All amounts shown are estimates except for the Securities and Exchange Commission registration fee, the Financial Industry Regulatory Authority, or FINRA, filing fee and the exchange listing fee:
| Amount to be Paid |
||||
| Securities and Exchange Commission registration fee |
$ | 21,390 | ||
| FINRA filing fee |
30,500 | |||
| NASDAQ Global Market listing fee |
150,000 | |||
| Blue Sky fees and expenses |
* | |||
| Printing and engraving expenses |
* | |||
| Legal fees and expenses |
* | |||
| Accounting fees and expenses |
* | |||
| Transfer agent and registrar fees |
* | |||
| Miscellaneous |
* | |||
| Total |
$ | * | ||
| * | To be filed by amendment. |
| ITEM 14. | Indemnification of Directors and Officers |
Section 145(a) of the Delaware General Corporation Law provides that a Delaware corporation may indemnify any person who was or is a party or is threatened to be made a party to any threatened, pending or completed action, suit or proceeding, whether civil, criminal, administrative or investigative (other than an action by or in the right of the corporation) by reason of the fact that such person is or was a director, officer, employee or agent of the corporation, or is or was serving at the request of the corporation as a director, officer, employee or agent of another corporation or enterprise, against expenses (including attorneys’ fees), judgments, fines and amounts paid in settlement actually and reasonably incurred by such person in connection with such action, suit or proceeding if he or she acted in good faith and in a manner he or she reasonably believed to be in or not opposed to the best interests of the corporation, and, with respect to any criminal action or proceeding, had no cause to believe his or her conduct was unlawful.
Section 145(b) of the Delaware General Corporation Law provides that a Delaware corporation may indemnify any person who was or is a party or is threatened to be made a party to any threatened, pending or completed action or suit by or in the right of the corporation to procure a judgment in its favor by reason of the fact that such person acted in any of the capacities set forth above, against expenses (including attorneys’ fees) actually and reasonably incurred by such person in connection with the defense or settlement of such action or suit if he or she acted under similar standards, except that no indemnification may be made in respect of any claim, issue or matter as to which such person shall have been adjudged to be liable to the corporation unless and only to the extent that the court in which such action or suit was brought shall determine that, despite the adjudication of liability but in view of all the circumstances of the case, such person is fairly and reasonably entitled to be indemnified for such expenses which the court shall deem proper.
Section 145 of the Delaware General Corporation Law further provides that: (i) to the extent that a former or present director or officer of a corporation has been successful in the defense of any action, suit or proceeding referred to in subsections (a) and (b) or in the defense of any claim, issue or matter therein, such person shall be
II-1
Table of Contents
indemnified against expenses (including attorneys’ fees) actually and reasonably incurred by him or her in connection therewith; (ii) indemnification provided for by Section 145 shall not be deemed exclusive of any other rights to which the indemnified party may be entitled; and (iii) the corporation may purchase and maintain insurance on behalf of any present or former director, officer, employee or agent of the corporation or any person who at the request of the corporation was serving in such capacity for another entity against any liability asserted against such person and incurred by him or her in any such capacity or arising out of his or her status as such, whether or not the corporation would have the power to indemnify him or her against such liabilities under Section 145.
In addition, the proposed form of Underwriting Agreement (to be filed by amendment) is expected to provide for indemnification of our directors and officers by the underwriters against certain liabilities.
Article of our certificate of incorporation authorizes us to provide for the indemnification of directors to the fullest extent permissible under Delaware law.
Article of our bylaws provides for the indemnification of officers, directors and third parties acting on our behalf if such person acted in good faith and in a manner reasonably believed to be in and not opposed to our best interest and, with respect to any criminal action or proceeding, the indemnified party had no reason to believe his or her conduct was unlawful.
We have entered into indemnification agreements with our directors, executive officers and others, in addition to indemnification provided for in our bylaws, and intend to enter into indemnification agreements with any new directors and executive officers in the future.
We have purchased and intend to maintain insurance on behalf of any person who is or was a director or officer against any loss arising from any claim asserted against him or her and incurred by him or her in any such capacity, subject to certain exclusions.
See also the undertakings set out in response to Item 17 herein.
| ITEM | 15. Recent Sales of Unregistered Securities |
In the past three years, we have issued and sold the following securities:
1. On February 24, 2010, we issued 4,736,843 shares of our common stock to Vector Stealth in consideration for $12.5 million of funding provided in connection with a prior acquisition;
2. On February 24, 2010, we issued 3,885,178 shares of our common stock to Vector Stealth in consideration for Vector Stealth issuing interests in Vector Stealth to certain of our executive officers; and
3. On March 31, 2010, we issued 52,635,307 shares of our common stock to Vector Stealth in consideration for Vector Stealth’s interests in Aladdin Knowledge Systems, Ltd.
The sales of the above securities were deemed to be exempt from registration under the Securities Act in reliance on Section 4(2) of the Securities Act. The recipients of securities in each such transaction represented their intention to acquire the securities for investment only and not with a view to or for sale in connection with any distribution thereof and appropriate legends were affixed to the share certificates and warrants issued in such transactions. All recipients had adequate access, through their relationships with us, to information about us.
| ITEM 16. | Exhibits and Financial Statement Schedules |
(a) Exhibits
A list of exhibits filed herewith is contained in the exhibit index that immediately precedes such exhibits and is incorporated herein by reference.
II-2
Table of Contents
(b) Financial Statement Schedule
| ITEM 17. | Undertakings |
The undersigned Registrant hereby undertakes to provide to the underwriters at the closing specified in the underwriting agreement certificates in such denominations and registered in such names as required by the underwriters to permit prompt delivery to each purchaser.
Insofar as indemnification by the Registrant for liabilities arising under the Securities Act may be permitted to directors, officers and controlling persons of the Registrant pursuant to the provisions described in Item 14 or otherwise, the Registrant has been advised that in the opinion of the Securities and Exchange Commission such indemnification is against public policy as expressed in the Securities Act and is, therefore, unenforceable. In the event that a claim for indemnification against such liabilities (other than the payment by the Registrant of expenses incurred or paid by a director, officer or controlling person of the Registrant in the successful defense of any action, suit or proceeding) is asserted by such director, officer or controlling person in connection with the securities being registered, the Registrant will, unless in the opinion of its counsel the matter has been settled by controlling precedent, submit to a court of appropriate jurisdiction the question whether such indemnification by it is against public policy as expressed in the Securities Act and will be governed by the final adjudication of such issue.
The undersigned Registrant hereby undertakes that:
(1) For purposes of determining any liability under the Securities Act, the information omitted from the form of prospectus filed as part of this registration statement in reliance upon Rule 430A and contained in a form of prospectus filed by the Registrant pursuant to Rule 424(b)(l) or (4) or 497(h) under the Securities Act shall be deemed to be part of this registration statement as of the time it was declared effective.
(2) For the purpose of determining any liability under the Securities Act, each post-effective amendment that contains a form of prospectus shall be deemed to be a new registration statement relating to the securities offered therein, and the offering of such securities at that time shall be deemed to be the initial bona fide offering thereof.
II-3
Table of Contents
Signatures
Pursuant to the requirements of the Securities Act of 1933, the registrant has duly caused this Amendment No. 3 to the Registration Statement to be signed on its behalf by the undersigned, thereunto duly authorized, in Belcamp, State of Maryland, on the second day of November, 2010.
| SafeNet Holding Corporation | ||
| By: | /S/ MARK A. FLOYD | |
| Mark A. Floyd | ||
| Chief Executive Officer and Director | ||
Pursuant to the requirements of the Securities Act of 1933, this Amendment No. 3 to the Registration Statement has been signed by the following persons in the capacities and on the dates indicated:
| Signature |
Title |
Date | ||
| /S/ MARK A. FLOYD Mark A. Floyd |
Chief Executive Officer (Principal Executive Officer) and Director | November 2, 2010 | ||
| /S/ CHARLES J. NERAL Charles J. Neral |
Senior Vice President and Chief Financial Officer (Principal Financial Officer and Principal Accounting Officer) | November 2, 2010 | ||
| * William P. Crowell |
Director | November 2, 2010 | ||
| * Chris Fedde |
Director | November 2, 2010 | ||
| * David L. Fishman |
Director | November 2, 2010 | ||
| * Louis J. Lavigne, Jr. |
Director | November 2, 2010 | ||
| * Arthur J. Marks |
Director | November 2, 2010 | ||
| * Alexander R. Slusky |
Director | November 2, 2010 | ||
| *By: | /S/ MARK A. FLOYD | |
| Mark A Floyd, Attorney-In-Fact | ||
II-4