Attached files
Table of Contents
UNITED STATES
SECURITIES AND EXCHANGE COMMISSION
Washington, D.C. 20549
FORM 10-Q
(Mark One)
| x | QUARTERLY REPORT PURSUANT TO SECTION 13 OR 15(d) OF THE SECURITIES EXCHANGE ACT OF 1934 |
For the quarterly period ended September 30, 2010
| ¨ | TRANSITION REPORT PURSUANT TO SECTION 13 OR 15(d) OF THE SECURITIES EXCHANGE ACT OF 1934 |
For the transition period from to
Commission file number 001-34172
Fresenius Kabi Pharmaceuticals Holding, Inc.
(Exact Name of Registrant as Specified in Its Charter)
| Delaware | 98-0589183 | |
| (State of Incorporation) | (I.R.S. Employer Identification No.) | |
| Else-Kroener-Strasse 1 61352 Bad Homburg v.d.H. Germany |
||
| (Address of principal executive offices) | (Zip Code) | |
+49 (6172) 608 0
(Registrant’s Telephone Number, Including Area Code)
N/A
(Former Name, Former Address or Former Fiscal Year, if Changed Since Last Report)
Indicate by check mark whether the registrant (1) has filed all reports required to be filed by Section 13 or 15(d) of the Securities Exchange Act of 1934 during the preceding 12 months (or for such shorter period that the registrant was required to file such reports), and (2) has been subject to such filing requirements for the past 90 days. Yes x No ¨
Indicate by check mark whether the registrant has submitted electronically and posted on its corporate Web site, if any, every Interactive Data File required to be submitted and posted pursuant to Rule 405 of Regulation S-T during the preceding 12 months (or for such shorter period that the registrant was required to submit and post such files). Yes ¨ No ¨
Indicate by check mark whether the registrant is a large accelerated filer, an accelerated filer, a non-accelerated filer, or a smaller reporting company. See the definitions of “large accelerated filer,” “accelerated filer” and “smaller reporting company” in Rule 12b-2 of the Exchange Act (Check one):
| Large accelerated filer | ¨ | Accelerated filer | ¨ | |||
| Non-accelerated filer | x (Do not check if a smaller reporting company) | Smaller reporting company | ¨ | |||
Indicate by check mark whether the registrant is a shell company (as defined in Rule 12b-2 of the Exchange Act). Yes ¨ No x
As of November 1, 2010, all of the shares of the registrant’s common stock were held by Fresenius Kabi AG.
Table of Contents
Fresenius Kabi Pharmaceuticals Holding, Inc.
INDEX
Table of Contents
| ITEM 1. | FINANCIAL STATEMENTS |
Fresenius Kabi Pharmaceuticals Holding, Inc.
Condensed Consolidated Balance Sheets
(Unaudited)
| September 30, 2010 |
December 31, 2009 |
|||||||
| (in thousands, except share data) | ||||||||
| Assets |
||||||||
| Current assets: |
||||||||
| Cash and cash equivalents |
$ | 6,726 | $ | 10,469 | ||||
| Accounts receivable, net |
134,388 | 85,517 | ||||||
| Inventories |
212,009 | 212,065 | ||||||
| Prepaid expenses and other current assets |
23,951 | 31,606 | ||||||
| Current receivables from related parties |
2,377 | 1,219 | ||||||
| Income taxes receivable |
8,944 | 51,963 | ||||||
| Deferred income taxes |
26,250 | 18,880 | ||||||
| Total current assets |
414,645 | 411,719 | ||||||
| Property, plant and equipment, net |
116,364 | 129,784 | ||||||
| Intangible assets, net |
475,828 | 506,215 | ||||||
| Goodwill |
3,662,173 | 3,664,371 | ||||||
| Deferred financing costs |
103,577 | 117,166 | ||||||
| Other non-current assets, net |
10,681 | 29,430 | ||||||
| Total assets |
$ | 4,783,268 | $ | 4,858,685 | ||||
| Liabilities and stockholder’s equity |
||||||||
| Current liabilities: |
||||||||
| Cash overdraft |
$ | 7,261 | $ | — | ||||
| Accounts payable |
37,022 | 53,238 | ||||||
| Accrued liabilities |
71,031 | 57,320 | ||||||
| Current payables to related parties |
7,918 | 9,914 | ||||||
| Accrued intercompany interest |
24,957 | 47,141 | ||||||
| Current CVR payable |
5,714 | — | ||||||
| Current portion of long-term debt |
123,975 | 76,475 | ||||||
| Current portion of intercompany debt |
427,860 | 441,511 | ||||||
| Total current liabilities |
705,738 | 685,599 | ||||||
| Long-term debt |
745,231 | 844,969 | ||||||
| Deferred income taxes, non-current |
63,240 | 77,593 | ||||||
| Fair value of interest rate swaps with Parent and affiliates |
80,252 | 53,188 | ||||||
| Intercompany notes payable to Parent and affiliates |
2,565,425 | 2,591,693 | ||||||
| CVR payable, non-current |
— | 48,976 | ||||||
| Other non-current liabilities |
18,077 | 17,591 | ||||||
| Total liabilities |
4,177,963 | 4,319,609 | ||||||
| Stockholder’s equity: |
||||||||
| Common stock - $0.001 par value; 1,000 shares authorized and outstanding in 2010 and 2009 |
— | — | ||||||
| Additional paid-in capital |
900,822 | 900,379 | ||||||
| Accumulated deficit |
(259,617 | ) | (342,830 | ) | ||||
| Accumulated other comprehensive loss |
(35,900 | ) | (18,473 | ) | ||||
| Total stockholder’s equity |
605,305 | 539,076 | ||||||
| Total liabilities and stockholder’s equity |
$ | 4,783,268 | $ | 4,858,685 | ||||
See accompanying notes to condensed consolidated financial statements
3
Table of Contents
Fresenius Kabi Pharmaceuticals Holding, Inc.
Condensed Consolidated Statements of Operations
(Unaudited)
| Three Months
Ended September 30, |
Nine Months
Ended September 30, |
|||||||||||||||
| 2010 | 2009 | 2010 | 2009 | |||||||||||||
| (in thousands) | ||||||||||||||||
| Net revenue |
$ | 331,321 | $ | 224,654 | $ | 852,748 | $ | 632,186 | ||||||||
| Cost of sales |
145,047 | 116,770 | 430,304 | 314,516 | ||||||||||||
| Gross profit |
186,274 | 107,884 | 422,444 | 317,670 | ||||||||||||
| Operating expenses: |
||||||||||||||||
| Research and development |
9,864 | 6,444 | 21,062 | 20,822 | ||||||||||||
| Selling, general and administrative |
31,401 | 18,514 | 87,375 | 66,355 | ||||||||||||
| Amortization of merger related intangibles |
9,163 | 9,163 | 27,488 | 27,487 | ||||||||||||
| Impairment of fixed assets |
2,938 | 5,372 | 2,938 | 5,372 | ||||||||||||
| Total operating expenses |
53,366 | 39,493 | 138,863 | 120,036 | ||||||||||||
| Income from operations |
132,908 | 68,391 | 283,581 | 197,634 | ||||||||||||
| Interest expense |
(15,498 | ) | (26,680 | ) | (48,939 | ) | (61,166 | ) | ||||||||
| Intercompany interest expense |
(52,977 | ) | (53,678 | ) | (163,402 | ) | (191,029 | ) | ||||||||
| Unrealized gain (loss) on change in fair value of contingent value rights |
15,509 | (50,608 | ) | 43,262 | (37,548 | ) | ||||||||||
| Interest income and other, net |
(4,146 | ) | (893 | ) | 695 | 3,677 | ||||||||||
| Income (loss) before income taxes |
75,796 | (63,468 | ) | 115,197 | (88,432 | ) | ||||||||||
| Income tax expense (benefit) |
23,668 | (2,242 | ) | 31,984 | (12,409 | ) | ||||||||||
| Net income (loss) |
$ | 52,128 | $ | (61,226 | ) | $ | 83,213 | $ | (76,023 | ) | ||||||
See accompanying notes to condensed consolidated financial statements
4
Table of Contents
Fresenius Kabi Pharmaceuticals Holding, Inc.
Condensed Consolidated Statements of Cash Flows
(Unaudited)
| Nine Months Ended September 30, | ||||||||
| 2010 | 2009 | |||||||
| (in thousands) | ||||||||
| Cash flows from operating activities: |
||||||||
| Net income (loss) |
$ | 83,213 | $ | (76,023 | ) | |||
| Adjustments to reconcile net income (loss) to net cash provided by operating activities: |
||||||||
| Depreciation |
15,643 | 13,584 | ||||||
| Amortization |
28,933 | 28,684 | ||||||
| Amortization of merger related intangibles |
27,487 | 27,487 | ||||||
| Write-off of deferred financing fees |
— | 14,661 | ||||||
| Impairment of fixed and intangible assets |
4,338 | 5,372 | ||||||
| Gain on non-cash foreign currency transactions |
31 | (3,301 | ) | |||||
| Change in fair value of contingent value rights |
(43,262 | ) | 37,548 | |||||
| Stock-based compensation |
443 | 238 | ||||||
| (Gain) loss on disposal of property, plant and equipment |
(604 | ) | 396 | |||||
| Deferred income taxes |
(8,824 | ) | 5,128 | |||||
| Other non-cash charges |
(268 | ) | 773 | |||||
| Changes in operating assets and liabilities: |
||||||||
| Accounts receivable, net |
(48,871 | ) | 21,126 | |||||
| Inventories |
56 | (40,736 | ) | |||||
| Prepaid expenses and other current assets |
1,511 | (13,115 | ) | |||||
| Current receivables from related parties |
(1,158 | ) | (2,227 | ) | ||||
| Income taxes receivable |
43,019 | (3,434 | ) | |||||
| Other non-current assets, net |
489 | 19,815 | ||||||
| Accounts payable and accrued liabilities |
(3,195 | ) | 2,574 | |||||
| Current payables to related parties |
(3,523 | ) | (2,129 | ) | ||||
| Accrued intercompany interest |
(22,184 | ) | (44 | ) | ||||
| Intercompany payable to Parent-non-current |
— | 5,056 | ||||||
| Other non-current liabilities |
285 | 14,417 | ||||||
| Net cash provided by operating activities |
73,559 | 55,850 | ||||||
| Cash flows from investing activities: |
||||||||
| Purchases of property, plant and equipment |
(7,470 | ) | (13,714 | ) | ||||
| Purchases of other non-current assets |
— | (9,413 | ) | |||||
| Proceeds from sale of fixed assets |
2,743 | — | ||||||
| Proceeds from note receivable from Parent |
— | 33,800 | ||||||
| Cash paid for Fresenius merger |
— | (2,000 | ) | |||||
| Net cash (used in) provided by investing activities |
(4,727 | ) | 8,673 | |||||
| Cash flows from financing activities: |
||||||||
| Cash overdraft |
7,261 | 4,255 | ||||||
| Payments under unsecured credit facility, net |
(65,920 | ) | (70,888 | ) | ||||
| (Payments) borrowings under secured credit facility, net |
(2,488 | ) | 57,769 | |||||
| Payments of deferred financing costs |
(12,217 | ) | (62,679 | ) | ||||
| Net cash used in financing activities |
(73,364 | ) | (71,543 | ) | ||||
| Effect of exchange rates on cash and cash equivalents |
788 | 4,349 | ||||||
| Net decrease in cash and cash equivalents |
(3,743 | ) | (2,671 | ) | ||||
| Cash and cash equivalents, beginning of period |
10,469 | 8,441 | ||||||
| Cash and cash equivalents, end of period |
$ | 6,726 | $ | 5,770 | ||||
| Supplemental disclosure of cash flow information: |
||||||||
| Cash received/ (paid) during the period for: |
||||||||
| Interest |
$ | (208,180 | ) | $ | (213,823 | ) | ||
| Income taxes |
$ | (1,922 | ) | $ | 17,212 | |||
| Supplemental schedule of noncash investing and financing activities: |
||||||||
| Conversion of group and target revolver to intercompany debt |
$ | — | $ | 225,000 | ||||
See accompanying notes to condensed consolidated financial statements
5
Table of Contents
FRESENIUS KABI PHARMACEUTICALS HOLDING, INC.
NOTES TO CONDENSED CONSOLIDATED FINANCIAL STATEMENTS
September 30, 2010
(Unaudited)
(1) Description of Business and Summary of Significant Accounting Policies
Description of Business
On September 10, 2008, APP Pharmaceuticals, Inc. (“APP” or “the Predecessor”) became a direct, wholly-owned operating subsidiary of Fresenius Kabi Pharmaceuticals Holding, Inc. (“FKP Holdings” or “the Company”) and an indirect wholly-owned subsidiary of Fresenius SE (“Fresenius” or “the Parent”) a societas europaea organized under the laws of the European Union and Germany, upon completion of the merger (the “Merger”) of a wholly-owned subsidiary of FKP Holdings (“Merger Sub”) with and into APP pursuant to the Agreement and Plan of Merger dated July 6, 2008 (the “Merger Agreement”) by and among Fresenius, FKP Holdings, Merger Sub and APP.
FKP Holdings is a Delaware corporation and an indirect wholly-owned subsidiary of Fresenius. FKP Holdings was formed on July 2, 2008, and prior to the Merger had not carried on any activities or operations except for those activities incidental to its formation and in connection with the transactions related to the Merger. Following the Merger, the operating assets and business of FKP Holdings consisted exclusively of those of APP prior to the Merger.
The Company incurred indebtedness in connection with the Merger, the proceeds of which together with other funds provided by Fresenius though equity contributions and loans to FKP Holdings and its subsidiaries were used to pay the aggregate Merger consideration, repay a portion of the Company’s then outstanding indebtedness and pay fees and expenses related to the Merger. The Company also issued contingent value rights (“CVRs”) to the holders of APP common stock and the holders of stock options and restricted stock issued by APP prior to the Merger. The term “Transactions” refers to, collectively, (1) the Merger, (2) the incurrence of the initial merger-related indebtedness, and (3) the issuance of the CVRs. Fresenius has committed to the Company that it will provide financial support to FKP Holdings sufficient for it to satisfy its obligations and debt service requirements arising under the Company’s existing financing instruments that were incurred in connection with the Merger as they come due until at least January 1, 2011.
Basis of Presentation
The accompanying unaudited condensed consolidated financial statements have been prepared in accordance with generally accepted accounting principles in the United States (“GAAP”) for interim financial information and the instructions to Form 10-Q and Article 10 of Regulation S-X. Accordingly, these financial statements do not include all of the information and notes required by GAAP for complete financial statements. In the opinion of management, all adjustments (consisting of normal recurring accruals) considered necessary for a fair presentation have been included. Operating results for the three and nine months ended September 30, 2010 are not necessarily indicative of the operating results for the full year or for any other subsequent interim period.
The balance sheet information at December 31, 2009 has been derived from the audited consolidated financial statements of FKP Holdings as of that date, but does not include all of the information and notes required by GAAP for complete financial statements. These interim unaudited condensed consolidated financial statements should be read in conjunction with the audited consolidated financial statements included in the Company’s Annual Report on Form 10-K for the year ended December 31, 2009.
Certain prior period balances have been reclassified to conform to the presentation adopted in the current period. In the fourth quarter of 2009, the Company identified that cash flows related to notes receivable activity with the Parent had been displayed in financing cash flows rather than investing cash flows. The accompanying consolidated cash flow statement for the nine months ended September 30, 2009 has been revised to present notes receivable activity with the Parent as investing cash flows. This revision did not impact the change in cash and cash equivalents or cash provided by operating activities as previously reported.
Principles of Consolidation
The unaudited condensed consolidated financial statements of FKP Holdings include: (a) the assets, liabilities and results of operations of FKP Holdings, and (b) the assets, liabilities and results of operations of APP and its wholly owned subsidiaries (Pharmaceutical Partners of Canada, Inc. and APP Pharmaceuticals Manufacturing, LLC). All material intercompany balances and transactions have been eliminated in consolidation. APP is a wholly owned subsidiary of FKP Holdings, which itself is a wholly-owned subsidiary of its sole stockholder Fresenius Kabi AG. Fresenius Kabi AG is a wholly-owned subsidiary of Fresenius.
6
Table of Contents
FRESENIUS KABI PHARMACEUTICALS HOLDING, INC.
NOTES TO CONDENSED CONSOLIDATED FINANCIAL STATEMENTS—(Continued)
September 30, 2010
(Unaudited)
Use of Estimates
The preparation of financial statements in conformity with generally accepted accounting principles requires management to make estimates and assumptions that affect the reported amounts of assets and liabilities and disclosure of contingent assets and liabilities at the date of the consolidated financial statements. Estimates may also affect the reported amounts of revenues and expenses during the reporting period. On an on-going basis, we evaluate our estimates and judgments, including those related to revenue recognition and related allowances, inventory, impairments of long-lived assets including intangible assets, impairments of goodwill, derivatives and hedging activities, income taxes including valuation allowances for deferred tax assets, and contingencies and litigation. We base our estimates on historical experience and on various other assumptions that are believed to be reasonable, the results of which form the basis for making judgments about the carrying values of assets and liabilities. Actual results could differ from those estimates.
Recent Accounting Pronouncements
In January 2010, the Financial Accounting Standards Board (“FASB”) issued Accounting Standards Update (“ASU”) 2010-06 that requires additional disclosures about (1) the different classes of assets and liabilities measured at fair value, (2) the valuation techniques and inputs used, (3) the sensitivity of fair value measurements to changes in assumptions, and (4) transfers between the three levels of the fair value hierarchy. The disclosures about purchases, sales, issuances, and settlements relating to Level 3 measurements are effective for fiscal years beginning after December 15, 2010, and for the interim periods within those fiscal years. The Company is currently evaluating the impact of adopting this guidance but does not anticipate it will have a material impact on our results of operations or financial condition. All other requirements of this ASU were effective in interim and annual periods beginning after December 15, 2009. The adoption of this guidance had no impact on our condensed consolidated financial statements.
In June 2009, the FASB issued ASU 2009-17, which eliminates the exceptions to the rules requiring consolidation of qualifying special-purpose entities (the “QSPE”), which means more entities will be subject to consolidation assessments and reassessments. The guidance also requires ongoing reassessment of whether a company is the primary beneficiary of a variable interest entity (“VIE”) and clarifies characteristics that identify a VIE. In addition, additional disclosures about a company’s involvement with a VIE and any significant changes in risk exposure due to that involvement are required. This guidance was effective for the Company beginning in 2010, and its adoption had no impact on our condensed consolidated financial statements.
(2) Merger with APP
On September 10, 2008, FKP Holdings completed the Merger, following which APP became a wholly-owned subsidiary of FKP Holdings. The results of APP’s operations have been included in the consolidated financial statements of FKP Holdings since September 10, 2008. APP is a fully-integrated pharmaceutical company that develops, manufactures and markets injectable pharmaceutical products with a primary focus on the oncology, anti-infective, anesthetic/analgesic and critical care markets. APP manufactures a comprehensive range of dosage formulations, and its products are used in hospitals, long-term care facilities, alternate care sites and clinics within North America. The Merger was an important step in Fresenius’ growth strategy, because it enabled Fresenius to gain entry to the U.S. pharmaceuticals market and to achieve a leading position in the global I.V. generics industry. The North American platform also provides further growth opportunities for Fresenius’ existing product portfolio.
The aggregate consideration paid in the Merger was $4,908.1 million (including assumed APP debt), comprised as follows (in millions):
| Purchase of outstanding common stock (cash portion) |
$ | 3,702.7 | ||
| Buy-out of restricted stock units and stock options under stock compensation plans |
27.7 | |||
| Estimated fair value of CVRs |
158.4 | |||
| Direct acquisition costs |
21.8 | |||
| Fair value of consideration paid |
3,910.6 | |||
| Assumption of APP debt |
997.5 | |||
| Total aggregate consideration |
$ | 4,908.1 | ||
The CVRs were issued on the acquisition date and trade on the NASDAQ capital market (“NASDAQ”) under the symbol “APCVZ”. The fair value of the CVRs at the date of the acquisition was estimated based on the average of their closing prices for the five trading days following the acquisition. Direct costs of the acquisition include investment banking fees, legal and accounting fees and other external costs directly related to the acquisition.
7
Table of Contents
FRESENIUS KABI PHARMACEUTICALS HOLDING, INC.
NOTES TO CONDENSED CONSOLIDATED FINANCIAL STATEMENTS—(Continued)
September 30, 2010
(Unaudited)
On September 8, 2009, the Board of Directors of FKP Holdings formally approved management’s plan to close the Barceloneta, Puerto Rico manufacturing facility, which was acquired in the Merger, and transfer production operations to existing Company plants in the United States. This action was taken to lower overall manufacturing costs and to strengthen the Company’s long-term competitive position. The decision to close this facility was made pursuant to a plan developed by FKP Holdings in connection with the Merger, and resulted in various adjustments to the estimated amounts assigned to certain assets acquired, liabilities assumed and residual goodwill in connection with the APP acquisition. Production at the facility ceased during the third quarter 2010 and the facility continues to be marketed for sale.
(3) Adjusted EBITDA Calculation for Contingent Value Rights
In connection with the Merger, each APP shareholder was issued one contingent value right of FKP Holdings for each share held. The CVRs are intended to give holders an opportunity to participate in any excess Adjusted EBITDA, as defined in the CVR Indenture, generated by FKP Holdings during the three years ending December 31, 2010, referred to as the “CVR measuring period,” in excess of a threshold amount. Each CVR represents the right to receive a pro rata portion of an amount equal to 2.5 times the amount by which cumulative Adjusted EBITDA of APP and FKP Holdings and their subsidiaries on a consolidated basis, exceeds $1.267 billion for the three years ending December 31, 2010. If Adjusted EBITDA for the CVR measuring period does not exceed this threshold amount, no amounts will be payable on the CVRs and the CVRs will expire valueless. The maximum amount payable under the CVR Indenture is $6.00 per CVR. The cash payment on the CVRs, if any, will be determined after December 31, 2010, and will be payable June 30, 2011, except in the case of a change of control of FKP Holdings, which may result in an acceleration of any payment. The acceleration payment, if any, is payable within six months after the change of control giving rise to the acceleration payment. Shortly after FKP Holdings files its Annual Report on Form 10-K for the year ended December 31, 2010 the CVRs will be deregistered and delisted and cease trading on NASDAQ.
The CVRs do not represent equity, or voting securities of FKP Holdings, and they do not represent ownership interests in FKP Holdings. Holders of the CVRs are not entitled to any rights of a stockholder or other equity or voting securities of FKP Holdings, either at law or in equity. Similarly, holders of CVRs are not entitled to any dividends declared or paid with respect to any equity security of FKP Holdings. A holder of a CVR is entitled only to those rights set forth in the CVR Indenture. Additionally, the right to receive amounts payable under the CVRs, if any, is subordinated to all senior obligations of FKP Holdings.
Because any amount payable to the holders of CVRs must be settled in cash, the CVRs are classified as liabilities in the accompanying condensed consolidated financial statements. The estimated fair value of the CVRs at the date of acquisition was included in the cost of the acquisition. At each reporting date, the CVRs are marked-to-market based on the closing price of a CVR as reported by NASDAQ, and the change in the fair value of the CVRs for the reporting period is included in the statements of operations. At September 30, 2010 and December 31, 2009, the carrying value of the CVR liability was approximately $5.7 million and $49.0 million, respectively.
(4) Inventories
Inventories are valued at the lower of cost or market as determined under the first-in, first-out, or FIFO method, as follows (in thousands):
| For the Period Ended | ||||||||||||||||||||||||||||
| September 30, 2010 | December 31, 2009 | |||||||||||||||||||||||||||
| Approved | Pending Regulatory Approval |
Total Inventory | Approved | Pending Regulatory Approval |
Total Inventory | |||||||||||||||||||||||
| (in thousands) | ||||||||||||||||||||||||||||
| Finished goods |
$ | 86,737 | 662 | $ | 87,399 | $ | 70,551 | 16,733 | $ | 87,284 | ||||||||||||||||||
| Work in process |
37,359 | 1,058 | 38,417 | 29,432 | — | 29,432 | ||||||||||||||||||||||
| Raw materials |
82,120 | 4,073 | 86,193 | 91,894 | 3,455 | 95,349 | ||||||||||||||||||||||
| $ | 206,216 | $ | 5,793 | $ | 212,009 | $ | 191,877 | $ | 20,188 | $ | 212,065 | |||||||||||||||||
Inventories consist of products currently approved for marketing and costs related to certain products that are pending regulatory approval. From time to time, we capitalize inventory costs associated with products prior to regulatory approval based on our judgment of probable future approval, commercial success and realizable value. Such judgment incorporates our knowledge and best judgment of where the product is in the regulatory review process, our required investment in the product, market conditions, competing products and our economic expectations for the product post-approval relative to the risk of manufacturing the product prior to approval. In evaluating the market value of inventory pending regulatory approval as compared to the capitalized cost, we considered the market, pricing and demand for competing products, our anticipated selling price for the product and the position of the product in the regulatory review process. If final regulatory approval for such products is denied or delayed, we revise our estimates and judgments about the recoverability of the capitalized costs and, where required, provide reserves for or write-off such inventory in the period those estimates and judgments change. At September 30, 2010 and December 31, 2009, inventory included $5.8 and $20.2 million, respectively, in costs related to products pending approval by the United States Food and Drug Administration (“FDA”). The decrease in products pending approval during the current period is attributed to increases in reserves related to uncertainty in FDA approval of certain products.
8
Table of Contents
FRESENIUS KABI PHARMACEUTICALS HOLDING, INC.
NOTES TO CONDENSED CONSOLIDATED FINANCIAL STATEMENTS—(Continued)
September 30, 2010
(Unaudited)
We routinely review our inventory and establish reserves when the cost of the inventory is not expected to be recovered or the cost of a product exceeds estimated net realizable value. In instances where inventory is at or approaching expiration, is not expected to be saleable based on our quality and control standards, or is selling for a price below cost, we reserve for any inventory impairment based on the specific facts and circumstances. Provisions for inventory reserves are reflected in the unaudited condensed consolidated financial statements as an element of cost of sales; inventories are presented net of related reserves.
(5) Long-Term Debt and Credit Facility
A summary of our external and intercompany debt is as follows:
| September 30, 2010 |
December 31, 2009 |
|||||||
| External debt |
||||||||
| Senior Credit Facilities, with interest at variable rates based on LIBOR plus a margin. Term loan B2 and C2 are subject to a minimum rate |
||||||||
| Term loan A2, due in semi-annual installments through September 10, 2013 |
$ | 438,500 | $ | 462,500 | ||||
| Term loan B2, due in equal semi-annual installments with a final balloon payment on September 10, 2014 |
— | 458,944 | ||||||
| Term loan C2, due in equal semi-annual installments beginning June 10, 2010, with a final balloon payment on September 10, 2014 |
406,706 | — | ||||||
| Target revolving credit facility loan, due at expiration of the facility on September 10, 2013 |
24,000 | — | ||||||
| Total external debt |
869,206 | 921,444 | ||||||
| Current maturities of external debt |
(123,975 | ) | (76,475 | ) | ||||
| Long-term external debt |
$ | 745,231 | $ | 844,969 | ||||
| Internal debt |
||||||||
| Intercompany Credit Facilities |
||||||||
| Short-term unsecured intercompany loans payable to Fresenius Kabi AG, due in 30 to 60 days from date of issue, with interest at fixed rates |
$ | 323,000 | $ | 360,000 | ||||
| Secured senior intercompany loans payable to a financing subsidiary of Fresenius SE, with interest at variable rates based on LIBOR or EURIBOR plus a margin. Term loan B1 and C1 are subject to a minimum rate |
||||||||
| Term loan A1, due in semi-annual installments through September 10, 2013 |
438,500 | 462,500 | ||||||
| Term loan B1, due in equal semi-annual installments with a final balloon payment on September 10, 2014 |
— | 657,742 | ||||||
| Term loan C1, due in equal semi-annual installments with a final balloon payment on September 10, 2014 |
582,878 | — | ||||||
| Euro currency term loan B1 (€197.5 million), due in equal semi-annual installments with a final balloon payment on September 10, 2014 |
— | 265,791 | ||||||
| Euro currency term loan C1 (€163.5 million), due in equal semi-annual installments with a final balloon payment on September 10, 2014 |
223,145 | — | ||||||
| Unsecured intercompany loans payable to a financing subsidiary of Fresenius SE, due July 15, 2015, with interest at fixed rates |
||||||||
| US dollar denominated |
500,000 | 500,000 | ||||||
| Euro currency denominated (€115.7 million) |
157,898 | 166,668 | ||||||
| Unsecured intercompany loans payable to Fresenius Kabi AG, due September 10, 2014, with interest at fixed rates |
722,826 | 601,775 | ||||||
| Euro currency denominated loans payable (€33.0 million as of September 30, 2010 and €13 million as of December 31, 2009) |
45,038 | 18,728 | ||||||
| Total intercompany debt |
2,993,285 | 3,033,204 | ||||||
| Current maturities of intercompany debt |
(427,860 | ) | (441,511 | ) | ||||
| Long-term intercompany debt |
$ | 2,565,425 | $ | 2,591,693 | ||||
Fresenius Merger—Credit Agreements
On August 20, 2008, in connection with the acquisition of APP, Fresenius entered into various credit arrangements to assist in funding the transaction. These credit facilities included a Senior Credit Facilities Agreement and a Bridge Facility Agreement. Proceeds from borrowings under these credit facilities, together with other available funds provided by Fresenius through equity contributions and loans to FKP Holdings and its subsidiaries, were utilized to complete the purchase of APP on September 10, 2008.
9
Table of Contents
FRESENIUS KABI PHARMACEUTICALS HOLDING, INC.
NOTES TO CONDENSED CONSOLIDATED FINANCIAL STATEMENTS—(Continued)
September 30, 2010
(Unaudited)
The Senior Credit Facilities Agreement provides Fresenius and certain of its subsidiaries with various credit facilities. These include two term loan facilities and a $150 million revolving credit facility under which APP Pharmaceuticals, LLC, a wholly owned subsidiary of APP, is the obligor.
Pursuant to the Senior Credit Facilities Agreement, FKP Holdings and its subsidiaries have entered into various secured senior intercompany loans with finance subsidiaries of Fresenius SE (collectively, the “Senior Intercompany Loans”), the amount, maturity and other financial terms of which correspond to those applicable to the loans provided to such borrowers under the Senior Credit Facilities Agreement described above. The Senior Intercompany Loans are guaranteed by FKP Holdings and certain of its affiliates and subsidiaries and secured by the assets of FKP Holdings and certain of its affiliates and subsidiaries. The Senior Intercompany Loans provide for an event of default and acceleration if there is an event of default and acceleration under the Senior Credit Facilities Agreement, but acceleration of the Senior Intercompany Loans may not occur prior to acceleration of the loans under the Senior Credit Facilities Agreement. By entering into the Senior Intercompany Loans, Fresenius effectively pushed-down its Merger-related term loan borrowings under the Senior Credit Facilities Agreement to the FKP Holdings group.
The Senior Credit Facilities Agreement contains a number of affirmative and negative covenants that are assessed at the Fresenius level and are not separately assessed at FKP Holdings or its subsidiaries. The Company’s obligations under the Senior Credit Facilities Agreement are unconditionally guaranteed by Fresenius SE and certain of its subsidiaries, and are secured by a first-priority security interest in substantially all tangible and intangible assets of APP Pharmaceuticals, Inc. and APP Pharmaceuticals, LLC.
Post-Merger Activity
In October 2008, the amount available under the Senior Credit Facilities Agreement was increased and the full amount of the increase to the facility was drawn down. These funds, along with an additional $166.9 million of proceeds from other intercompany borrowings were used to repay a portion of the balance outstanding under the Bridge Facility Agreement. On January 21, 2009, the borrower under the Bridge Facility Agreement, which is an affiliate of Fresenius, issued two tranches of notes in a private placement. Proceeds of the notes issuance were used, among other things, to repay in full the balance outstanding under the Bridge Facility Agreement. Upon the repayment of the bridge loan, the Bridge Intercompany Loan was refinanced and replaced with an Intercompany Dollar Loan of $500 million and an Intercompany Euro Loan of €115.7 million. These new intercompany loans are not guaranteed or secured. As a result of the refinancing, in the first quarter of 2009, the Company wrote-off $14.6 million of Bridge Intercompany Loan unamortized debt issuance costs and incurred debt issuance costs of $67.5 million for the new Intercompany Dollar and Euro loans.
On each of December 10, 2009 and February 10, 2010, the Company entered into three unsecured intercompany loans with Fresenius Kabi AG in the amounts of €13 million, $46.3 million and $32.3 million and €20 million, $71.3 million and $49.8 million, respectively. These loans replaced Senior Intercompany Loans of like amounts. These Fresenius Kabi AG notes bear fixed interest rates. There was no change to principal maturity dates as a result of this exchange of notes.
On March 18, 2010, the 2008 Senior Credit Facilities Agreement was amended, and Term Loan B, consisting of APP’s Term Loan B2 and Term Loan B1 were replaced with a lower interest bearing Term Loan C, consisting of APP’s Term Loan C2 and Term Loan C1. There was no change to principal amount outstanding as a result of this exchange of notes. The amendments to the 2008 Senior Credit Agreement also modified certain of the financial covenants, which are measured at the consolidated Fresenius SE level, as defined in the agreement. As a result of the debt replacement in the first quarter of 2010, the Company incurred debt issuance costs of $13.7 million for the Term Loan C, of which $12.2 million was paid directly by the Company and $1.5 million was pushed down from the Parent.
Subsequent to the period ended September 30, 2010, the Company replaced the outstanding Target Revolver with fixed rate unsecured intercompany notes with Fresenius Kabi AG which mature monthly.
The following is the repayment schedule for Term Loans A2 and C2, the target revolver and the intercompany loans outstanding as of September 30, 2010 (in thousands):
| Term Loan A2 | Term Loan C2 | Target Revolver |
Intercompany Fresenius |
Total | ||||||||||||||||
| 12 months from 10/1/10 to 9/30/11 |
$ | 95,000 | $ | 4,975 | $ | 24,000 | $ | 427,860 | $ | 551,835 | ||||||||||
| 12 months from 10/1/11 to 9/30/12 |
150,000 | 4,975 | — | 159,860 | 314,835 | |||||||||||||||
| 12 months from 10/1/12 to 9/30/13 |
193,500 | 4,975 | — | 203,360 | 401,835 | |||||||||||||||
| 12 months from 10/1/13 to 9/30/14 |
— | 391,781 | — | 1,544,308 | 1,936,089 | |||||||||||||||
| 12 months from 10/1/14 to 9/30/15 |
— | — | — | 657,897 | 657,897 | |||||||||||||||
| $ | 438,500 | $ | 406,706 | $ | 24,000 | $ | 2,993,285 | $ | 3,862,491 | |||||||||||
10
Table of Contents
FRESENIUS KABI PHARMACEUTICALS HOLDING, INC.
NOTES TO CONDENSED CONSOLIDATED FINANCIAL STATEMENTS—(Continued)
September 30, 2010
(Unaudited)
(6) Derivatives
The Company does not engage in the trading of derivative financial instruments except where the Company’s objective is to manage the variability of forecasted inventory purchases due to changes in foreign currency exchange rates, and the variability of payments of principal and interest attributable to changes in interest rates or foreign currency exchange rates. In general, the Company enters into derivative transactions in limited situations based on management’s assessment of current market conditions and perceived risks.
As a result of the use of derivative instruments, the Company is exposed to counterparty credit risk when these instruments are in an asset position. The Company manages the counterparty credit risk by entering into derivative contracts only with its Parent company and its affiliates. As a result, as of September 30, 2010, the Company does not expect to experience any losses as a result of default of its counterparty.
Foreign Currency Contracts: Included in our intercompany borrowings are several Euro-denominated notes, including €196.5 million in notes with maturities in 2014, and a €115.7 million note with a maturity in 2015. In connection with these borrowings, we entered into foreign currency swap contracts in order to limit our exposure to changes in current exchange rates on the Euro-denominated notes principal balance. We have entered into these foreign currency swaps with affiliates of Fresenius for the total of the Euro-denominated notes principal balance. These agreements mature at various dates through January 2012, and are not designated as hedging instruments for accounting purposes. For the nine months ended September 30, 2010 and 2009 we recognized a foreign currency loss of $24.1 million and gain of $37.8 million, respectively, in our other income (expense) related to the change in fair value of these swap agreements. These foreign currency losses and gains were offset by $23.8 million and $33.8 million in currency gains and losses we recorded in the nine months ended September 30, 2010 and 2009, respectively, in order to adjust the carrying value of the Euro-denominated notes to reflect the period-end exchange rate.
We have also entered into foreign currency forward contracts for €10.0 million of the future cash flows related to the interest payments due on the €196.5 million notes through October 2012, and €15.2 million of the future cash flows related to the interest payments due on the €115.7 million note through January 2012. These foreign currency agreements have been designated as hedges of our exposure to fluctuations in interest payments on outstanding Euro-denominated borrowings due to changes in Euro/U.S. dollar exchange rates (a cash flow hedge).
During the second quarter of 2010, we entered into foreign currency forward contracts for €22.7 million of future cash flows related to certain forecasted inventory purchases from July 2010 through June 2011. These foreign currency agreements have been designated as hedges of our exposure to fluctuations in future payments related to these forecasted purchases due to changes in Euro/U.S. dollar exchange rates (a cash flow hedge). At September 30, 2010 we have €19.3 million of outstanding foreign currency forward contracts.
Interest Rate Swaps: On November 3, 2008, we entered into four interest rate swap agreements with Fresenius for an aggregate notional principal amount of $900 million, the “2008 interest rate swaps”. These agreements require us to pay interest at an average fixed rate of 3.97% and entitle us to receive interest at a variable rate equal to three-month LIBOR, which is equal to the benchmark rate for the Term A Loans being hedged, on the notional amount. The 2008 interest rate swaps expire in October 2011 and December 2013. During the third quarter 2010 we entered into six additional interest rate swap agreements with Fresenius for an aggregate principal amount of $600 million, the “2010 interest rate swaps”. These swap agreements require us to pay interest at an average fixed rate of 2.16% and entitle us to receive interest at a variable rate equal to three-month LIBOR, subject to a minimum LIBOR, which is equal to the benchmark rate for the Term C Loan being hedged, on the notional amount. The 2010 interest rate swaps expire on September 10, 2014. All interest rate swaps have been designated as hedges of our exposure to fluctuations in interest payments on outstanding variable rate borrowings due to changes in interest rates (a cash flow hedge).
The fair value of these interest rate swap agreements at September 30, 2010 and December 31, 2009 was a liability of $80.3 million and $53.2 million, respectively, and is included in long-term liabilities in our condensed consolidated balance sheets. As noted above, the Company entered into derivative contracts with its Parent, who pushed down the interest rate swap agreements to the Company. From inception of the agreements to the time the 2008 interest rate swaps were transferred to the Company, the Parent recognized $15.9 million in losses in other comprehensive income (loss). From the time the 2008 interest rate swap agreements were transferred to the Company through September 30, 2010, we recorded a deferred loss of $39.0 million, net of tax benefit of $25.4 million, in other comprehensive income (loss) and recognized $0.7 million, in intercompany interest expense, which represented the amount of hedge ineffectiveness.
11
Table of Contents
FRESENIUS KABI PHARMACEUTICALS HOLDING, INC.
NOTES TO CONDENSED CONSOLIDATED FINANCIAL STATEMENTS—(Continued)
September 30, 2010
(Unaudited)
The fair value amounts in our condensed consolidated balance sheet at September 30, 2010 and December 31, 2009, related to foreign currency forward and interest rate swap contracts were as follows:
| Asset Derivatives |
Liability Derivatives |
|||||||||||
| September 30, 2010 (In millions) |
Balance Sheet Location |
Fair Value |
Balance Sheet Location |
Fair Value |
||||||||
| Derivatives designated as hedging instruments |
||||||||||||
| Foreign currency forward contracts-interest (current) |
Prepaid expense and other current assets | $ | 1.0 | Other accrued expenses | $ | 0.2 | ||||||
| Foreign currency forward contracts-interest (non-current) |
Other non-current assets, net | 0.3 | Other non-current liabilities | 0.2 | ||||||||
| Foreign currency forward contracts-inventory (current) |
Prepaid expense and other current assets | 2.7 | Other accrued expenses | — | ||||||||
| Interest rate swap contracts (non-current) |
Other non-current assets, net | — | Fair value of interest rate swaps with Parent and affiliates | 80.3 | ||||||||
| Total |
$ | 4.0 | $ | 80.7 | ||||||||
| Asset Derivatives |
Liability Derivatives |
|||||||||||
| (In millions) |
Balance Sheet Location |
Fair Value |
Balance Sheet Location |
Fair Value |
||||||||
| Derivatives not designated as hedging instruments |
||||||||||||
| Foreign currency forward contracts (current) |
Prepaid expense and other current assets | $ | 1.4 | Other accrued expenses | $ | 0.5 | ||||||
| Foreign currency forward contracts (non-current) |
Other non-current assets, net | 9.3 | Other non-current liabilities | — | ||||||||
| Total |
$ | 10.7 | $ | 0.5 | ||||||||
| Asset Derivatives |
Liability Derivatives |
|||||||||||
| December 31, 2009 (In millions) |
Balance Sheet Location |
Fair Value |
Balance Sheet Location |
Fair Value |
||||||||
| Derivatives designated as hedging instruments |
||||||||||||
| Foreign currency forward contracts-interest (current) |
Prepaid expense and other current assets | $ | 2.7 | Other accrued expenses | $ | — | ||||||
| Foreign currency forward contracts-interest (non-current) |
Other non-current assets, net | 2.3 | Other non-current liabilities | — | ||||||||
| Interest rate swap contracts (non-current) |
Other non-current assets, net | — | Fair value of interest rate swaps with Parent and affiliates | 53.2 | ||||||||
| Total |
$ | 5.0 | $ | 53.2 | ||||||||
| Asset Derivatives |
Liability Derivatives |
|||||||||||
| (In millions) |
Balance Sheet Location |
Fair Value |
Balance Sheet Location |
Fair Value |
||||||||
| Derivatives not designated as hedging instruments |
||||||||||||
| Foreign currency forward contracts (current) |
Prepaid expense and other current assets | $ | 8.6 | Other accrued expenses | $ | — | ||||||
| Foreign currency forward contracts (non-current) |
Other non-current assets, net | 25.6 | Other non-current liabilities | — | ||||||||
| Total |
$ | 34.2 | $ | — | ||||||||
12
Table of Contents
FRESENIUS KABI PHARMACEUTICALS HOLDING, INC.
NOTES TO CONDENSED CONSOLIDATED FINANCIAL STATEMENTS—(Continued)
September 30, 2010
(Unaudited)
The pretax derivative gains and losses in our condensed consolidated statements of operations for the three months ended September 30, 2010 and 2009, related to our foreign currency forward and interest rate swap contracts were as follows:
September 30, 2010
| Derivatives in Cash Flow Hedging Relationships |
Gain (Loss) Recognized in Other Comprehensive Income on Effective Portion of Derivative |
Gain (Loss) on Effective Portion of Derivative Reclassified from Accumulated Other Comprehensive Income |
Ineffective Portion of Gain (Loss) on Derivative and Amount Excluded from Effectiveness Testing Recognized in Income |
|||||||||||||||||
| (In millions) |
Amount | Location | Amount | Location | Amount | |||||||||||||||
| Foreign currency forward contracts |
$ | 6.4 | |
Interest income and other, net |
|
$ | 0.3 | |
Interest income and other, net |
|
$ | — | ||||||||
| Interest rate swap contracts |
(12.5 | ) | |
Interest income and other, net |
|
— | |
Intercompany interest expense |
|
0.4 | ||||||||||
| Total |
$ | (6.1 | ) | $ | 0.3 | $ | 0.4 | |||||||||||||
| Derivatives Not Designated as Hedging Instruments |
Location of Gain (Loss) Recognized in Income on Derivative |
Gain (Loss) Recognized in Income on Derivative |
||||
| Foreign currency forward contracts |
Interest income and other, net |
$ | 39.4 | |||
September 30, 2009
| Derivatives in Cash Flow Hedging Relationships |
Gain (Loss) Recognized in Other Comprehensive Income on Effective Portion of Derivative |
Gain (Loss) on Effective Portion of Derivative Reclassified from Accumulated Other Comprehensive Income |
Ineffective Portion of Gain (Loss) on Derivative and Amount Excluded from Effectiveness Testing Recognized in Income |
|||||||||||||||||
| (In millions) |
Amount | Location | Amount | Location | Amount | |||||||||||||||
| Foreign currency forward contracts |
$ | 1.1 | |
Interest income and other, net |
|
$ | — | |
Interest income and other, net |
|
$ | — | ||||||||
| Interest rate swap contracts |
(8.2 | ) | |
Interest income and other, net |
|
— | |
Intercompany interest expense |
|
(0.7 | ) | |||||||||
| Total |
$ | (7.1 | ) | $ | — | $ | (0.7 | ) | ||||||||||||
| Derivatives Not Designated as Hedging Instruments |
Location of Gain (Loss) Recognized in Income on Derivative |
Gain (Loss) Recognized in Income on Derivative |
||||
| Foreign currency forward contracts |
Interest income and other, net |
$ | 15.3 | |||
13
Table of Contents
FRESENIUS KABI PHARMACEUTICALS HOLDING, INC.
NOTES TO CONDENSED CONSOLIDATED FINANCIAL STATEMENTS—(Continued)
September 30, 2010
(Unaudited)
The pretax derivative gains and losses in our condensed consolidated statements of operations for the nine months ended September 30, 2010 and 2009, related to our foreign currency forward and interest rate swap contracts were as follows:
September 30, 2010
| Derivatives in Cash Flow Hedging Relationships |
Gain (Loss) Recognized in Other Comprehensive Income on Effective Portion of Derivative |
Gain (Loss) on Effective Portion of Derivative Reclassified from Accumulated Other Comprehensive Income |
Ineffective Portion of Gain (Loss) on Derivative and Amount Excluded from Effectiveness Testing Recognized in Income |
|||||||||||||||||
| (In millions) |
Amount | Location | Amount | Location | Amount | |||||||||||||||
| Foreign currency forward contracts |
$ | (1.6 | ) | |
Interest income and other, net |
|
$ | 0.3 | |
Interest income and other, net |
|
$ | — | |||||||
| Interest rate swap contracts |
(27.3 | ) | |
Interest income and other, net |
|
— | |
Intercompany interest expense |
|
0.3 | ||||||||||
| Total |
$ | (28.9 | ) | $ | 0.3 | $ | 0.3 | |||||||||||||
| Derivatives Not Designated as Hedging Instruments |
Location of Gain (Loss) Recognized in Income on Derivative |
Gain (Loss) Recognized in Income on Derivative |
||||
| Foreign currency forward contracts |
Interest income and other, net |
$ | (24.1 | ) | ||
September 30, 2009
| Derivatives in Cash Flow Hedging Relationships |
Gain (Loss) Recognized in Other Comprehensive Income on Effective Portion of Derivative |
Gain (Loss) on Effective Portion of Derivative Reclassified from Accumulated Other Comprehensive Income |
Ineffective Portion of Gain (Loss) on Derivative and Amount Excluded from Effectiveness Testing Recognized in Income |
|||||||||||||||||
| (In millions) |
Amount | Location | Amount | Location | Amount | |||||||||||||||
| Foreign currency forward contracts-interest |
$ | 6.3 | |
Interest income and other, net |
|
$ | — | |
Interest income and other, net |
|
$ | — | ||||||||
| Interest rate swap contracts |
9.2 | |
Interest income and other, net |
|
— | |
Intercompany interest expense |
|
(0.8 | ) | ||||||||||
| Total |
$ | 15.5 | $ | — | $ | (0.8 | ) | |||||||||||||
| Derivatives Not Designated as Hedging Instruments |
Location of Gain (Loss) Recognized in Income on Derivative |
Gain (Loss) Recognized in Income on Derivative |
||||
| Foreign currency forward contracts |
Interest income and other, net |
$ | 37.8 | |||
14
Table of Contents
FRESENIUS KABI PHARMACEUTICALS HOLDING, INC.
NOTES TO CONDENSED CONSOLIDATED FINANCIAL STATEMENTS—(Continued)
September 30, 2010
(Unaudited)
(7) Fair Value Measurements
Accounting guidance on fair value measurements sets a fair value hierarchy that prioritizes the inputs to valuation techniques used to measure fair value for certain financial assets and liabilities. The basis of the fair value measurement is categorized in three levels, in order of priority, as described below:
| Level 1: | Unadjusted quoted prices in active markets that are accessible at the measurement date for identical, unrestricted assets or liabilities. | |
| Level 2: | Quoted prices in markets that are not active, or financial instruments for which all significant inputs are observable either directly or indirectly. | |
| Level 3: | Prices or valuation techniques that require inputs that are both significant to the fair value measurement and unobservable, thus reflecting assumptions about the market participants. | |
In valuing assets and liabilities, we are required to maximize the use of quoted market prices and minimize the use of unobservable inputs. We calculated the fair value of our Level 1 and Level 2 instruments based on the exchange traded price of similar or identical instruments where available or based on other observable instruments. The Company has not changed its valuation techniques in measuring the fair value of any financial assets and liabilities during the period.
The following table sets forth the Company’s financial assets and liabilities as of September 30, 2010 that are measured at fair value on a recurring basis, segregated by level within the fair value hierarchy:
| Balance at September 30, 2010 |
Basis of Fair Value Measurement (in thousands) | |||||||||||||||
| Quoted Prices in Active Markets for Identical Items (Level 1) |
Significant Other Observable Inputs (Level 2) |
Significant Unobservable Inputs (Level 3) |
||||||||||||||
| Assets – fair value of foreign currency swaps |
$ | 14,768 | $ | — | $ | 14,768 | $ | — | ||||||||
| Liabilities: |
||||||||||||||||
| Contingent value rights |
$ | 5,714 | $ | 5,714 | — | — | ||||||||||
| Fair value of interest rate swaps |
80,252 | — | 80,252 | — | ||||||||||||
| Fair value of foreign currency swaps |
893 | — | 893 | — | ||||||||||||
| Total liabilities |
$ | 86,859 | $ | 5,714 | $ | 81,145 | $ | — | ||||||||
(8) Related Party Transactions
Related party balances and transactions for the periods ended September 30, 2010 and 2009 pertain to balances and transactions with Fresenius and its direct and indirectly owned subsidiaries. Below is a discussion of these transactions.
Transactions with Fresenius
In connection with the Merger and associated financing transactions, FKP Holdings and its subsidiaries entered into a number of intercompany loan agreements with subsidiaries of Fresenius, the Company’s parent, as described in Note 5 to the condensed consolidated financial statements—Long-Term Debt and Credit Facility. At September 30, 2010 and December 31, 2009, the principal amount outstanding under these loans was $2,993.3 million and $3,033.2 million, respectively. Interest expense recognized on these intercompany loans for the three and nine months ended September 30, 2010 was $53.0 million and $163.4 million, respectively. Interest expense recognized on these intercompany loans for the three and nine months ended September 30, 2009 was $53.7 million and $191.0 million, respectively. Accrued interest of $25.0 million and $47.1 million was due on these intercompany loans at September 30, 2010 and December 31, 2009, respectively. As described in Note 5 to the condensed consolidated financial statements—Long-Term Debt and Credit Facility, in the period ended March 31, 2010 the Company paid $12.2 million in issuance costs related to the exchange of Term Loan B for Term Loan C and $1.5 million was pushed down and included in current payables to related parties.
The Company has recorded payables related to inventory purchases from Fresenius subsidiaries of $7.9 million as of September 30, 2010. Inventory purchased from Fresenius subsidiaries included in current payables to related parties as of December 31, 2009 was $9.9 million. Related intercompany charges included in cost of good sold for the three and nine months ended September 30, 2010 was $17.3 million and $62.2 million and for the same period ended September 30, 2009 was $4.9 million and $17.0 million, respectively.
15
Table of Contents
FRESENIUS KABI PHARMACEUTICALS HOLDING, INC.
NOTES TO CONDENSED CONSOLIDATED FINANCIAL STATEMENTS—(Continued)
September 30, 2010
(Unaudited)
(9) Goodwill and Other Intangibles
As of September 30, 2010 and December 31, 2009, goodwill had a carrying value of $3,662.2 and $3,664.4 million, respectively. The decrease in carrying value is due to the recognition in the current year of the tax effects of certain charges made to goodwill during the purchase price allocation period. All of our intangible assets, other than goodwill, are subject to amortization. The following table reflects the components of identifiable intangible assets, all of which have finite lives, as of September 30, 2010 and December 31, 2009:
| September 30, 2010 | December 31, 2009 | Category Amortization Period |
||||||||||||||||||
| Gross Carrying Amount |
Accumulated Amortization |
Gross Carrying Amount |
Accumulated Amortization |
|||||||||||||||||
| (in thousands) | (in thousands) | |||||||||||||||||||
| Developed product technology |
$ | 489,000 | $ | 50,265 | $ | 489,000 | $ | 31,928 | 20 years | |||||||||||
| Product rights |
2,400 | 125 | 2,300 | 87 | 10 years | |||||||||||||||
| Patents |
6,847 | 1,547 | 6,847 | 553 | 5 years | |||||||||||||||
| Contracts and other |
43,500 | 17,759 | 45,500 | 11,641 | 5 years | |||||||||||||||
| Customer relationships |
12,000 | 8,223 | 12,000 | 5,223 | 3 years | |||||||||||||||
| Total |
$ | 553,747 | $ | 77,919 | $ | 555,647 | $ | 49,432 | ||||||||||||
We amortize all of our identifiable intangible assets with finite lives over their expected period of benefit using the straight-line method. In determining the appropriate amortization period and method for developed product technology, we considered, among other things, the nature of the products, the anticipated timing of cash flows and the relatively high barriers to entry for competition due to the complex development and manufacturing processes. In addition, the products all share similar attributes in that they have a favorable risk profile (e.g., minimal side effects, adverse experiences, etc.) and are easy to administer to patients. Based on the risk profile and ease of use of the related products, we do not expect that new competing products will enter the market in the foreseeable future, and that the barriers to entry will help to protect the market positions of the products and preserve their useful lives. We have manufactured and sold many of our products for more than 20 years. Accordingly, as future cash flows with respect to these and our other products are expected to exceed 20 years, we have utilized the straight-line amortization method and a 20-year expected period of benefit. However, we cannot predict with certainty whether new competing products will enter the market, the timing of such competition or the Company’s ability to protect the market positions of its products and preserve their useful lives. In the event that we experience stronger or more rapid competition or other conditions that change the market positions of our products, we may need to accelerate the amortization of our developed product technology intangibles or recognize an impairment charge.
The Company follows the policy of capitalizing patent defense costs when it determines that such costs are recoverable from future product sales and a successful defense is probable. These costs are amortized over the remaining useful life of the patent. Patent defense costs are expensed as incurred until the criteria for capitalization are met; previously capitalized costs are written-off when it is determined that the likelihood of success is no longer considered probable. During the year ended December 31, 2009 the Company capitalized $6.8 million in legal costs related to the defense of its patents.
During the nine months ended September 30, 2010 the Company recognized $1.4 million of impairment in contracts and other intangible assets related to the inability to obtain FDA approval for certain products. For the nine months ended September 30, 2009 there was no impairment related to intangible assets.
Amortization expense on intangible assets attributable to operations for the three and nine months ended September 30, 2010 and 2009 was $9.6 million and $29.1 million, respectively. Amortization expense on intangible assets for the three and nine months ended September 30, 2009 was $9.4 million and $27.7 million, respectively. At September 30, 2010, the weighted average expected lives of intangibles was approximately 18.8 years. Total estimated amortization expense for our finite-lived intangible assets for the next five years is as follows:
| Estimated Amortization |
||||
| (in thousands) | ||||
| 2010 (3 months from 9/30/10 to 12/31/10) |
$ | 9,629 | ||
| 2011 |
37,294 | |||
| 2012 |
34,517 | |||
| 2013 |
32,009 | |||
| 2014 |
25,494 | |||
| 2015 |
24,500 | |||
| 2016 (9 months ending 9/30/16) |
18,363 | |||
16
Table of Contents
FRESENIUS KABI PHARMACEUTICALS HOLDING, INC.
NOTES TO CONDENSED CONSOLIDATED FINANCIAL STATEMENTS—(Continued)
September 30, 2010
(Unaudited)
(10) Accrued Liabilities
Accrued liabilities consisted of the following at September 30, 2010 and December 31, 2009:
| September 30, 2010 |
December 31, 2009 |
|||||||
| (in thousands) | ||||||||
| Sales and marketing |
$ | 35,515 | $ | 28,099 | ||||
| Payroll and employee benefits |
18,296 | 17,935 | ||||||
| Legal and insurance |
8,314 | 2,252 | ||||||
| Accrued interest |
7,173 | 7,600 | ||||||
| Other |
1,733 | 1,434 | ||||||
| $ | 71,031 | $ | 57,320 | |||||
(11) Income Taxes
As of September 30, 2010, the total amount of gross unrecognized tax benefits, which are reported in other non-current liabilities in our unaudited condensed consolidated balance sheet, was $17.5 million. This entire amount would impact net income if recognized. In addition, we accrue interest and any necessary penalties related to unrecognized tax positions in our provision for income taxes. For the period ended September 30, 2010 and December 31, 2009, $0.4 million and $0.4 million of such interest was accrued, respectively.
A reconciliation of the beginning and ending gross unrecognized tax benefits is as follows:
| Amount | ||||
| (thousands) | ||||
| Balance at December 31, 2009 |
$ | 17,156 | ||
| Increase related to prior year tax positions |
376 | |||
| Settlements |
(79 | ) | ||
| Balance at September 30, 2010 |
$ | 17,453 | ||
For 2009, the Company reported a taxable loss due primarily to tax deductions related to interest expense and the closure of the Puerto Rico manufacturing facility. At year end 2009, the Company initially concluded that it would be able to file a carry back claim and recover approximately $36.7 million in taxes paid by APP in 2007. After further review, the Company concluded that the loss was not entirely eligible for carry back under the tax regulations, but instead may be carried forward and used to reduce taxes payable in future periods through 2029. Accordingly, in the accompanying condensed consolidated balance sheet as of September 30, 2010, the Company has reclassified the $32.4 million income tax receivable amount reported at December 31, 2009 to deferred income taxes. Deferred tax assets are recognized if, in management’s judgment, it is more likely than not such assets will be realized.
Through the date of the Merger, APP and its subsidiaries filed income tax returns in the U.S. Federal jurisdiction, Canada, Puerto Rico, and various state jurisdictions. On April 21, 2010, the Company received the Revenue Agent’s Report relating to the U.S. Federal income tax examination of tax years 2006 and 2007. We included $0.6 million of tax expense and $0.5 million of related interest in income tax expense in the nine months ended September 30, 2010 related to this examination. Tax years 2008 and 2009 are open for possible examination. APP is also currently under state income tax examinations in California, Illinois and North Carolina for various tax years. Although not currently under examination or audit, APP’s Canadian income tax returns for the 2006 through 2009 tax years, its Puerto Rico income tax returns for the 2006 through 2009 tax years, and its state income tax returns for the 2004 through 2008 tax years remain open for possible examination by the appropriate governmental agencies. There are no other open federal, state, or foreign government income tax audits at this time.
On September 10, 2008, the date of the Merger, a wholly-owned subsidiary of FKP Holdings merged with and into APP pursuant to and by the Agreement and Plan of Merger dated July 6, 2008. Accordingly, FKP Holdings became the parent company of APP and its subsidiaries. For periods beginning January 1, 2009, APP and its subsidiaries are included in the consolidated US Federal income tax return of FKP Holdings.
17
Table of Contents
FRESENIUS KABI PHARMACEUTICALS HOLDING, INC.
NOTES TO CONDENSED CONSOLIDATED FINANCIAL STATEMENTS—(Continued)
September 30, 2010
(Unaudited)
(12) Other Comprehensive Income (Loss)
Elements of other comprehensive income (loss), net of income taxes, were as follows:
| Three Months Ended September 30, | ||||||||
| 2010 | 2009 | |||||||
| (in thousands) | ||||||||
| Foreign currency translation adjustments |
$ | 827 | $ | 2,496 | ||||
| Change in fair value of interest rate swaps, net of tax |
(5,908 | ) | (5,048 | ) | ||||
| Change in the fair value of foreign currency forward contracts, net of tax |
3,772 | 699 | ||||||
| Other comprehensive loss |
(1,309 | ) | (1,853 | ) | ||||
| Net income (loss) |
52,128 | (61,226 | ) | |||||
| Comprehensive income (loss) |
$ | 50,819 | $ | (63,079 | ) | |||
| Nine Months Ended September 30, | ||||||||
| 2010 | 2009 | |||||||
| (in thousands) | ||||||||
| Foreign currency translation adjustments |
$ | 791 | $ | 4,378 | ||||
| Change in fair value of interest rate swaps, net of tax |
(16,753 | ) | 5,653 | |||||
| Change in the fair value of foreign currency forward contracts, net of tax |
(1,465 | ) | 3,847 | |||||
| Other comprehensive income (loss) |
(17,427 | ) | 13,878 | |||||
| Net income (loss) |
83,213 | (76,023 | ) | |||||
| Comprehensive income |
$ | 65,786 | $ | (62,145 | ) | |||
At September 30, 2010 and 2009, we had a cumulative loss from the change in the fair value of our interest rate swaps, net of tax, of $39.0 million and $26.7 million, respectively. The cumulative change in foreign currency swaps, net of tax, was a loss of $1.6 million and a gain of $3.8 million as of September 30, 2010 and 2009, respectively. The cumulative foreign currency translation adjustment was a gain of $1.5 million as of September 30, 2010 and a loss of $0.1 million as of September 30, 2009.
(13) Contingencies
We are from time to time subject to claims and litigation arising in the ordinary course of business. These claims have included assertions that our products infringe existing patents as well as allegations of product liability. We believe we have substantial defenses in these matters, however litigation is inherently unpredictable. Consequently any adverse judgment or settlement could have a material adverse effect on our results of operations, cash flows or financial condition for a particular period. We record accruals for such contingencies to the extent that we conclude a loss is probable and the amount can be reasonably estimated. We also record receivables for probable and estimable insurance recoveries from third party insurers.
Summarized below are the more significant pending legal matters pending to which we are a party:
Patent Litigation
Pemetrexed Disodium
We have filed an abbreviated new drug application, or “ANDA”, seeking approval from the FDA to market pemetrexed disodium for injection, 500 mg/vial. The Reference Listed Drug for APP’s ANDA is Alimta®, a chemotherapy agent for the treatment of various types of cancer marketed by Eli Lilly. Eli Lilly is believed to be the exclusive licensee of certain patent rights from Princeton University. We notified Eli Lilly and Princeton University of our ANDA filing pursuant to the provisions of the Hatch-Waxman Act and, in June 2008, Eli Lilly and Princeton University filed a patent infringement action in the U.S. District Court for the District of Delaware seeking to prevent us from marketing this product until after the expiration of U.S. Patent 5,344,932, which is alleged to expire in 2016. We filed our Answer and Counterclaims in August 2008 and a seven day bench trial is scheduled to begin on November 8, 2010.
Naropin ®
In March 2007 we filed a complaint for patent infringement against Navinta LLC in the U.S District Court for the District of New Jersey. Navinta filed an ANDA seeking approval from the FDA to market ropivacaine hydrochloride injection, in the 2 mg/ml, 5 mg/ml and 10 mg/ml dosage forms. The Reference Listed Drug for Navinta’s ANDA is APP’s proprietary product Naropin®. This matter proceeded to trial on July 20, 2009. The U.S. District Court, District of New Jersey reached a judgment in favor of the Company on August 3, 2009, determining that Navinta’s ANDA product infringed on the Company’s proprietary product Naropin. The judgment has been appealed by Navinta.
18
Table of Contents
FRESENIUS KABI PHARMACEUTICALS HOLDING, INC.
NOTES TO CONDENSED CONSOLIDATED FINANCIAL STATEMENTS—(Continued)
September 30, 2010
(Unaudited)
On July 22, 2010, APP filed a second action against Navinta/Sandoz, Hospira and Sagent/Strides in the same court alleging that defendants had filed separate ANDA applications for generic Naropin infringing patent-in-suit from the prior litigation. On August 30, 2010, Navinta/Sandoz and Hospira filed Motions to Dismiss. On September 28, 2010, APP filed its opposition to the Navinta/Sandoz Motion to Dismiss.
We have filed a lawsuit against Ameridose, LLC in the United States District Court, District of New Jersey alleging infringement of our ‘086, ‘525 and ‘489 patents related to Naropin. The complaint, filed on August 10, 2010 and served on August 13, 2010 seeks injunctive relief and treble damages due to the willfull and deliberate nature of the infringement. Ameridose filed its Notice of Appearance on September 2, 2010 and its Answer and Counter-claims on September 24, 2010.
Bivalirudin
We have filed an ANDA seeking approval from the FDA to market generic bivalirudin, 250 mg/vial for intravenous injection. The reference listed drug for APP’s ANDA is Angiomax, for use as an anticoagulant in patients with unstable angina and currently marketed by The Medicines Co. The Medicines Co. is believed to be the exclusive assignee of certain patent rights from Gopal Krishna and Gary Musso. The patent, alleged to be generally directed to bivalirudin compositions, was issued on September 1, 2009. APP notified The Medicines Co. of our ANDA filing pursuant to the provisions of the Hatch-Waxman Act, and on October 8, 2009, The Medicines Co. filed a patent infringement action in the United States District Court for the District of Delaware seeking to prevent APP from marketing this product until after the patent’s expiration. We filed our Answer and Counterclaims on December 9, 2009. The Medicines Co. filed its response on December 28, 2009.
On March 23, 2010, the Judge ordered that this case be consolidated with four other infringement actions against Teva/Pliva Hrvatska for pre-trial purposes. On March 24, 2010, an interim protective order and scheduling order was approved by the Judge. On April 26, 2010, APP filed another ANDA related to Bivalirudin. The Medicines Co. filed its infringement suit on June 1, 2010, and APP filed its Answer and Counter-claims on June 28, 2010. The Parties have agreed to consolidate these actions.
Discovery is currently underway. All factual discovery is to be completed by March 11, 2011.
On August 3, 2010, in a related action in the United States District Court, Eastern District of Virginia, The Medicines Co. was granted summary judgment against the United States Government in its quest to vacate a prior ruling of the Patent and Trademark Office denying a patent term extension for its ‘404 bivalirudin patent. The Court applied a business day rather than calendar day construction to the term extension deadline. On August 19, 2010, APP filed a Motion to Intervene, which was denied on September 13, 2010. On September 17, 2010, APP filed a Notice of Appeal with the United States Court of Appeals for the Federal Circuit on both the patent term extension ruling and the Motion to Intervene. On October 5, 2010, The Medicines Co. filed a Motion to Dismiss the Appeal, which is pending.
Gemcitabine
We have filed an ANDA seeking approval from the FDA to market gemcitabine for injection, 200 mg base/vial, 1 g base/vial and 2 g base/vial. The reference listed drug for APP’s ANDA is Gemzar, for use as a treatment for non-small lung cancer, pancreatic cancer, breast cancer and ovarian cancer. Eli Lilly is the holder of the New Drug Application for Gemzar and is believed to be the owner of the patent rights, which are set to expire on November 7, 2012, followed by a six month period of pediatric market exclusivity ending on May 7, 2013. APP notified Eli Lilly of our ANDA filing pursuant to the provisions of the Hatch-Waxman Act on November 4, 2009. On December 16, 2009, Eli Lilly filed a patent infringement action in the United States District Court in the Southern District of Indiana seeking to prevent APP from marketing this product until after the patent’s expiration. APP was served on January 7, 2010 and filed a Motion to Dismiss on March 19, 2010, basing its motion on the adjudicated invalidity of the patent in another action. The Motion to Dismiss is still pending. On June 3, 2010, the Judge issued a Case Management Order, and trial is scheduled for January 2012.
On July 29, 2010, the Court of Appeals for the Federal Circuit affirmed the District Court’s opinion of invalidity in the other action. APP subsequently filed notice of this decision in support of its Motion to Dismiss.
Product Liability Matters
Sensorcaine
We have been named as a defendant in numerous personal injury/product liability actions brought against us and other pharmaceutical companies and medical device manufacturers by plaintiffs claiming that they suffered injuries resulting from the post-surgical release of certain local anesthetics into the shoulder joint via a pain pump. We acquired several generic anesthetic products from AstraZeneca in June 2006. Pursuant to the Asset Purchase Agreement with AstraZeneca, we are responsible for indemnifying Astra Zeneca for defense of suits alleging injuries occurring after the acquisition date (unless the drugs are determined to be defective in manufacturing, in which case AstraZeneca will indemnify us pursuant to that certain Manufacturing and Supply Agreement entered
19
Table of Contents
FRESENIUS KABI PHARMACEUTICALS HOLDING, INC.
NOTES TO CONDENSED CONSOLIDATED FINANCIAL STATEMENTS—(Continued)
September 30, 2010
(Unaudited)
into by us and AstraZeneca). Likewise Astra Zeneca agreed to indemnify us for suits alleging injuries occurring prior to the acquisition date. We maintain product liability insurance for these matters. All of our local anesthetic products are approved by the FDA and continue to be marketed and sold to customers. Since December 2009, more than 100 cases naming APP or New Abraxis have been dismissed due to lack of product identification or failure to plead with sufficient specificity to withstand a Motion to Dismiss.
In March 2010, a renewed motion by Plaintiffs to create a Multi-District Litigation (“MDL”) in the United States District Court of Minnesota was denied. Currently, there are nine cases naming APP as a defendant, and six of those involve an alleged event occuring after the June 2006 product acquisition date.
Aredia and Zometa
We have been named as a defendant in approximately 14 personal injury/product liability cases brought against us and other manufacturers by plaintiffs claiming that they suffered injuries resulting from the use of pamidronate (the generic equivalent of Aredia®) prescribed for the management of metastic bone disease. Plaintiffs’ allege Aredia causes osteonecrosis to the jaw.
Ten cases naming APP have been transferred to an MDL in the Eastern District of New York. After little progress in determining product identification, the Judge ordered the Plaintiffs to amend their complaints to reflect sufficient product identification by August 20, 2010. At a status conference in September 2010, the Judge granted an extension to the plaintiffs to file a product identification report to October 20, 2010. One additional case naming APP and other defendants is comprised of 159 plaintiffs and was filed on April 26, 2010 in the Eastern District of New York and is pending transfer to the MDL.
There are currently two remaining cases filed against the Company in a coordinated proceeding in the Superior Court of New Jersey, Middlesex County. A final product identification report by plaintiffs was due on July 23, 2010, but was also extended.
Heparin
We have been named as a defendant in nine personal injury/product liability cases brought against us and other manufacturers claiming that the plaintiffs suffered side effects from heparin-induced thrombocytopenia (“HIT”). The cases were filed in state and federal courts in New Jersey, Pennsylvania, West Virginia and Illinois. Product identification discovery is underway in all six cases. APP has also been improperly named as a discovery respondent in a contamination case.
In re Reglan/Metaclopraminde
APP has been named along with numerous other defendants in 38 short form complaints alleging Extrapyramidial Symptoms (EPS) and Involuntary Movement Disorder for ingestion of Reglan. APP’s predecessor in interest, Fujisawa, ceased manufacturing and distribution of this product in 1994, which pre-dates the formation of the Company. APP is actively seeking dismissal of all these cases.
Regulatory Matters
We are subject to regulatory oversight by the FDA and other regulatory authorities with respect to the development and manufacture of our products. Failure to comply with regulatory requirements can have a significant effect on our business and operations. Management has designed and operates a system of controls to attempt to ensure compliance with applicable regulatory requirements.
(14) Revenue by Product Line
Total revenues by product line were as follows (in thousands):
| Three Months Ended September 30, |
Nine Months Ended September 30, |
|||||||||||||||
| 2010 | 2009* | 2010 | 2009* | |||||||||||||
| (in thousands) | (in thousands) | |||||||||||||||
| Critical care |
$ | 216,575 | $ | 141,272 | $ | 549,639 | $ | 415,925 | ||||||||
| Anti-infective |
85,771 | 65,712 | 206,629 | 161,206 | ||||||||||||
| Oncology |
25,531 | 14,816 | 88,069 | 47,144 | ||||||||||||
| Contract manufacturing and other |
3,444 | 2,854 | 8,411 | 7,911 | ||||||||||||
| Total net revenue |
$ | 331,321 | $ | 224,654 | $ | 852,748 | $ | 632,186 | ||||||||
| * | Reclassified to conform with presentation adopted in 2010. |
20
Table of Contents
| ITEM 2. | MANAGEMENT’S DISCUSSION AND ANALYSIS OF FINANCIAL CONDITION AND RESULTS OF OPERATIONS |
Note Regarding Forward-Looking Statements
This Quarterly Report on Form 10-Q and other documents we file with the Securities and Exchange Commission contain forward-looking statements, as the term is defined in the Private Securities Litigation Reform Act of 1995. In addition, we may make forward-looking statements in press releases or written statements, or in our communications and discussions with investors and analysts in the normal course of business through meetings, webcasts, phone calls and conference calls. Such forward-looking statements, whether expressed or implied, are subject to risks and uncertainties which could cause our actual results and those of our consolidated subsidiaries to differ materially from those implied by such forward-looking statements, due to a number of factors, many of which are beyond our control, which include, but are not limited to:
| • | the market adoption of and demand for our existing and new pharmaceutical products; |
| • | our ability to maintain and/or improve sales and earnings performance; |
| • | the ability to successfully manufacture products in an efficient, time-sensitive and cost effective manner; |
| • | our ability to service our debt; |
| • | the impact on our products and revenues of patents and other proprietary rights licensed or owned by us, our competitors and other third parties; |
| • | our ability, and that of our suppliers, to comply with laws, regulations and standards, and the application and interpretation of those laws, regulations and standards, that govern or affect the pharmaceutical industry, the non-compliance with which may delay or prevent the sale of our products; |
| • | the difficulty in predicting the timing or outcome of product development efforts and regulatory approvals; |
| • | the availability and price of acceptable raw materials and components from third-party suppliers; |
| • | evolution of the fee-for-service arrangements being adopted by our major wholesale customers; |
| • | risks inherent in divestitures and spin-offs, including business risks, legal risks and risks associated with the tax and accounting treatment of such transactions; |
| • | inventory reductions or fluctuations in buying patterns by wholesalers or distributors; |
| • | the effect of the Merger on APP’s customer and supplier relationships, operating results and business generally; |
| • | risks that the Merger will disrupt APP’s current plans and operations, and the potential difficulties in retaining APP’s employees as a result of the Merger; |
| • | the outcome of any pending or future litigation and administrative claims; |
| • | the impact of recent legislative changes to the governmental reimbursement system; |
| • | potential restructurings of FKP Holdings and its subsidiaries (which include APP and its subsidiaries) which could affect its ability to generate Adjusted EBITDA; |
| • | the ability of FKP Holdings to generate Adjusted EBITDA sufficient to trigger a payment under the CVRs; |
| • | challenges of integration and restructuring associated with the Merger or other planned acquisitions and the challenges of achieving anticipated synergies; |
| • | the impact of any product liability, or other litigation to which the company is, or may become a party; and |
| • | the impact of healthcare reform in the U.S. and elsewhere. |
Forward-looking statements also include the assumptions underlying or relating to any of the foregoing or other such statements. When used in this report, the words “may,” “will,” “should,” “could,” “expect,” “plan,” “anticipate,” “believe,” “estimate,” “predict” and similar expressions are generally intended to identify forward-looking statements.
Readers are cautioned not to place undue reliance on these forward-looking statements, which reflect management’s opinions only as of the date hereof. We undertake no obligation to revise or publicly release the results of any revision to these forward-looking statements, whether as a result of new information, changes in assumptions, future events or otherwise. Readers should carefully review the factors described in “Risk Factors” included in the Company’s Annual Report on Form 10-K for the year ended December 31, 2009, and in “Item 1A: Risk Factors“ of Part II of this Form 10-Q and other documents we file from time to time with the Securities and Exchange Commission. Readers should understand that it is not possible to predict or identify all such factors. Consequently, readers should not consider any such list to be a complete set of all potential risks or uncertainties.
21
Table of Contents
OVERVIEW
The following management’s discussion and analysis of financial condition and results of operations, or MD&A, is intended to assist the reader in understanding our company. The MD&A is provided as a supplement to, and should be read in conjunction with the Company’s Annual Report on Form 10-K for the year ended December 31, 2009, including the information in “Item 1: Business“; “Item 1A: Risk Factors“, “Item 6: Selected Financial Data“; and “Item 8: Financial Statements and Supplementary Data.”
In March 2010, healthcare reform legislation was enacted in the U.S. This legislation contains several provisions that impact our business. Although many provisions of the new legislation do not take effect immediately, several provisions became effective in the first quarter of 2010. These include (1) an increase in the minimum Medicaid rebate to states participating in the Medicaid program from 15.1% to 23.1% on our branded prescription drugs, and from 11% to 13% on our generic prescription drugs; (2) the extension of the Medicaid rebate to Managed Care Organizations that dispense drugs to Medicaid beneficiaries; and (3) the expansion of the 340(B) Public Health Services drug pricing program, which provides outpatient drugs at reduced rates, to include additional hospitals, clinics, and healthcare centers. Through September 30, 2010, we do not believe that these effective provisions of the legislation have had a material impact on our business. However, there are significant unknowns surrounding the actual implementation of the provisions of the legislation, and it is currently not possible to determine what effect, if any, the implementation of the legislation will have on our business in the longer-term.
Beginning in 2011, the new law requires drug manufacturers to provide a 50% discount to Medicare beneficiaries whose prescription drug costs cause them to be subject to the Medicare Part D coverage gap (i.e., the “donut hole”). Also, beginning in 2011, we will be assessed our share of a new fee payable by all branded prescription drug manufacturers and importers. This fee will be calculated based upon each organization’s percentage share of total branded prescription drug sales to U.S. government programs (such as Medicare, Medicaid and VA and PHS discount programs) made during the previous year.
The manner in which this new legislation will be implemented is still being formulated. For example, the Health Resources and Services Administration (HRSA) is developing policy and implementation plans and building system capacity necessary to enroll new covered entities that are impacted by the new legislation. This will allow HRSA to begin working directly with new eligible entities and enrolling them in the 340(B) program. As a result, we do not yet know when and how discounts will be provided to the additional entities eligible to participate under the 340(B) program. In addition, the operation of the Medicare Part D coverage gap and the calculation and allocation of the annual fee on branded prescription drugs remains unclear, though, as noted above, these programs will not be effective until 2011.
Background
FKP Holdings including its operating subsidiary APP is an integrated pharmaceutical company that develops, manufactures and markets injectable pharmaceutical products. We believe that we are the only company with a primary focus on the injectable oncology, anti-infective and critical care markets, and we further believe that we offer one of the most comprehensive injectable product portfolios in the pharmaceutical industry. We manufacture products in each of the three basic forms in which injectable products are sold: liquid, powder and lyophilized, or freeze-dried.
Our products are generally used in hospitals, long-term care facilities, alternate care sites and clinics within North America. Unlike the retail pharmacy market for oral products, the injectable pharmaceuticals marketplace is largely made up of end users who have relationships with group purchasing organizations, or GPOs, and/or specialty distributors who distribute products within a particular end-user market, such as oncology clinics. GPOs and specialty distributors generally enter into collective product purchasing agreements with pharmaceutical suppliers in an effort to secure more favorable drug pricing on behalf of their members.
American Pharmaceutical Partners, Inc. (“Old APP”) began in 1996 with an initial focus on U.S. marketing and distribution of generic pharmaceutical products manufactured by others. In June 1998, Old APP acquired Fujisawa USA, Inc.’s generic injectable pharmaceutical business, including manufacturing facilities in Melrose Park, Illinois and Grand Island, New York and our research and development facility in Melrose Park, Illinois. Old APP also acquired additional assets in that transaction, including inventories, plant and equipment and abbreviated new drug applications that were approved by or pending with the FDA.
FKP Holdings is a Delaware company formed in connection with the Fresenius merger discussed below. APP is a Delaware corporation that was formed in 2007. Old APP was a Delaware corporation formed in 2001 and a California corporation formed in 1996. On April 18, 2006, Old APP completed a merger with American BioScience, Inc., or ABI, APP’s former parent. In connection with the closing of that merger, Old APP’s certificate of incorporation was amended to change its original name of American Pharmaceutical Partners, Inc. to Abraxis BioScience, Inc. which we refer to as “Old Abraxis.” Old Abraxis operated in two distinct business segments: Abraxis BioScience, representing the combined operations of Abraxis Oncology and Abraxis Research and Abraxis Pharmaceutical Products, representing the hospital-based operations.
22
Table of Contents
On November 13, 2007, Old Abraxis separated into two independent publicly-traded companies, New APP, which held the Abraxis Pharmaceutical Products business, focusing primarily on manufacturing and marketing our oncology, anti-infective and critical care hospital-based generic injectable products and marketing our proprietary anesthetic/analgesic products (which we refer to collectively as the “hospital-based business”), and Abraxis BioScience Inc. (“New Abraxis”) which held the Abraxis Oncology and Abraxis Research businesses (which we refer to as the “proprietary business”). New APP continued to operate the hospital-based business under the name APP Pharmaceuticals, Inc. New APP and New Abraxis entered into a series of agreements in connection with the separation, including a credit facility under which New APP borrowed $1 billion, a portion of which was paid to New Abraxis in connection with the separation, and a $150 million revolving credit facility.
On September 10, 2008, APP was acquired by FKP Holdings pursuant to an Agreement and Plan of Merger dated July 6, 2008 (the “Merger Agreement”). FKP Holdings is an indirect, wholly owned subsidiary of Fresenius. In connection with the Merger, FKP Holdings purchased all of the outstanding common stock of APP for $23.00 per share and issued contingent value rights (CVRs) to APP shareholders. The outstanding debt arranged in connection with the spin-off of New Abraxis was retired and approximately $3,856 million in new external and intercompany debt due to Fresenius and its affiliates was issued in connection with the acquisition.
RESULTS OF OPERATIONS
Three Months Ended September 30, 2010 and September 30, 2009
The following table sets forth the results of our operations for each of the three months ended September 30, 2010 and 2009, and forms the basis for the following discussion of our operating activities.
FRESENIUS KABI PHARMACEUTICALS HOLDING, INC.
CONSOLIDATED RESULTS OF OPERATIONS
(in thousands)
| Three months Ended September 30, 2010 |
Three months Ended September 30, 2009 |
Change Favorable (Unfavorable) |
||||||||||||||
| $ | % | |||||||||||||||
| Net revenue: |
||||||||||||||||
| Critical care |
$ | 216,575 | $ | 141,272 | $ | 75,303 | 53 | % | ||||||||
| Anti-infective |
85,771 | 65,712 | 20,059 | 31 | % | |||||||||||
| Oncology |
25,531 | 14,816 | 10,715 | 72 | % | |||||||||||
| Contract manufacturing and other |
3,444 | 2,854 | 590 | 21 | % | |||||||||||
| Total net revenue |
331,321 | 224,654 | 106,667 | 47 | % | |||||||||||
| Cost of sales |
145,047 | 116,770 | (28,277 | ) | -24 | % | ||||||||||
| Gross profit |
186,274 | 107,884 | 78,390 | 73 | % | |||||||||||
| Percent to total net revenue |
56.2 | % | 48.0 | % | ||||||||||||
| Research and development |
9,864 | 6,444 | (3,420 | ) | -53 | % | ||||||||||
| Selling, general and administrative |
31,401 | 18,514 | (12,887 | ) | -70 | % | ||||||||||
| Impairment of fixed assets |
2,938 | 5,372 | 2,434 | 45 | % | |||||||||||
| Amortization of merger-related intangibles |
9,163 | 9,163 | — | — | % | |||||||||||
| Total operating expenses |
53,366 | 39,493 | (13,873 | ) | -35 | % | ||||||||||
| Percent to total net revenue |
16.1 | % | 17.6 | % | ||||||||||||
| Income from operations |
132,908 | 68,391 | 64,517 | 94 | % | |||||||||||
| Percent to total net revenue |
40.1 | % | 30.4 | % | ||||||||||||
| Interest expense |
(15,498 | ) | (26,680 | ) | 11,182 | 42 | % | |||||||||
| Intercompany interest expense |
(52,977 | ) | (53,678 | ) | 701 | 1 | % | |||||||||
| Unrealized gain (loss) on change in fair value of contingent value rights |
15,509 | (50,608 | ) | 66,117 | 131 | % | ||||||||||
| Interest income and other, net |
(4,146 | ) | (893 | ) | (3,253 | ) | -364 | % | ||||||||
| Income before income taxes |
75,796 | (63,468 | ) | 139,264 | 219 | % | ||||||||||
| Income tax expense |
23,668 | (2,242 | ) | (25,910 | ) | -1156 | % | |||||||||
| Net income (loss) |
$ | 52,128 | $ | (61,226 | ) | $ | 113,354 | 185 | % | |||||||
23
Table of Contents
Net Revenue
Total net revenue for the three months ended September 30, 2010 increased $106.7 million, or 47.5%, to $331.3 million as compared to $224.6 million for the same quarter in 2009.
Net revenues for our critical care products for the three months ended September 30, 2010 increased to $216.6 million, an increase of $75.3 million, or 53.3%, over the prior year period, driven primarily by new product launches in the fourth quarter of 2009 and second quarter of 2010 along with increased sales due to competitor supply constraints related to certain of our products. Net revenue from anti-infective products for the three months ended September 30, 2010 increased by $20.1 million, or 30.5%, to $85.8 million from $65.7 million in the prior year period, due to a new product launch in the second quarter 2010 and increased sales due to competitor supply constraints related to certain of our products. Net revenue from oncology products for the three months ended September 30, 2010 increased $10.7 million, or 72.3%, to $25.5 million from $14.8 million in the prior year, driven primarily by new product launches in the fourth quarter of 2009 along with increased sales due to competitor supply constraints. Contract manufacturing revenue increased by $0.6 million to $3.4 million in the third quarter of 2010 as compared to $2.8 million for the same quarter in the prior year.
Gross Profit
Gross profit for the three months ended September 30, 2010 was $186.3 million, or 56.2% of total net revenue, as compared to $107.9 million, or 48.0% of total net revenue, in the same quarter of 2009. The increase in gross profit was principally due to increase in the proportion of list product sales relative to contract product sales as a result of competitor supply constraints.
Research and Development
Research and development expense for the three months ended September 30, 2010 increased $3.4 million, or 53.1%, to $9.8 million versus $6.4 million for the same quarter in 2009. The increase was due primarily to the timing of projects during the period.
Selling, General and Administrative
Selling, general and administrative expense for the three months ended September 30, 2010 increased $12.9 million to $31.4 million, or 9.5% of total net revenue, from $18.5 million, or 8.2% of total net revenue, for the same period in 2009. The increase in costs was mainly due an accrued settlement fee recorded during the current period related to a commercial contract and overall higher professional fees.
Impairment of Fixed Assets
Results for the three months ended September 30, 2010 included $2.9 million of expense related to the impairment of production equipment for discontinued products. Impairment charges of $5.4 million recorded in the same period in 2009 relate to the closure of the Puerto Rico manufacturing facility.
Interest Expense and Intercompany Interest Expense
Total interest on third party and intercompany debt for the three months ended September 30, 2010 decreased $11.8 million to $68.5 million for the three months ended September 30, 2010 from $80.3 million for the same period in 2009. Interest expense on third party debt decreased to $15.5 million for the three months ended September 30, 2010, compared to $26.7 million for the same period in 2009. The decrease in third party interest expense was primarily due to the lower interest rates following the replacement of Term Loan B with Term Loan C instruments in March 2010. Intercompany interest expense for the three months ended September 30, 2010 and 2009 were comparable at $53.0 million and $53.7 million respectively.
Other income, other non-operating items
Interest income and other income, net consists primarily of interest earned on invested cash and cash equivalents, the impact of foreign currency rate changes on intercompany trading and debt accounts denominated in Euros and Canadian dollars, as well as the related non-hedging derivative instruments, and other financing costs. Interest income and other income (expense), net was expense of $4.1 million for the three months ended September 30, 2010 compared to expense of $0.8 million for the same period in 2009.
Additionally, during the three months ended September 30, 2010 we recognized $15.5 million of income resulting from the change in fair value of the contingent value rights (CVRs) issued to APP shareholders in connection with the Merger. The estimated fair value of the CVRs at the date of the acquisition was included in the acquisition cost and is adjusted at each reporting date (marked-to-market) based on the closing price of a CVR as reported by NASDAQ, with the change in the fair value of the CVR for the reporting period being included in non-operating income.
24
Table of Contents
Provision for Income Taxes
For the three month period ended September 30, 2010, FKP Holdings reported income tax expense of $23.7 million on pretax income from operations of $75.8 million, or an effective tax rate of 31.2% compared to an income tax benefit of $2.2 million on a pretax loss of $63.5 million, or an effective tax rate of 3.5% for the same period in 2009. The 2010 and 2009 rates differ from the statutory U.S. federal tax rate of 35% due primarily to the tax cost of a hypothetical distribution of the profits of our foreign subsidiaries and additional tax and interest resulting from the U.S. Federal income tax examination offset by the non-taxable change in the fair value of the CVRs, as well as the effect of state and foreign income taxes.
Nine Months Ended September 30, 2010 and September 30, 2009
The following table sets forth the results of our operations for each of the nine months ended September 30, 2010 and 2009, and forms the basis for the following discussion of our operating activities:
FRESENIUS KABI PHARMACEUTICALS HOLDING, INC.
CONSOLIDATED RESULTS OF OPERATIONS
(in thousands)
| Nine months Ended September 30, 2010 |
Nine months Ended September 30, 2009 |
Change Favorable (Unfavorable) |
||||||||||||||||||
| $ | % | |||||||||||||||||||
| Net revenue: |
||||||||||||||||||||
| Critical care |
$ | 549,639 | $ | 415,925 | $ | 133,714 | 32 | % | ||||||||||||
| Anti-infective |
206,629 | 161,206 | 45,423 | 28 | % | |||||||||||||||
| Oncology |
88,069 | 47,144 | 40,925 | 87 | % | |||||||||||||||
| Contract manufacturing and other |
8,411 | 7,911 | 500 | 6 | % | |||||||||||||||
| Total net revenue |
852,748 | 632,186 | 220,562 | 35 | % | |||||||||||||||
| Cost of sales |
430,304 | 314,516 | (115,788 | ) | -37 | % | ||||||||||||||
| Gross profit |
422,444 | 317,670 | 104,774 | 33 | % | |||||||||||||||
| Percent to total net revenue |
49.5 | % | 50.2 | % | ||||||||||||||||
| Research and development |
21,062 | 20,822 | (240 | ) | -1 | % | ||||||||||||||
| Selling, general and administrative |
87,376 | 66,355 | (21,021 | ) | -32 | % | ||||||||||||||
| Impairment of fixed assets |
2,938 | 5,372 | 2,434 | 45 | % | |||||||||||||||
| Amortization of merger-related intangibles |
27,487 | 27,487 | — | 0 | % | |||||||||||||||
| Total operating expenses |
138,863 | 120,036 | (18,827 | ) | -16 | % | ||||||||||||||
| Percent to total net revenue |
16.3 | % | 19.0 | % | ||||||||||||||||
| Income from operations |
283,581 | 197,634 | 85,947 | 43 | % | |||||||||||||||
| Percent to total net revenue |
33.3 | % | 31.3 | % | ||||||||||||||||
| Interest expense |
(48,939 | ) | (61,166 | ) | 12,227 | 20 | % | |||||||||||||
| Intercompany interest expense |
(163,402 | ) | (191,029 | ) | 27,627 | 14 | % | |||||||||||||
| Unrealized gain (loss) on change in fair value of contingent value rights |
43,262 | (37,548 | ) | 80,810 | 215 | % | ||||||||||||||
| Interest income and other, net |
695 | 3,677 | (2,982 | ) | -81 | % | ||||||||||||||
| Income (loss) before income taxes |
115,197 | (88,432 | ) | 203,629 | 230 | % | ||||||||||||||
| Income tax expense (benefit) |
31,984 | (12,409 | ) | (44,393 | ) | -358 | % | |||||||||||||
| Net income (loss) |
$ | 83,213 | $ | (76,023 | ) | $ | 159,236 | 209 | % | |||||||||||
Net Revenue
Total net revenue for the nine months ended September 30, 2010 increased $220.5 million, or 34.9%, to $852.7 million as compared to $632.2 million for the same period in 2009.
Net revenue for our critical care products for the nine months ended September 30, 2010 increased to $549.6 million, an increase of $133.7 million, or 32.1%, over the prior year period, driven primarily by new product launches in the fourth quarter of 2009 and second quarter of 2010, along with increases in net sales due to competitor supply constraints for certain of our products. Net revenue from anti-infective products for the nine months ended September 30, 2010 increased by $45.4 million, or 28.2%, to $206.6 million from $161.2 million in the prior year period, due to a new product launch in the second quarter of 2010 and increases in net sales due to competitor supply constraints for certain of our products. Net revenue from oncology products for the nine months ended September 30, 2010 increased $40.9 million, or 86.8%, to $88.0 million from $47.1 million in the prior year, driven primarily by new product launches in the fourth quarter of 2009 along with increases in net sales due to competitor supply constraints for certain products and one time non-recurring product sales in the second quarter of 2010. Contract manufacturing revenue increased by $0.1 million to $8.4 million for the nine months ended September 30, 2010 as compared to $7.9 million for the same period in the prior year.
25
Table of Contents
Gross Profit
Gross profit for the nine months ended September 30, 2010 was $422.4 million, or 49.5% of total net revenue, as compared to $317.7 million, or 50.2% of total net revenue, in the same period of 2009. The increase in gross profit was attributable to the increase in sales, while the decrease in gross margin was principally due to the recognition of additional inventory reserves during 2010 related to delays in FDA approval of certain of our products, which was partially offset by an increase in the proportion of list product sales relative to contract product sales as a result of competitor supply constraints.
Research and Development
Research and development expense for the nine months ended September 30, 2010 increased $0.2 million, or 1.2%, to $21.0 million compared to $20.8 million for the same period in 2009. The increase was due primarily to the timing of projects during the period.
Selling, General and Administrative
Selling, general and administrative expense for the nine months ended September 30, 2010 increased $21.0 million to $87.4 million, or 10.2% of total net revenue, from $66.4 million, or 10.5% of total net revenue, for the same period in 2009. This increase in costs was due primarily to severance related charges recorded during the first quarter of 2010 in addition to accrued settlement fees recorded during the current period related to a commercial contract and higher professional fees.
Impairment of Fixed Assets
Results for the nine months ended September 30, 2010 included $2.9 million of expense related to the impairment of production equipment for discontinued products. Impairment charges of $5.4 million recorded in the same period in 2009 relate to the closure of the Puerto Rico manufacturing facility.
Interest Expense and Intercompany Interest Expense
Total interest on third party and intercompany debt decreased $39.9 million to $212.3 million for the nine months ended September 30, 2010 from $252.2 million for the same period in 2009. Interest expense on third party debt decreased to $48.9 million for the nine months ended September 30, 2010, compared to $61.2 million for the same period in 2009. The decrease in third party interest expense was primarily due to the lower interest rates related to the replacement of Term Loan B with Term Loan C instruments in March 2010. Intercompany interest expense decreased $27.6 million to $163.4 million for the nine months ended September 30, 2010 compared to $191.0 million in the prior year period, reflecting the write-off of $14.6 million in unamortized debt issue costs in connection with the intercompany debt restructuring in the first quarter of 2009.
Other income, other non-operating items
Interest income and other income, net consists primarily of interest earned on invested cash and cash equivalents, the impact of foreign currency rate changes on intercompany trading and debt accounts denominated in Euros and Canadian dollars, as well as the related non-hedging derivative instruments, and other financing costs. Interest income and other income (expense), net was $0.7 million of income for the nine months ended September 30, 2010 compared to $3.7 million of income for the same period in 2009.
Additionally, during the nine months ended September 30, 2010 we recognized $43.3 million of income resulting from the change in fair value of the contingent value rights (CVRs) issued to APP shareholders in connection with the Merger. The estimated fair value of the CVRs at the date of the acquisition was included in the acquisition cost and is adjusted at each reporting date (marked-to-market) based on the closing price of a CVR as reported by NASDAQ, with the change in the fair value of the CVR for the reporting period being included in non-operating income.
Provision for Income Taxes
For the nine month period ended September 30, 2010, FKP Holdings reported an income tax expense of $32.0 million on pretax income from operations of $115.2 million, or an effective tax rate of 27.8% compared to an income tax benefit of $12.4 million on a pretax loss of $88.4 million, or an effective benefit rate of 14.0% for the same period in 2009. The 2010 and 2009 rates differ from the statutory U.S. federal tax rate of 35% due primarily to the tax cost of a hypothetical distribution of the profits of our foreign subsidiaries and additional tax and interest resulting from the U.S. Federal income tax examination offset by the decrease in the non-taxable change in the fair value of the CVRs, as well as the effect of state and foreign income taxes.
26
Table of Contents
LIQUIDITY AND CAPITAL RESOURCES
Overview
The following table summarizes key elements of our financial position and sources and (uses) of cash and cash equivalents for the periods indicated:
Liquidity and Capital Resources
| September 30, 2010 | December 31, 2009 | |||||||
| (in thousands) | ||||||||
| Summary Financial Position: |
||||||||
| Cash and cash equivalents |
$ | 6,726 | $ | 10,469 | ||||
| Working capital (deficit) |
$ | (291,093 | ) | $ | (273,880 | ) | ||
| Total assets |
$ | 4,783,268 | $ | 4,858,685 | ||||
| Cash overdraft |
$ | 7,261 | $ | — | ||||
| Current debt |
$ | 551,835 | $ | 517,968 | ||||
| Long term debt |
$ | 3,310,656 | $ | 3,436,662 | ||||
| Total stockholder’s equity |
$ | 605,305 | $ | 539,076 | ||||
| Nine Months Ended September 30, 2010 |
Nine Months Ended September 30, 2009 |
|||||||
| (in thousands) | ||||||||
| Summary of Sources and (Uses) of Cash and Cash Equivalents: |
||||||||
| Operating activities |
$ | 73,559 | $ | 55,850 | ||||
| Investing activities |
(4,727 | ) | 8,673 | |||||
| Financing activities |
(73,364 | ) | (71,543 | ) | ||||
| Effect of exchange rates on cash and cash equivalents |
789 | 4,349 | ||||||
| Increase (decrease) in cash and cash equivalents |
(3,743 | ) | (2,671 | ) | ||||
| Cash and cash equivalents, beginning of period |
10,469 | 8,441 | ||||||
| Cash and cash equivalents, end of period |
$ | 6,726 | $ | 5,770 | ||||
Sources and Uses of Cash
In connection with the Merger, our parent contributed $900.0 million and loaned approximately $3.0 billion to FKP Holdings. We used the proceeds of the capital contribution and intercompany loans to complete the Merger. We also assumed our predecessor’s credit facility in connection with the Merger, which we retired and replaced with a similar facility. Principally as a result of these transactions, as of September 30, 2010 we have $3.86 billion of outstanding indebtedness; comprised of approximately $0.87 billion of term loans from a group of financial institutions and $2.99 billion of intercompany loans.
We anticipate that available cash and cash equivalents, cash generated from operations, and funds available under our credit facility or through borrowings or capital contributions from Fresenius, our parent, will be sufficient to finance our operations, including ongoing product development and capital expenditures for at least the next twelve months. In the event we engage in future acquisitions or capital projects, we may have to raise additional capital through additional borrowings or through additional intercompany debt. Fresenius has committed to the Company that it will provide financial support to FKP Holdings sufficient for it to satisfy its obligations and debt service requirements arising under all existing financing instruments that were entered into in connection with the Merger, and to which the Company is a party, as they come due until at least January 1, 2011.
Operating Activities
Net cash provided by operating activities was $73.6 million for the nine months ended September 30, 2010 as compared to net cash provided by operating activities of $55.9 million for the nine months ended September 30, 2009. The change in cash provided by operating activities for the 2010 period as compared to 2009 was due primarily to higher net earnings in 2010 offset by decreases in accrued intercompany interest and an increase in accounts receivable due to higher net revenue.
27
Table of Contents
Investing Activities
Our investing activities include cash paid for acquisitions, capital expenditures necessary to expand and maintain our manufacturing capabilities and infrastructure, and outlays to acquire various product or intellectual property rights needed to grow and maintain our business. Cash used in investing activities during the nine months ended September 30, 2010 was $4.7 million, which included $7.5 million for purchases of property, plant and equipment offset by $2.7 million of proceeds from the sale of property at our Grand Island facility. Cash provided by investing activities for the same period in the prior year was $8.7 million, which included $33.8 million in proceeds from the settlement of an intercompany note receivable with our Parent, offset by cash paid for intellectual property rights and capital expenditures.
Financing Activities
Financing activities generally include external borrowings under our credit facility and intercompany borrowing activity with Fresenius and its affiliated companies. Net cash used in financing activities for the nine months ended September 30, 2010 was $73.4 million which reflected net repayments on internal and external borrowings of $65.9 million and $2.5 million, respectively, along with payments of deferred financing costs of $12.2 million offset by cash inflows from overdrafts of $7.3 million.
Sources of Financing and Capital Requirements
Our primary sources of liquidity for our operating and working capital needs, including funding for our research and development activities, as well as to support the capital expenditures necessary to expand and maintain our manufacturing capabilities and infrastructure, and to acquire various product or intellectual property rights needed to grow and maintain our business is through cash flow generated from our operations and our existing credit facilities. Capital to expand our business through acquisition has been provided by Fresenius, our ultimate parent.
We are also party to a “keep well” agreement with Fresenius under which Fresenius has agreed to provide us with financial support sufficient to satisfy the obligations and debt service requirements that arise under our existing financial instruments that we incurred in connection with the Merger. The keep well agreement will extend until at least January 1, 2011.
Credit Facilities
A summary of our external and intercompany debt is as follows:
| September 30, 2010 |
December 31, 2009 |
|||||||
| External debt |
||||||||
| Senior Credit Facilities, with interest at variable rates based on LIBOR plus a margin. Term loan B2 and C2 are subject to a minimum rate |
||||||||
| Term loan A2, due in semi-annual installments through September 10, 2013 |
$ | 438,500 | $ | 462,500 | ||||
| Term loan B2, due in equal semi-annual installments with a final balloon payment on September 10, 2014 |
— | 458,944 | ||||||
| Term loan C2, due in equal semi-annual installments beginning June 10, 2010, with a final balloon payment on September 10, 2014 |
406,706 | — | ||||||
| Target revolving credit facility loan, due at expiration of the facility on September 10, 2013 |
24,000 | — | ||||||
| Total external debt |
869,206 | 921,444 | ||||||
| Current maturities of external debt |
(123,975 | ) | (76,475 | ) | ||||
| Long-term external debt |
$ | 745,231 | $ | 844,969 | ||||
| Internal debt |
||||||||
| Intercompany Credit Facilities |
||||||||
| Short-term unsecured intercompany loans payable to Fresenius Kabi AG, due in 30 to 60 days from date of issue, with interest at fixed rates |
$ | 323,000 | $ | 360,000 | ||||
| Secured senior intercompany loans payable to a financing subsidiary of Fresenius SE, with interest at variable rates based on LIBOR or EURIBOR plus a margin. Term loan B1 and C1 are subject to a minimum rate |
||||||||
| Term loan A1, due in semi-annual installments through September 10, 2013 |
438,500 | 462,500 | ||||||
| Term loan B1, due in equal semi-annual installments with a final balloon payment on September 10, 2014 |
— | 657,742 | ||||||
| Term loan C1, due in equal semi-annual installments with a final balloon payment on September 10, 2014 |
582,878 | — | ||||||
| Euro currency term loan B1 (€197.5 million), due in equal semi-annual installments with a final balloon payment on September 10, 2014 |
— | 265,791 | ||||||
| Euro currency term loan C1 (€163.5 million), due in equal semi-annual installments with a final balloon payment on September 10, 2014 |
223,145 | — | ||||||
| Unsecured intercompany loans payable to a financing subsidiary of Fresenius SE, due July 15, 2015, with interest at fixed rates |
||||||||
| US dollar denominated |
500,000 | 500,000 | ||||||
| Euro currency denominated (€115.7 million) |
157,898 | 166,668 | ||||||
| Unsecured intercompany loans payable to Fresenius Kabi AG, due September 10, 2014, with interest at fixed rates |
722,826 | 601,775 | ||||||
| Euro currency denominated loans payable (€33.0 million as of September 30, 2010 and €13 million as of December 31, 2009) |
45,038 | 18,728 | ||||||
| Total intercompany debt |
2,993,285 | 3,033,204 | ||||||
| Current maturities of intercompany debt |
(427,860 | ) | (441,511 | ) | ||||
| Long-term intercompany debt |
$ | 2,565,425 | $ | 2,591,693 | ||||
28
Table of Contents
Fresenius Merger—Credit Agreements
On August 20, 2008, in connection with the acquisition of APP, Fresenius entered into various credit arrangements to assist in funding the transaction. These credit facilities included a Senior Credit Facilities Agreement and a Bridge Facility Agreement. Proceeds from borrowings under these credit facilities, together with other available funds provided by Fresenius through equity contributions and loans to FKP Holdings and its subsidiaries, were utilized to complete the purchase of APP on September 10, 2008.
The Senior Credit Facilities Agreement provides Fresenius and certain of its subsidiaries with various credit facilities. These include two term loan facilities and a $150 million revolving credit facility under which APP Pharmaceuticals, LLC, a wholly owned subsidiary of APP, is the obligor.
Pursuant to the Senior Credit Facilities Agreement, FKP Holdings and its subsidiaries have entered into various secured senior intercompany loans with finance subsidiaries of Fresenius SE (collectively, the “Senior Intercompany Loans”), the amount, maturity and other financial terms of which correspond to those applicable to the loans provided to such borrowers under the Senior Credit Facilities Agreement described above. The Senior Intercompany Loans are guaranteed by FKP Holdings and certain of its affiliates and subsidiaries and secured by the assets of FKP Holdings and certain of its affiliates and subsidiaries. The Senior Intercompany Loans provide for an event of default and acceleration if there is an event of default and acceleration under the Senior Credit Facilities Agreement, but acceleration of the Senior Intercompany Loans may not occur prior to acceleration of the loans under the Senior Credit Facilities Agreement. By entering into the Senior Intercompany Loans, Fresenius effectively pushed-down its Merger-related term loan borrowings under the Senior Credit Facilities Agreement to the FKP Holdings group.
The Senior Credit Facilities Agreement contains a number of affirmative and negative covenants that are assessed at the Fresenius level and are not separately assessed at FKP Holdings or its subsidiaries. The Company’s obligations under the Senior Credit Facilities Agreement are unconditionally guaranteed by Fresenius SE and certain of its subsidiaries, and are secured by a first-priority security interest in substantially all tangible and intangible assets of APP Pharmaceuticals, Inc. and APP Pharmaceuticals, LLC.
Post-Merger Activity
In October 2008, the amount available under the Senior Credit Facilities Agreement was increased and the full amount of the increase to the facility was drawn down. These funds, along with an additional $166.9 million of proceeds from other intercompany borrowings were used to repay a portion of the balance outstanding under the Bridge Facility Agreement. On January 21, 2009, the borrower under the Bridge Facility Agreement, which is an affiliate of Fresenius, issued two tranches of notes in a private placement. Proceeds of the notes issuance were used, among other things, to repay in full the balance outstanding under the Bridge Facility Agreement. Upon the repayment of the bridge loan, the Bridge Intercompany Loan was refinanced and replaced with an Intercompany Dollar Loan of $500 million and an Intercompany Euro Loan of €115.7 million. These new intercompany loans are not guaranteed or secured. As a result of the refinancing, in the first quarter of 2009, the Company wrote-off $14.6 million of Bridge Intercompany Loan unamortized debt issuance costs and incurred debt issuance costs of $67.5 million for the new Intercompany Dollar and Euro loans.
On each of December 10, 2009 and February 10, 2010, the Company entered into three unsecured intercompany loans with Fresenius Kabi AG in the amounts of €13 million, $46.3 million and $32.3 million and €20 million, $71.3 million and $49.8 million, respectively. These loans replaced Senior Intercompany Loans of like amounts. These Fresenius Kabi AG notes bear fixed interest rates. There was no change to principal maturity dates as a result of this exchange of notes.
29
Table of Contents
On March 18, 2010, the 2008 Senior Credit Facilities Agreement was amended, and Term Loan B, consisting of APP’s Term Loan B2 and Term Loan B1 were replaced with a lower interest bearing Term Loan C, consisting of APP’s Term Loan C2 and Term Loan C1. There was no change to principal amount outstanding as a result of this exchange of notes. The amendments to the 2008 Senior Credit Agreement also modified certain of the financial covenants, which are measured at the consolidated Fresenius SE level, as defined in the agreement. As a result of the debt replacement in the first quarter of 2010, the Company incurred debt issuance costs of $13.7 million for the Term Loan C, of which $12.2 million was paid directly by the Company and $1.5 million was pushed down from the Parent.
Subsequent to the period ended September 30, 2010, the Company replaced the outstanding Target Revolver with fixed rate unsecured intercompany notes with Fresenius Kabi AG which mature monthly.
The following is the repayment schedule for Term Loans A2 and C2, the target revolver and the intercompany loans outstanding as of September 30, 2010 (in thousands):
| Term Loan A2 | Term Loan C2 | Target Revolver |
Intercompany Fresenius |
Total | ||||||||||||||||
| 12 months from 10/1/10 to 9/30/11 |
$ | 95,000 | $ | 4,975 | $ | 24,000 | $ | 427,860 | $ | 551,835 | ||||||||||
| 12 months from 10/1/11 to 9/30/12 |
150,000 | 4,975 | — | 159,860 | 314,835 | |||||||||||||||
| 12 months from 10/1/12 to 9/30/13 |
193,500 | 4,975 | — | 203,360 | 401,835 | |||||||||||||||
| 12 months from 10/1/13 to 9/30/14 |
— | 391,781 | — | 1,544,308 | 1,936,089 | |||||||||||||||
| 12 months from 10/1/14 to 9/30/15 |
— | — | — | 657,897 | 657,897 | |||||||||||||||
| $ | 438,500 | $ | 406,706 | $ | 24,000 | $ | 2,993,285 | $ | 3,862,491 | |||||||||||
Foreign Currency Contracts: Included in our intercompany borrowings are several Euro-denominated notes, including €196.5 million in notes with maturities in 2014, and a €115.7 million note with a maturity in 2015. In connection with these borrowings, we entered into foreign currency swap contracts in order to limit our exposure to changes in current exchange rates on the Euro-denominated notes principal balance. We have entered into these foreign currency swaps with affiliates of Fresenius for the total of the Euro-denominated notes principal balance. These agreements mature at various dates through January 2012, and are not designated as hedging instruments for accounting purposes. For the nine months ended September 30, 2010 and 2009 we recognized a foreign currency loss of $24.1 million and gain of $37.8 million, respectively, in our other income (expense) related to the change in fair value of these swap agreements. These foreign currency losses and gains were offset by $23.8 million and $33.8 million in currency gains and losses we recorded in the nine months ended September 30, 2010 and 2009, respectively, in order to adjust the carrying value of the Euro-denominated notes to reflect the period-end exchange rate.
We have also entered into foreign currency forward contracts for €10.0 million of the future cash flows related to the interest payments due on the €196.5 million notes through October 2012, and €15.2 million of the future cash flows related to the interest payments due on the €115.7 million note through January 2012. These foreign currency agreements have been designated as hedges of our exposure to fluctuations in interest payments on outstanding Euro-denominated borrowings due to changes in Euro/U.S. dollar exchange rates (a cash flow hedge).
During the second quarter of 2010, we entered into foreign currency forward contracts for €22.7 million of future cash flows related to certain forecasted inventory purchases from July 2010 through June 2011. These foreign currency agreements have been designated as hedges of our exposure to fluctuations in future payments related to these forecasted purchases due to changes in Euro/U.S. dollar exchange rates (a cash flow hedge). At September 30, 2010 we have €19.3 million of outstanding foreign currency forward contracts.
Interest Rate Swaps: On November 3, 2008, we entered into four interest rate swap agreements with Fresenius for an aggregate notional principal amount of $900 million, the “2008 interest rate swaps”. These agreements require us to pay interest at an average fixed rate of 3.97% and entitle us to receive interest at a variable rate equal to three-month LIBOR, which is equal to the benchmark rate for the Term A Loans being hedged, on the notional amount. The 2008 interest rate swaps expire in October 2011 and December 2013. During the third quarter 2010 we entered into six additional interest rate swap agreements with Fresenius for an aggregate principal amount of $600 million, the “2010 interest rate swaps”. These swap agreements require us to pay interest at an average fixed rate of 2.16% and entitle us to receive interest at a variable rate equal to three-month LIBOR, subject to a minimum LIBOR, which is equal to the benchmark rate for the Term C Loan being hedged, on the notional amount. The 2010 interest rate swaps expire on September 10, 2014. All interest rate swaps have been designated as hedges of our exposure to fluctuations in interest payments on outstanding variable rate borrowings due to changes in interest rates (a cash flow hedge).
30
Table of Contents
The fair value of these interest rate swap agreements at September 30, 2010 and December 31, 2009 was a liability of $80.3 million and $53.2 million, respectively, and is included in long-term liabilities in our condensed consolidated balance sheets. As noted above, the Company entered into derivative contracts with its Parent, who pushed down the interest rate swap agreements to the Company. From inception of the agreements to the time the 2008 interest rate swaps were transferred to the Company, the Parent recognized $15.9 million in losses in other comprehensive income (loss). From the time the 2008 interest rate swap agreements were transferred to the Company through September 30, 2010, we recorded a deferred loss of $39.0 million, net of tax benefit of $25.4 million, in other comprehensive income (loss) and recognized $0.7 million, in intercompany interest expense, which represented the amount of hedge ineffectiveness.
The CVRs
In connection with the Merger, each APP shareholder was issued one contingent value right of FKP Holdings. The CVRs are intended to give holders an opportunity to participate in any excess Adjusted EBITDA, as defined in the CVR Indenture, generated during the three years ending December 31, 2010, referred to as the “CVR measuring period,” in excess of a threshold amount. Each CVR represents the right to receive a pro rata portion of an amount equal to 2.5 times the amount by which cumulative Adjusted EBITDA of APP and FKP Holdings and their subsidiaries on a consolidated basis, exceeds $1.267 billion for the three years ending December 31, 2010. The maximum amount payable under the CVR Indenture is $6.00 per CVR. If Adjusted EBITDA for the CVR measuring period does not exceed this threshold amount, no amounts will be payable on the CVRs and the CVRs will expire valueless. The cash payment on the CVRs, if any, will be determined after December 31, 2010, and will be payable June 30, 2011, except in the case of a change of control of FKP Holdings, which may result in an acceleration of any payment. The acceleration payment, if any, is payable within six months after the change of control giving rise to the acceleration payment. As a result of the expiration of the CVR measuring period shortly after FKP Holdings files its Annual Report on Form 10-K for the year ended December 31, 2010 the CVRs will be deregistered and delisted and cease trading on NASDAQ.
Because any amount payable to the holders of CVRs must be settled in cash, the CVRs are classified as liabilities in the condensed consolidated financial statements. The estimated fair value of the CVRs at the date of acquisition was included in the cost of the acquisition. At each reporting date, the CVRs are marked-to-market based on the closing price of a CVR as reported by NASDAQ, and the change in the fair value of the CVR for the reporting period is included in operations.
Assuming the Adjusted EBITDA threshold is met, the maximum amount payable under the CVR Indenture is $979.5 million. Such payment would be due on June 30, 2011. In the event that such a payment is required, we would likely need to seek financing from either an external source or Fresenius and its affiliates, in order to satisfy the obligation.
The CVRs do not represent equity, or voting securities of FKP Holdings, and they do not represent ownership interests in FKP Holdings. Holders of the CVRs are not entitled to any rights of a stockholder or other equity or voting securities of FKP Holdings, either at law or in equity. Similarly, holders of CVRs are not entitled to any dividends declared or paid with respect to any equity security of FK Holdings. A holder of a CVR is entitled only to those rights set forth in the CVR indenture. Additionally, the right to receive amounts payable under the CVRs, if any, is subordinated to all senior obligations of FKP Holdings. The CVRs trade on NASDAQ under the symbol “APCVZ”.
Under the terms of the CVR Indenture, the amount, if any, payable in respect of each CVR on June 30, 2011 is determined based on Adjusted EBITDA (as defined by the CVR indenture). As a result, in addition to reporting financial results in accordance with generally accepted accounting principles (“GAAP”), FKP Holdings also must calculate and present Adjusted EBITDA, which is a non-GAAP financial measure, for the cumulative period from January 1, 2008 to the current reporting date until the expiration of the CVR measurement period (December 31, 2010) and settlement of the CVRs.
31
Table of Contents
The calculation of Adjusted EBITDA under the CVR Indenture for the nine month period ended September 30, 2010 and the cumulative period from January 1, 2008 to September 30, 2010 is as follows (in thousands):
| For the Nine Month Period Beginning January 1, 2010 and Ending September 30, 2010 |
For the Cumulative Period Beginning January 1, 2008 and Ending September 30, 2010 |
|||||||
| EBITDA CALCULATION: |
||||||||
| Net income (loss) |
$ | 83,213 | $ | (250,074 | ) | |||
| Interest expense (net of interest income) |
212,315 | 707,206 | ||||||
| Income taxes |
31,984 | 28,458 | ||||||
| Depreciation |
15,033 | 52,253 | ||||||
| Amortization |
30,488 | 512,416 | ||||||
| Fixed asset impairment |
2,938 | 8,310 | ||||||
| EBITDA |
$ | 375,971 | $ | 1,058,569 | ||||
| Reconciliation to Adjusted EBITDA: |
||||||||
| Stock compensation |
443 | 6,572 | ||||||
| Merger and separation related costs |
1,015 | 49,770 | ||||||
| Puerto Rico costs * |
— | 32,802 | ||||||
| Technology transfer costs * |
— | 2,098 | ||||||
| Change in the value of contingent value rights |
(43,262 | ) | (152,640 | ) | ||||
| Other taxes |
520 | 1,905 | ||||||
| Gain on sale of fixed assets |
(604 | ) | (262 | ) | ||||
| Consulting fees |
— | 600 | ||||||
| Foreign currency (gain)/loss |
69 | (2,405 | ) | |||||
| Puerto Rico closure costs |
751 | 1,157 | ||||||
| Other charges |
4,155 | 1,681 | ||||||
| Adjusted EBITDA – per CVR |
$ | 339,058 | $ | 999,847 | ||||
| * | Puerto Rico costs and Technology transfer costs reached the combined add back limit of $34.9 million as of June 30, 2009. |
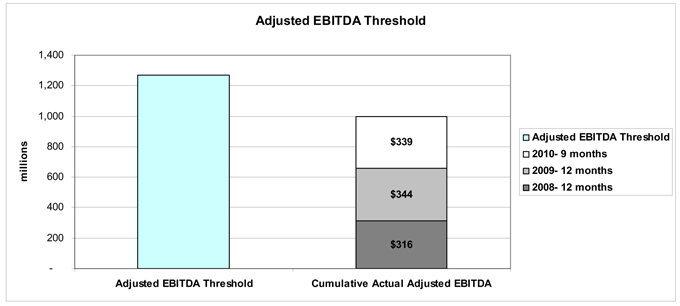
FKP Holdings believes that its presentation of these non-GAAP financial measures is consistent with the requirements of the CVR Indenture and also provides useful supplementary information to help investors in understanding the underlying operating performance and cash generating capacity of the Company. FKP Holdings uses these non-GAAP financial measures internally for
32
Table of Contents
operating, budgeting and financial planning purposes and also believes that its presentation of these non-GAAP financial measures can assist management and investors in assessing the financial performance and underlying strength of its core business. The non-GAAP financial measures presented by FKP Holdings may not be comparable to similarly titled measures reported by other companies. The non-GAAP financial measures are in addition to, and not a substitute for or superior to, measures of financial performance calculated in accordance with GAAP.
Capital Requirements
Our future capital requirements will depend on numerous factors, including:
| • | the obligations placed upon our company from our credit agreements discussed above, including any debt covenants related to those obligations; |
| • | working capital requirements and production, sales, marketing and development costs required to support our business; |
| • | the need for manufacturing expansion and improvement; |
| • | the transfer of products from our Puerto Rico manufacturing facility; |
| • | our obligation to make a payment under the CVRs, and the amount of such payment, if any; |
| • | the requirements of any potential future acquisitions, asset purchases or equity investments; and |
| • | the amount of cash generated by operations, including potential milestone and license revenue. |
We anticipate that available cash and short-term investments, cash generated from operations and funds available under our credit facility will be sufficient to finance our operations, including ongoing product development and capital expenditures, for at least the next twelve months. In the event we engage in future acquisitions or major capital projects, we may have to raise additional capital through additional borrowings or the issuance of debt or equity securities.
As described above, we are responsible for servicing the external debt of $0.87 billion incurred in connection with the Merger, as well as to pay the principal and interest on the outstanding intercompany debt of $2.99 billion. While we expect that funds generated by our operations will be sufficient to enable us to satisfy our debt service obligations, our ability to meet our debt service obligations will depend on our future performance, which will be affected by financial, business, economic and other factors, including potential changes in customer preferences, the success of product and marketing innovations and pressure from competitors. If we do not have enough money to pay our debt service obligations, we may be required to refinance all or part of our existing debt, sell assets or borrow more money. At any given time, we may not be able to refinance this debt, sell assets or borrow more money on terms acceptable to us or at all; the failure to do any of which could have adverse consequences for our business, financial condition and results of operations.
CRITICAL ACCOUNTING POLICIES AND ESTIMATES
For information regarding critical accounting estimates, see the caption “Critical Accounting Estimates” in “Item 7. Management’s Discussion and Analysis of Financial Condition and Results of Operations” in our Annual Report on Form 10-K for the year ended December 31, 2009. There have been no significant changes to our critical accounting estimates during the third quarter of 2010.
RECENT ACCOUNTING PRONOUNCEMENTS
See Note 1 to the condensed consolidated financial statements in Part I, Item 1 of this Form 10-Q for information related to recent accounting pronouncements.
| ITEM 3. | QUANTITATIVE AND QUALITATIVE DISCLOSURES ABOUT MARKET RISK |
We are exposed to market risks associated with changes in interest rates and foreign currency exchange rates. Interest rate changes affect primarily the interest we earn on our short-term advances to our parent and its affiliates and the interest we pay on our debt obligations. Changes in foreign currency exchange rates can affect the amount of our debt and related interest obligations, our payments for inventory purchases from companies outside of the U.S., and our operations outside of the United States.
For information about market risk, see “Item 7A. Quantitative and Qualitative Disclosures about Market Risk” in our Annual Report on Form 10-K for the year ended December 31, 2009. There have been no significant changes in our market risks during the third quarter of 2010.
33
Table of Contents
| ITEM 4. | CONTROLS AND PROCEDURES |
We maintain disclosure controls and procedures, as such term is defined under Exchange Act Rules 13a-15(e) and 15d-15(e), that are designed to ensure that information required to be disclosed by us in the reports that we file or submit under the Exchange Act is recorded, processed, summarized and reported within the time periods specified in the SEC’s rules and forms, and that such information is accumulated and communicated to management, including our Chief Executive Officer and our Chief Financial Officer, to allow timely decisions regarding required disclosures. In designing and evaluating our disclosure controls and procedures, we recognize that any controls and procedures, no matter how well designed and operated, can only provide reasonable assurance of achieving the desired control objectives, and in reaching a reasonable level of assurance we necessarily are required to apply judgment in evaluating the cost-benefit relationship of possible controls and procedures. Our management, with participation of our Chief Executive Officer and Chief Financial Officer, has evaluated the effectiveness of our disclosure controls and procedures as of the end of the quarterly period covered by this report. Based on their evaluation and subject to the foregoing, management has concluded that our disclosure controls and procedures were effective as of September 30, 2010.
There was no change in the Company’s internal control over financial reporting, as defined in Rules 13a-15(f) and 15d-15(f) of the Exchange Act, during the most recent fiscal quarter that has materially affected, or is reasonably likely to materially affect, the Company’s internal control over financial reporting.
34
Table of Contents
| ITEM 1. | LEGAL PROCEEDINGS |
We are from time to time subject to claims and litigation arising in the ordinary course of business. These claims have included assertions that our products infringe existing patents, allegations of product liability, and claims that the use of our products has caused personal injuries. We believe we have substantial defenses in these matters, however litigation is inherently unpredictable. Consequently any adverse judgment or settlement could have a material adverse effect on our results of operations, cash flows or financial condition for a particular period.
Summarized below are the more significant pending legal matters pending to which we are a party:
Patent Litigation
Pemetrexed Disodium
We have filed an abbreviated new drug application, or “ANDA”, seeking approval from the FDA to market pemetrexed disodium for injection, 500 mg/vial. The Reference Listed Drug for APP’s ANDA is Alimta®, a chemotherapy agent for the treatment of various types of cancer marketed by Eli Lilly. Eli Lilly is believed to be the exclusive licensee of certain patent rights from Princeton University. We notified Eli Lilly and Princeton University of our ANDA filing pursuant to the provisions of the Hatch-Waxman Act and, in June 2008, Eli Lilly and Princeton University filed a patent infringement action in the U.S. District Court for the District of Delaware seeking to prevent us from marketing this product until after the expiration of U.S. Patent 5,344,932, which is alleged to expire in 2016. We filed our Answer and Counterclaims in August 2008 and a seven day bench trial is scheduled to begin on November 8, 2010.
Naropin ®
In March 2007 we filed a complaint for patent infringement against Navinta LLC in the U.S District Court for the District of New Jersey. Navinta filed an ANDA seeking approval from the FDA to market ropivacaine hydrochloride injection, in the 2 mg/ml, 5 mg/ml and 10 mg/ml dosage forms. The Reference Listed Drug for Navinta’s ANDA is APP’s proprietary product Naropin®. This matter proceeded to trial on July 20, 2009. The U.S. District Court, District of New Jersey reached a judgment in favor of the Company on August 3, 2009, determining that Navinta’s ANDA product infringed on the Company’s proprietary product Naropin. The judgment has been appealed by Navinta.
On July 22, 2010, APP filed a second action against Navinta/Sandoz, Hospira and Sagent/Strides in the same court alleging that defendants had filed separate ANDA applications for generic Naropin infringing patent-in-suit from the prior litigation. On August 30, 2010, Navinta/Sandoz and Hospira filed Motions to Dismiss. On September 28, 2010, APP filed its opposition to the Navinta/Sandoz Motion to Dismiss.
We have filed a lawsuit against Ameridose, LLC in the United States District Court, District of New Jersey alleging infringement of our ‘086, ‘525 and ‘489 patents related to Naropin. The complaint, filed on August 10, 2010 and served on August 13, 2010 seeks injunctive relief and treble damages due to the willfull and deliberate nature of the infringement. Ameridose filed its Notice of Appearance on September 2, 2010 and its Answer and Counter-claims on September 24, 2010.
35
Table of Contents
Bivalirudin
We have filed an ANDA seeking approval from the FDA to market generic bivalirudin, 250 mg/vial for intravenous injection. The reference listed drug for APP’s ANDA is Angiomax, for use as an anticoagulant in patients with unstable angina and currently marketed by The Medicines Co. The Medicines Co. is believed to be the exclusive assignee of certain patent rights from Gopal Krishna and Gary Musso. The patent, alleged to be generally directed to bivalirudin compositions, was issued on September 1, 2009. APP notified The Medicines Co. of our ANDA filing pursuant to the provisions of the Hatch-Waxman Act, and on October 8, 2009, The Medicines Co. filed a patent infringement action in the United States District Court for the District of Delaware seeking to prevent APP from marketing this product until after the patent’s expiration. We filed our Answer and Counterclaims on December 9, 2009. The Medicines Co. filed its response on December 28, 2009.
On March 23, 2010, the Judge ordered that this case be consolidated with four other infringement actions against Teva/Pliva Hrvatska for pre-trial purposes. On March 24, 2010, an interim protective order and scheduling order was approved by the Judge. On April 26, 2010, APP filed another ANDA related to Bivalirudin. The Medicines Co. filed its infringement suit on June 1, 2010, and APP filed its Answer and Counter-claims on June 28, 2010. The Parties have agreed to consolidate these actions.
Discovery is currently underway. All factual discovery is to be completed by March 11, 2011.
On August 3, 2010, in a related action in the United States District Court, Eastern District of Virginia, The Medicines Co. was granted summary judgment against the United States Government in its quest to vacate a prior ruling of the Patent and Trademark Office denying a patent term extension for its ‘404 bivalirudin patent. The Court applied a business day rather than calendar day construction to the term extension deadline. On August 19, 2010, APP filed a Motion to Intervene, which was denied on September 13, 2010. On September 17, 2010, APP filed a Notice of Appeal with the United States Court of Appeals for the Federal Circuit on both the patent term extension ruling and the Motion to Intervene. On October 5, 2010, The Medicines Co. filed a Motion to Dismiss the Appeal, which is pending.
Gemcitabine
We have filed an ANDA seeking approval from the FDA to market gemcitabine for injection, 200 mg base/vial, 1 g base/vial and 2 g base/vial. The reference listed drug for APP’s ANDA is Gemzar, for use as a treatment for non-small lung cancer, pancreatic cancer, breast cancer and ovarian cancer. Eli Lilly is the holder of the New Drug Application for Gemzar and is believed to be the owner of the patent rights, which are set to expire on November 7, 2012, followed by a six month period of pediatric market exclusivity ending on May 7, 2013. APP notified Eli Lilly of our ANDA filing pursuant to the provisions of the Hatch-Waxman Act on November 4, 2009. On December 16, 2009, Eli Lilly filed a patent infringement action in the United States District Court in the Southern District of Indiana seeking to prevent APP from marketing this product until after the patent’s expiration. APP was served on January 7, 2010 and filed a Motion to Dismiss on March 19, 2010, basing its motion on the adjudicated invalidity of the patent in another action. The Motion to Dismiss is still pending. On June 3, 2010, the Judge issued a Case Management Order, and trial is scheduled for January 2012.
On July 29, 2010, the Court of Appeals for the Federal Circuit affirmed the District Court’s opinion of invalidity in the other action. APP subsequently filed notice of this decision in support of its Motion to Dismiss.
Product Liability Matters
Sensorcaine
We have been named as a defendant in numerous personal injury/product liability actions brought against us and other pharmaceutical companies and medical device manufacturers by plaintiffs claiming that they suffered injuries resulting from the post-surgical release of certain local anesthetics into the shoulder joint via a pain pump. We acquired several generic anesthetic products from AstraZeneca in June 2006. Pursuant to the Asset Purchase Agreement with AstraZeneca, we are responsible for indemnifying Astra Zeneca for defense of suits alleging injuries occurring after the acquisition date (unless the drugs are determined to be defective in manufacturing, in which case AstraZeneca will indemnify us pursuant to that certain Manufacturing and Supply Agreement entered into by us and AstraZeneca). Likewise Astra Zeneca agreed to indemnify us for suits alleging injuries occurring prior to the acquisition date. We maintain product liability insurance for these matters. All of our local anesthetic products are approved by the FDA and continue to be marketed and sold to customers. Since December 2009, more than 100 cases naming APP or New Abraxis have been dismissed due to lack of product identification or failure to plead with sufficient specificity to withstand a Motion to Dismiss.
In March 2010, a renewed motion by Plaintiffs to create a Multi-District Litigation (“MDL”) in the United States District Court of Minnesota was denied. Currently, there are nine cases naming APP as a defendant, and six of those involve an alleged event occuring after the June 2006 product acquisition date.
36
Table of Contents
Aredia and Zometa
We have been named as a defendant in approximately 14 personal injury/product liability cases brought against us and other manufacturers by plaintiffs claiming that they suffered injuries resulting from the use of pamidronate (the generic equivalent of Aredia®) prescribed for the management of metastic bone disease. Plaintiffs’ allege Aredia causes osteonecrosis to the jaw.
Ten cases naming APP have been transferred to an MDL in the Eastern District of New York. After little progress in determining product identification, the Judge ordered the Plaintiffs to amend their complaints to reflect sufficient product identification by August 20, 2010. At a status conference in September 2010, the Judge granted an extension to the plaintiffs to file a product identification report to October 20, 2010. One additional case naming APP and other defendants is comprised of 159 plaintiffs and was filed on April 26, 2010 in the Eastern District of New York and is pending transfer to the MDL.
There are currently two remaining cases filed against the Company in a coordinated proceeding in the Superior Court of New Jersey, Middlesex County. A final product identification report by plaintiffs was due on July 23, 2010, but was also extended.
Heparin
We have been named as a defendant in nine personal injury/product liability cases brought against us and other manufacturers claiming that the plaintiffs suffered side effects from heparin-induced thrombocytopenia (“HIT”). The cases were filed in state and federal courts in New Jersey, Pennsylvania, West Virginia and Illinois. Product identification discovery is underway in all six cases. APP has also been improperly named as a discovery respondent in a contamination case.
In re Reglan/Metaclopraminde
APP has been named along with numerous other defendants in 38 short form complaints alleging Extrapyramidial Symptoms (EPS) and Involuntary Movement Disorder for ingestion of Reglan. APP’s predecessor in interest, Fujisawa, ceased manufacturing and distribution of this product in 1994, which pre-dates the formation of the Company. APP is actively seeking dismissal of all these cases.
Regulatory Matters
We are subject to regulatory oversight by the FDA and other regulatory authorities with respect to the development and manufacture of our products. Failure to comply with regulatory requirements can have a significant effect on our business and operations. Management has designed and operates a system of controls to attempt to ensure compliance with applicable regulatory requirements.
| ITEM 1A. | RISK FACTORS |
For information regarding risks related to our business and our outstanding contingent value rights, see “Item 1A. Risk Factors” in our Annual Report on Form 10-K for the year ended December 31, 2009. There have been no significant changes to our risk factors during the third quarter of 2010.
| ITEM 2. | UNREGISTERED SALE OF SECURITIES, USE OF PROCEEDS AND ISSUER PURCHASES OF EQUITY SECURITIES |
None.
| ITEM 3. | DEFAULTS UPON SENIOR SECURITIES |
None.
| ITEM 4. | REMOVED AND RESERVED |
None.
| ITEM 5. | OTHER INFORMATION |
None.
| ITEM 6. | EXHIBITS |
The exhibits are as set forth in the Exhibit Index.
37
Table of Contents
Pursuant to the requirements of the Securities Exchange Act of 1934, the Registrant has duly caused this report to be signed on its behalf by the undersigned, thereunto duly authorized.
| FRESENIUS KABI PHARMACEUTICALS HOLDING, INC. | ||
| By: | /S/ RICHARD J. TAJAK | |
| Richard J. Tajak | ||
| Executive Vice President and Chief Financial Officer | ||
| (Principal Financial and Accounting Officer) | ||
Date: November 1, 2010
38
Table of Contents
Exhibit Index
| Exhibit |
Description | |
| 2.1 | Separation and Distribution Agreement among APP, Abraxis BioScience, LLC, APP Pharmaceuticals, LLC and Abraxis BioScience, Inc. (f/k/a New Abraxis, Inc.) (Incorporated by reference to Exhibit 2.3 to APP’s Annual Report on Form 10-K filed with the Securities and Exchange Commission on March 17, 2008) | |
| 2.2 | Agreement and Plan of Merger, dated July 6, 2008 among APP, Fresenius SE, Fresenius Kabi Pharmaceuticals Holding LLC, and Fresenius Kabi Pharmaceuticals LLC (Incorporated by reference to Exhibit 2.1 to APP’s Current Report on Form 8-K filed with the Securities and Exchange Commission on July 7, 2008) | |
| 3.1 | Amended and Restated Certificate of Incorporation of the Registrant (Incorporated by reference to Exhibit 3.1 to Registrant’s Current Report on Form 8-K filed with the Securities and Exchange Commission on September 10, 2008) | |
| 3.2 | Bylaws of the Registrant (Incorporated by reference to Exhibit 3.2 to Registrant’s Current Report on Form 8-K filed with the Securities and Exchange Commission on September 10, 2008) | |
| 4.1 | Reference is made to Exhibits 3.1 and 3.2 | |
| 31.1† | Certification of Chief Executive Officer pursuant to Section 302 of the Sarbanes-Oxley Act of 2002 | |
| 31.2† | Certification of Chief Financial Officer pursuant to Section 302 of the Sarbanes-Oxley Act of 2002 | |
| 32.1† | Certification of Chief Executive Officer pursuant to 18 U.S.C. Section 1350, as adopted by Section 906 of the Sarbanes-Oxley Act of 2002 | |
| 32.2† | Certification of Chief Financial Officer pursuant to 18 U.S.C. Section 1350, as adopted by Section 906 of the Sarbanes-Oxley Act of 2002 | |
| † | Filed herewith. |
39