Attached files
| file | filename |
|---|---|
| 8-K - FORM 8-K - Forestar Group Inc. | d77373e8vk.htm |
| EX-99.1 - EX-99.1 - Forestar Group Inc. | d77373exv99w1.htm |
Exhibit 99.2

| 1 Third Quarter 2010 Financial Results November 3, 2010 |
| 2 Forward Looking Statements This presentation contains "forward-looking statements" within the meaning of the federal securities laws. These statements reflect management's current views with respect to future events and are subject to risk and uncertainties. We note that a variety of factors and uncertainties could cause our actual results to differ significantly from the results discussed in the forward-looking statements. Factors and uncertainties that might cause such differences include, but are not limited to: general economic, market, or business conditions; the opportunities (or lack thereof) that may be presented to us and that we may pursue; fluctuations in costs and expenses including development costs; demand for new housing, including impacts from mortgage credit availability; lengthy and uncertain entitlement processes; cyclicality of our businesses; accuracy of accounting assumptions; competitive actions by other companies; changes in laws or regulations; and other factors, many of which are beyond our control. Except as required by law, we expressly disclaim any obligation to publicly revise any forward- looking statements contained in this presentation to reflect the occurrence of events after the date of this presentation. |

| Third Quarter 2010 Results 3 ($ in Millions, except per share data) 3rd Qtr 2010 3rd Qtr 2009 2nd Qtr 2010 Net Income (Loss) $8.9 $19.5 ($3.3) Earnings (Loss) Per Share $0.25 $0.54 ($0.09) 3rd Qtr 2010 weighted average diluted shares outstanding were 36.4 million 3rd Qtr 2010 results include an after-tax gain of $0.28 per share from the sale of 14,100 acres of timberland for approximately $22.6 million 3rd Qtr 2009 results include an after-tax gain of $0.45 per share from the sale of 20,000 acres of timberland for approximately $39.5 million Repurchased 1.0 million shares during 3rd Qtr. 2010 |

| Segment Results 4 ($ in Millions) 3rd Qtr 2010 3rd Qtr 2009 2nd Qtr 2010 Real Estate ($1.9) $0.1 $2.4 Mineral Resources 6.2 17.8 4.3 Fiber Resources 1.4 2.1 1.1 Total $ 5.7 $20.0 $ 7.8 3rd Qtr 2010 real estate segment results include $4.4 million in undeveloped land sales, compared with $11.3 million in third quarter 2009 and $8.2 million in second quarter 2010 3rd Qtr 2009 real estate segment earnings include ($4.7) million in impairment charges principally associated with a condominium project located in Austin, Texas and two joint-venture projects located in Tampa, Florida 3rd Qtr 2009 mineral resources segment earnings include $15.8 million in lease bonus payments associated with leasing almost 10,800 net mineral acres |

| 5 5 Strategy and Initiative Execution Have Forestar Well Positioned Market Conditions Real Estate Minerals Strategic Initiatives |

| U.S. Housing Market Conditions Are Mixed Issue Metric Comment Housing Affordability 1.7 1 Prices return to 2003 levels 30-Yr Fixed Rate Mortg. ~4.25% Near historic lows New Home Inventory 204,000 units / 8 MoS Lowest level of new home units since September 1968 Unemployment 9.6% More problematic in troubled real estate markets Consumer Confidence 50.2 2 Lowest since Jan. 2010 Foreclosures 4.6% 3 More problematic in troubled real estate markets 1 Housing affordability index - Texas A&M Real Estate Center (ratio of 1.0 = 25% of income required to purchase median-priced house) 2 Conference Board Consumer Confidence Index(r) as of Sept. 2010 3 Percent of all mortgage holders in foreclosure process as of Sept. 2010 (Source: Mortgage Bankers Association) 6 |

| Housing Starts at 50 Year Low 7 Source: MetroStudy Recessions 50 Year Avg. 1.5 million 2010 1960 |

| Texas Real Estate Market Conditions Texas Market Conditions Lower New Home Inventory - 29k units / 6.3 MoS Less Foreclosure Activity - 2% of Loans 2 Increased Housing Affordability - 1.9 3 Lower Unemployment - 8.1% Last 12 mos - Texas created >152k new jobs 8 Texas is a dynamic economy and consistently ranks above other states in measures of economic activity, transportation, access to capital and technology and innovation Source: America's Top States For Doing Business * Note: Investment includes ventures Forestar Investment * $399 million invested 50 projects Dallas Houston San Antonio Austin Gulf Coast Dallas-Ft. Worth 1Source: Metrostudy, Census Bureau 2Source: RealtyTrac 3Housing affordability index - Source- Texas A&M Real Estate Center (ratio of 1.0 = 25% of income required to purchase median-priced house) 1 |

| 9 Real Estate Segment KPI's 3rd Qtr 2010 3rd Qtr 2009 2nd Qtr 2010 Residential Lot Sales * Lots Sold 187 168 235 Average Price / Lot $48,800 $52,700 $50,300 Gross Profit / Lot $17,100 $16,000 $15,500 Commercial Tract Sales * Acres Sold 0.4 1.5 14.6 Average Price / Acre $623,400 $435,400 $58,800 Land Sales * Acres Sold 1,150 5,300 1,470 Average Price / Acre $3,800 $2,100 $5,600 Segment Revenues ($ in millions) $15.1 $22.9 $21.5 Segment (Loss) Earnings ($ in millions) ($1.9) $0.1 $2.4 * Includes 100% of venture activity |

| Real Estate Pipeline - Q3 2010 * In addition, Forestar owns a 58% interest in a venture which controls over 16,000 acres of undeveloped land in Georgia 10 |

| Multifamily Opportunity 11 Forestar is well positioned to take advantage of multifamily opportunity * Includes ventures Echo Boomers / Propensity to Rent Source: National Association of Realtors, National Association of Homebuilders, U.S. Census Bureau, Green Street Advisors. Source: U.S. Census Bureau, Green Street Advisors. SUPPLY Multifamily Construction Activity DEMAND Compelling short & long-term fundamentals Multifamily investment is consistent with experience and focus on housing markets Leverage value of Forestar resources to generate recurring cash flow, income & returns Wholly-owned, ventures & investment fund 6-11 multifamily sites in portfolio* Management team |

| 12 Fiber Resources Segment KPI's 3rd Qtr 2010 3rd Qtr 2009 2nd Qtr 2010 Fiber Sales Pulpwood Tons Sold 116,900 216,200 95,600 Average Pulpwood Price / Ton $9.41 $8.85 $10.89 Sawtimber Tons Sold 37,500 63,400 23,800 Average Sawtimber Price / Ton $17.79 $19.38 $20.36 Total Tons Sold 154,400 279,600 119,400 Average Price / Ton $11.45 $11.24 $12.78 Recreational Leases Average Acres Leased 205,900 206,000 212,600 Average Lease Rate / Acre $8.60 $8.09 $8.16 Segment Revenues ($ in millions) $2.2 $3.6 $2.0 Segment Earnings ($ in millions) $1.4 $2.1 $1.1 |

| Oil & Gas Market Conditions 13 Oil prices remain firm in anticipation of global demand (China & India) Natural gas prices pressured by elevated inventories and supply E&P companies drilling to hold leases and prove reserves vs. increasing lease acreage Gulf issues expected to negatively impact offshore oil & gas sector Forestar is well positioned to take advantage of improvements in oil and gas markets Crude Oil Spot Prices* Natural Gas Spot Prices* * Source: U.S. Energy Information Administration Actual Forecast Actual Forecast |

| 14 Mineral Resources Segment KPI's 3rd Qtr 2010 3rd Qtr 2009 2nd Qtr 2010 Leasing Activity Net Acres Leased 9,600 10,800 - Average Bonus / Acre $274 $1,465 - Royalties* Natural Gas Production (MMcf) 436.6 283.1 508.5 Average Price / Mcf $4.11 $3.35 $4.63 Oil Production (Barrels) 27,700 26,000 30,500 Average Price / Barrel $71.41 $62.78 $74.78 Total MMcfe 602.8 438.9 691.4 Average Price / Mcfe $6.26 $5.88 $6.70 Segment Revenues ($ in millions) $6.7 $18.8 $4.6 Segment Earnings ($ in millions) $6.2 $17.8 $4.3 Note: Includes our share of venture activity * Forestar share of venture production: 3rd Qtr 2010 = 138 MMcf; 3rd Qtr 2009 = 2 MMcf; 2nd Qtr 2010 = 181 MMcf |

| 2008 Bossier - Haynesville Drilling 15 Acres Leased Available for Lease Held by Production Haynesville Well Permits Haynesville Drilling Activity Producing Bssr-Hysv Wells Waiting on Completion Bossier - Haynesville Activity in East Texas & Louisiana 33 wells drilled & completed - 22 in Texas Note: Wells owned and operated by third-parties |
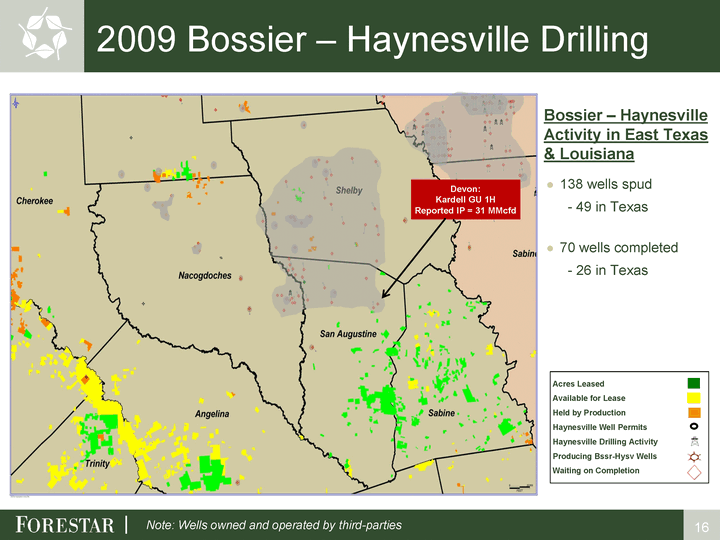
| 2009 Bossier - Haynesville Drilling 16 Devon: Kardell GU 1H Reported IP = 31 MMcfd Acres Leased Available for Lease Held by Production Haynesville Well Permits Haynesville Drilling Activity Producing Bssr-Hysv Wells Waiting on Completion Bossier - Haynesville Activity in East Texas & Louisiana 138 wells spud - 49 in Texas 70 wells completed - 26 in Texas Note: Wells owned and operated by third-parties |
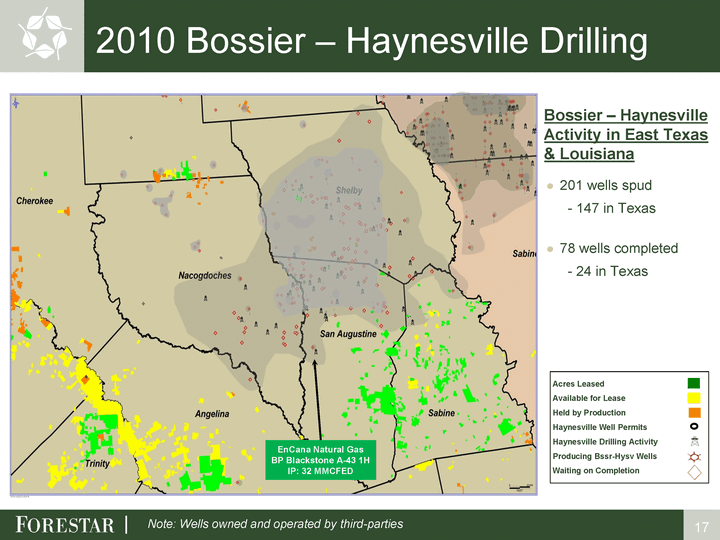
| 2010 Bossier - Haynesville Drilling 17 Acres Leased Available for Lease Held by Production Haynesville Well Permits Haynesville Drilling Activity Producing Bssr-Hysv Wells Waiting on Completion Bossier - Haynesville Activity in East Texas & Louisiana 201 wells spud - 147 in Texas 78 wells completed - 24 in Texas Note: Wells owned and operated by third-parties EnCana Natural Gas BP Blackstone A-43 1H IP: 32 MMCFED |

| Q3 2010 East Texas Minerals Activity 18 Note: Wells owned by third-party lessee / operator 39 rigs in the area 37 rigs drilling Bossier - Haynesville wells 45 wells drilled 76 wells waiting on completion Acres Leased Available for Lease Held by Production Haynesville Well Permits Haynesville Drilling Activity Producing Bssr-Hysv Wells Waiting on Completion Goodrich Petroleum Henderson 1H IP: 21.0 MMCFD on 22/64 Choke Exco Operating Owens 1H IP: 21.3 MMCFD on 28/64 Choke Bossier - Haynesville Activity in East Texas* * East Texas area includes Shelby, Sabine, San Augustine, Nacogdoches & Angelina counties EnCana Natural Gas BP Blackstone A-17 1H Spud 10/19/2010 Crimson Exploration Grizzly 1H IP: 10.2 MMCFD on 15/64 Choke ~31 MMCFD @ 38/64 Choke EOG Resources Murray Gas Unit 1H IP: 24.9 MMCFD on 25/64 Choke |

| Strategic Initiatives Progress ~110,000 acres sold - $181 million Positive cash flow - reduced investment in development & lower costs Reduced debt > $130 million Repurchased 1.0 million shares for $15 million Improved minerals transparency and disclosure ~60,000 acres actively marketed $22 million held by qualified 1031 intermediary for reinvestment in qualified real estate 19 |
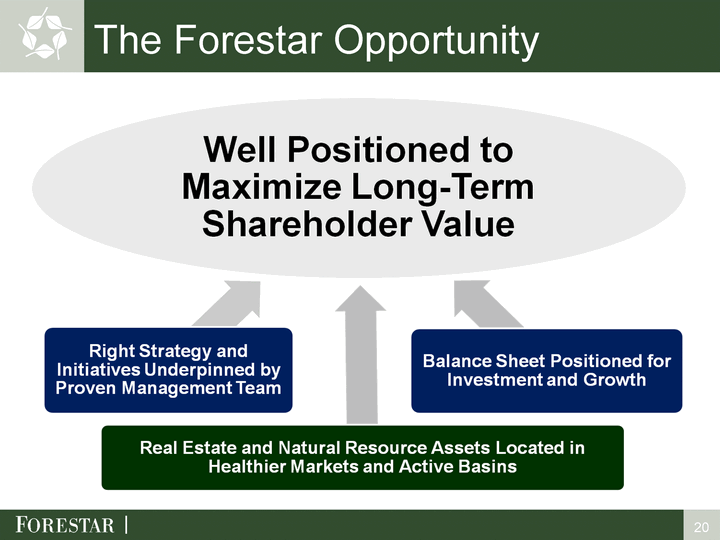
| 20 The Forestar Opportunity |

| 21 21 |
