Attached files
| file | filename |
|---|---|
| 8-K - 8-K - SMURFIT-STONE CONTAINER ENTERPRISES INC | a10-20022_18k.htm |
| EX-99.1 - EX-99.1 - SMURFIT-STONE CONTAINER ENTERPRISES INC | a10-20022_1ex99d1.htm |
| EX-99.3 - EX-99.3 - SMURFIT-STONE CONTAINER ENTERPRISES INC | a10-20022_1ex99d3.htm |
| EX-10.1 - EX-10.1 - SMURFIT-STONE CONTAINER ENTERPRISES INC | a10-20022_1ex10d1.htm |
Exhibit 99.2
|
|
Earnings Update Third Quarter 2010 Patrick J. Moore Chief Executive Officer Steven J. Klinger President & Chief Operating Officer Timothy T. Griffith Vice President, Investor Relations &Treasurer November 1, 2010 |
|
|
Forward-Looking Statements & Non-GAAP Measures This presentation contains statements and illustrations relating to future results, which are forward-looking statements as that term is defined in the Private Securities Litigation Reform Act of 1995. Actual results may differ materially from those projected as a result of certain risks and uncertainties, including but not limited to changes in general economic conditions, pricing in key product lines, seasonality, changes in input costs including recycled fiber and energy costs, as well as other risks and uncertainties described in the Company’s Annual Report on Form 10-K for the year ended December 31, 2009, as updated from time to time in the Company’s Securities and Exchange Commission filings. In this presentation, certain non-U.S. GAAP financial information is presented. A reconciliation of that information to U.S. GAAP financial measures and additional disclosure regarding our use of non-GAAP financial measures are included in the schedules that are a part of this presentation. The Company does not intend to review, revise or update any particular forward-looking statements in light of future events. |
|
|
Patrick J. Moore Chief Executive Officer |
|
|
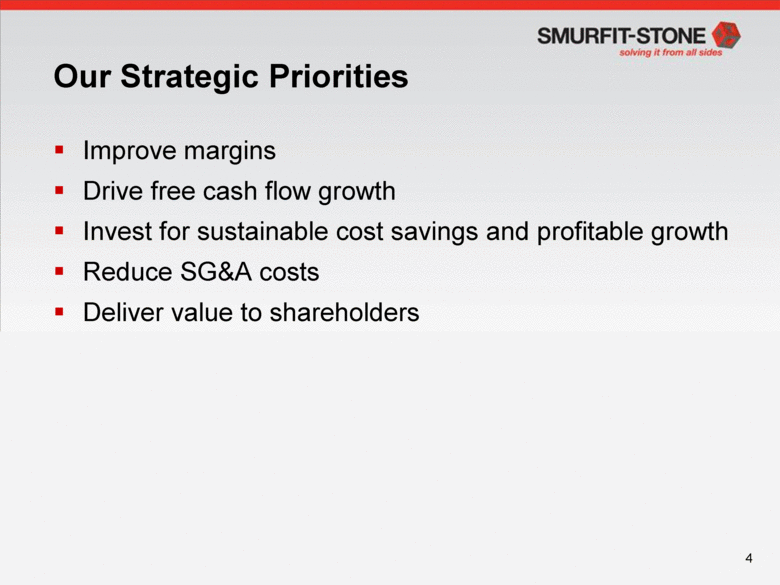
Our Strategic Priorities Improve margins Drive free cash flow growth Invest for sustainable cost savings and profitable growth Reduce SG&A costs Deliver value to shareholders |
|
|
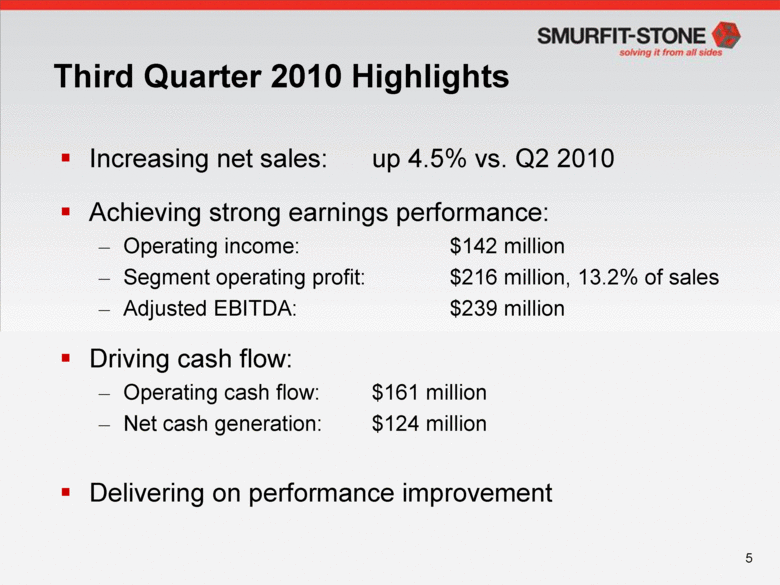
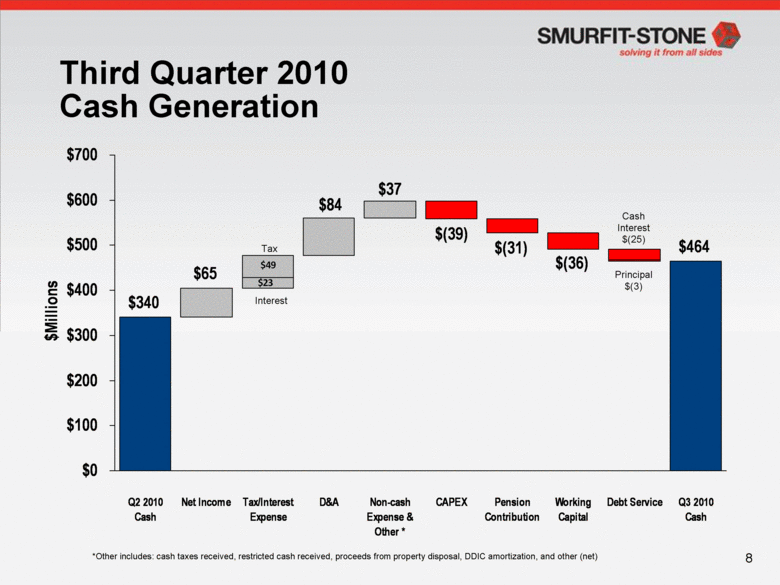
Third Quarter 2010 Highlights Increasing net sales: up 4.5% vs. Q2 2010 Achieving strong earnings performance: Operating income: $142 million Segment operating profit: $216 million, 13.2% of sales Adjusted EBITDA: $239 million Driving cash flow: Operating cash flow: $161 million Net cash generation: $124 million Delivering on performance improvement |
|
|
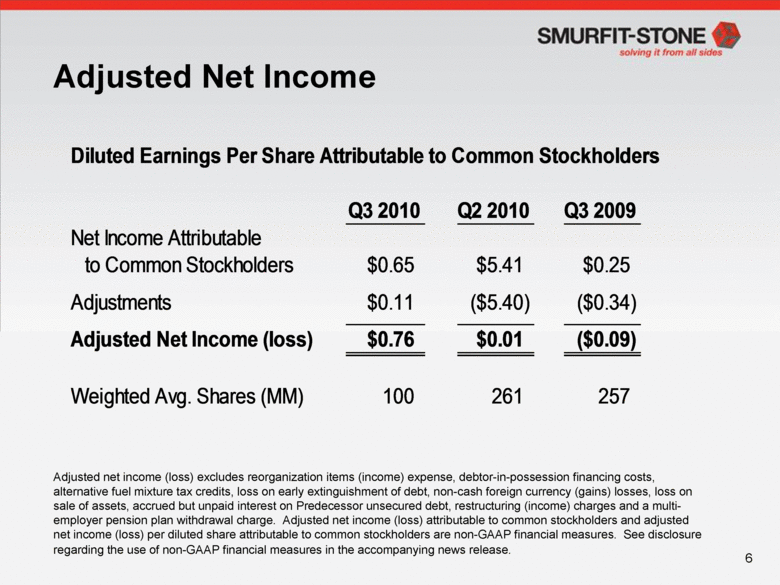
Adjusted Net Income Adjusted net income (loss) excludes reorganization items (income) expense, debtor-in-possession financing costs, alternative fuel mixture tax credits, loss on early extinguishment of debt, non-cash foreign currency (gains) losses, loss on sale of assets, accrued but unpaid interest on Predecessor unsecured debt, restructuring (income) charges and a multi-employer pension plan withdrawal charge. Adjusted net income (loss) attributable to common stockholders and adjusted net income (loss) per diluted share attributable to common stockholders are non-GAAP financial measures. See disclosure regarding the use of non-GAAP financial measures in the accompanying news release. Diluted Earnings Per Share Attributable to Common Stockholders Q3 2010 Q2 2010 Q3 2009 Net Income Attributable to Common Stockholders $0.65 $5.41 $0.25 Adjustments $0.11 ($5.40) ($0.34) Adjusted Net Income (loss) $0.76 $0.01 ($0.09) Weighted Avg. Shares (MM) 100 261 257 |
|
|
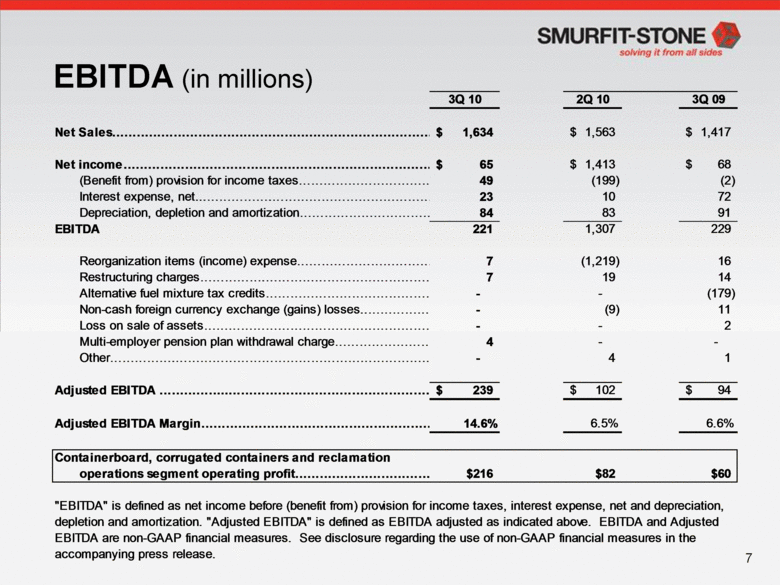
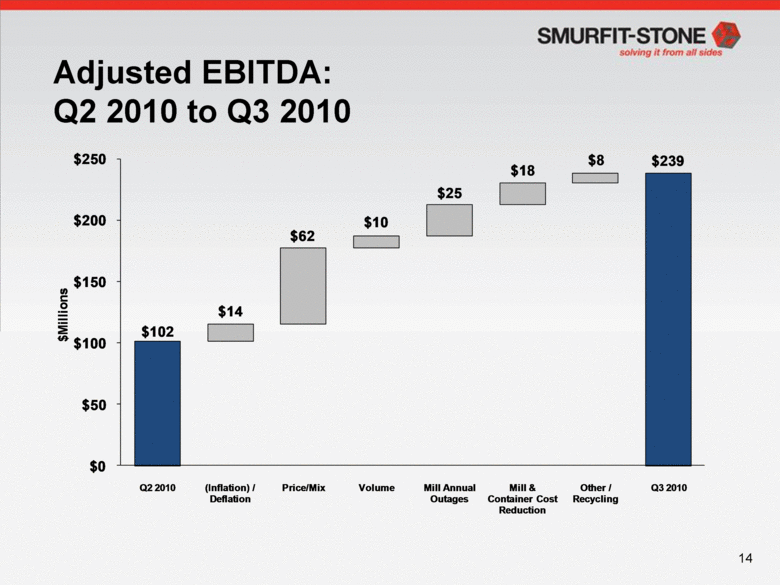
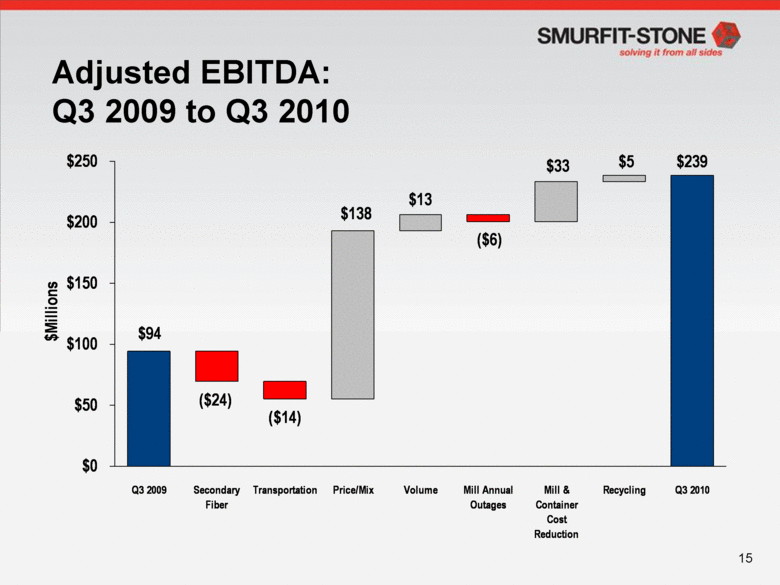
EBITDA (in millions) $60 $216 operations segment operating profit Containerboard, corrugated containers and reclamation 3Q 10 2Q 10 3Q 09 Net Sales $1,634 $1,563 $1,417 Net income $65 $1,413 $68 (Benefit from) provision for income taxes 49 (199) (2) Interest expense, net. 23 10 72 Depreciation, depletion and amortization 84 83 91 EBITDA 221 1,307 229 Reorganization items (income) expense 7 (1,219) 16 Restructuring charges 7 19 14 Alternative fuel mixture tax credits (179) Non-cash foreign currency exchange (gains) losses - (9) 11 Loss on sale of assets - 2 Multi-employer pension plan withdrawal charge 4 - - Other . - 4 1 Adjusted EBITDA $239 $102 $94 Adjusted EBITDA Margin 14.6% 6.5% 6.6% “EBITDA” is defined as net income before (benefit from) provision for income taxes, interest expense, net and depreciation, depletion and amortization. “Adjusted EBITDA” is defined as EBITDA adjusted as indicated above. EBITDA and Adjusted EBITDA are non-GAAP financial measures. See disclosure regarding the use of non-GAAP financial measures in the accompanying press release. |
|
|
Third Quarter 2010 Cash Generation Tax Interest *Other includes: cash taxes received, restricted cash received, proceeds from property disposal, DDIC amortization, and other (net) Principal $(3) Cash Interest $(25) $(31) $(36) $(39) $37 $84 $65 $340 $464 $49 $0 $100 $200 $300 $400 $500 $600 $700 Q2 2010 Cash Net Income Tax/Interest Expense D&A Non-cash Expense & Other * CAPEX Pension Contribution Working Capital Debt Service Q3 2010 Cash $Millions $23 |
|
|
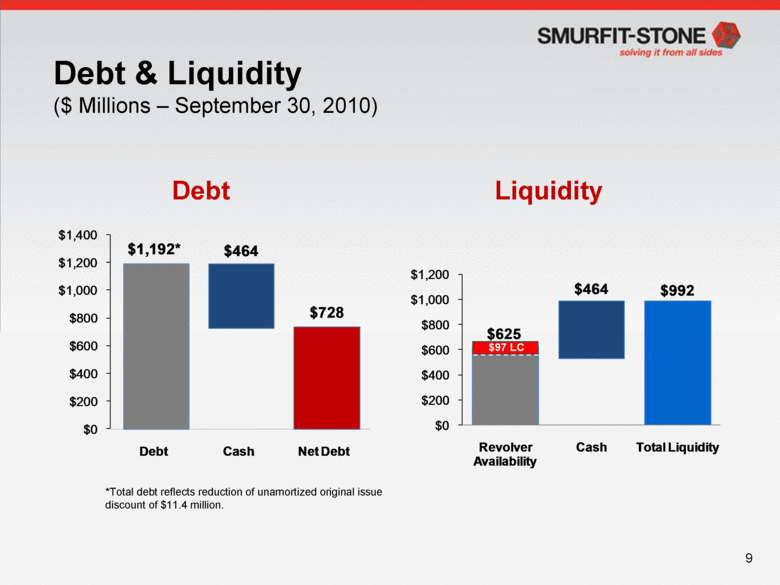
Debt & Liquidity ($ Millions – September 30, 2010) Liquidity Debt *Total debt reflects reduction of unamortized original issue discount of $11.4 million. $97 LC $625 $464 $992 $0 $200 $400 $600 $800 $1,000 $1,200 Revolver Availability Cash Total Liquidity $1,192* $464 $728 $0 $200 $400 $600 $800 $1,000 $1,200 $1,400 Debt Cash Net Debt |
|
|
Steven J. Klinger President & Chief Operating Officer |
|
|
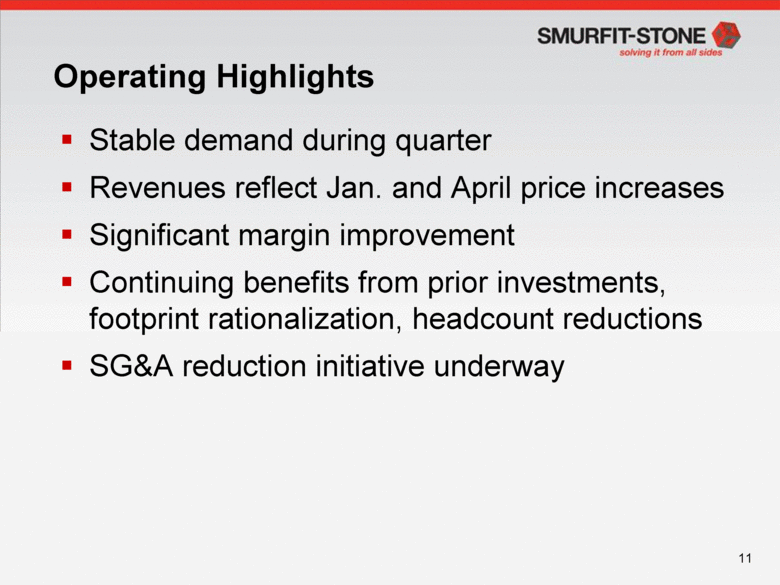
Operating Highlights Stable demand during quarter Revenues reflect Jan. and April price increases Significant margin improvement Continuing benefits from prior investments, footprint rationalization, headcount reductions SG&A reduction initiative underway |
|
|
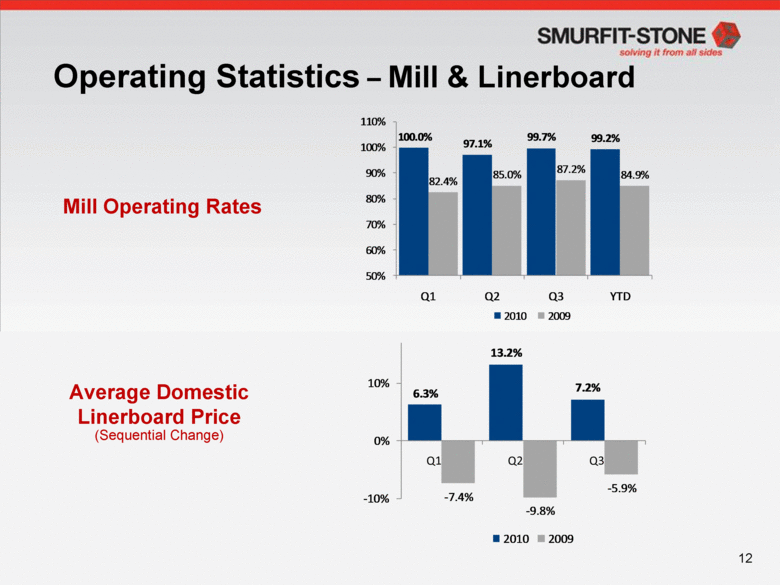
Operating Statistics – Mill & Linerboard Mill Operating Rates Average Domestic Linerboard Price (Sequential Change) 6.3% 13.2% 7.2% -7.4% -9.8% -5.9% -10% 0% 10% 2010 2009 110% 100.0% 99.7% 99.2% 97.1% 100% 90% 87.2% 85.0% 84.9% 82.4% 80% 70% 60% 50% Q1 Q2 Q3 YTD 2010 2009 |
|
|
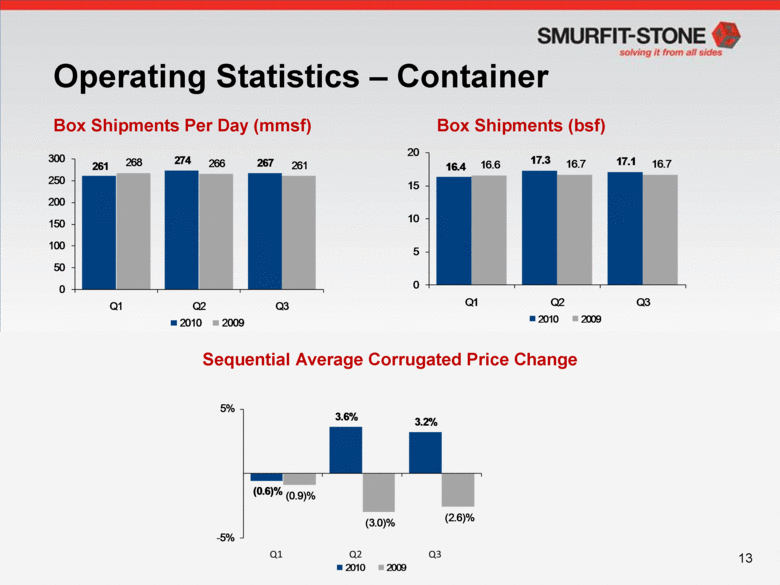
Operating Statistics – Container Box Shipments (bsf) Sequential Average Corrugated Price Change Box Shipments Per Day (mmsf) 16.4 17.3 17.1 16.6 16.7 16.7 0 5 10 15 20 Q1 Q2 Q3 2010 2009 (0.6)% 3.6% 3.2% (0.9)% (3.0)% (2.6)% - 5% 5% Q1 Q2 Q3 2010 2009 261 274 267 268 266 261 0 50 100 150 200 250 300 Q1 Q2 Q3 2010 2009 |
|
|
Adjusted EBITDA: Q2 2010 to Q3 2010 $102 $14 $10 $25 $18 $8 $239 $0 $50 $100 $150 $200 $250 Q2 2010 (Inflation) / Deflation Price/Mix Volume Mill Annual Outages Mill & Container Cost Reduction Other / Recycling Q3 2010 $Millions $62 |
|
|
Adjusted EBITDA: Q3 2009 to Q3 2010 $239 $5 $33 ($6) $13 $138 ($24) $94 ($14) $0 $50 $100 $150 $200 $250 Q3 2009 Secondary Fiber Transportation Price/Mix Volume Mill Annual Outages Mill & Container Cost Reduction Recycling Q3 2010 $Millions |
|
|
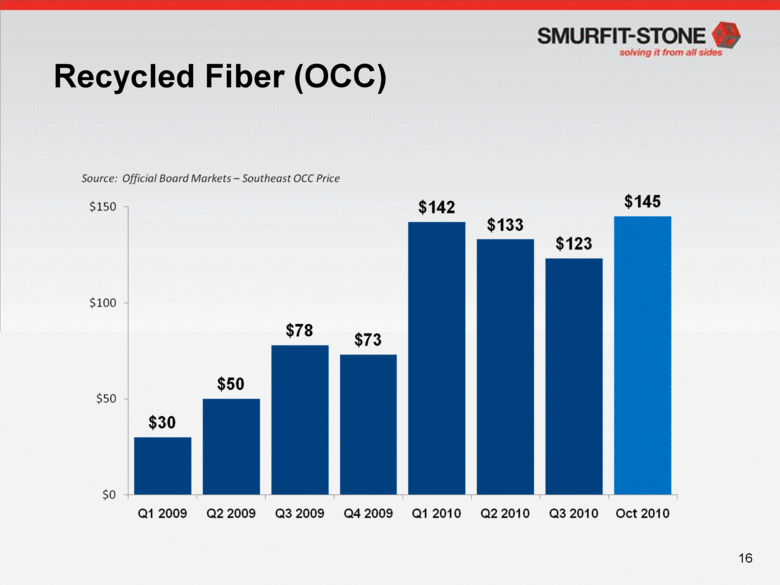
Recycled Fiber (OCC) Source: Official Board Markets – Southeast OCC Price $142 $145 $150 $133 $123 $100 $78 $73 $50 $50 $30 $0 Q1 2009 Q2 2009 Q3 2009 Q4 2009 Q1 2010 Q2 2010 Q3 2010 Oct 2010 |
|
|
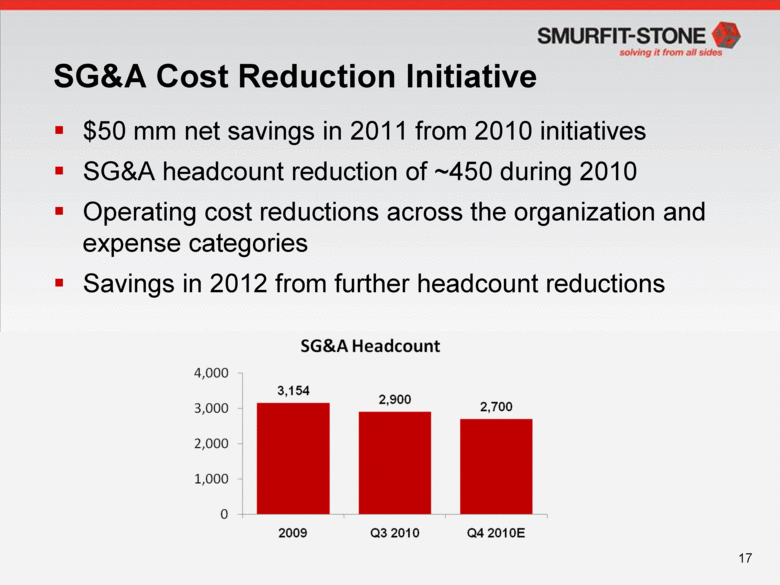
SG&A Cost Reduction Initiative $50 mm net savings in 2011 from 2010 initiatives SG&A headcount reduction of ~450 during 2010 Operating cost reductions across the organization and expense categories Savings in 2012 from further headcount reductions SG&A Headcount 4,000 3,154 2,900 3,000 2,700 2,000 1,000 0 2009 Q3 2010 Q4 2010E |
|
|
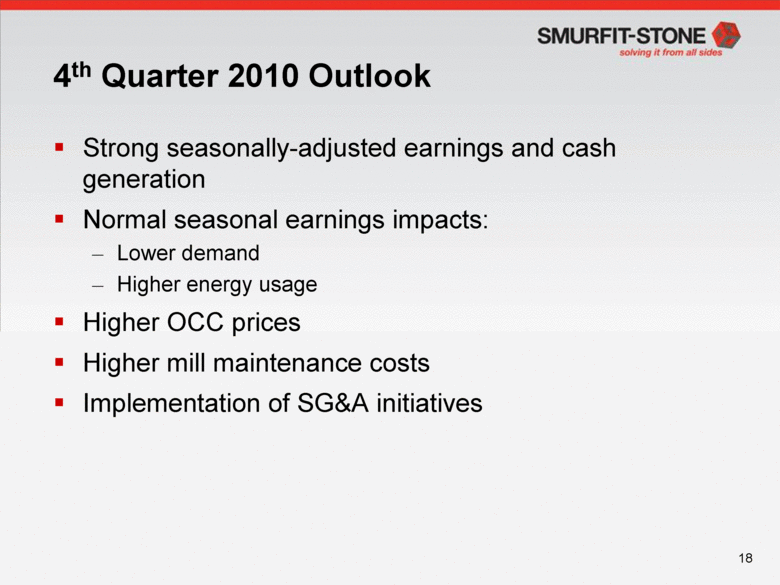
4th Quarter 2010 Outlook Strong seasonally-adjusted earnings and cash generation Normal seasonal earnings impacts: Lower demand Higher energy usage Higher OCC prices Higher mill maintenance costs Implementation of SG&A initiatives |
|
|
Questions & Discussion |
|
|
Appendix |
|
|
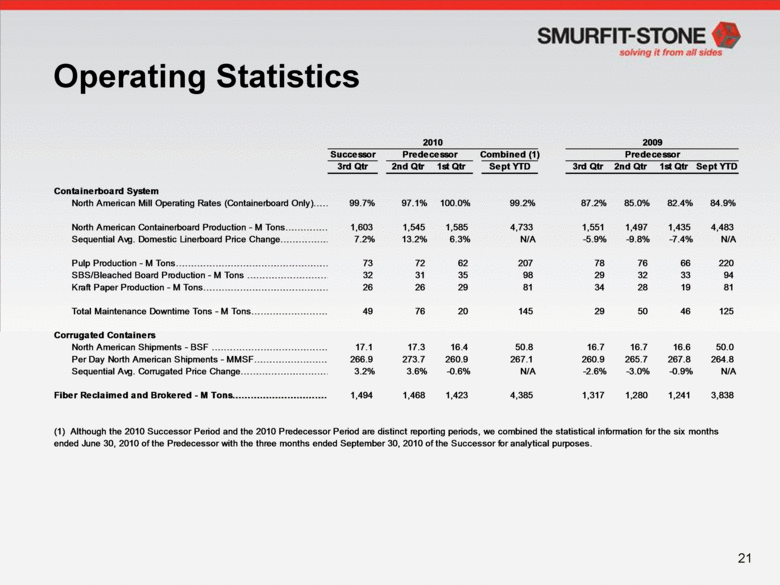
Operating Statistics Successor Combined (1) 3rd Qtr 2nd Qtr 1st Qtr Sept YTD 3rd Qtr 2nd Qtr 1st Qtr Sept YTD Containerboard System North American Mill Operating Rates (Containerboard Only) 99.7% 97.1% 100.0% 99.2% 87.2% 85.0% 82.4% 84.9% North American Containerboard Production - M Tons 1,603 1,545 1,585 4,733 1,551 1,497 1,435 4,483 Sequential Avg. Domestic Linerboard Price Change 7.2% 13.2% 6.3% N/A -5.9% -9.8% -7.4% N/A Pulp Production - M Tons 73 72 62 207 78 76 66 220 SBS/Bleached Board Production - M Tons 32 31 35 98 29 32 33 94 Kraft Paper Production - M Tons 26 26 29 81 34 28 19 81 Total Maintenance Downtime Tons - M Tons 49 76 20 145 29 50 46 125 Corrugated Containers North American Shipments - BSF 17.1 17.3 16.4 50.8 16.7 16.7 16.6 50.0 Per Day North American Shipments - MMSF 266.9 273.7 260.9 267.1 260.9 265.7 267.8 264.8 Sequential Avg. Corrugated Price Change 3.2% 3.6% -0.6% N/A -2.6% -3.0% -0.9% N/A Fiber Reclaimed and Brokered - M Tons 1,494 1,468 1,423 4,385 1,317 1,280 1,241 3,838 (1) Although the 2010 Successor Period and the 2010 Predecessor Period are distinct reporting periods, we combined the statistical information for the six months ended June 30, 2010 of the Predecessor with the three months ended September 30, 2010 of the Successor for analytical purposes. Predecessor Predecessor 2010 2009 |
|
|
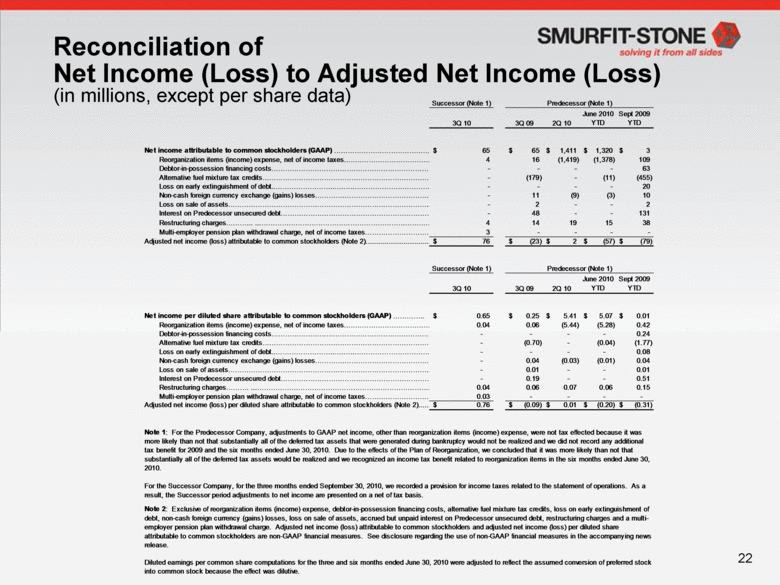
Reconciliation of Net Income (Loss) to Adjusted Net Income (Loss) (in millions, except per share data) Successor (Note 1) Predecessor (Note 1) 3Q 10 3Q 09 2Q 10 June 2010 YTD Sept 2009 YTD 65 $ 65 $ 1,411 $ 1,320 $ 3 $ Reorganization items (income) expense, net of income taxes.... 4 16 (1,419) (1,378) 109 Debtor-in-possession financing costs - - - - 63 Alternative fuel mixture tax credits - (179) - (11) (455) Loss on early extinguishment of debt........ - - - - 20 Non-cash foreign currency exchange (gains) losses.. - 11 (9) (3) 10 Loss on sale of assets.. - 2 - - 2 Interest on Predecessor unsecured debt - 48 - - 131 Restructuring charges... .... 4 14 19 15 38 Multi-employer pension plan withdrawal charge, net of income taxes.. 3 - - - - 76 $ (23) $ 2 $ (57) $ (79) $ Successor (Note 1) Predecessor (Note 1) 3Q 10 3Q 09 2Q 10 June 2010 YTD Sept 2009 YTD 0.65 $ 0.25 $ 5.41 $ 5.07 $ 0.01 $ Reorganization items (income) expense, net of income taxes.. 0.04 0.06 (5.44) (5.28) 0.42 Debtor-in-possession financing costs.. - - - - 0.24 Alternative fuel mixture tax credits - (0.70) - (0.04) (1.77) Loss on early extinguishment of debt......... - - - - 0.08 Non-cash foreign currency exchange (gains) losses. - 0.04 (0.03) (0.01) 0.04 Loss on sale of assets.. - 0.01 - - 0.01 Interest on Predecessor unsecured debt - 0.19 - - 0.51 Restructuring charges. ..... 0.04 0.06 0.07 0.06 0.15 Multi-employer pension plan withdrawal charge, net of income taxes.. 0.03 - - - - 0.76 $ (0.09) $ 0.01 $ (0.20) $ (0.31) $ Diluted earnings per common share computations for the three and six months ended June 30, 2010 were adjusted to reflect the assumed conversion of preferred stock into common stock because the effect was dilutive. Note 2 : Exclusive of reorganization items (income) expense, debtor-in-possession financing costs, alternative fuel mixture tax credits, loss on early extinguishment of debt, non-cash foreign currency (gains) losses, loss on sale of assets, accrued but unpaid interest on Predecessor unsecured debt, restructuring charges and a multi-employer pension plan withdrawal charge. Adjusted net income (loss) attributable to common stockholders and adjusted net income (loss) per diluted share attributable to common stockholders are non-GAAP financial measures. See disclosure regarding the use of non-GAAP financial measures in the accompanying news release. Net income attributable to common stockholders (GAAP) .. Adjusted net income (loss) attributable to common stockholders (Note 2)....................................... Net income per diluted share attributable to common stockholders (GAAP) .. Adjusted net income (loss) per diluted share attributable to common stockholders (Note 2)................................... Note 1 : For the Predecessor Company, adjustments to GAAP net income, other than reorganization items (income) expense, were not tax effected because it was more likely than not that substantially all of the deferred tax assets that were generated during bankruptcy would not be realized and we did not record any additional tax benefit for 2009 and the six months ended June 30, 2010. Due to the effects of the Plan of Reorganization, we concluded that it was more likely than not that substantially all of the deferred tax assets would be realized and we recognized an income tax benefit related to reorganization items in the six months ended June 30, 2010. For the Successor Company, for the three months ended September 30, 2010, we recorded a provision for income taxes related to the statement of operations. As a result, the Successor period adjustments to net income are presented on a net of tax basis. |

