Attached files
| file | filename |
|---|---|
| 8-K - FORM 8K - PPL Corp | form8k.htm |
| EX-99.1 - EXHIBIT 99.1 - PPL Corp | form8k-exhibit99_1.htm |

EEI Financial Conference
Palm Desert, CA
October 31 - November 3, 2010
© PPL Corporation 2010
Exhibit 99.2

© PPL Corporation 2010
2
Cautionary Statements and Factors
That May Affect Future Results
That May Affect Future Results
Any statements made in this presentation about future operating results or other future events are forward-looking statements under the Safe Harbor Provisions of the Private Securities Litigation Reform Act of 1995. Actual results may differ materially from such forward-looking statements. A discussion of factors that could cause actual results or events to vary is contained in the Appendix to this presentation and in the Company’s SEC filings.

© PPL Corporation 2010
3
Recent Developments
§ Close of LG&E, KU Transaction
§ Pending sale of non-core assets
§ Favorable ALJ recommendation in PA rate case

© PPL Corporation 2010
4
*Based on closing stock price on 10/26/2010
The New PPL
§ Significantly larger regulated business
– Expected to be 55-60 percent of total EBITDA next year
– Very positive regulatory relationships
– LG&E, KU add regulated generation, improving diversity
§ Substantial Capex spending in regulated businesses
– $3 billion from 2011 to 2014
– Replacing aging infrastructure
§ Excellent competitive market generating fleet
– Nuclear, hydro, efficient coal
– Well-positioned when electricity prices recover
– Successes in the retail markets
§ Solid dividend
– 5.2 percent yield*
§ Today’s PPL now more attractive than ever
– Retain generation-related upside
– Solid earnings - as well as growth - from regulated business

© PPL Corporation 2010
5
Scrubbers at Montour
Holtwood Hydro Expansion Project
PPL: Making the Right Calls in Challenging Markets
§ Sale of Latin American operations
§ Early mover on scrubbers - significant savings
§ Successful competitive market transition in Pennsylvania
§ Hedging strategy captured $2.5 billion in value
§ Expansion of existing hydro & nuclear facilities
§ UK rate decision - best in class
§ LG&E, KU Acquisition

© PPL Corporation 2010
6
Pennsylvania Rate Request
§ $77.5 million settlement approved by ALJ’s
Recommended Decision
Recommended Decision
§ Rate design recommendation accepts PPL
Electric’s proposals
Electric’s proposals
§ Lower generation prices should offset increase
§ Final PUC decision expected in mid-December
§ New rates effective January 1, 2011
© PPL Corporation 2010
7
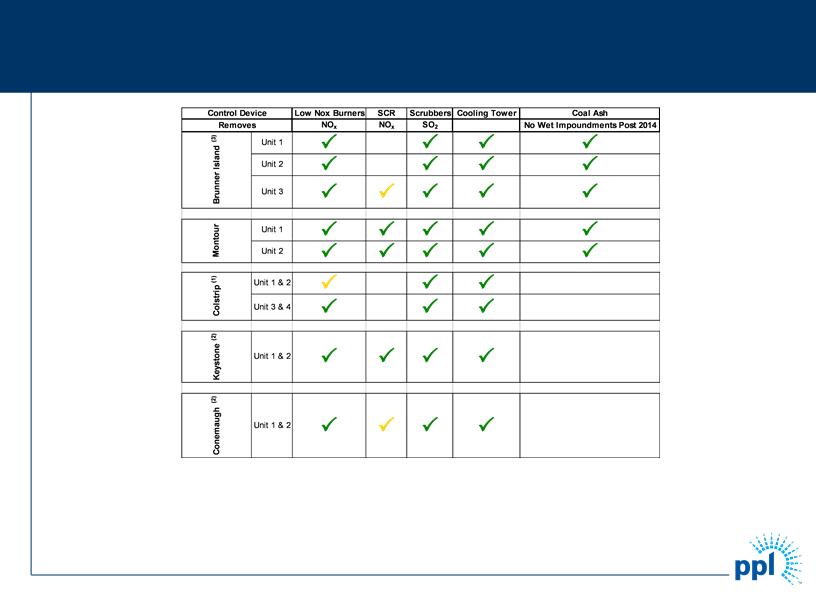
PPL has complied with current environmental regulations on a proactive basis
(1) Colstrip is located in Montana
(2) Keystone & Conemaugh: PPL is a minority owner and does not operate
(3) Brunner Island’s cooling towers are once-through but may be converted to closed-loop
P= Installed
P = Potential
Environmental Control Equipment Positions PPL Favorably
for Future Regulation
for Future Regulation

© PPL Corporation 2010
8
Company Well-positioned on Developing
Environmental Issues
Environmental Issues
§ Carbon legislation could be net benefit
– Competitive fleet with a good mix of fuel
– Very good prospects for recovery of cost to
comply in regulated facilities
comply in regulated facilities
§ Working toward reasonable rulemaking for fossil
fleet regulations
fleet regulations
© PPL Corporation 2010
9
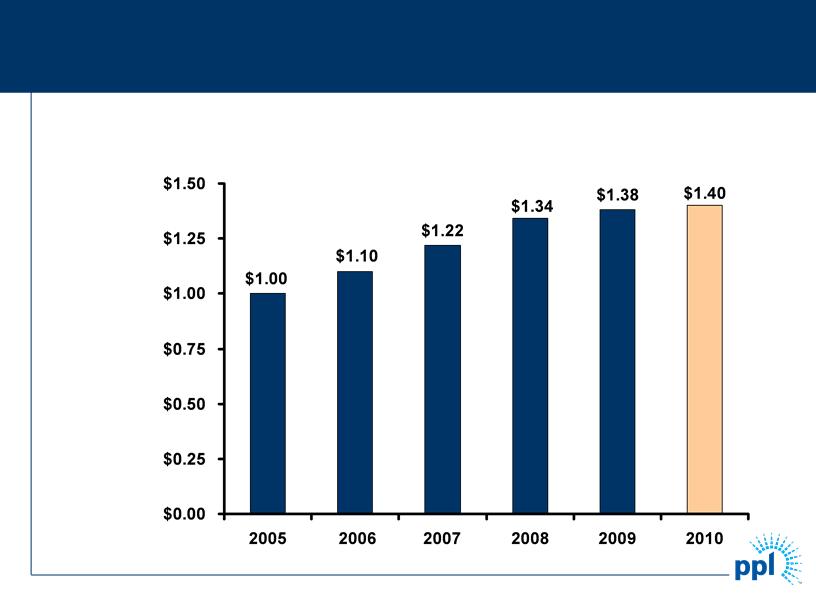
$/Share
Annualized
Dividend Profile

© PPL Corporation 2010
© PPL Corporation 2010
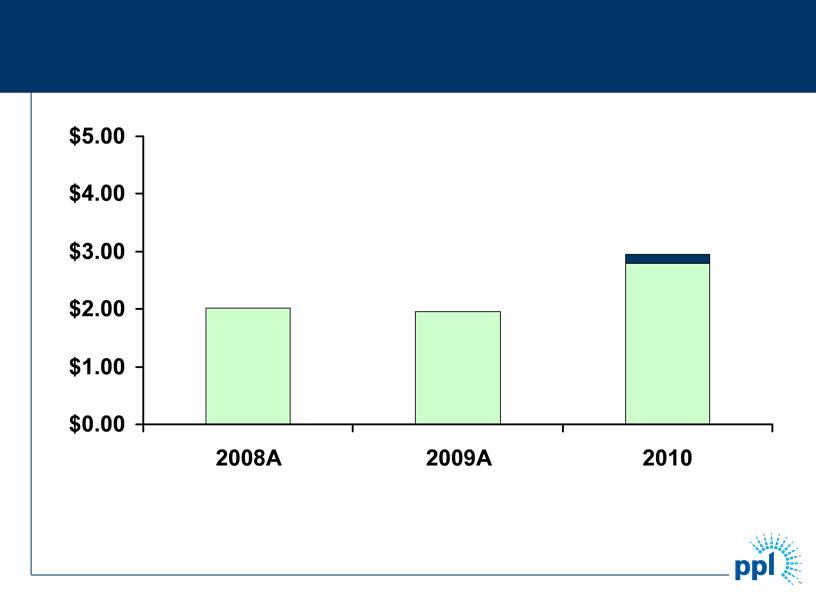
Forecast (1)
$2.02
Per Share
$1.95
$2.95
Note: See Appendix for the reconciliation of earnings from ongoing operations to reported earnings.
(1) (1) Adjusted for share dilution, but excludes KY utility operations operating results for November and December
$2.80
A-1
Strong Expected Earnings Growth
© PPL Corporation 2010
A-2
|
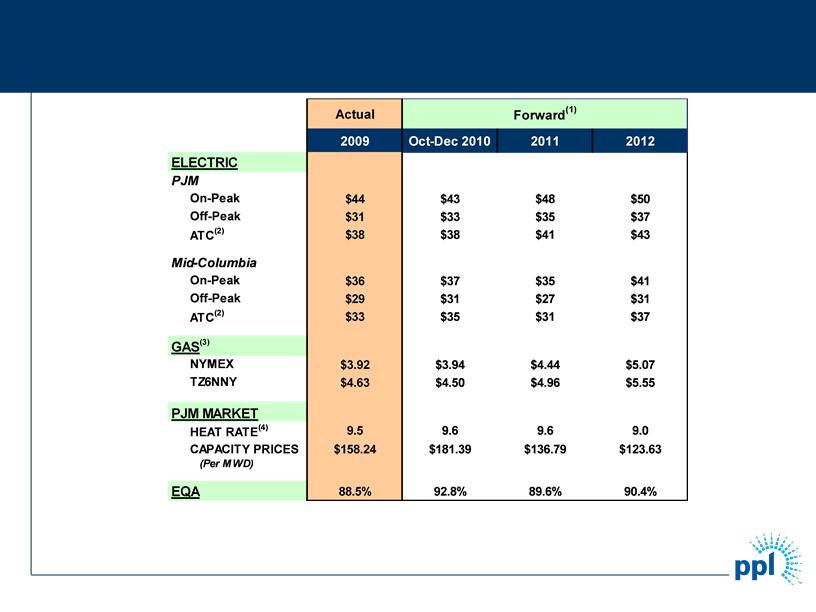
(1)
|
Market prices based on the average of broker quotes as of 9/30/2010
|
|
(2)
|
24-hour average
|
|
(3)
|
NYMEX and TZ6NNY forward gas prices on 9/30/2010
|
|
(4)
|
Market Heat Rate = PJM on-peak power price divided by TZ6NNY gas price
|
Market Prices
Market Prices ELECTRIC PJM On-Peak Off-Peak ATC(2) Mid-Columbia On-Peak Off-Peak ATC(2) GAS(3) NYMEX TZ6NNY PJM MARKET HEAT RATE(4) CAPACITY PRICES (Per MWD) EQA Actual 2009 Oct-Dec 2010 2011 2012 $44 $43 $48 $50 $31 $33 $35 $37 $38 $38 $41 $43 $36 $37 $35 $41 $29 $31 $27 $31 $33 $35 $31 $37 $3.92 $3.94 $4.44 $5.07 $4.63 $4.50 $4.96 $5.55 9.5 9.6 9.6 9.0 $158.24 $181.39 $136.79 $123.63 88.5% 92.8% 89.6% 90.4% Forward(1) (1) Market prices based on the average of broker quotes as of 9/30/2010 (2) 24-hour average (3) NYMEX and TZ6NNY forward gas prices on 9/30/2010 (4) Market Heat Rate = PJM on-peak power price divided by TZ6NNY gas price © PPL Corporation 2010 A-2

© PPL Corporation 2010
As of October 20, 2010
*Represents expected sales based on current business plan assumptions
**Represents energy, capacity, congestion and other revenues
|
|
|
|
2010
|
|
2011
|
|
2012
|
|
Baseload
|
|
|
|
|
|
|
|
|
Expected Generation* (Million MWhs)
|
|
|
50.3
|
|
51.4
|
|
54.7
|
|
East
|
|
|
41.7
|
|
43.1
|
|
46.2
|
|
West
|
|
|
8.6
|
|
8.3
|
|
8.5
|
|
|
|
|
|
|
|
|
|
|
Current Hedges (%)
|
|
|
100%
|
|
97%
|
|
68%
|
|
East
|
|
|
100%
|
|
98%
|
|
63%
|
|
West
|
|
|
100%
|
|
94%
|
|
94%
|
|
|
|
|
|
|
|
|
|
|
Average Hedged Price (Energy Only) ($/MWh)
|
|
|
$59
|
|
$56
|
|
$58
|
|
East
|
|
|
$60
|
|
$56
|
|
$59
|
|
West
|
|
|
$50
|
|
$54
|
|
$54
|
|
|
|
|
|
|
|
|
|
|
Expected Average Price (Fully Loaded) ($/MWh)
|
|
|
$68
|
|
$61
|
|
$62
|
|
East**
|
|
|
$71
|
|
$63
|
|
$64
|
|
West
|
|
|
$50
|
|
$54
|
|
$54
|
|
|
|
|
|
|
|
|
|
|
% Hedged Through Swaps/Options Energy Transactions
|
|
|
97%
|
|
96%
|
|
67%
|
|
% Hedged Through Load-following Transactions
|
|
|
3%
|
|
1%
|
|
1%
|
|
Intermediate/Peaking
|
|
|
|
|
|
|
|
|
Expected Generation (Million MWhs)
|
|
|
6.7
|
|
5.3
|
|
5.3
|
|
Current Hedges (%)
|
|
|
87%
|
|
1%
|
|
0%
|
A-3
Supply Segment Asset Hedge Positions

© PPL Corporation 2010
Note: As of September 30, 2010
(1) Weighted Average $/ton at mine for east wholly owned plants; excludes Keystone & Conemaugh
|
|
2010
|
2011
|
2012
|
|||
|
|
Hedge
Level |
Price
|
Hedge
Level |
Price
|
Hedge
Level |
Price
|
|
% Fixed Base
Price |
93%
|
$49
|
96%
|
$52
|
32%
|
$64
|
|
% Collars
|
0%
|
N/A
|
0%
|
N/A
|
68%
|
$45-$52
|
|
% Diesel
Surcharge |
7%
|
$45
|
4%
|
$45
|
0%
|
N/A
|
Eastern Coal Contracts (1)
|
|
2010
|
2011
|
2012
|
|
Uranium
|
100%
|
100%
|
100%
|
|
Coal
|
|
|
|
|
East
|
100%
|
98%
|
95%
|
|
West
|
100%
|
100%
|
100%
|
|
Total
|
100%
|
99%
|
96%
|
A-4
Current Fuel Contracts - Base Prices
© PPL Corporation 2010
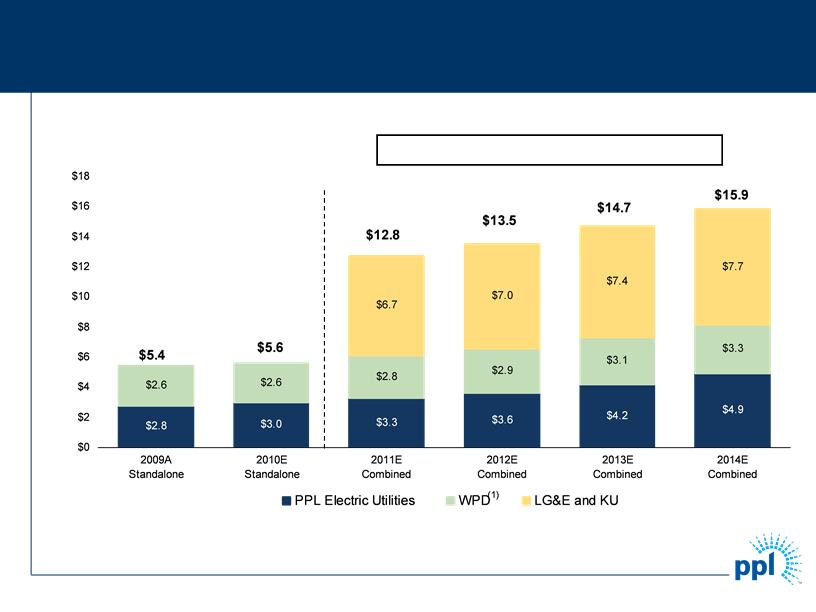
Note: Represents capitalization for E.ON US since LG&E and KU rate constructs are based on capitalization.
(1) Figures based on assumed exchange rate of $1.60 / GBP.
($ in billions)
2011E - 2014E CAGR: 7.5%
A-5
Increased Scale with Continued Growth
© PPL Corporation 2010
A-6
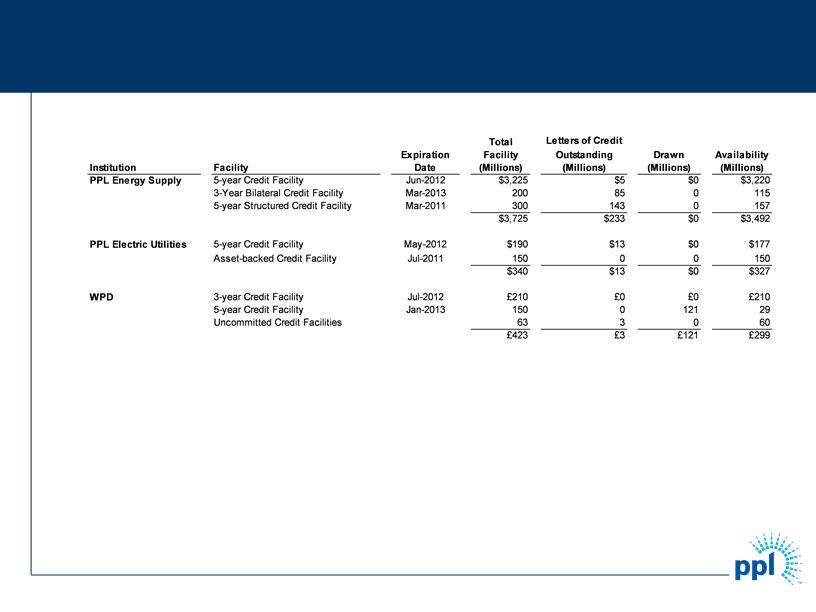
Liquidity Profile
Amounts reported above are as of September 30, 2010. Effective October 19, PPL Energy Supply’s $3.2 billion credit facility was terminated and a new $4 billion credit facility was made effective. With these changes, domestic facilities consist of a diverse bank group, with no bank and its affiliates providing an aggregate commitment of more than 12% of the total committed capacity.
quidity Profile Total Letters of Credit Expiration Facility Outstanding Drawn Availability Institution Facility Date (Millions) (Millions) (Millions) (Millions) PPL Energy Supply 5-year Credit Facility Jun-2012 $3,225 $5 $0 $3,220 3-Year Bilateral Credit Facility Mar-2013 200 85 0 115 5-year Structured Credit Facility Mar-2011 300 143 0 157 $3,725 $233 $0 $3,492 PPL Electric Utilities 5-year Credit Facility May-2012 $190 $13 $0 $177 Asset-backed Credit Facility Jul-2011 150 0 0 150 $340 $13 $0 $327 WPD 3-year Credit Facility Jul-2012 £210 £0 £0 £210 5-year Credit Facility Jan-2013 150 0 121 29 Uncommitted Credit Facilities 63 3 0 60 £423 £3 £121 £299 A-6
© PPL Corporation 2010
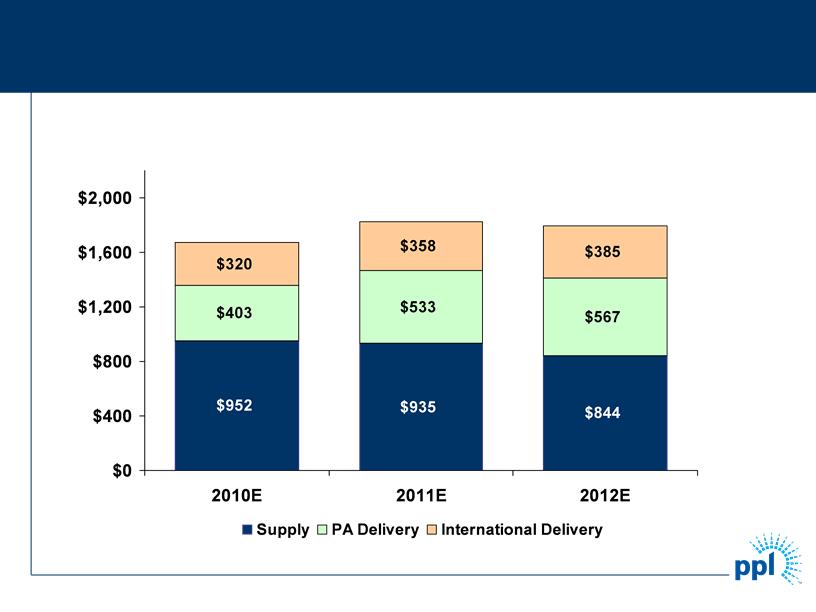
Millions
$1,675
$1,826
$1,796
A-7
Capital Expenditures by Segment
© PPL Corporation 2010
A-8
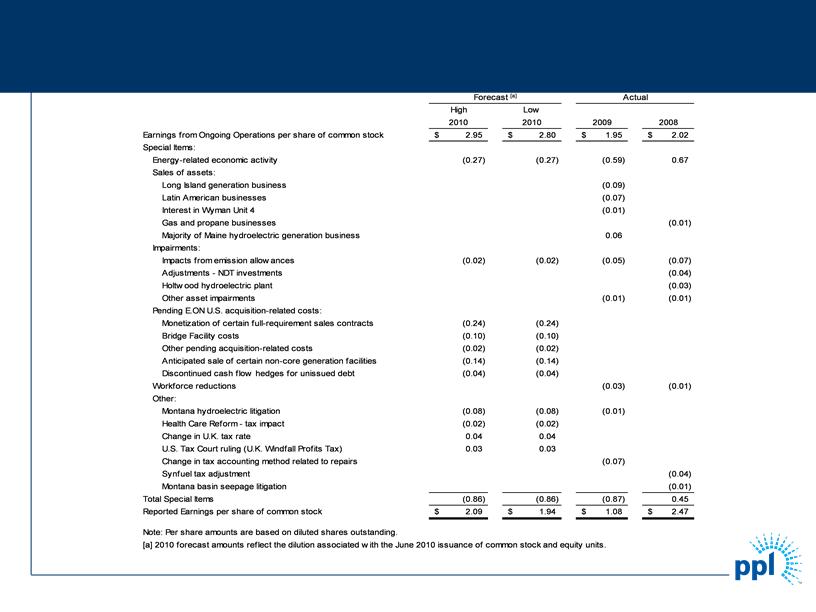
Reconciliation of PPL’s Earnings from Ongoing
Operations to Reported Earnings
Operations to Reported Earnings
Reconciliation of PPL’s Earnings from Ongoing Operations to Reported Earnings Forecast [a] Actual High Low 2010 2010 2009 2008 Earnings from Ongoing Operations per share of common stock 2.95 $ $ 2.80 1.95 $ $ 2.02 Special Items: Energy-related economic activity (0.27) (0.27) (0.59) 0.67 Sales of assets: Long Island generation business (0.09) Latin American businesses (0.07) Interest in Wyman Unit 4 (0.01) Gas and propane businesses (0.01) Majority of Maine hydroelectric generation business 0.06 Impairments: Impacts from emission allow ances (0.02) (0.02) (0.05) (0.07) Adjustments - NDT investments (0.04) Holtw ood hydroelectric plant (0.03) Other asset impairments (0.01) (0.01) Pending E.ON U.S. acquisition-related costs: Monetization of certain full-requirement sales contracts (0.24) (0.24) Bridge Facility costs (0.10) (0.10) Other pending acquisition-related costs (0.02) (0.02) Anticipated sale of certain non-core generation facilities (0.14) (0.14) Discontinued cash flow hedges for unissued debt (0.04) (0.04) Workforce reductions (0.03) (0.01) Other: Montana hydroelectric litigation (0.08) (0.08) (0.01) Health Care Reform - tax impact (0.02) (0.02) Change in U.K. tax rate 0.04 0.04 U.S. Tax Court ruling (U.K. Windfall Profits Tax) 0.03 0.03 Change in tax accounting method related to repairs (0.07) Synfuel tax adjustment (0.04) Montana basin seepage litigation (0.01) Total Special Items (0.86) (0.86) (0.87) 0.45 Reported Earnings per share of common stock 2.09 $ $ 1.94 1.08 $ $ 2.47 Note: Per share amounts are based on diluted shares outstanding. [a]2010 forecast amounts reflect the dilution associated with the June 2010 issuance of common stock and equity units. © PPL Corporation 2010 A-8

© PPL Corporation 2010
© PPL Corporation 2010
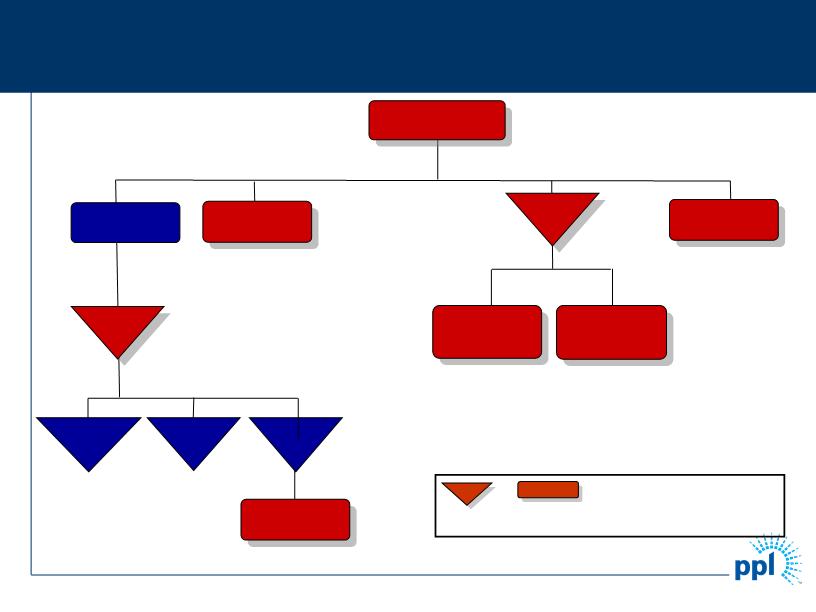
- Rated Entity / Securities Issuer
Corp.
or
PPL Corporation
PPL Energy
Funding Corp.
Funding Corp.
PPL Energy
Supply,
LLC
LLC
PPL
Global,
Global,
LLC
PPL
Energy
Energy
Plus, LLC
PPL
Generation,
Generation,
LLC
WPD Entities
Louisville Gas &
Electric
Company
Electric
Company
Kentucky
Utilities
Company
Utilities
Company
PPL Capital
Funding, Inc.
Funding, Inc.
Post-Acquisition Structure
Kentucky
Holdings,
LLC
LLC
LLC
A-9
PPL Electric
Utilities Corp.
Utilities Corp.

© PPL Corporation 2010
|
Net Common Stock Proceeds
|
$ 2,409
|
|
Net Proceeds from Equity Unit Securities
|
1,116
|
|
Net Pollution Control Revenue Bonds (Assumed)
|
762
|
|
E.ON U.S. Capital MTN’s (Assumed)
|
2
|
|
Cash on hand
|
101
|
|
Draws under PPL Energy Supply credit facility and loans
to Kentucky holding company and utility subsidiaries to pay off debt owed to E.ON affiliates |
3,200
|
|
Total owed to E.ON AG at closing
|
7,590
|
|
Less: Net Debt Assumed
|
(764)
|
|
Net Proceeds to E.ON AG
|
$ 6,826
|
|
|
|
(1)
(1) Consists of $925 million of Pollution Control Revenue Bonds (“PCRB”) less $163 million of PCRBs that
are currently being held for future remarketing
are currently being held for future remarketing
Sources of Acquisition Financing
A-10
Sources of Acquisition Financing
($ in Millions)

© PPL Corporation 2010
A-11
Permanent Financing
§ Subsequent to the closing, the Credit Facility draws and
loans will be repaid through the issuance by the Kentucky
companies of a combination of unsecured debt, First
Mortgage Bonds and remarketed Pollution Control
Revenue Bonds.
loans will be repaid through the issuance by the Kentucky
companies of a combination of unsecured debt, First
Mortgage Bonds and remarketed Pollution Control
Revenue Bonds.
§ To mitigate interest rate risk, PPL has hedged $2.1 billion
of the approximately $3 billion of debt to be issued.
of the approximately $3 billion of debt to be issued.
© PPL Corporation 2010
A-12
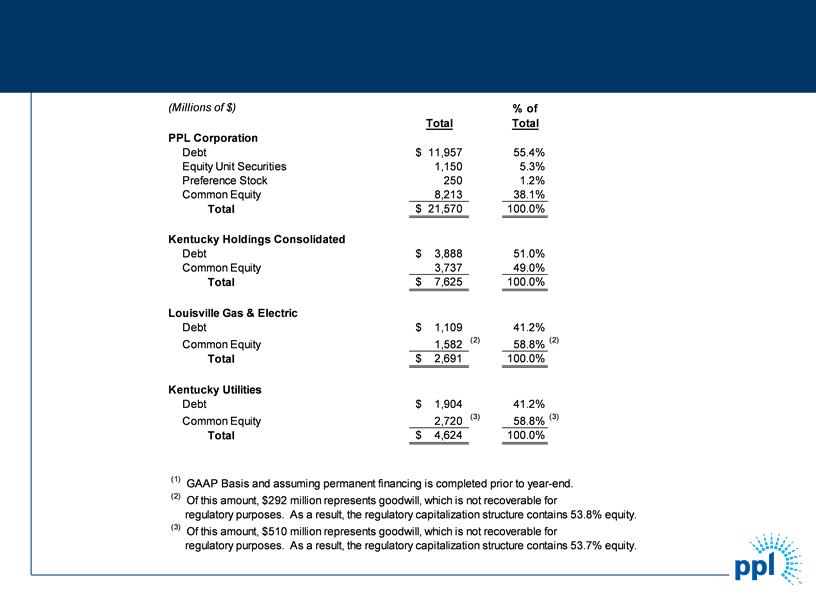
Projected Capitalization Structures at 12/31/2010 (1)
Projected Capitalization Structures at 12/31/2010 (1) (Millions of $) Total PPL Corporation Debt $ 11,957 Equity Unit Securities 1,150 Preference Stock 250 Common Equity 8,213 Total $ 21,570 Kentucky Holdings Consolidated Debt $ 3,888 Common Equity 3,737 Total $ 7,625 Louisville Gas & Electric Debt $ 1,109 Common Equity 1,582 Total $ 2,691 Kentucky Utilities Debt $ 1,904 Common Equity 2,720 Total $ 4,624 % of Total 55.4% 5.3% 1.2% 38.1% 100.0% 51.0% 49.0% 100.0% 41.2% (2) (2) 58.8% 100.0% 41.2% (3) (3) 58.8% 100.0% (1) GAAP Basis and assuming permanent financing is completed prior to year-end. (2) Of this amount, $292 million represents goodwill, which is not recoverable for regulatory purposes. As a result, the regulatory capitalization structure contains 53.8% equity. (3) Of this amount, $510 million represents goodwill, which is not recoverable for regulatory purposes. As a result, the regulatory capitalization structure contains 53.7% equity. © PPL Corporation 2010 A-12
© PPL Corporation 2010
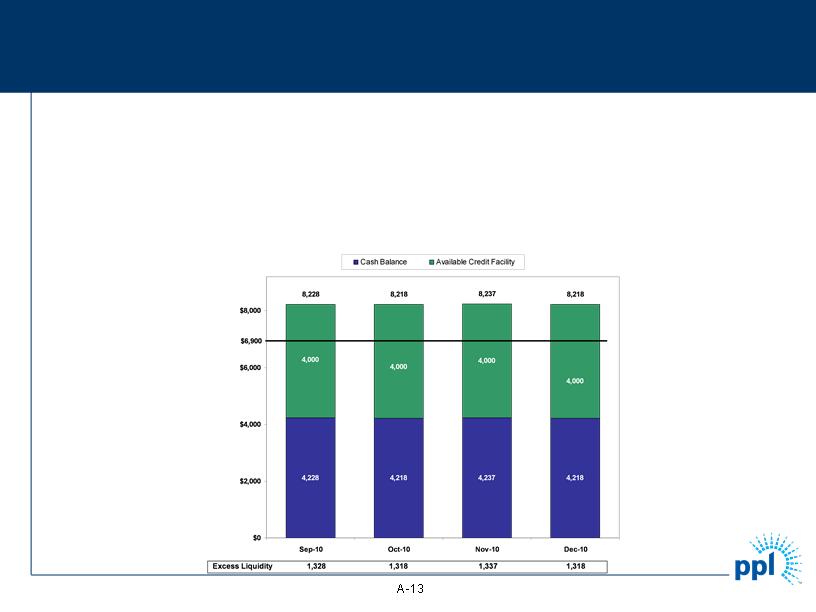
Liquidity Position
§ PPL has drawn on PPL Energy Supply’s new $4 billion credit facility
– PPL borrowed $3.2 billion under this facility for the acquisition closing in order to make loans to KU, LGE and the
Kentucky holding company on the closing date so that those companies could repay loans due to E.ON affiliates at
closing.
Kentucky holding company on the closing date so that those companies could repay loans due to E.ON affiliates at
closing.
– Subsequent to the closing, the Credit Facility draws and loans will be repaid through the issuance by the Kentucky
holding company and/or its subsidiaries of a combination of unsecured debt, First Mortgage Bonds and remarketed
Pollution Control Revenue Bonds.
holding company and/or its subsidiaries of a combination of unsecured debt, First Mortgage Bonds and remarketed
Pollution Control Revenue Bonds.
– The following graph shows PPL Energy Supply’s current projected liquidity position (Millions of $) compared to the net
funds of $6.9 billion required at closing.
funds of $6.9 billion required at closing.
© PPL Corporation 2010
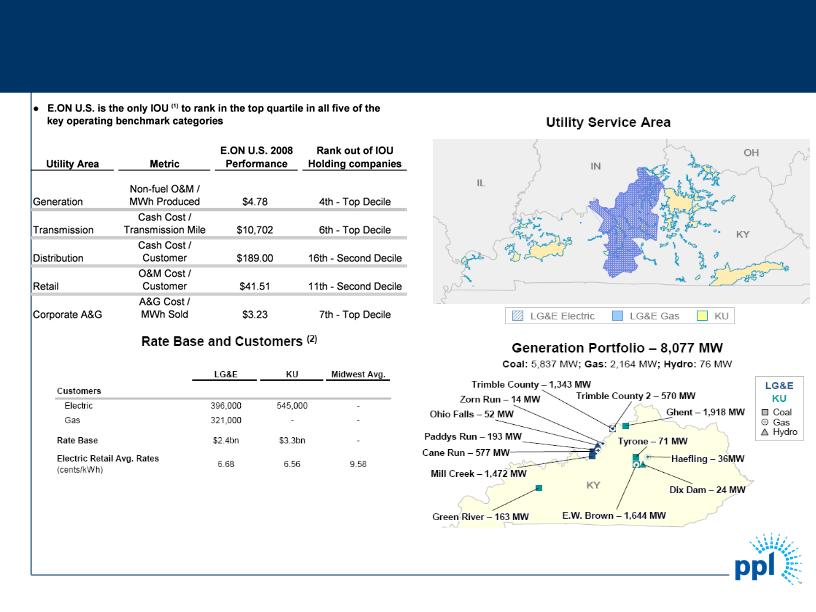
(3)
(1) Based on 52 U.S. electric IOU holding companies
(2) Figures as of 2008
(3) In-service summer 2010
A-14
Overview of the Acquired Utilities
Overview of the Acquired Utilities . E.ON U.S. is the only IOU (1) to rank in the top quartile in all five of the key operating benchmark categories E.ON U.S. 2008 Rank out of IOU Utility Area Metric Performance Holding companies Generation Transmission Distribution Non-fuel O&M / MWh Produced Cash Cost / Transmission Mile Cash Cost / Customer $4.78 $10,702 $189.00 4th - Top Decile 6th - Top Decile 16th - Second Decile Retail O&M Cost / Customer $41.51 11th - Second Decile Corporate A&G A&G Cost / MWh Sold $3.23 7th - Top Decile (3) (1) Based on 52 U.S. electric IOU holding companies (2) Figures as of 2008 (3) In-service summer 2010 © PPL Corporation 2010 A-14

© PPL Corporation 2010
2010 Kentucky Rate Case
• July 2010 - KPSC issued an order approving all provisions in the stipulation with rates
effective August 1, 2010.
effective August 1, 2010.
• ROE range in KPSC order was 9.75% - 10.75% with ECR rate approved at 10.63%.
• No requests or appeals for a rehearing were filed - rates are final.
|
|
|
Per January 2010
Request |
|
Per June 2010
Stipulation
|
|
LG&E annual base electric rate increase
|
$95 million
|
|
$74 million
|
|
|
LG&E annual gas rate increase
|
|
$23 million
|
|
$17 million
|
|
KU annual base electric rate increase
|
|
$135 million
|
|
$98 million
|
|
ROE
|
|
11.50%
|
|
10.25 - 10.75%
|
|
Recovery of wind and ice storm costs
|
|
Amortize over 5
years |
|
Amortize over 10 years
|
|
|
|
|
|
|
A-15

© PPL Corporation 2010
Kentucky Change of Control Settlement
• Resolved issues with all parties to the Kentucky
Change of Control case
Change of Control case
• Key Provisions
− LG&E and KU agreed not to seek base rate
adjustment that would become effective prior to
January 1, 2013
adjustment that would become effective prior to
January 1, 2013
− Normal fuel cost adjustments and environmental
cost recovery mechanism adjustments continue
cost recovery mechanism adjustments continue
− Earnings in excess of 10.75% ROE are shared
equally between ratepayer and shareholder
equally between ratepayer and shareholder
Settlement approved by Kentucky PSC on September 30, 2010
A-16

© PPL Corporation 2010
Environmental Cost Recovery Mechanism
Ÿ ECR allows real time return of and on environmental
investment (including CWIP) and recovery of environmental
expenses associated with coal-fired generation
investment (including CWIP) and recovery of environmental
expenses associated with coal-fired generation
Ÿ Most recent ECR plan approved by KPSC December 2009
‒ Selective catalytic reduction unit (SCR) at Brown facility
‒ Coal combustion by-products projects at Brown, Cane Run,
Ghent and Trimble County
Ghent and Trimble County
Ÿ Periodic Reviews by KPSC
‒ Two year reviews complete through April 2009
‒ Six month review initiated through April 2010
‒ No disallowances
Ÿ Anticipate recovery of carbon costs through this mechanism
A-17

© PPL Corporation 2010
A-18
Forward-Looking Information Statement
Statements contained in this press release, including statements with respect to future events and their timing, including statements concerning the acquisition by PPL Corporation of E.ON U.S. LLC and its subsidiaries Louisville Gas & Electric Company and Kentucky Utilities Company (collectively, the “Kentucky Entities”), the expected results of operations of any of the Kentucky Entities or PPL Corporation both before or following PPL Corporation’s acquisition of the Kentucky Entities, as well as statements as to future earnings, energy prices, margins and sales, growth, revenues, expenses, cash flow, credit profile, ratings, financing, asset disposition, marketing performance, hedging, regulation, corporate strategy and generating capacity and performance, are “forward-looking statements” within the meaning of the federal securities laws. Although PPL Corporation believes that the expectations and assumptions reflected in these forward-looking statements are reasonable, these expectations, assumptions and statements are subject to a number of risks and uncertainties, and actual results may differ materially from the results discussed in the statements. The following are among the important factors that could cause actual results to differ materially from the forward-looking statements: capital market conditions and decisions regarding capital structure; the market prices of equity securities and the impact on pension income and resultant cash funding requirements for defined benefit pension plans; the securities and credit ratings of PPL Corporation and its subsidiaries; stock price performance; receipt of necessary government permits, approvals, rate relief and regulatory cost recovery; market demand and prices for energy, capacity and fuel; weather conditions affecting customer energy usage and operating costs; competition in power markets; the effect of any business or industry restructuring; the profitability and liquidity of PPL Corporation, the Kentucky Entities and either of their subsidiaries; new accounting requirements or new interpretations or applications of existing requirements; operating performance of plants and other facilities; environmental conditions and requirements and the related costs of compliance, including environmental capital expenditures and emission allowance and other expenses; system conditions and operating costs; development of new projects, markets and technologies; performance of new ventures; asset acquisitions and dispositions; any impact of hurricanes or other severe weather on our business, including any impact on fuel prices; the impact of state, federal or foreign investigations applicable to PPL Corporation, the Kentucky Entities and either of their subsidiaries; the outcome of litigation against PPL Corporation, the Kentucky Entities and either of their subsidiaries; political, regulatory or economic conditions in states, regions or countries where PPL Corporation, the Kentucky Entities and either of their subsidiaries conduct business, including any potential effects of threatened or actual terrorism or war or other hostilities; foreign exchange rates; new state, federal or foreign legislation, including new tax or environmental legislation or regulation; and the commitments and liabilities of PPL Corporation, the Kentucky Entities and each of their subsidiaries. Any such forward-looking statements should be considered in light of such important factors and in conjunction with PPL Corporation’s Form 10-K and other reports on file with the Securities and Exchange Commission.

© PPL Corporation 2010
“Earnings from ongoing operations” is adjusted for the impact of special items. Special items include:
• Energy-related economic activity (as discussed below).
• Foreign currency-related economic hedges.
• Gains and losses on sales of assets not in the ordinary course of business.
• Impairment charges (including impairments of securities in the company’s nuclear decommissioning trust funds).
• Workforce reduction and other restructuring impacts.
• Costs and charges related to the pending E.ON U.S. acquisition.
• Other charges or credits that are, in management’s view, not reflective of the company’s ongoing operations.
A-19
Definitions of Non-GAAP Financial Measures
“Earnings from ongoing operations” should not be considered as an alternative to reported earnings, or net income attributable to PPL, which is an indicator of operating performance determined in accordance with generally accepted accounting principles (GAAP). PPL believes that “earnings from ongoing operations,” although a non-GAAP financial measure, is also useful and meaningful to investors because it provides them with management’s view of PPL’s fundamental earnings performance as another criterion in making their investment decisions. PPL’s management also uses “earnings from ongoing operations” in measuring certain corporate performance goals. Other companies may use different measures to present financial performance.
Energy-related economic activity includes the changes in fair value of positions used to economically hedge a portion of the economic value of PPL’s generation assets, load-following and retail activities. This economic value is subject to changes in fair value due to market price volatility of the input and output commodities (e.g., fuel and power). Also included in this special item are the ineffective portion of qualifying cash flow hedges and the premium amortization associated with options classified as economic activity. These items are included in ongoing earnings over the delivery period of the item that was hedged or upon realization. Management believes that adjusting for such amounts provides a better matching of earnings from ongoing operations to the actual amounts settled for PPL’s underlying hedged assets. Please refer to the Notes to the Consolidated Financial Statements and MD&A in PPL Corporation’s periodic filings with the Securities and Exchange Commission for additional information on energy-related economic activity.
“Free cash flow before dividends” is derived by deducting capital expenditures and other investing activities-net, from cash flow from operations. Free cash flow before dividends should not be considered as an alternative to cash flow from operations, which is determined in accordance with GAAP. PPL believes that free cash flow before dividends, although a non-GAAP measure, is an important measure to both management and investors since it is an indicator of the company’s ability to sustain operations and growth without additional outside financing beyond the requirement to fund maturing debt obligations. Other companies may calculate free cash flow before dividends in a different manner.

© PPL Corporation 2010
A-20
Definitions of Non-GAAP Financial Measures
(continued)
(continued)
"Domestic Gross Energy Margins" and "Domestic Gross Delivery Margins" are not intended to replace "Operating Income," which is determined in accordance with GAAP, as an indicator of overall operating performance.
• "Domestic Gross Energy Margins" is a single financial performance measure of PPL's domestic energy non-trading and trading activities. In calculating this measure, the Supply segment's energy revenues are offset by the cost of fuel and energy purchases, and adjusted for other related items. This performance measure excludes utility revenues and includes PLR revenues from energy sales to PPL Electric by PPL EnergyPlus. In addition, PPL excludes from "Domestic Gross Energy Margins" energy-related economic activity, which includes the changes in fair value of positions used to economically hedge a portion of the economic value of PPL's generation assets, full-requirement and retail activities. This economic value is subject to changes in fair value due to market price volatility of the input and output commodities (e.g., fuel and power) prior to the delivery period that was hedged. Also included in this energy-related economic activity is the ineffective portion of qualifying cash flow hedges, losses on the monetization of certain full-requirement sales contracts and premium amortization associated with options. This economic activity is deferred, with the exception of the full-requirement sales contracts monetized, and included in domestic gross energy margins earnings over the delivery period that was hedged or upon realization. PPL believes that "Domestic Gross Energy Margins" provides another criterion to make investment decisions. This performance measure is used, in conjunction with other information, internally by senior management and the Board of Directors to manage its domestic energy non-trading and trading activities. PPL's management also uses "Domestic Gross Energy Margins" in measuring certain corporate performance goals used in determining variable compensation. Other companies may use different measures to present the results of their energy non-trading and trading activities.
• "Domestic Gross Delivery Margins" is a single financial performance measure of PPL's domestic regulated electric delivery operations, which includes transmission and distribution activities, including PLR supply. In calculating this measure, domestic regulated utility revenues and expenses associated with approved recovery mechanisms, including energy provided as a PLR, are offset. These mechanisms allow for full cost recovery of certain expenses; therefore certain expenses and revenues offset with minimal impact on earnings. As a result, this measure represents the net revenues from PPL's domestic regulated electric delivery operations. This performance measure is used, in conjunction with other information, internally by senior management and the Board of Directors to manage its domestic regulated electric delivery operations. PPL believes that "Domestic Gross Delivery Margins" provides another criterion to make investment decisions. Other companies may use different measures to present the results of their regulated electric delivery operations.