Attached files
| file | filename |
|---|---|
| 8-K - JOINT FORM 8-K - KANSAS CITY POWER & LIGHT CO | f8keeideck.htm |

Great Plains Energy
Edison Electric Institute Financial Conference
November 2, 2010
2010 EEI Presentation
Michael J. Chesser
Chairman and CEO
Exhibit 99.1

Statements made in this presentation that are not based on historical facts are forward-looking, may involve risks and uncertainties, and are intended
to be as of the date when made. Forward-looking statements include, but are not limited to, the outcome of regulatory proceedings, cost estimates of the
Comprehensive Energy Plan and other matters affecting future operations. In connection with the safe harbor provisions of the Private Securities Litigation
Reform Act of 1995, Great Plains Energy and KCP&L are providing a number of important factors that could cause actual results to differ materially from the
provided forward-looking information. These important factors include: future economic conditions in regional, national and international markets and their
effects on sales, prices and costs, including but not limited to possible further deterioration in economic conditions and the timing and extent of any economic
recovery; prices and availability of electricity in regional and national wholesale markets; market perception of the energy industry, Great Plains Energy and
KCP&L; changes in business strategy, operations or development plans; effects of current or proposed state and federal legislative and regulatory actions or
developments, including, but not limited to, deregulation, re-regulation and restructuring of the electric utility industry; decisions of regulators regarding rates
the companies can charge for electricity; adverse changes in applicable laws, regulations, rules, principles or practices governing tax, accounting and
environmental matters including, but not limited to, air and water quality; financial market conditions and performance including, but not limited to, changes
in interest rates and credit spreads and in availability and cost of capital and the effects on nuclear decommissioning trust and pension plan assets and costs;
impairments of long-lived assets or goodwill; credit ratings; inflation rates; effectiveness of risk management policies and procedures and the ability of
counterparties to satisfy their contractual commitments; impact of terrorist acts; increased competition including, but not limited to, retail choice in the
electric utility industry and the entry of new competitors; ability to carry out marketing and sales plans; weather conditions including, but not limited to,
weather-related damage and their effects on sales, prices and costs; cost, availability, quality and deliverability of fuel; ability to achieve generation goals and
the occurrence and duration of planned and unplanned generation outages; delays in the anticipated in-service dates and cost increases of additional
generating capacity and environmental projects; nuclear operations; workforce risks, including, but not limited to, increased costs of retirement, health care
and other benefits; the timing and amount of resulting synergy savings from the GMO acquisition; and other risks and uncertainties.
This list of factors is not all-inclusive because it is not possible to predict all factors. Other risk factors are detailed from time to time in Great Plains
Energy’s and KCP&L’s quarterly reports on Form 10-Q and annual report on Form 10-K filed with the Securities and Exchange Commission. Each forward-
looking statement speaks only as of the date of the particular statement. Great Plains Energy and KCP&L undertake no obligation to publicly update or revise
any forward-looking statement, whether as a result of new information, future events or otherwise.
Forward Looking Statement
2
2010 EEI Presentation

• Solid Midwest electric utility operating under the KCP&L brand
• Transformational events in 2008 to focus business model on fully
regulated utility operations
regulated utility operations
– Sale of Strategic Energy
– Acquisition of Aquila (now KCP&L Greater Missouri Operations,
or “GMO”)
or “GMO”)
• Company attributes
– ~822,000 customers / 3,200+ employees
– ~6,600 MW of primarily low-cost coal baseload generation
– 5-year projected synergies post-GMO acquisition of ~$760M
– ~$8.5bn in assets and $4.4bn in rate base at 2009YE
Service Territories: KCP&L and GMO
Business Highlights
YTD MWh Sold by Customer Type
YTD MWh Sales by Jurisdiction
YTD MWh Generated by Fuel Type
Total: ~ 18,423 MWhs
Total: ~ 18,423 MWhs
Total: ~ 19,958 MWhs
2010 EEI Presentation
3
Note: Charts below reflect YTD 2010
3
Solid Vertically-Integrated Midwest Utility

4
Impressive Reliability
Solid Safety Record
Tier 1 Customer Service
Stewards of
the Environment
the Environment
Reliable, Economical, and
Safe Nuclear Generation
Safe Nuclear Generation
Strong Plant Performance
4
2010 EEI Presentation

Executing the Plan
2010 EEI Presentation
5

Strategic Overview
Terry Bassham
Executive Vice President, Utility
Operations
Operations
6
2010 EEI Presentation

7
2010 EEI Presentation
Steps to Completion of Iatan 2

1KCP&L’s initial request was subsequently adjusted to $50.9 million as the net result of updates to the case, most notably a reduction in the requested
ROE (see below footnote)
ROE (see below footnote)
2The requested ROE was adjusted by KCP&L to 10.75% with the potential for a 0.25% adder (to 11.00% ROE) if the KCC adopts a particular rate design
proposal by KCC Staff and other interveners
proposal by KCC Staff and other interveners
|
Jurisdiction
|
Requested
Increase |
Requested
ROE |
Rate Base
|
Rates
Effective |
Decision
|
|
KCP&L - KS
|
$55.21
|
11.25%2
|
1,794.8
|
12/1/2010
|
Fall 2010
|
|
KCP&L - MO
|
$92.1
|
11.00%
|
2,122.8
|
5/4/2011
|
Spring 2011
|
|
GMO - MPS
|
$75.8
|
11.00%
|
1,468.7
|
6/4/2011
|
Spring 2011
|
|
GMO - L&P
|
$22.1
|
11.00%
|
422.0
|
6/4/2011
|
Spring 2011
|
8
(in $ millions)
2010 EEI Presentation
Pending Rate Case Summary
Drivers of Change
Environmental
Rules
Natural Gas
Prices
Load Growth
Energy
Legislation
Financing
Emergent
Technologies
2010 EEI Presentation
9

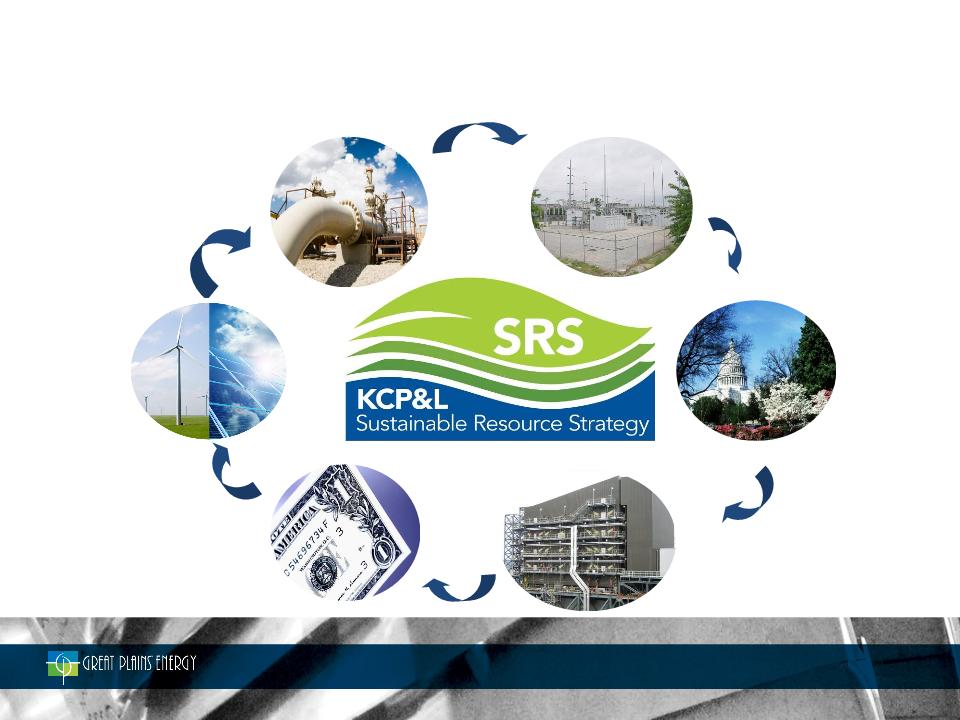
Sustainable Resource Strategy
Change Creates Opportunity
Change Creates Opportunity
Transmission &
Distribution
Opportunities
Distribution
Opportunities
Opportunities
Resulting from
SmartGrid
Technologies
Resulting from
SmartGrid
Technologies
Generation Fleet
Optimization
Opportunities
Optimization
Opportunities
2010 EEI Presentation
10

Financial Overview
James C. Shay
Senior Vice President Finance &
Strategic Planning and CFO
Strategic Planning and CFO
11
2010 EEI Presentation
Electric Utility’s net income increased $52.3 million primarily driven by a $109.8 million increase in gross margin* due to
favorable impacts from weather and new retail rates
favorable impacts from weather and new retail rates
Increased number of shares outstanding primarily from the May 2009 equity offering resulted in dilution of $0.02 per
share
share
*Gross margin is defined and reconciled to GAAP operating revenues in the Appendix
12
2010 EEI Presentation

Electric Utility’s net income increased $98.7 million primarily driven by a $239.4 million increase in gross margin* due to
new retail rates and favorable impacts from weather
new retail rates and favorable impacts from weather
Other category earnings decreased $18.9 million primarily as a result of increased interest from the Equity Units issued in
2009 and a $16 million benefit in 2009 related to the settlement of GMO’s 2003 - 2004 federal tax audit
2009 and a $16 million benefit in 2009 related to the settlement of GMO’s 2003 - 2004 federal tax audit
Increased number of shares outstanding primarily from the May 2009 equity offering resulted in dilution of $0.12 per
share
share
*Gross margin is defined and reconciled to GAAP operating revenues in the Appendix
13
2010 EEI Presentation

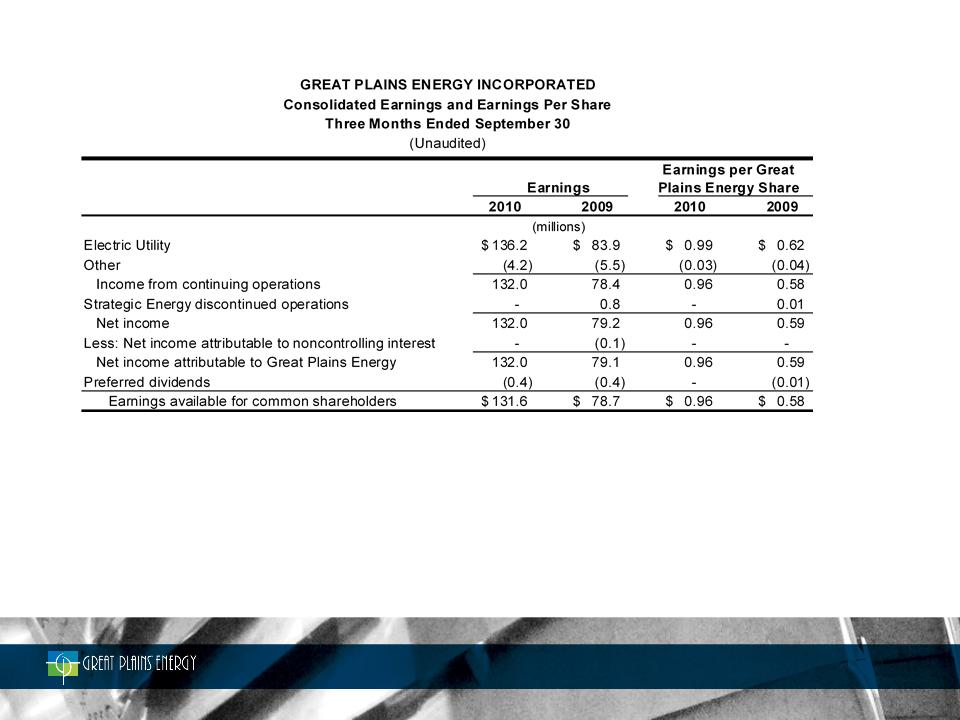
Electric Utility Third Quarter
(millions except
where indicated)
Earnings
Earnings Per Share
14
Key Earnings Drivers:
+ Increased gross margin of $109.8 million primarily due to significantly warmer weather and full-quarter impact of
new retail rates which took effect in August and September 2009
new retail rates which took effect in August and September 2009
– Increased operating expense of $12.1 million primarily driven by $5.2 million increase in general taxes and $4.0
million Iatan 2 loss;
million Iatan 2 loss;
– Increased depreciation and amortization of $7.4 million, including $3.2 million of additional amortization pursuant
to KCP&L’s 2009 rate cases; and
to KCP&L’s 2009 rate cases; and
– Decrease in non-operating income and expenses of $7.0 million, including $4.2 million less AFUDC equity due to
lower CWIP balances
lower CWIP balances
2010 EEI Presentation

Key Earnings Drivers:
+ Increased gross margin of $239.4 million primarily due to new retail rates and favorable weather
– Increased operating expense of $40.7 million primarily due to planned plant outages, higher general taxes and
the Iatan 2 loss; and
the Iatan 2 loss; and
– Increased depreciation and amortization of $28.2 million; including $17.2 million of additional amortization
pursuant to KCP&L’s 2009 rate cases
pursuant to KCP&L’s 2009 rate cases
Earnings
Earnings Per Share
(millions except
where indicated)
15
2010 EEI Presentation
Electric Utility Year-to-Date

Electric Utility Segment
Retail MWh Sales by Customer Class - Third Quarter 2010
44%
12%
44%
16
2010 EEI Presentation

Debt and Capital Structure
as of September 30, 2010
as of September 30, 2010
Capital Structure
Great Plains Energy Debt ($ in millions)
17
2010 EEI Presentation
|
|
|
|
|
|
|
|
|
|
|
|
KCP&L
|
GMO (1)
|
GPE
|
Consolidated
|
||||
|
|
Amount
|
Rate (2)
|
Amount
|
Rate (2)
|
Amount
|
Rate (2)
|
Amount
|
Rate (2)
|
|
Short-term Debt
|
$304.5(3) |
0.80%
|
$0.0
|
0.00%
|
$22.0
|
3.06%
|
$326.5
|
0.95%
|
|
Long-term Debt(4)
|
$1,780.0
|
6.13%
|
$1,020.1
|
9.88%
|
$636.9
|
7.57%
|
$3,437.0
|
7.47%
|
|
Total
|
$2,084.5
|
5.35%
|
$1,020.1
|
9.88%
|
$658.9
|
7.42%
|
$3,763.5
|
6.89%
|
Secured debt = $862.3 (23%), Unsecured debt = $2,901.2 (77%)
(1) GPE guarantees substantially all of GMO’s debt
(2) Weighted Average Rates - excludes premium/discounts and fair market value adjustments; includes full Equity Units coupon (12%) for GPE
(3) Includes fully-drawn KCP&L A/R Securitization facility of $95 million
(4) Includes current maturities of long-term debt

18
2010 EEI Presentation
2010 EPS Guidance
• Increased to $1.52 - $1.62 from $1.30 - $1.50
• Key YTD drivers of new guidance include estimated
weather impact vs. normal, lower fuel cost at KCP&L -
Missouri, and lower transmission costs at GMO
weather impact vs. normal, lower fuel cost at KCP&L -
Missouri, and lower transmission costs at GMO
• Guidance assumes no regulatory disallowance for Iatan
beyond that already recognized
beyond that already recognized

Positioned for Long-term Earnings Growth
• Diligently pursue constructive outcomes in current rate cases
• Continue to deliver on GMO synergies and move toward Tier 1 costs
across the organization
across the organization
• Evaluate future opportunities through Sustainable Resource Strategy
and continue to advocate on behalf of our shareholders, customers,
and communities
and continue to advocate on behalf of our shareholders, customers,
and communities
19
2010 EEI Presentation

Great Plains Energy
Edison Electric Institute Financial Conference
November 2, 2010
2010 EEI Presentation

Appendix
3Q 2010
Gross Margin Reconciliation
2010 EEI Presentation

Gross margin is a financial measure that is not calculated in accordance with generally accepted accounting principles (GAAP). Gross
margin, as used by Great Plains Energy, is defined as operating revenues less fuel, purchased power and transmission of electricity by
others. The Company’s expense for fuel, purchased power and transmission of electricity by others, offset by wholesale sales margin, is
subject to recovery through cost adjustment mechanisms, except for KCP&L’s Missouri retail operations. As a result, operating revenues
increase or decrease in relation to a significant portion of these expenses. Management believes that gross margin provides a more
meaningful basis for evaluating the Electric Utility segment’s operations across periods than operating revenues because gross margin
excludes the revenue effect of fluctuations in these expenses. Gross margin is used internally to measure performance against budget and
in reports for management and the Board of Directors. The Company’s definition of gross margin may differ from similar terms used by
other companies. A reconciliation to GAAP operating revenues is provided in the table above.
2010 EEI Presentation