Attached files
| file | filename |
|---|---|
| 8-K - FORM 8K - PPL ELECTRIC UTILITIES CORP | form8k.htm |
| EX-99.1 - EXHIBIT 99.1 - PPL ELECTRIC UTILITIES CORP | form8k-exhibit99_1.htm |
| EX-99.3 - EXHIBIT 99.3 - PPL ELECTRIC UTILITIES CORP | form8k-exhibit99_3.htm |

Third Quarter Earnings Call
October 28, 2010
October 28, 2010
© PPL Corporation 2010
Exhibit 99.2

© PPL Corporation 2010
2
Any statements made in this presentation about future operating
results or other future events are forward-looking statements under
the Safe Harbor Provisions of the Private Securities Litigation Reform
Act of 1995. Actual results may differ materially from such forward-
looking statements. A discussion of factors that could cause actual
results or events to vary is contained in the Appendix to this
presentation and in the Company’s SEC filings.
Cautionary Statements and Factors
That May Affect Future Results
That May Affect Future Results

© PPL Corporation 2010
3
J. H. Miller
P. A. Farr
W. H. Spence
Agenda
Third Quarter 2010 Earnings and 2010
Earnings Forecast and Outlook
Segment Results and Financial Overview
Operational Review
Q&A
© PPL Corporation 2010
4
Third Quarter
Reported Earnings
Third Quarter
Earnings from Ongoing Operations
Note: See Appendix for the reconciliation of earnings from ongoing operations to reported earnings.
Year-to-Date
Reported Earnings
Year-to-Date
Earnings from Ongoing Operations
Earnings Results

© PPL Corporation 2010
5
Forecast (1)
$2.02
Per Share
$1.95
$2.95
Note: See Appendix for the reconciliation of earnings from ongoing operations to reported earnings.
(1) (1) Adjusted for share dilution
$2.80
Strong Expected Earnings Growth

© PPL Corporation 2010
6
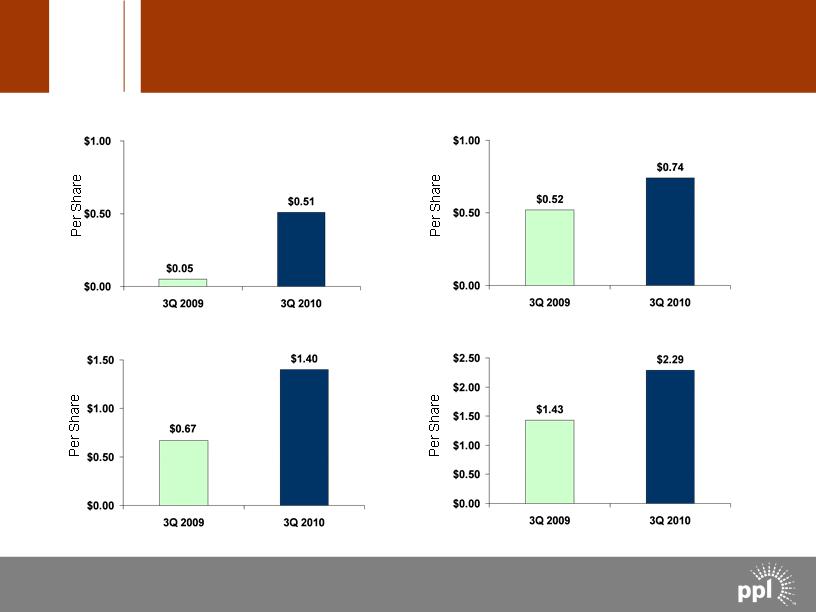
$ 0.22
$0.52
$0.74
Total
0.00
0.12
0.12
International Delivery
0.01
0.07
0.08
Pennsylvania Delivery
$ 0.21
$0.33
$0.54
Supply
Change
Q3
2009
Q3
2010
|
Note: See Appendix for the reconciliation of earnings from ongoing operations to reported earnings.
|
Ongoing Earnings Overview

© PPL Corporation 2010
7
|
Note: See Appendix for the reconciliation of earnings from ongoing operations to reported earnings.
|
|
|
3rd Quarter
|
|
|
2009 EPS - Ongoing Earnings
|
|
$0.33
|
|
Margins - East
|
0.31
|
|
|
O&M
|
(0.02)
|
|
|
Depreciation
|
(0.02)
|
|
|
Income Taxes & Other
|
0.11
|
|
|
Dilution
|
(0.17)
|
|
|
Total
|
|
0.21
|
|
2010 EPS - Ongoing Earnings
|
|
$0.54
|
Supply Segment
Earnings Drivers
Earnings Drivers

© PPL Corporation 2010
8
|
Note: See Appendix for the reconciliation of earnings from ongoing operations to reported earnings.
|
|
|
3rd Quarter
|
|
|
2009 EPS - Ongoing Earnings
|
|
$0.07
|
|
Delivery Margins
|
0.02
|
|
|
O&M
|
(0.01)
|
|
|
Income Taxes & Other
|
0.02
|
|
|
Dilution
|
(0.02)
|
|
|
Total
|
|
0.01
|
|
2010 EPS - Ongoing Earnings
|
|
$0.08
|
Pennsylvania Delivery Segment
Earnings Drivers
Earnings Drivers

© PPL Corporation 2010
9
|
Note: See Appendix for the reconciliation of earnings from ongoing operations to reported earnings.
|
|
|
3rd Quarter
|
|
|
2009 EPS - Ongoing Earnings
|
|
$0.12
|
|
Delivery Revenue
|
0.02
|
|
|
O&M
|
(0.02)
|
|
|
Financing Costs
|
(0.02)
|
|
|
Income Taxes & Other
|
0.06
|
|
|
Dilution
|
(0.04)
|
|
|
Total
|
|
0.00
|
|
2010 EPS - Ongoing Earnings
|
|
$0.12
|
International Delivery Segment
Earnings Drivers
Earnings Drivers
© PPL Corporation 2010
10
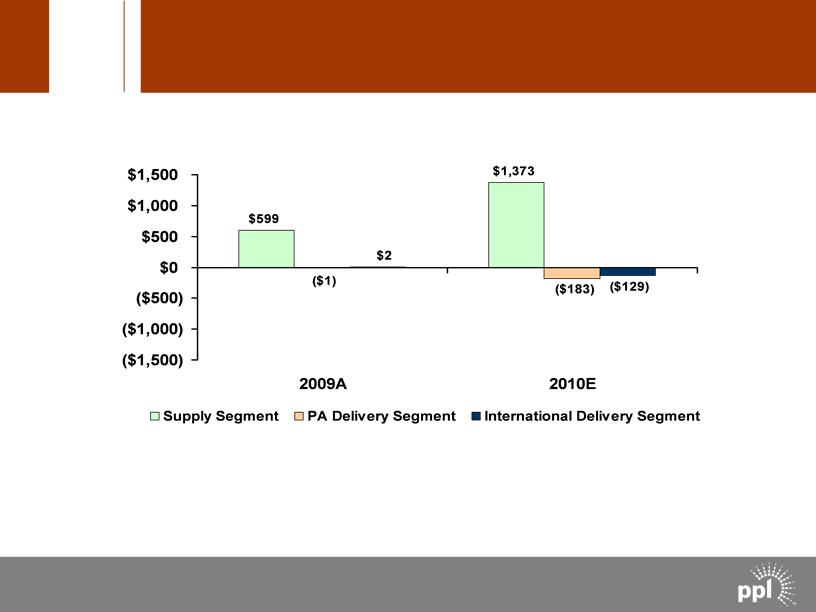
Millions
Note: See Appendix for reconciliation of cash from operations to free cash flow before dividends
Free Cash Flow before Dividends Forecast
Free Cash Flow before Dividends Forecast Millions $599 $1,373 ($1) ($183) ($129) $2 ($1,500) ($1,000) ($500) $0 $500 $1,000 $1,500 2009A 2010E Supply Segment PA Delivery Segment International Delivery Segment Note: See Appendix for reconciliation of cash from operations to free cash flow before dividends © PPL Corporation 2010 10

© PPL Corporation 2010
11
Operational Review
§ ALJ issued recommended decision approving settlement
agreement in PPL EU rate case; PUC order expected December
2010
agreement in PPL EU rate case; PUC order expected December
2010
§ No significant change to generation hedge profile
§ Slight increase in East and West coal hedges for 2012; no change
to average hedge price
to average hedge price
§ Basis assumptions for 2010, 2011, 2012 unchanged since last
earnings call
earnings call
§ Continue to forecast eastern coal transportation costs at $24/ton in
2011
2011

© PPL Corporation 2010
12

© PPL Corporation 2010
A-1
|
(1)
|
Market prices based on the average of broker quotes as of 9/30/2010
|
|
(2)
|
24-hour average
|
|
(3)
|
NYMEX and TZ6NNY forward gas prices on 9/30/2010
|
|
(4)
|
Market Heat Rate = PJM on-peak power price divided by TZ6NNY gas price
|
Market Prices
Market Prices ELECTRIC PJM On-Peak Off-Peak ATC(2) Mid-Columbia On-Peak Off-Peak ATC(2) GAS(3) NYMEX TZ6NNY PJM MARKET HEAT RATE(4) CAPACITY PRICES (Per MWD) EQA Actual 2009 Oct-Dec 2010 2011 2012 $44 $43 $48 $50 $31 $33 $35 $37 $38 $38 $41 $43 $36 $37 $35 $41 $29 $31 $27 $31 $33 $35 $31 $37 $3.92 $3.94 $4.44 $5.07 $4.63 $4.50 $4.96 $5.55 9.5 9.6 9.6 9.0 $158.24 $181.39 $136.79 $123.63 88.5% 92.8% 89.6% 90.4% Forward(1) (1) Market prices based on the average of broker quotes as of 9/30/2010 (2) 24-hour average (3) NYMEX and TZ6NNY forward gas prices on 9/30/2010 (4) Market Heat Rate = PJM on-peak power price divided by TZ6NNY gas price © PPL Corporation 2010 A-1

© PPL Corporation 2010
As of October 20, 2010
*Represents expected sales based on current business plan assumptions
**Represents energy, capacity, congestion and other revenues
|
|
|
|
2010
|
|
2011
|
|
2012
|
|
Baseload
|
|
|
|
|
|
|
|
|
Expected Generation* (Million MWhs)
|
|
|
50.3
|
|
51.4
|
|
54.7
|
|
East
|
|
|
41.7
|
|
43.1
|
|
46.2
|
|
West
|
|
|
8.6
|
|
8.3
|
|
8.5
|
|
|
|
|
|
|
|
|
|
|
Current Hedges (%)
|
|
|
100%
|
|
97%
|
|
68%
|
|
East
|
|
|
100%
|
|
98%
|
|
63%
|
|
West
|
|
|
100%
|
|
94%
|
|
94%
|
|
|
|
|
|
|
|
|
|
|
Average Hedged Price (Energy Only) ($/MWh)
|
|
|
$59
|
|
$56
|
|
$58
|
|
East
|
|
|
$60
|
|
$56
|
|
$59
|
|
West
|
|
|
$50
|
|
$54
|
|
$54
|
|
|
|
|
|
|
|
|
|
|
Expected Average Price (Fully Loaded) ($/MWh)
|
|
|
$68
|
|
$61
|
|
$62
|
|
East**
|
|
|
$71
|
|
$63
|
|
$64
|
|
West
|
|
|
$50
|
|
$54
|
|
$54
|
|
|
|
|
|
|
|
|
|
|
% Hedged Through Swaps/Options Energy Transactions
|
|
|
97%
|
|
96%
|
|
67%
|
|
% Hedged Through Load-following Transactions
|
|
|
3%
|
|
1%
|
|
1%
|
|
Intermediate/Peaking
|
|
|
|
|
|
|
|
|
Expected Generation (Million MWhs)
|
|
|
6.7
|
|
5.3
|
|
5.3
|
|
Current Hedges (%)
|
|
|
87%
|
|
1%
|
|
0%
|
A-2
Supply Segment Asset Hedge Positions

© PPL Corporation 2010
Note: As of September 30, 2010
(1) Weighted Average $/ton at mine for east wholly owned plants; excludes Keystone & Conemaugh
|
|
2010
|
2011
|
2012
|
|||
|
|
Hedge
Level |
Price
|
Hedge
Level |
Price
|
Hedge
Level |
Price
|
|
% Fixed Base Price
|
93%
|
$49
|
96%
|
$52
|
32%
|
$64
|
|
% Collars
|
0%
|
N/A
|
0%
|
N/A
|
68%
|
$45-$52
|
|
% Diesel Surcharge
|
7%
|
$45
|
4%
|
$45
|
0%
|
N/A
|
Eastern Coal Contracts (1)
|
|
2010
|
2011
|
2012
|
|
Uranium
|
100%
|
100%
|
100%
|
|
Coal
|
|
|
|
|
East
|
100%
|
98%
|
95%
|
|
West
|
100%
|
100%
|
100%
|
|
Total
|
100%
|
99%
|
96%
|
A-3
Current Fuel Contracts - Base Prices

© PPL Corporation 2010
Millions
$1,675
$1,826
$1,796
A-4
Capital Expenditures by Segment
Capital Expenditures by Segment Millions $2,000 $1,826 $1,796 $1,675 $1,600 $1,200 $800 $400 $533 $567 $358 $385 $0 $935 $844 $952 $403 $320 2010E 2011E 2012E Supply PA Delivery International Delivery © PPL Corporation 2010 A-4
© PPL Corporation 2010
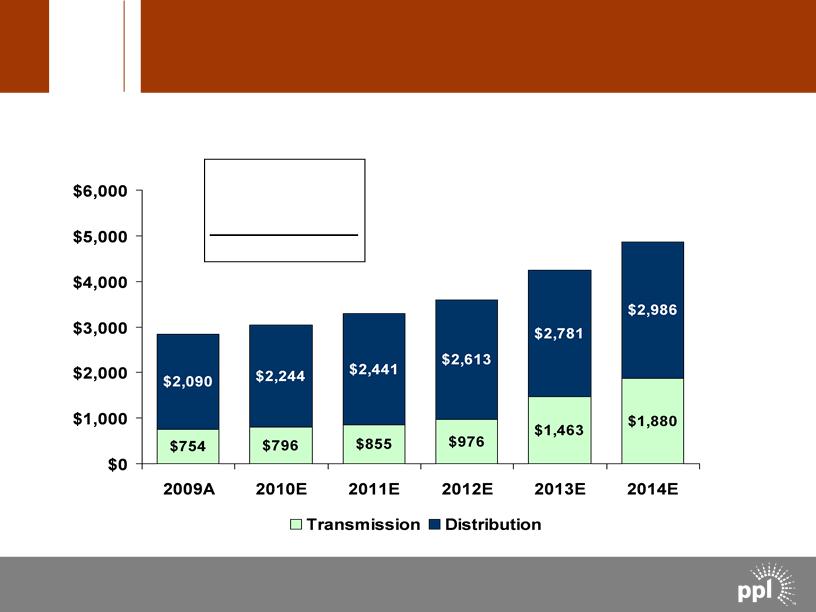
Millions
$3,040
$3,296
$3,589
$4,244
$4,866
$2,844
A-5
CAGR (2009-2014)
Distribution = 7.4%
Transmission = 20.0%
Combined = 11.3%
PPL Electric Utilities Rate Base
PPL Electric Utilities Rate Base Millions $6,000 $5,000 $4,000 $3,000 $2,000 $1,000 $0 $754 $796 $855 $976 $1,463 $1,880 $2,090 $2,244 $2,441 $2,613 $2,781 $2,986 $3,040 $3,296 $3,589 $4,244 $2,844 $4,866 CAGR (2009-2014) Distribution = 7.4% Transmission = 20.0% Combined = 11.3% 2009A 2010E 2011E 2012E 2013E 2014E Transmission Distribution © PPL Corporation 2010 A-5

© PPL Corporation 2010
A-6
August 11, 2009 July 19, 2011
October 20, 2009 October 18, 2011
January 19, 2010 January 9, 2012
April 20, 2010 April 3, 2012
July 20, 2010 July 17, 2012
October 19, 2010 October 16, 2012
April 18, 2011 January 22, 2013
P
P
P
Completed
P
P
P
P
PPL Electric Utilities 2011 to mid-2013
Procurement Plan Schedule
Procurement Plan Schedule
§ Due dates for bids:
© PPL Corporation 2010
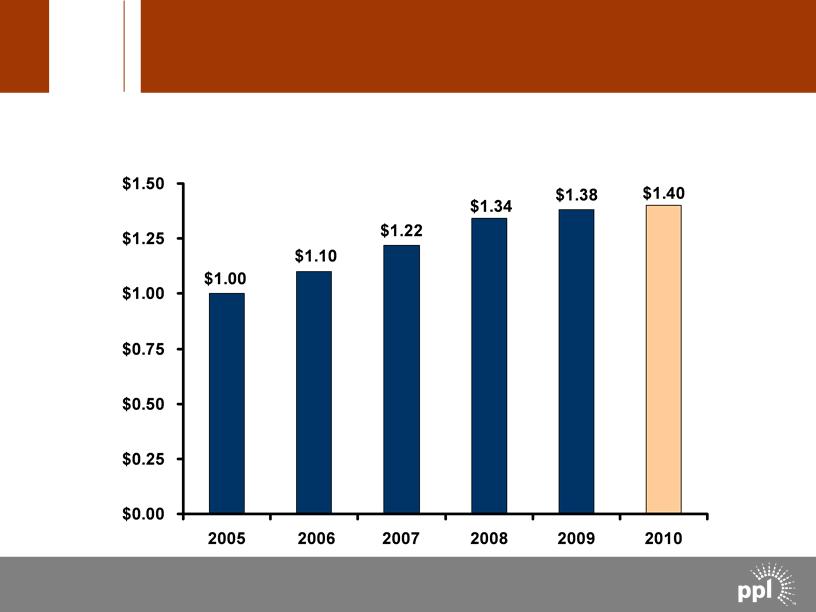
$/Share
Annualized
Dividend Profile
A-7
© PPL Corporation 2010
Note: As of September 30, 2010
(1) Bonds defeased in substance in 2008 by depositing sufficient funds with the trustee
(2) Excludes $1.15 billion of junior subordinated notes due 2018 that are a component of PPL’s Equity Units and
may be put back to PPL Capital Funding if the remarketing in 2013 is not successful
may be put back to PPL Capital Funding if the remarketing in 2013 is not successful
A-8
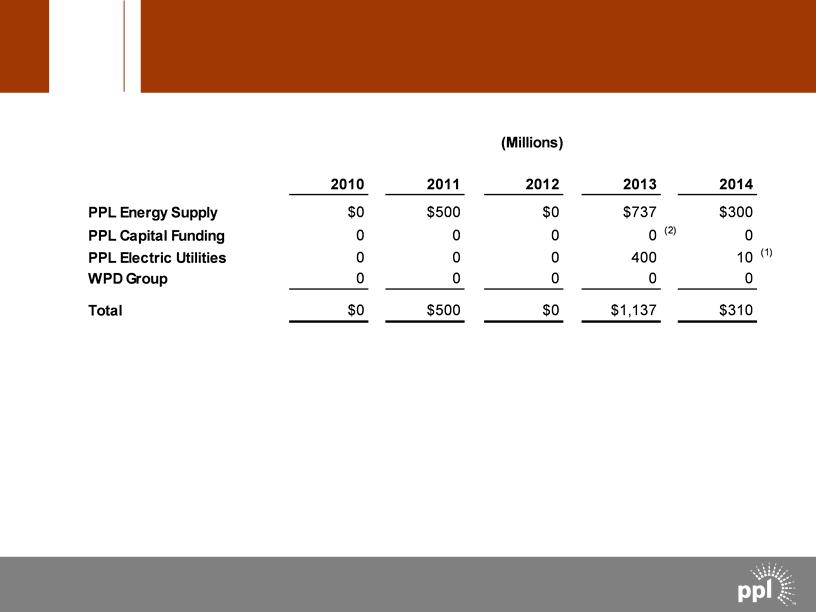
Debt Maturities
Debt Maturities (Millions) 2010 2011 2012 2013 2014 PPL Energy Supply $0 $500 $0 $737 $300 PPL Capital Funding 0 0 0 0(2) 0 PPL Electric Utilities 0 0 0 400 10(1) WPD Group 00 000 Total $0 $500 $0 $1,137 $310 Note: As of September 30, 2010 (1) Bonds defeased in substance in 2008 by depositing sufficient funds with the trustee (2) Excludes $1.15 billion of junior subordinated notes due 2018 that are a component of PPL’s Equity Units and may be put back to PPL Capital Funding if the remarketing in 2013 is not successful © PPL Corporation 2010 A-8
© PPL Corporation 2010
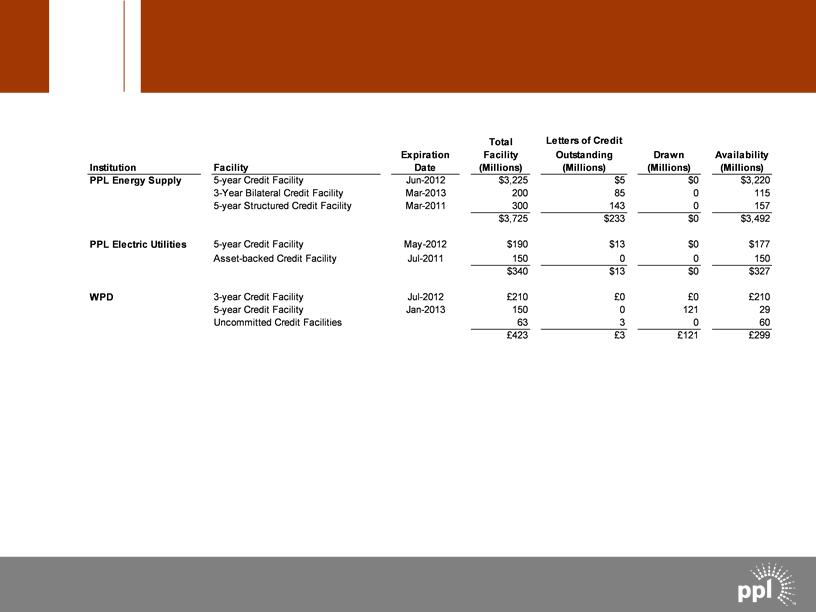
Amounts reported above are as of September 30, 2010. Effective October 19,
PPL Energy Supply’s $3.2 billion credit facility was terminated and a new $4
billion credit facility was made effective. With these changes, domestic facilities
consist of a diverse bank group, with no bank and its affiliates providing an
aggregate commitment of more than 12% of the total committed capacity.
A-9
Liquidity Profile
Liquidity Profile Total Letters of Credit Expiration Facility Outstanding Drawn Availability Institution Facility Date (Millions) (Millions) (Millions) (Millions) PPL Energy Supply 5-year Credit Facility Jun-2012 $3,225 $5 $0 $3,220 3-Year Bilateral Credit Facility Mar-2013 200 85 0 115 5-year Structured Credit Facility Mar-2011 300 143 0 157 $3,725 $233 $0 $3,492 PPL Electric Utilities 5-year Credit Facility May-2012 $190 $13 $0 $177 Asset-backed Credit Facility Jul-2011 150 0 0 150 $340 $13 $0 $327 WPD 3-year Credit Facility Jul-2012 £210 £0 £0 £210 5-year Credit Facility Jan-2013 150 0 121 29 Uncommitted Credit Facilities 63 3 0 60 £423 £3 £121 £299 Amounts reported above are as of September 30, 2010. Effective October 19, PPL Energy Supply’s $3.2 billion credit facility was terminated and a new $4 billion credit facility was made effective. With these changes, domestic facilities consist of a diverse bank group, with no bank and its affiliates providing an aggregate commitment of more than 12% of the total committed capacity. © PPL Corporation 2010 A-9

© PPL Corporation 2010
A-10
|
|
|
2009
|
2010
|
|
Cash from Operations
|
|
$1,310
|
$1,826
|
|
Increase/(Decrease) in cash due to:
|
|
|
|
|
Capital Expenditures
|
|
(720)
|
(952)
|
|
Asset Sales (1) (2)
|
|
84
|
531
|
|
Other Investing Activities - Net
|
|
(75)
|
(32)
|
|
Free Cash Flow before Dividends
|
|
$599
|
$1,373
|
|
|
|
|
|
(1) 2009 includes sale of Wyman and initial payment for the Maine hydro assets from ArcLight
(2) 2010 includes February 2010 sale of the Long Island generating assets, contingent payment on the pending sale of the
remaining Maine hydro assets from ArcLight, completion of the pending sale of the remaining Maine hydro assets to the
Penobscot Trust, and pending sale of Wallingford, University Park, and interest in Safe Harbor
remaining Maine hydro assets from ArcLight, completion of the pending sale of the remaining Maine hydro assets to the
Penobscot Trust, and pending sale of Wallingford, University Park, and interest in Safe Harbor
(Millions)
Actual Projected
Supply Segment Reconciliation of Cash from Operations
to Free Cash Flow before Dividends
to Free Cash Flow before Dividends

© PPL Corporation 2010
A-11
|
|
|
2009
|
2010
|
|
Cash from Operations
|
|
$294
|
$221
|
|
Increase/(Decrease) in cash due to:
|
|
|
|
|
Capital Expenditures
|
|
(298)
|
(403)
|
|
Asset Sales & Other
|
|
3
|
(1)
|
|
Free Cash Flow before Dividends
|
|
($1)
|
($183)
|
(Millions)
Actual Projected
PA Delivery Segment Reconciliation of Cash from
Operations to Free Cash Flow before Dividends
Operations to Free Cash Flow before Dividends

© PPL Corporation 2010
A-12
|
|
2009
|
2010
|
|
Cash from Operations
|
$248
|
$190
|
|
Increase/(Decrease) in cash due to:
|
|
|
|
Capital Expenditures
Other Investing Activities - Net
|
(247)
1
|
(320)
1
|
|
Free Cash Flow before Dividends
|
$2
|
($129)
|
|
|
|
|
(Millions)
Actual Projected
International Delivery Segment Reconciliation of Cash
from Operations to Free Cash Flow before Dividends
from Operations to Free Cash Flow before Dividends
© PPL Corporation 2010
A-13
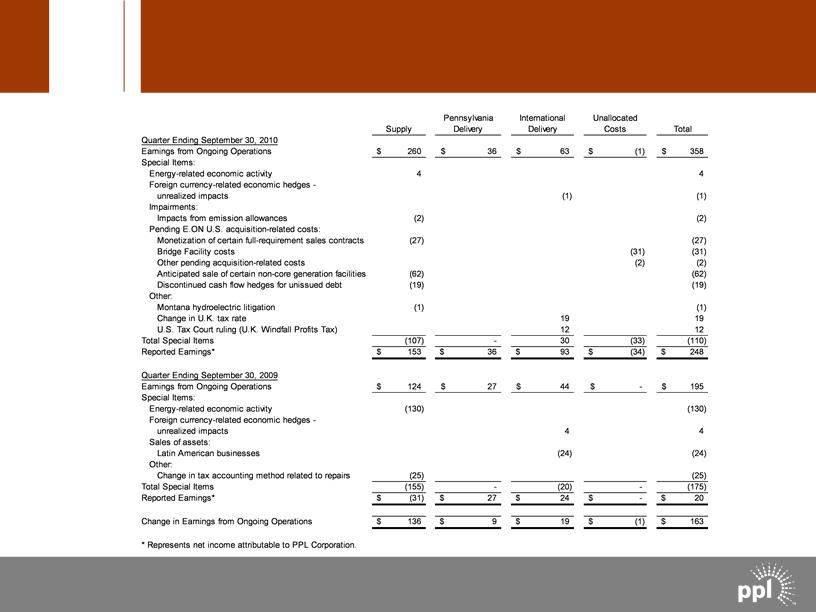
(Millions)
Reconciliation of Third Quarter Earnings from
Ongoing Operations to Reported Earnings
Ongoing Operations to Reported Earnings
Reconciliation of Third Quarter Earnings from Ongoing Operations to Reported Earnings Quarter Ending September 30, 2010 Earnings from Ongoing Operations Special Items: Energy-related economic activity Foreign currency-related economic hedges unrealized impacts Impairments: Impacts from emission allowances Pending E.ON U.S. acquisition-related costs: Monetization of certain full-requirement sales contracts Bridge Facility costs Other pending acquisition-related costs Anticipated sale of certain non-core generation facilities Discontinued cash flow hedges for unissued debt Other: Montana hydroelectric litigation Change in U.K. tax rate U.S. Tax Court ruling (U.K. Windfall Profits Tax) Total Special Items Reported Earnings* (Millions) Pennsylvania Supply Delivery 260$ 36 $ 4 (2) (27) (62) (19) (1) (107) - 153$ 36 $ International Delivery 63 $ (1) 19 12 30 93 $ Unallocated Costs (1) $ (31) (2) (33) (34) $ $ $ Total 358 4 (1) (2) (27) (31) (2) (62) (19) (1) 19 12 (110) 248 Quarter Ending September 30, 2009 Earnings from Ongoing Operations Special Items: Energy-related economic activity Foreign currency-related economic hedges unrealized impacts Sales of assets: Latin American businesses Other: Change in tax accounting method related to repairs Total Special Items Reported Earnings* 124$ 27 $ (130) (25) (155) - (31) $ 27 $ 44 $ 4 (24) (20) 24 $ -$ - -$ $ $ 195 (130) 4 (24) (25) (175) 20 Change in Earnings from Ongoing Operations $ 136 9$ 19 $ (1) $ $ 163 * Represents net income attributable to PPL Corporation. © PPL Corporation 2010 A-13
© PPL Corporation 2010
A-14
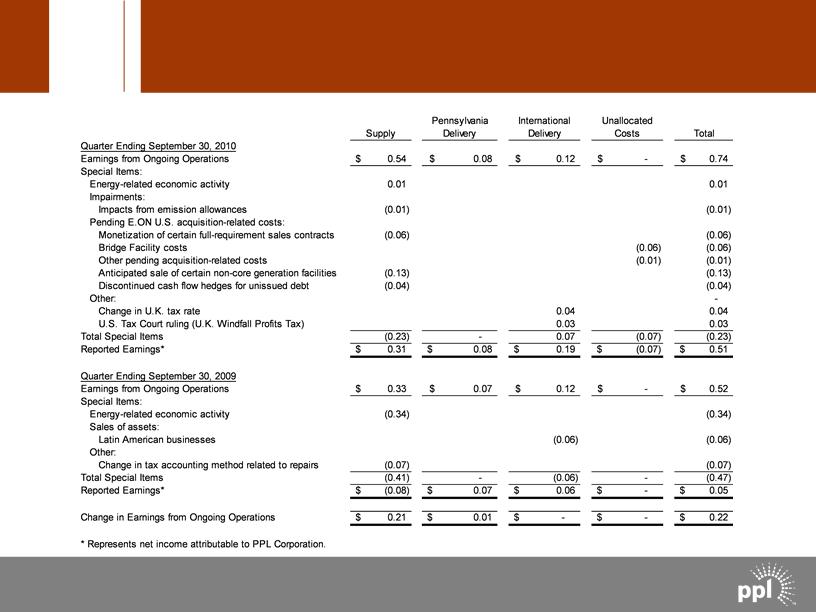
(Dollars Per Share)
Reconciliation of Third Quarter Earnings from
Ongoing Operations to Reported Earnings
Ongoing Operations to Reported Earnings
Reconciliation of Third Quarter Earnings from Ongoing Operations to Reported Earnings Quarter Ending September 30, 2010 Earnings from Ongoing Operations Special Items: Energy-related economic activity Impairments: Impacts from emission allowances Pending E.ON U.S. acquisition-related costs: Monetization of certain full-requirement sales contracts Bridge Facility costs Other pending acquisition-related costs Anticipated sale of certain non-core generation facilities Discontinued cash flow hedges for unissued debt Other: Change in U.K. tax rate U.S. Tax Court ruling (U.K. Windfall Profits Tax) Total Special Items Reported Earnings* Quarter Ending September 30, 2009 Earnings from Ongoing Operations Special Items: Energy-related economic activity Sales of assets: Latin American businesses Other: Change in tax accounting method related to repairs Total Special Items Reported Earnings* Change in Earnings from Ongoing Operations * Represents net income attributable to PPL Corporation. (Dollars Per Share) Pennsylvania Supply Delivery International Delivery Unallocated Costs Total 0.54 $ 0.08 $ 0.12 $ -$ $ 0.74 0.01 0.01 (0.01) (0.01) (0.06) (0.13) (0.04) 0.04 0.03 (0.23) -0.07 0.31 $ 0.08 $ 0.19 $ (0.06) (0.01) (0.07) (0.07) $ $ (0.06) (0.06) (0.01) (0.13) (0.04) - 0.04 0.03 (0.23) 0.51 0.33 $ 0.07 $ 0.12 $ -$ $ 0.52 (0.34) (0.34) (0.06) (0.06) (0.07) (0.41) -(0.06) (0.08) $ 0.07 $ 0.06 $ - -$ $ (0.07) (0.47) 0.05 0.21 $ 0.01 $ $ --$ $ 0.22 © PPL Corporation 2010 A-14
© PPL Corporation 2010
A-15
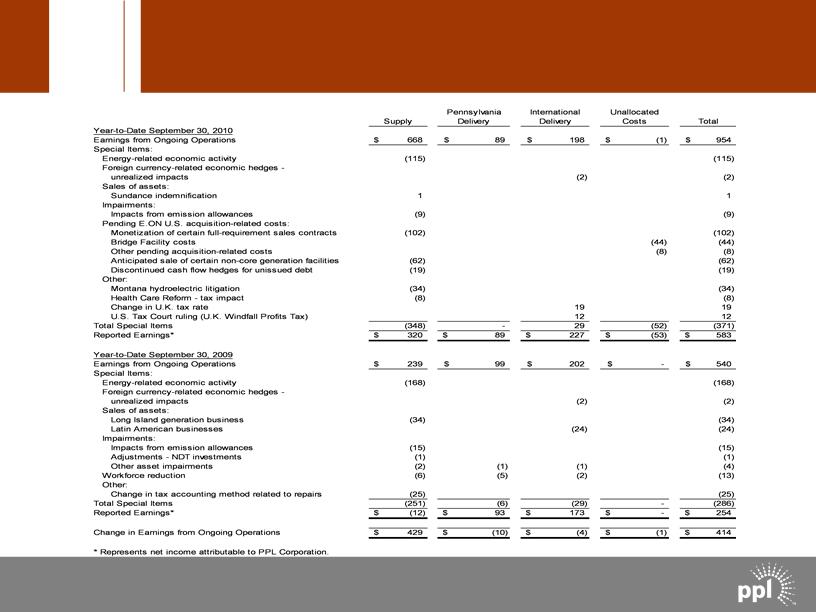
(Millions)
Reconciliation of Year-to-Date Earnings from Ongoing
Operations to Reported Earnings
Operations to Reported Earnings
Reconciliation of Year-to-Date Earnings from Ongoing Operations to Reported Earnings Year-to-Date September 30, 2010 Earnings from Ongoing Operations Special Items: Energy-related economic activity Foreign currency-related economic hedges unrealized impacts Sales of assets: Sundance indemnification Impairments: Impacts from emission allowances Pending E.ON U.S. acquisition-related costs: Monetization of certain full-requirement sales contracts Bridge Facility costs Other pending acquisition-related costs Anticipated sale of certain non-core generation facilities Discontinued cash flow hedges for unissued debt Other: Montana hydroelectric litigation Health Care Reform - tax impact Change in U.K. tax rate U.S. Tax Court ruling (U.K. Windfall Profits Tax) Total Special Items Reported Earnings* Year-to-Date September 30, 2009 Earnings from Ongoing Operations Special Items: Energy-related economic activity Foreign currency-related economic hedges unrealized impacts Sales of assets: Long Island generation business Latin American businesses Impairments: Impacts from emission allowances Adjustments - NDT investments Other asset impairments Workforce reduction Other: Change in tax accounting method related to repairs Total Special Items Reported Earnings* Change in Earnings from Ongoing Operations * Represents net income attributable to PPL Corporation. (Millions) Pennsylvania Supply Delivery International Delivery Unallocated Costs Total 668$ 89 $ 198 $ (1) $ $ 954 (115) (115) (2) (2) 1 1 (9) (9) (102) (62) (19) (44) (8) (102) (44) (8) (62) (19) (34) (8) (348) - 320$ 89 $ 19 12 29 227 $ (52) (53) $ $ (34) (8) 19 12 (371) 583 239$ 99 $ 202 $ -$ $ 540 (168) (168) (2) (2) (34) (24) (34) (24) (15) (1) (2) (6) (1) (5) (1) (2) (15) (1) (4) (13) (25) (251) (6) (12) $ 93 $ (29) 173 $ - -$ $ (25) (286) 254 $ 429 $ (10) $ (4) (1) $ $ 414 © PPL Corporation 2010 A-15
© PPL Corporation 2010
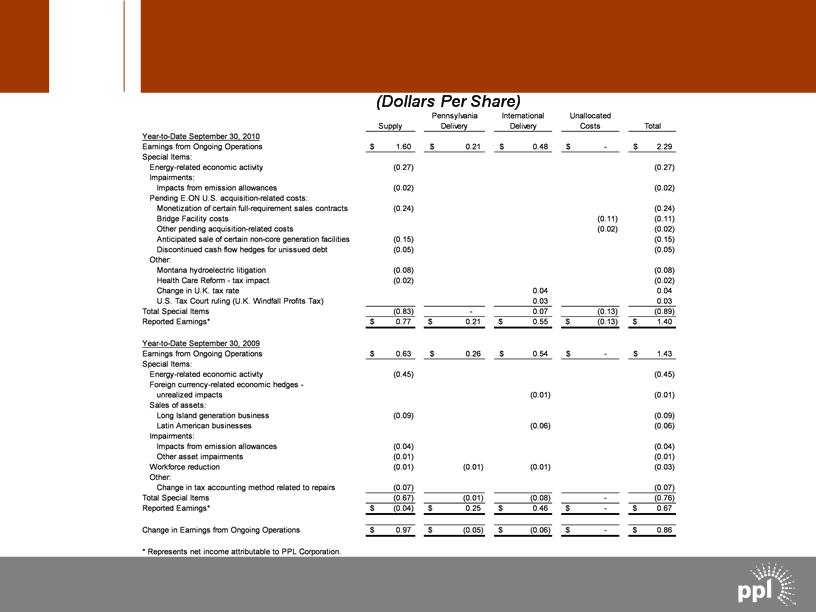
A-16
Reconciliation of Year-to-Date Earnings from Ongoing
Operations to Reported Earnings
Operations to Reported Earnings
Reconciliation of Year-to-Date Earnings from Ongoing Operations to Reported Earnings (Dollars Per Share) Pennsylvania International Unallocated Supply Delivery Delivery Costs Total Year-to-Date September 30, 2010 Earnings from Ongoing Operations $ 1.60 $ 0.21 $ 0.48 $ -$ 2.29 Special Items: Energy-related economic activity (0.27) (0.27) Impairments: Impacts from emission allowances (0.02) (0.02) Pending E.ON U.S. acquisition-related costs: Monetization of certain full-requirement sales contracts (0.24) (0.24) Bridge Facility costs (0.11) (0.11) Other pending acquisition-related costs (0.02) (0.02) Anticipated sale of certain non-core generation facilities (0.15) (0.15) Discontinued cash flow hedges for unissued debt (0.05) (0.05) Other: Montana hydroelectric litigation (0.08) (0.08) Health Care Reform - tax impact (0.02) (0.02) Change in U.K. tax rate 0.04 0.04 U.S. Tax Court ruling (U.K. Windfall Profits Tax) 0.03 0.03 Total Special Items (0.83) -0.07 (0.13) (0.89) Reported Earnings* $ 0.77 $ 0.21 $ 0.55 $ (0.13) $ 1.40 Year-to-Date September 30, 2009 Earnings from Ongoing Operations $ 0.63 $ 0.26 $ 0.54 $ -$ 1.43 Special Items: Energy-related economic activity (0.45) (0.45) Foreign currency-related economic hedges unrealized impacts (0.01) (0.01) Sales of assets: Long Island generation business (0.09) (0.09) Latin American businesses (0.06) (0.06) Impairments: Impacts from emission allowances (0.04) (0.04) Other asset impairments (0.01) (0.01) Workforce reduction (0.01) (0.01) (0.01) (0.03) Other: Change in tax accounting method related to repairs (0.07) (0.07) Total Special Items (0.67) (0.01) (0.08) -(0.76) Reported Earnings* $ (0.04) $ 0.25 $ 0.46 $ -$ 0.67 Change in Earnings from Ongoing Operations $ 0.97 $ (0.05) $ (0.06) $ -$ 0.86 * Represents net income attributable to PPL Corporation. © PPL Corporation 2010 A-16

© PPL Corporation 2010
A-17
Reconciliation of PPL’s Earnings from Ongoing
Operations to Reported Earnings
Operations to Reported Earnings
Reconciliation of PPL’s Earnings from Ongoing Operations to Reported Earnings Forecast [a] Actual High Low 2010 2010 2009 2008 Earnings from Ongoing Operations per share of common stock 2.95 $ $ 2.80 1.95 $ $ 2.02 Special Items: Energy-related economic activity (0.27) (0.27) (0.59) 0.67 Sales of assets: Long Island generation business (0.09) Latin American businesses (0.07) Interest in Wyman Unit 4 (0.01) Gas and propane businesses (0.01) Majority of Maine hydroelectric generation business 0.06 Impairments: Impacts from emission allowances (0.02) (0.02) (0.05) (0.07) Adjustments - NDT investments (0.04) Holtwood hydroelectric plant (0.03) Other asset impairments (0.01) (0.01) Pending E.ON U.S. acquisition-related costs: Monetization of certain full-requirement sales contracts (0.24) (0.24) Bridge Facility costs (0.10) (0.10) Other pending acquisition-related costs (0.02) (0.02) Anticipated sale of certain non-core generation facilities (0.14) (0.14) Discontinued cash flow hedges for unissued debt (0.04) (0.04) Workforce reductions (0.03) (0.01) Other: Montana hydroelectric litigation (0.08) (0.08) (0.01) Health Care Reform - tax impact (0.02) (0.02) Change in U.K. tax rate 0.04 0.04 U.S. Tax Court ruling (U.K. Windfall Profits Tax) 0.03 0.03 Change in tax accounting method related to repairs (0.07) Synfuel tax adjustment (0.04) Montana basin seepage litigation (0.01) Total Special Items (0.86) (0.86) (0.87) 0.45 Reported Earnings per share of common stock 2.09 $ $ 1.94 1.08 $ $ 2.47 Note: Per share amounts are based on diluted shares outstanding. [a]2010 forecast amounts reflect the dilution associated with the June 2010 issuance of common stock and equity units. © PPL Corporation 2010 A-17

© PPL Corporation 2010
|
(a) See additional information on the following slide.
|
A-18
(Millions of Dollars)
Reconciliation of Third Quarter Operating
Income to Domestic Gross Energy Margins
Income to Domestic Gross Energy Margins
Reconciliation of Third Quarter Operating Income to Domestic Gross Energy Margins (Millions of Dollars) Three Months Ended September 30, Per Share Diluted 2010 2009 Change (after-tax) Eastern U.S., pre-tax $ 591 $ 391 $ 200 $ 0.31 Western U.S., pre-tax 88 85 3 Domestic gross energy margins, pre-tax $ 679 $ 476 $ 203 $ 0.31 Three Months Ended September 30, 2010 2009 Operating Income $ 522 $ 171 Adjustments: Utility (732) (955) Energy-related businesses, net (7) (8) Other operation and maintenance 366 316 Amortization of recoverable transition costs -73 Depreciation 127 116 Taxes, other than income 56 69 Revenue adjustments (a) (229) 784 Expense adjustments (a) 576 (90) Domestic gross energy margins $ 679 $ 476 (a) See additional information on the following slide. © PPL Corporation 2010 A-18

© PPL Corporation 2010
A-19
(Millions of Dollars)
Reconciliation of Third Quarter Operating
Income to Domestic Gross Energy Margins
Income to Domestic Gross Energy Margins
Reconciliation of Third Quarter Operating Income to Domestic Gross Energy Margins (Millions of Dollars) Three Months Ended September 30, 2010 2009 Revenue adjustments Impact from energy-related economic activity PLR revenue from energy supplied to PPL Electric by PPL EnergyPlus Revenues from Supply segment discontinued operations Total revenue adjustments $ $ (335) 71 35 (229) $ $ 307 445 32 784 Expense adjustments Impact from energy-related economic activity External PLR energy purchases Expenses from Supply segment discontinued operations Ancillary charges Gross receipts tax Other $ (377) (228) 12 7 4 6 $ 86 (11) 8 5 2 Total expense adjustments $ (576) $ 90 © PPL Corporation 2010 A-19
© PPL Corporation 2010
|
(a) See additional information on the following slide.
|
A-20
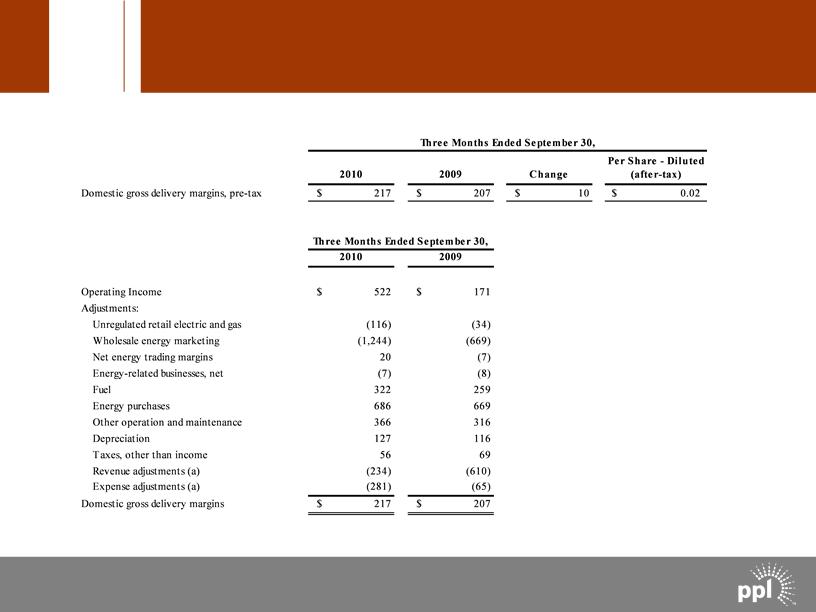
(Millions of Dollars)
Reconciliation of Third Quarter Operating
Income to Domestic Gross Delivery Margins
Income to Domestic Gross Delivery Margins
Reconciliation of Third Quarter Operating Income to Domestic Gross Delivery Margins (Millions of Dollars) Three Months Ended September 30, Domestic gross delivery margins, pre-tax 2010 $ 217 $ 2009 207 $ Change 10 Per Share - Diluted (after-tax) 0.02 $ 2010 2009 Three Months Ended September 30, Operating Income Adjustments: Unregulated retail electric and gas Wholesale energy marketing Net energy trading margins Energy-related businesses, net Fuel Energy purchases Other operation and maintenance Depreciation Taxes, other than income Revenue adjustments (a) Expense adjustments (a) Domestic gross delivery margins $ 522 (116) (1,244) 20(7) 322 686 366 127 56 (234) (281) $ 217 $ $ 171 (34) (669) (7) (8) 259 669 316 116 69 (610) (65) 207 (a) See additional information on the following slide. © PPL Corporation 2010 A-20
© PPL Corporation 2010
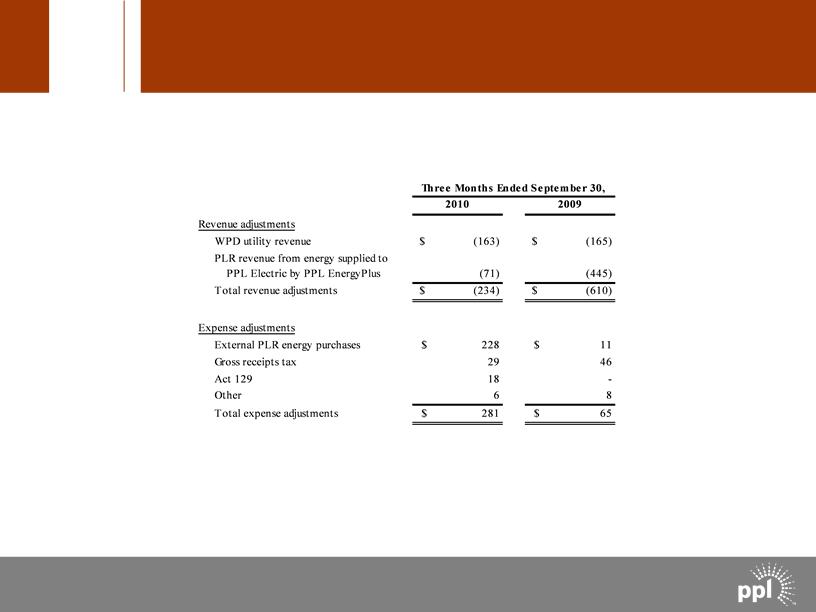
A-21
(Millions of Dollars)
Reconciliation of Third Quarter Operating
Income to Domestic Gross Delivery Margins
Income to Domestic Gross Delivery Margins
Reconciliation of Third Quarter Operating Income to Domestic Gross Delivery Margins (Millions of Dollars) Three Months Ended September 30, 2010 2009 Revenue adjustments WPD utility revenue $ (163) $ (165) PLR revenue from energy supplied to PPL Electric by PPL EnergyPlus (71) (445) Total revenue adjustments $ (234) $ (610) Expense adjustments External PLR energy purchases $ 228 $ 11 Gross receipts tax 29 46 Act129 18 - Other 6 8 Total expense adjustments $ 281 $ 65 © PPL Corporation 2010 A-21

© PPL Corporation 2010
A-22
Forward-Looking Information Statement
Statements contained in this press release, including statements with respect to future events and their timing, including statements concerning the acquisition by PPL Corporation of E.ON U.S. LLC and its subsidiaries Louisville Gas & Electric Company and Kentucky Utilities Company (collectively, the “Kentucky Entities”), the expected results of operations of any of the Kentucky Entities or PPL Corporation both before or following PPL Corporation’s acquisition of the Kentucky Entities, as well as statements as to future earnings, energy prices, margins and sales, growth, revenues, expenses, cash flow, credit profile, ratings, financing, asset disposition, marketing performance, hedging, regulation, corporate strategy and generating capacity and performance, are “forward-looking statements” within the meaning of the federal securities laws. Although PPL Corporation believes that the expectations and assumptions reflected in these forward-looking statements are reasonable, these expectations, assumptions and statements are subject to a number of risks and uncertainties, and actual results may differ materially from the results discussed in the statements. The following are among the important factors that could cause actual results to differ materially from the forward-looking statements: capital market conditions and decisions regarding capital structure; the market prices of equity securities and the impact on pension income and resultant cash funding requirements for defined benefit pension plans; the securities and credit ratings of PPL Corporation and its subsidiaries; stock price performance; receipt of necessary government permits, approvals, rate relief and regulatory cost recovery; market demand and prices for energy, capacity and fuel; weather conditions affecting customer energy usage and operating costs; competition in power markets; the effect of any business or industry restructuring; the profitability and liquidity of PPL Corporation, the Kentucky Entities and either of their subsidiaries; new accounting requirements or new interpretations or applications of existing requirements; operating performance of plants and other facilities; environmental conditions and requirements and the related costs of compliance, including environmental capital expenditures and emission allowance and other expenses; system conditions and operating costs; development of new projects, markets and technologies; performance of new ventures; asset acquisitions and dispositions; any impact of hurricanes or other severe weather on our business, including any impact on fuel prices; the impact of state, federal or foreign investigations applicable to PPL Corporation, the Kentucky Entities and either of their subsidiaries; the outcome of litigation against PPL Corporation, the Kentucky Entities and either of their subsidiaries; political, regulatory or economic conditions in states, regions or countries where PPL Corporation, the Kentucky Entities and either of their subsidiaries conduct business, including any potential effects of threatened or actual terrorism or war or other hostilities; foreign exchange rates; new state, federal or foreign legislation, including new tax or environmental legislation or regulation; and the commitments and liabilities of PPL Corporation, the Kentucky Entities and each of their subsidiaries. Any such forward-looking statements should be considered in light of such important factors and in conjunction with PPL Corporation’s Form 10-K and other reports on file with the Securities and Exchange Commission.

© PPL Corporation 2010
A-23
“Earnings from ongoing operations” is adjusted for the impact of special items. Special items include:
• Energy-related economic activity (as discussed below).
• Foreign currency-related economic hedges.
• Gains and losses on sales of assets not in the ordinary course of business.
• Impairment charges (including impairments of securities in the company’s nuclear decommissioning trust funds).
• Workforce reduction and other restructuring impacts.
• Costs and charges related to the pending E.ON U.S. acquisition.
• Other charges or credits that are, in management’s view, not reflective of the company’s ongoing operations.
Definitions of Non-GAAP Financial Measures
“Earnings from ongoing operations” should not be considered as an alternative to reported earnings, or net income attributable to PPL, which is an indicator of operating performance determined in accordance with generally accepted accounting principles (GAAP). PPL believes that “earnings from ongoing operations,” although a non-GAAP financial measure, is also useful and meaningful to investors because it provides them with management’s view of PPL’s fundamental earnings performance as another criterion in making their investment decisions. PPL’s management also uses “earnings from ongoing operations” in measuring certain corporate performance goals. Other companies may use different measures to present financial performance.
Energy-related economic activity includes the changes in fair value of positions used to economically hedge a portion of the economic value of PPL’s generation assets, load-following and retail activities. This economic value is subject to changes in fair value due to market price volatility of the input and output commodities (e.g., fuel and power). Also included in this special item are the ineffective portion of qualifying cash flow hedges and the premium amortization associated with options classified as economic activity. These items are included in ongoing earnings over the delivery period of the item that was hedged or upon realization. Management believes that adjusting for such amounts provides a better matching of earnings from ongoing operations to the actual amounts settled for PPL’s underlying hedged assets. Please refer to the Notes to the Consolidated Financial Statements and MD&A in PPL Corporation’s periodic filings with the Securities and Exchange Commission for additional information on energy-related economic activity.
“Free cash flow before dividends” is derived by deducting capital expenditures and other investing activities-net, from cash flow from operations. Free cash flow before dividends should not be considered as an alternative to cash flow from operations, which is determined in accordance with GAAP. PPL believes that free cash flow before dividends, although a non-GAAP measure, is an important measure to both management and investors since it is an indicator of the company’s ability to sustain operations and growth without additional outside financing beyond the requirement to fund maturing debt obligations. Other companies may calculate free cash flow before dividends in a different manner.

© PPL Corporation 2010
A-24
Definitions of Non-GAAP Financial Measures
(continued)
(continued)
"Domestic Gross Energy Margins" and "Domestic Gross Delivery Margins" are not intended to replace "Operating Income," which is determined in accordance with GAAP, as an indicator of overall operating performance.
• "Domestic Gross Energy Margins" is a single financial performance measure of PPL's domestic energy non-trading and trading activities. In calculating this measure, the Supply segment's energy revenues are offset by the cost of fuel and energy purchases, and adjusted for other related items. This performance measure excludes utility revenues and includes PLR revenues from energy sales to PPL Electric by PPL EnergyPlus. In addition, PPL excludes from "Domestic Gross Energy Margins" energy-related economic activity, which includes the changes in fair value of positions used to economically hedge a portion of the economic value of PPL's generation assets, full-requirement and retail activities. This economic value is subject to changes in fair value due to market price volatility of the input and output commodities (e.g., fuel and power) prior to the delivery period that was hedged. Also included in this energy-related economic activity is the ineffective portion of qualifying cash flow hedges, losses on the monetization of certain full-requirement sales contracts and premium amortization associated with options. This economic activity is deferred, with the exception of the full-requirement sales contracts monetized, and included in domestic gross energy margins earnings over the delivery period that was hedged or upon realization. PPL believes that "Domestic Gross Energy Margins" provides another criterion to make investment decisions. This performance measure is used, in conjunction with other information, internally by senior management and the Board of Directors to manage its domestic energy non-trading and trading activities. PPL's management also uses "Domestic Gross Energy Margins" in measuring certain corporate performance goals used in determining variable compensation. Other companies may use different measures to present the results of their energy non-trading and trading activities.
• "Domestic Gross Delivery Margins" is a single financial performance measure of PPL's domestic regulated electric delivery operations, which includes transmission and distribution activities, including PLR supply. In calculating this measure, domestic regulated utility revenues and expenses associated with approved recovery mechanisms, including energy provided as a PLR, are offset. These mechanisms allow for full cost recovery of certain expenses; therefore certain expenses and revenues offset with minimal impact on earnings. As a result, this measure represents the net revenues from PPL's domestic regulated electric delivery operations. This performance measure is used, in conjunction with other information, internally by senior management and the Board of Directors to manage its domestic regulated electric delivery operations. PPL believes that "Domestic Gross Delivery Margins" provides another criterion to make investment decisions. Other companies may use different measures to present the results of their regulated electric delivery operations.