Attached files
| file | filename |
|---|---|
| 8-K - FORM 8-K - OMNICARE INC | form8k-q3earnings.htm |
| EX-99.1 - EXHIBIT 99.1 - OMNICARE INC | exhibit99-1.htm |

Exhibit 99.2

Forward-Looking Statements
Except for historical information discussed, the statements made today are forward-
looking statements that involve risks and uncertainties. Investors are cautioned that
such statements are only predictions and that actual events or results may differ
materially.
looking statements that involve risks and uncertainties. Investors are cautioned that
such statements are only predictions and that actual events or results may differ
materially.
These forward-looking statements speak only as of this date. We undertake no
obligation to publicly release the results of any revisions to the forward-looking
statements made today, to reflect events or circumstances after today or to reflect the
occurrence of unanticipated events.
obligation to publicly release the results of any revisions to the forward-looking
statements made today, to reflect events or circumstances after today or to reflect the
occurrence of unanticipated events.
To facilitate comparisons and enhance understanding of core operating performance,
certain financial measures have been adjusted from the comparable amount under
Generally Accepted Accounting Principles (GAAP). A detailed reconciliation of
adjusted numbers to GAAP is posted on our Web site at www.omnicare.com.
certain financial measures have been adjusted from the comparable amount under
Generally Accepted Accounting Principles (GAAP). A detailed reconciliation of
adjusted numbers to GAAP is posted on our Web site at www.omnicare.com.
Comparisons made in this presentation deck are mostly on a sequential basis, as the
Company believes sequential comparisons are most appropriate in evaluating its
performance for the period. For comparisons to prior-year periods, please refer to the
Company’s quarterly and annual filings with the Securities and Exchange Commission.
Company believes sequential comparisons are most appropriate in evaluating its
performance for the period. For comparisons to prior-year periods, please refer to the
Company’s quarterly and annual filings with the Securities and Exchange Commission.
2

3
Table of Contents
Third Quarter 2010 Highlights…………………………………………………..………...…..
Operating Metrics - Script Data…………………………………………...……….…..…..…
Operating Metrics - Bed Data…………………..……………………...…………………..….
Adjusted Gross Profit…………………………………………………...……...…..……...…..
Adjusted Net Income………………………………………………………….…....……….....
Cash Flows..………………………………….…………….................……..........................
Cash Deployment………………………………………...……..………………………..……
2010 Guidance.………………………………………………………………..…..…….…….
Appendix……………………………………………………………………….....…...…....….
Working Capital Management………………………………………..….....………....….….
Selected Branded Drug Patent Expirations……………………………….................….…
4
5
6
7
8
9
10
11
12
13
14

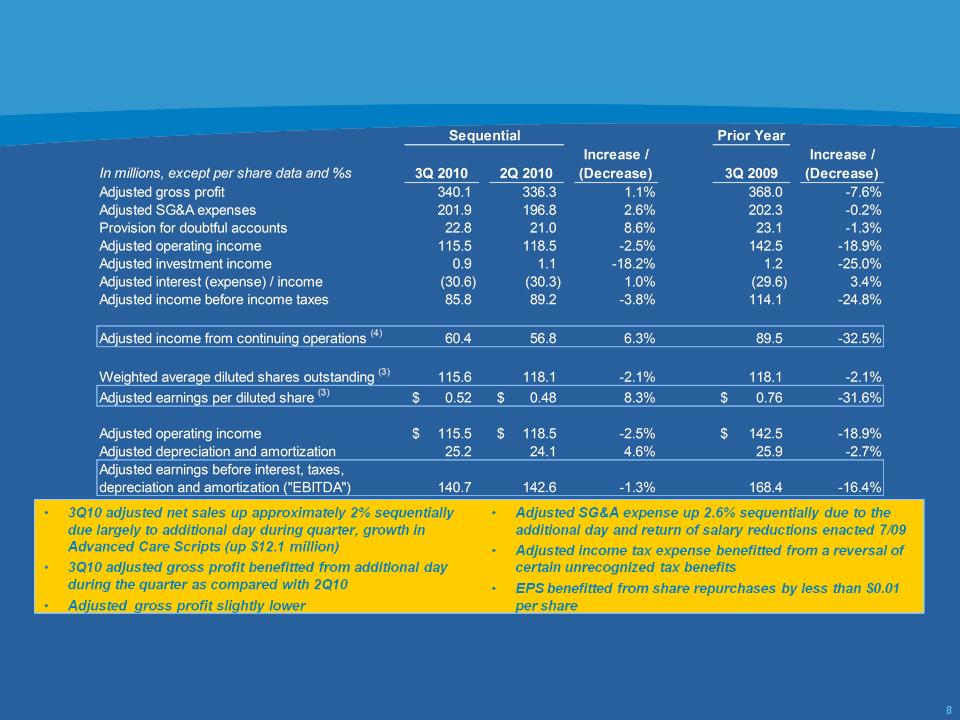
Third Quarter 2010 Highlights
• Scripts dispensed increased 1.3% sequentially
– One additional calendar day in 3Q 2010 as compared with 2Q 2010
– Number of beds served up sequentially
– Utilization stable
– Census was lower, although rate of decline improved from 2Q 2010
• Qtr. ending number of beds served(1) up 32,000 sequentially
– Increases in additions; bed adds benefitted from CCRx acquisition
– 25% sequential reduction in losses
• Net sales, gross profit higher sequentially
• Adjusted EBITDA(2),(3) slightly lower at $140.7 million
• Adjusted EPS(2),(3) up 8.3% sequentially to $0.52
• $37.4 million returned to shareholders through dividends and share
repurchases
repurchases
4
(1) Includes patients served under patient assistance programs
(2) Excludes discontinued operations
(3) Excludes special items. A reconciliation of this non-GAAP information has been attached to our press release and is also available on our Web site under
‘Supplemental Financial Information’ from the ‘Investors’ page.
‘Supplemental Financial Information’ from the ‘Investors’ page.
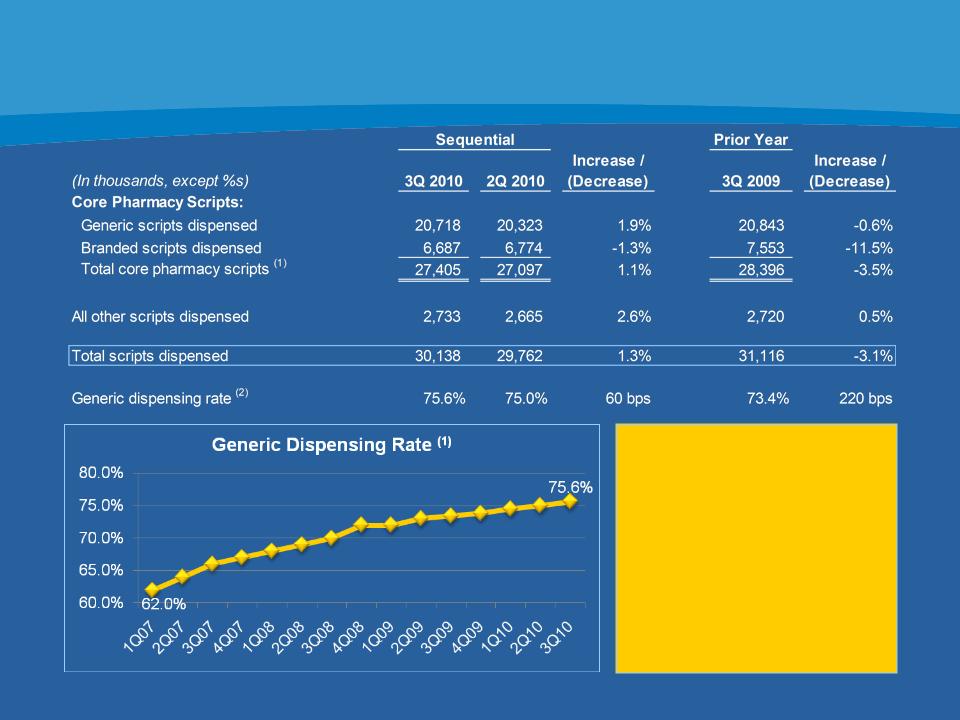
Operating Metrics - Script Data
5
• Scripts up 1.3% sequentially
largely due to:
largely due to:
• one additional day in 3Q10
• Increase in the avg.
number of beds served
during the quarter
number of beds served
during the quarter
• These factors were partially
offset by lower occupancy rates
at customer facilities (although
the trend improved) from 2Q10.
offset by lower occupancy rates
at customer facilities (although
the trend improved) from 2Q10.
• Utilization was essentially even.
(1) Excludes scripts dispensed in Omnicare’s specialty businesses and other non-institutional settings.
(2) Generic prescriptions dispensed as a percentage of institutional pharmacy scripts.
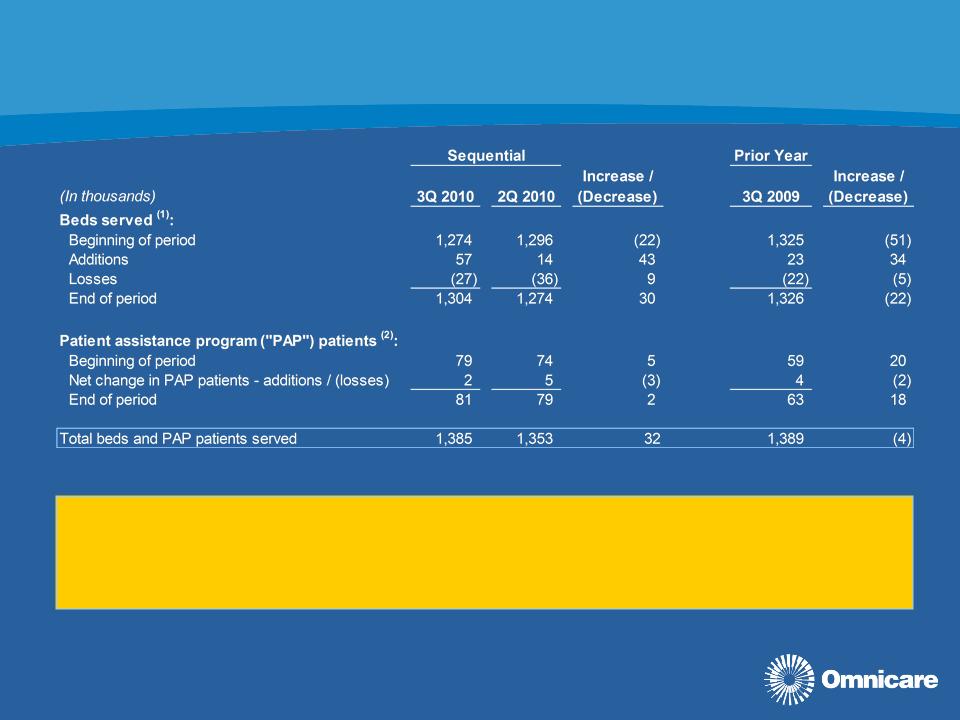
Operating Metrics - Bed Data
6
• Sequential improvements in organic additions, acquisitions and bed losses
• Additions benefitted from CCRx acquisition (44,000 beds, of which 12,000 are
prison beds)
prison beds)
(1) Beds reported as capacity in institutional settings and unique patients serviced in non-institutional settings (clinic, retail, hospice)
(2) PAP programs served by Omnicare’s specialty pharmacy business.
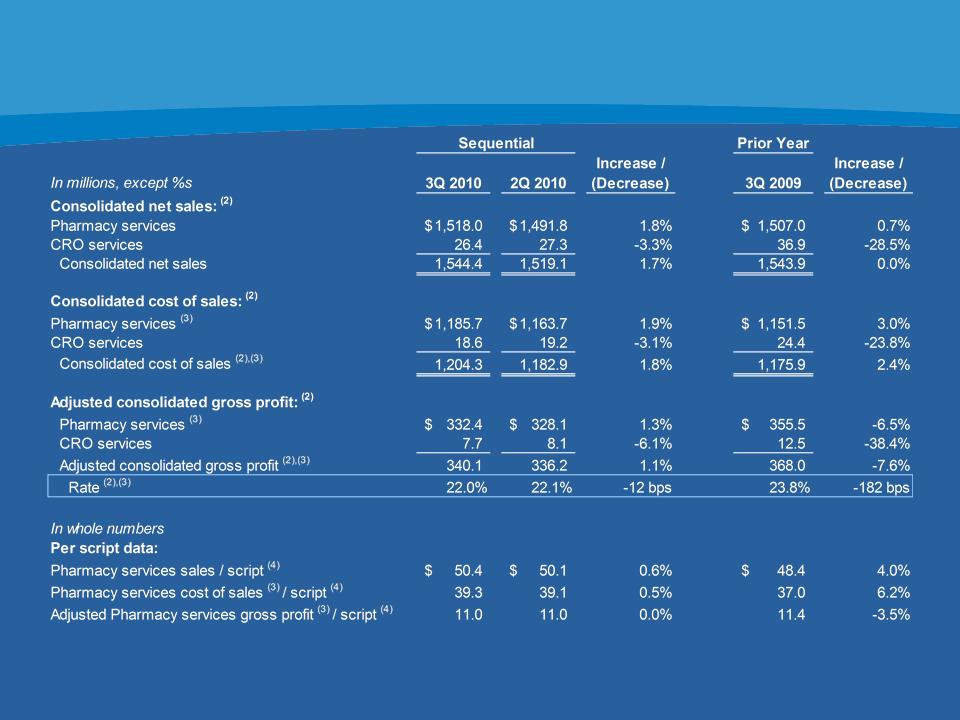
Adjusted Gross Profit (1)
7
(1) Each amount is reported independently. The sum of the individual amounts may not equal the sum of the separately presented amounts due to rounding.
(2) Excludes discontinued operations.
(3) Excludes special items. A reconciliation of this non-GAAP information has been attached to our press release and is also available on our Web site under
‘Supplemental Financial Information’ from the ‘Investors’ page.
‘Supplemental Financial Information’ from the ‘Investors’ page.
(4) Includes all scripts dispensed in the Company’s Pharmacy Services segment.
Adjusted Net Income (1),(2)
(1) All numbers shown exclude special items and discontinued operations. A reconciliation of this non-GAAP information has been attached to our press release
and is also available on our Web site under ‘Supplemental Financial Information’ from the ‘Investors’ page.
and is also available on our Web site under ‘Supplemental Financial Information’ from the ‘Investors’ page.
(2) Each amount is reported independently. The sum of the individual amounts may not equal the sum of the separately presented amounts due to rounding.
(3) The 3Q 2010 has been computed using basic weighted average shares outstanding only, as the impact of the Company’s potentially dilutive instruments was
anti-dilutive during the period due to the GAAP net loss incurred.
anti-dilutive during the period due to the GAAP net loss incurred.
(4) 3Q 2009 results included a favorable income tax adjustment of approximately $19 million, or 16 cents per diluted share, primarily attributable to the reversal of
certain unrecognized tax benefits for tax positions settled through the expiration of statutes of limitations.
certain unrecognized tax benefits for tax positions settled through the expiration of statutes of limitations.
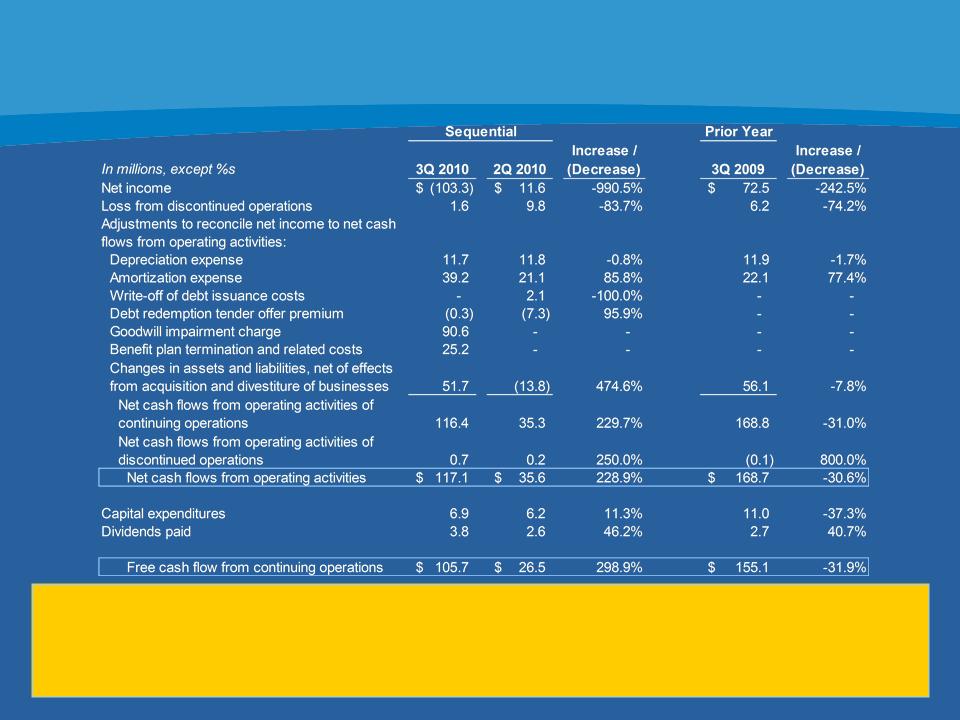
Cash Flows
9
• Sequential increase in operating cash flow reflects increase in net income, working capital improvements and smaller interest
payments in 3Q 2010.
payments in 3Q 2010.
• Operating cash flow includes:
• 2Q10 - Approximately $38 million in settlement payments
• 3Q10 - Approximately $21 million related to previously announced settlement agreement with states of MA and MI;
approximately $7 million of separation-related payments(1) related to three former Omnicare executives
approximately $7 million of separation-related payments(1) related to three former Omnicare executives
(1) Excludes benefit plan payments funded with rabbi trust assets.
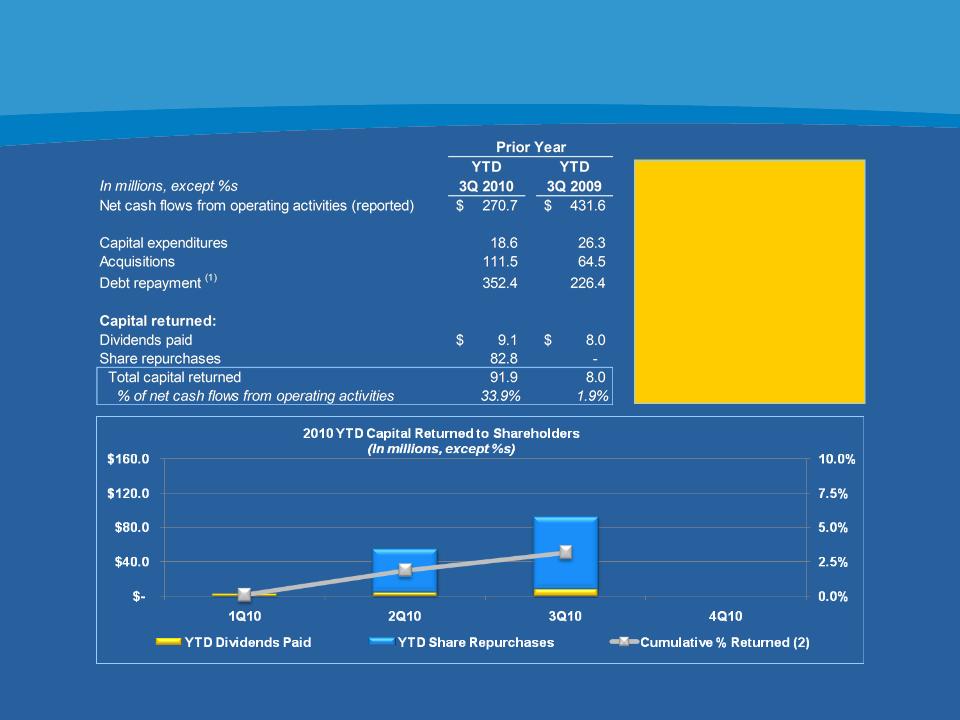
Cash Deployment
10
(1) During the second quarter of 2010, Omnicare issued $400 million of 7.75% Senior Subordinated Notes due 2020 and tendered $217 million of 6.75%
Senior Subordinated Notes due 2013.
Senior Subordinated Notes due 2013.
(2) Cumulative % Returned = (YTD Dividends Paid + YTD Share Repurchases) / 12/31/09 Market Capitalization of $2,908.4 million.
• Acquired Continuing Care
Rx (CCRX) during quarter
- 44,000 beds
Rx (CCRX) during quarter
- 44,000 beds
• Increased quarterly
dividend by 44.4% to
$0.0325 per share
dividend by 44.4% to
$0.0325 per share
• Repurchased an
additional 1.7 million
shares ($33.6 million)
during quarter - $117.2
million authorization still
available
additional 1.7 million
shares ($33.6 million)
during quarter - $117.2
million authorization still
available

2010 Guidance - No Change
11
|
|
Current Guidance (2)
|
|
|
FY 2010 Adjusted EPS (3)
|
$2.00 to $2.10
|
$2.00 to $2.10
|
|
FY 2010 Cash Flow from
Operations (4) |
$400M to $450M
|
$400M to $450M
|
(1) Guidance provided on August 5, 2010.
(2) Guidance provided on October 28, 2010.
(3) Excludes special items and discontinued operations.
(4) Excludes discontinued operations, litigation settlements, tender premiums, and certain separation-related payments related to three former
Omnicare executives.
Omnicare executives.
Reaffirming earnings per diluted share guidance(1) of $2.00 to $2.10
with full-year expectations currently trending toward high-end of range
with full-year expectations currently trending toward high-end of range

12
Appendix
13
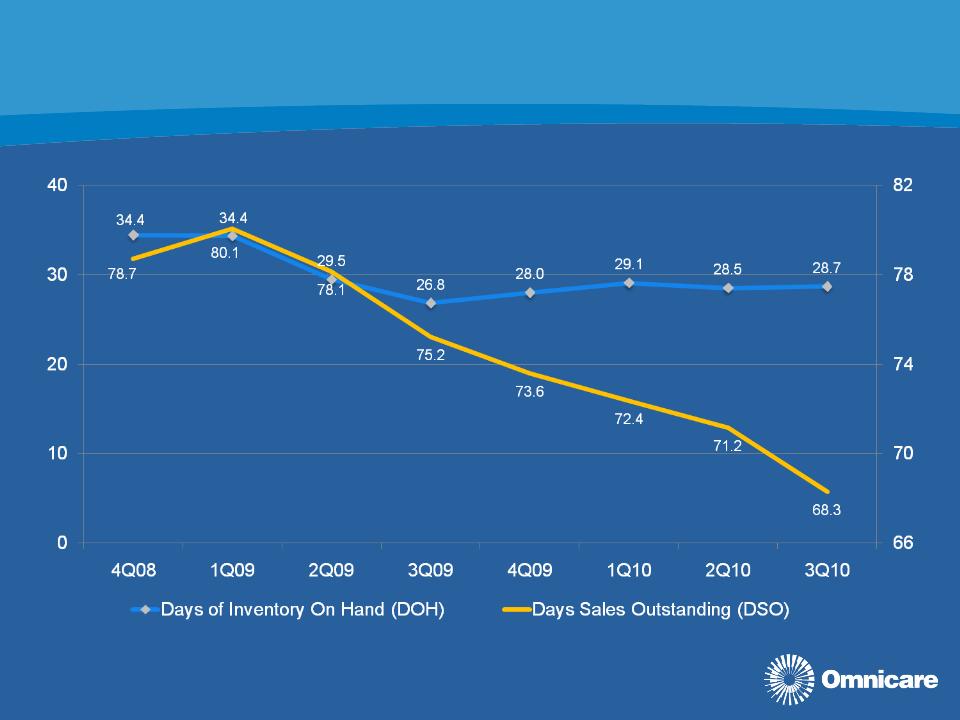
Working Capital Management
Two-Year Trend
Two-Year Trend
In # of Days
In # of Days
(1)
(1) At 9/30/10, includes approximately $85 million in receivables, or the equivalent of approximately 6 DSOs, related to past due
receivables owed to the Company by a group of customers whom the Company has commenced legal action against (and
recently reached a preliminary settlement).
receivables owed to the Company by a group of customers whom the Company has commenced legal action against (and
recently reached a preliminary settlement).

14
(1) All generic launches are subject to change due to litigation or pediatric exclusivity.
(2) Drugs already launched shown in gray and italics
|
3Q 2010
|
4Q 2010
|
FY 2011
|
|
Effexor XR
|
Ambien CR
|
Fazaclo
|
|
Exelon CAPS
|
Prevacid Soltabs
|
Femara
|
|
Diastat Rectal
|
Aricept IR
|
Gabitril
|
|
Lovenox
|
Primaxin Inj.
|
Levaquin
|
|
Merrem Inj.
|
Suboxone
|
Lipitor
|
|
Sanctura IR
|
Strattera
|
Plavix
|
|
Zegerid
|
Tussionex
|
Tricor
|
|
|
|
Uroxatrol
|
|
|
|
Xalatan
|
|
|
|
Zyprexa
|
Selected Branded Drug Patent Expirations (1),(2)