Attached files
| file | filename |
|---|---|
| 8-K - FORM 8-K - FLAGSTAR BANCORP INC | k49735e8vk.htm |
| EX-99.1 - EX-99.1 - FLAGSTAR BANCORP INC | k49735exv99w1.htm |
| EX-99.2 - EX-99.2 - FLAGSTAR BANCORP INC | k49735exv99w2.htm |
| EX-99.3 - EX-99.3 - FLAGSTAR BANCORP INC | k49735exv99w3.htm |
Exhibit 99.4

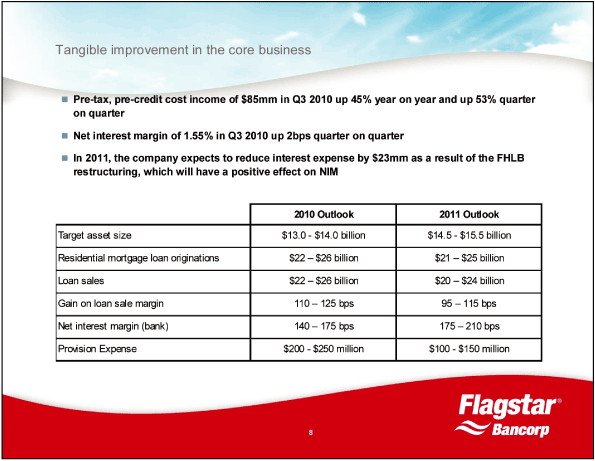
| Tangible improvement in the core business Pre-tax, pre-credit cost income of $85mm in Q3 2010 up 45% year on year and up 53% quarter on quarter Net interest margin of 1.55% in Q3 2010 up 2bps quarter on quarter In 2011, the company expects to reduce interest expense by $23mm as a result of the FHLB restructuring, which will have a positive effect on NIM 2010 Outlook 2011 Outlook Target asset size $13.0 — $14.0 billion $14.5 — $15.5 billion Residential mortgage loan originations $22 — $26 billion $21 — $25 billion Loan sales $22 — $26 billion $20 — $24 billion Gain on loan sale margin 110 — 125 bps 95 — 115 bps Net interest margin (bank) 140 — 175 bps 175 — 210 bps Provision Expense $200 — $250 million $100 — $150 million 8 |

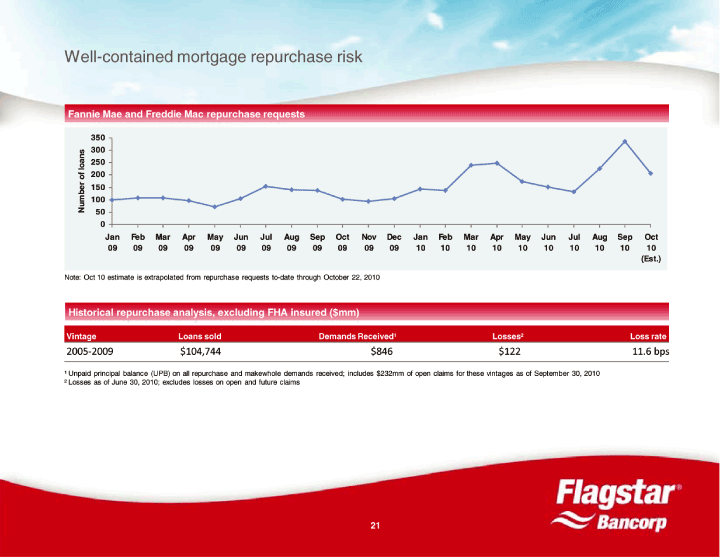
| Well-contained mortgage repurchase risk Fannie Mae and Freddie Mac repurchase requests Fannie Mae and Freddie Mac repurchase requests 350 300 250 of loans 200 Number 150 100 50 0 Jan Feb Mar Apr May Jun Jul Aug Sep Oct Nov Dec Jan Feb Mar Apr May Jun Jul Aug Sep Oct 09 09 09 09 09 09 09 09 09 09 09 09 10 10 10 10 10 10 10 10 10 10 (Est.) Note: Oct 10 estimate is extrapolated from repurchase requests to-date through October 22, 2010 Historical repurchase analysis, excluding FHA insured ( Historical repurchase analysis, excluding FHA insured ($ $mm) mm) Vintage Loans sold Demands Received 1 Repurchases made Losses 2 Loss rate 2005- 2009 $104,744 $771 $270 $107 10.2 bps 1 Unpaid principal balance (UPB) on all repurchase demands received plus UPB of makewhole demands mulitipled by historical loss rate 2 Losses as of June 30, 2010 21 |
