Attached files
| file | filename |
|---|---|
| 8-K - FORM 8-K - AVNET INC | c07356e8vk.htm |
| EX-99.1 - EXHIBIT 99.1 - AVNET INC | c07356exv99w1.htm |
Exhibit 99.2
CFO Review of Fiscal 2011 First Quarter Results
Avnet, Inc. Quarter Ending Summary
| Three Months Ended | ||||||||||||
| October 2, | October 3, | Net | ||||||||||
| 2010 | 2009 | Change | ||||||||||
| $ in millions, except per share data | ||||||||||||
Sales |
$ | 6,182.4 | $ | 4,355.0 | $ | 1,827.4 | ||||||
Gross Profit |
$ | 723.1 | $ | 499.7 | $ | 223.4 | ||||||
Gross Profit Margin |
11.70 | % | 11.47 | % | 23 | bps | ||||||
Selling, General and Administrative Expenses |
$ | 500.6 | $ | 392.7 | $ | 108.0 | ||||||
Selling, General and Administrative Expenses as % of Gross Profit |
69.23 | % | 78.57 | % | (934 | ) bps | ||||||
Selling, General and Administrative Expenses as % of Sales |
8.10 | % | 9.02 | % | (92 | ) bps | ||||||
GAAP Operating Income |
$ | 194.5 | $ | 89.0 | $ | 105.5 | ||||||
Adjusted Operating Income (1) |
$ | 222.5 | $ | 107.1 | $ | 115.5 | ||||||
Adjusted Operating Income Margin (1) |
3.60 | % | 2.46 | % | 114 | bps | ||||||
GAAP Net Income |
$ | 138.2 | $ | 50.9 | $ | 87.3 | ||||||
Adjusted Net Income (1) |
$ | 142.7 | $ | 67.2 | $ | 75.4 | ||||||
GAAP Diluted EPS |
$ | 0.90 | $ | 0.33 | $ | 0.57 | ||||||
Adjusted Diluted EPS (1) |
$ | 0.93 | $ | 0.44 | $ | 0.49 | ||||||
Return on Working Capital (ROWC) (1) |
27.44 | % | 18.73 | % | 871 | bps | ||||||
Return on Capital Employed (ROCE) (1) |
14.84 | % | 9.83 | % | 501 | bps | ||||||
Working Capital Velocity (1) |
7.62 | 7.62 | 0.00 | |||||||||
| (1) | A reconciliation of GAAP to non-GAAP financial measures is presented in the Non-GAAP
Financial Information section at the end of this document. |
| • | For the September 2010 quarter, Avnet achieved record sales of $6.18 billion, up
42% year over year driven by the combination of double digit organic growth in both EM and TS
and the impact of recent acquisitions. The year-over-year comparison of first quarter
results were impacted by: |
| (i) | the Bell, Tallard and Unidux acquisitions, |
||
| (ii) | the extra week of sales in the prior year first quarter due to
the “52/53 week” fiscal year, |
||
| (iii) | the transfer of the existing embedded business from TS Americas
to EM Americas which occurred in the first quarter of fiscal 2011 in conjunction
with the Bell acquisition, and |
||
| (iv) | the translation impact of changes in foreign currency exchange
rates. |
Sales adjusted for items (i) through (iii) are defined as “pro forma” or “organic sales.”
1
| • | Year-over-year organic sales increased 26% representing our third
consecutive quarter of year-over-year double-digit growth in organic sales. |
||
| • | Excluding the translation impact of changes in foreign currency exchange
rates (“constant dollars”), organic sales increased 29%. |
||
| • | On a sequential basis, organic sales for the quarter were up 1% as
compared with normal seasonality of down 3% to 7%. |
Operating Group Revenue
| Year-over-Year Growth Rates | ||||||||||||
| Q1 FY 11 | Reported | Pro forma | ||||||||||
| Revenue | Revenue | Revenue (2) | ||||||||||
| ($ in millions) | ||||||||||||
Avnet, Inc |
$ | 6,182.4 | 42.0 | % | 26.4 | % | ||||||
Excluding FX (1) |
45.2 | % | 29.3 | % | ||||||||
Electronics Marketing Total |
$ | 3,620.6 | 48.5 | % | 39.8 | % | ||||||
Excluding FX (1) |
52.1 | % | 43.1 | % | ||||||||
Americas |
$ | 1,259.7 | 66.3 | % | 32.9 | % | ||||||
EMEA |
$ | 1,079.7 | 36.9 | % | 49.5 | % | ||||||
Excluding FX (1) |
49.7 | % | 63.4 | % | ||||||||
Asia |
$ | 1,281.2 | 43.7 | % | 39.4 | % | ||||||
Technology Solutions Total |
$ | 2,561.8 | 33.6 | % | 11.3 | % | ||||||
Excluding FX (1) |
36.4 | % | 13.6 | % | ||||||||
Americas |
$ | 1,461.5 | 25.8 | % | 13.8 | % | ||||||
EMEA |
$ | 807.8 | 44.6 | % | 1.7 | % | ||||||
Excluding FX (1) |
55.9 | % | 9.7 | % | ||||||||
Asia |
$ | 292.5 | 48.7 | % | 31.6 | % | ||||||
| (1) | Year-over-year revenue growth rate excluding the impact of changes in foreign currency exchange
rates. |
|
| (2) | Pro forma revenue as defined in this document. |
| • | Electronics Marketing (EM) achieved revenue of $3.62 billion for the quarter, up
49% year over year in reported dollars and 52% in constant dollars and achieved its fourth
consecutive quarter of double digit year-over-year growth. |
| • | Pro forma year-over-year revenue growth was 40%, and was the third
consecutive quarter in which year-over-year organic growth was greater than 35%. |
||
| • | All regions experienced double digit year-over-year pro forma growth due
to stronger end demand and inventory replenishment across the technology industry |
||
| • | Pro forma revenue grew 4% sequentially, better than normal seasonality of down 1% to
3%. |
| • | Technology Solutions (TS) revenue of $2.56 billion grew 34% year over year in reported
dollars, achieving its fifth consecutive quarter of year-over-year growth. |
| • | Pro forma revenue grew double digits year over year for the fourth
consecutive quarter. |
||
| • | Asia revenue grew 49% year over year, its seventh consecutive quarter of
double digit growth. On a pro forma basis, Asia revenue increased 32% year over year
and 9% sequentially. |
||
| • | All three regions experienced stronger sales of networking, storage and
microprocessors partially offset by a decline in sales of proprietary servers. |
2
Avnet, Inc. Gross Profit
| Three Months Ended | ||||||||||||
| October 2, | October 3, | |||||||||||
| 2010 | 2009 | Change | ||||||||||
| ($ in millions) | ||||||||||||
Gross Profit |
$ | 723.1 | $ | 499.7 | $ | 223.4 | ||||||
Gross Profit Margin |
11.70 | % | 11.47 | % | 23 | bps | ||||||
| • | Gross profit dollars were $723 million, up 45% year over year and 12% sequentially
due to strong organic growth and the increase in sales related to acquisitions. |
|
| • | Gross profit margin of 11.7% increased 23 basis points year over year and declined 69
basis points sequentially due to the expected impact of acquisitions which include lower
margin and higher working capital velocity businesses. |
| • | Excluding acquisitions, gross profit margin increased year over year in both operating
groups. |
||
| • | EM gross profit margin increased 27 basis points year over year with EMEA
and Asia increases offsetting the decline in the Americas, which was due to the
impact of the acquisition of Bell and the transfer of the lower margin embedded
business from TS Americas to EM Americas. |
||
| • | EM gross profit margin declined 69 basis points sequentially due
primarily to the same factors that impacted the year-over-year results. |
||
| • | TS gross profit margin was
slightly lower year over year, down 12 basis
points, and down 54 basis points sequentially. Both the year-over-year and
sequential declines were primarily attributable to the EMEA region which was
impacted by the combination of the acquisition of the Bell business, which has a
lower gross profit margin profile than the existing TS EMEA businesses, and a less
favorable product mix in the existing TS EMEA businesses. |
Avnet, Inc. Operating Expenses
| Three Months Ended | ||||||||||||
| October 2, | October 3, | |||||||||||
| 2010 | 2009 | Change | ||||||||||
| ($ in millions) | ||||||||||||
Selling, General and Administrative Expenses |
$ | 500.6 | $ | 392.7 | $ | 108.0 | ||||||
Selling, General and Administrative Expenses as % of Gross Profit |
69.23 | % | 78.57 | % | (934 | ) bps | ||||||
Selling, General and Administrative Expenses as % of Sales |
8.10 | % | 9.02 | % | (92 | ) bps | ||||||
| • | Selling, general and administrative expenses (“SG&A expenses”) were $501 million,
up 27% year over year and up 13% on a pro forma basis excluding the translation impact of
changes in foreign currency exchange rates. |
| • | The increase was primarily attributable to the SG&A expenses of
approximately $80 million associated with acquisitions partially offset by the
translation impact of changes in foreign currency exchange rates of approximately
$15 million and the extra week of expenses in the prior year first quarter, of
approximately $15 million due to the Company’s fiscal calendar as mentioned
previously. |
||
| • | The 13% increase in pro forma SG&A expenses was primarily due to the
incremental costs to support the strong year-over-year organic revenue growth of
26%, demonstrating the significant leverage in our business model. |
| • | SG&A expenses as a percentage of gross profit improved by 934 basis points over the
prior year first quarter. |
| • | At 69.2% this is the first time SG&A expenses as a percentage of gross
profit have been below 70% for a September quarter since FY 08. |
3
| • | Corporate expenses were lower than expected by approximately $6.0 million pre-tax and
$3.6 million after tax, due to the postponement of certain equity compensation grants that
are now expected to impact the December 2010 quarter. |
Operating Income
| October 2, | October 3, | |||||||||||
| 2010 | 2009 | Change | ||||||||||
| ($ in millions) | ||||||||||||
GAAP Operating Income |
$ | 194.5 | $ | 89.0 | $ | 105.5 | ||||||
Adjusted Operating Income (1) |
$ | 222.5 | $ | 107.1 | $ | 115.5 | ||||||
Adjusted Operating Income Margin (1) |
3.60 | % | 2.46 | % | 114 | bps | ||||||
Electronics Marketing |
||||||||||||
Operating Income |
$ | 192.1 | $ | 81.4 | $ | 110.7 | ||||||
Operating Income Margin |
5.31 | % | 3.34 | % | 197 | bps | ||||||
Technology Solutions |
||||||||||||
Operating Income |
$ | 56.7 | $ | 51.4 | $ | 5.3 | ||||||
Operating Income Margin |
2.21 | % | 2.68 | % | (47 | ) bps | ||||||
| (1) | A reconciliation of GAAP to non-GAAP financial measures is presented in the
Non-GAAP Financial Information section at the end of this document. |
| • | Adjusted enterprise operating income of $223 million was up 108% as compared with
the prior year quarter. |
| • | Excluding acquisitions, EM operating income increased in all regions both
year over year and sequentially. |
| • | Adjusted operating income margin at the enterprise level of 3.6% was up 114 basis points over the
prior year quarter. |
| • | The increase is attributable to operating leverage on the significant
increase in organic sales, firming gross profit margins in our legacy businesses in
both operating groups, and our continued expense control somewhat offset by the
impact of acquisitions pending the full realization of the expected
synergies of at least $60 million. |
||
| • | EM operating income margin increased 197 basis points year over year to
5.3%, which is within management’s target range for EM for the third consecutive
quarter. |
| • | Adjusted operating income margin decreased 56 basis points sequentially which was an expected
impact of the acquisitions pending the full realization of the anticipated synergies and
normal seasonal factors. |
4
Avnet, Inc. Interest Expense, Other Income and Income Taxes
| Three Months Ended | ||||||||||||
| October 2, | October 3, | |||||||||||
| 2010 | 2009 | Change | ||||||||||
| ($ in millions) | ||||||||||||
Interest Expense |
$ | (22.0 | ) | $ | (15.3 | ) | $ | (6.7 | ) | |||
Other Income |
$ | 3.3 | $ | 2.9 | $ | 0.4 | ||||||
GAAP Income Taxes |
$ | 66.6 | $ | 25.7 | $ | 40.9 | ||||||
Adjusted Income Taxes (1) |
$ | 61.2 | $ | 27.5 | $ | 33.7 | ||||||
GAAP Effective Tax Rate |
32.5 | % | 33.6 | % | (106 | ) bps | ||||||
Adjusted Effective Tax Rate (1) |
30.0 | % | 29.0 | % | 100 | bps | ||||||
| (1) | A reconciliation of GAAP to non-GAAP financial measures is presented in the Non-GAAP
Financial Information section at the end of this document. |
| • | Interest expense for the September 2010 quarter was $22 million, up $6.7 million
over the prior year quarter primarily attributable to the $300 million 5.875% Notes issued
on June 22, 2010 and $104 million 3.75% Notes assumed in the Bell acquisition. |
|
| • | The adjusted effective tax rate was 30% in the first quarter, up 100 basis points from
the year ago quarter. |
Avnet, Inc. Net Income
| Three Months Ended | ||||||||||||
| October 2, | October 3, | |||||||||||
| 2010 | 2009 | Change | ||||||||||
| ($ in millions, except per share data) | ||||||||||||
GAAP Net Income |
$ | 138.2 | $ | 50.9 | $ | 87.3 | ||||||
Adjusted Net Income (1) |
$ | 142.7 | $ | 67.2 | $ | 75.4 | ||||||
GAAP Diluted EPS |
$ | 0.90 | $ | 0.33 | $ | 0.57 | ||||||
Adjusted Diluted EPS (1) |
$ | 0.93 | $ | 0.44 | $ | 0.49 | ||||||
| (1) | A reconciliation of GAAP to non-GAAP financial measures is presented in the Non-GAAP
Financial Information section at the end of this document. |
| • | Adjusted net income for the quarter was $143 million, or 93 cents per share on a
diluted basis, an increase in net income of 112% over the prior year quarter. |
|
| • | GAAP net income was $138 million, or 90 cents per share on a diluted basis, for the
quarter. Included in GAAP net income is a total of $4.5 million after tax and 3 cents per
share on a diluted basis related to restructuring, integration and other charges and a
non-cash income tax adjustment offset by a gain on Unidux to
recognize negative goodwill. |
5
Avnet, Inc. Balance Sheet Returns
| • | Return on working capital (ROWC) for the quarter was 27.4%, improving 871 basis
points year over year. |
|
| • | Return on capital employed (ROCE) for the quarter was 14.8%, 501 basis points higher
than the year ago quarter and within our stated target range of 14% to 16%. |
| • | ROCE was down 350 basis points sequentially due to the expected impact of
new acquisitions pending the full realization of anticipated synergies. |
| • | Working capital (receivables plus inventory less accounts payable) increased 37%
sequentially, or $931 million, due to the impact of acquisitions, the impact of foreign
currency translation and the strong growth in organic sales. |
| • | Of the $913 million increase, 61% was attributable to acquisitions, 27%
was incurred to support growth in the business, and 12% was due to the impact of
foreign currency. |
| • | Working capital velocity was flat compared with the year ago quarter at 7.62 and remains
near record levels. |
6
Avnet, Inc. Cash Flow Items
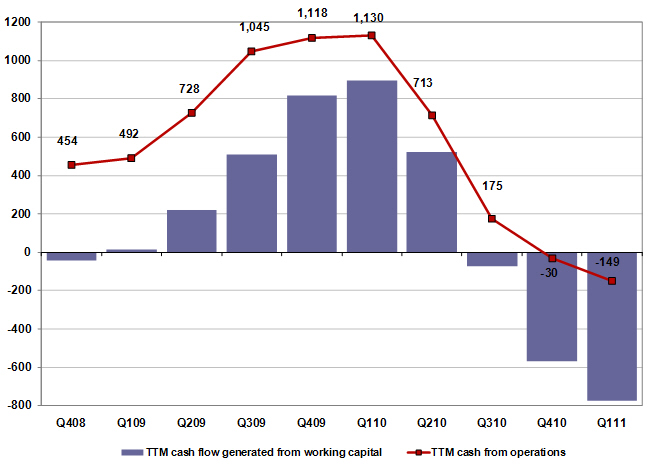
| • | Cash and cash equivalents was $662 million at the end of the quarter. |
|
| • | Inventory increased 38%, or $683 million, sequentially. Inventory days increased 3 days
sequentially and remained flat year over year. |
| • | Of the $683 million increase, 48% was attributable to acquisitions, 41%
was incurred to support growth in the business and the receipt of components
that had been in short supply, and 11% was due to the impact of foreign currency. |
||
| • | EM’s inventory increased 32%, or $464 million, sequentially. Of the $464
million increase, 47% was incurred to support growth in the business, 41% was
attributable to acquisitions, and 12% was due to the impact of foreign currency. |
| • | Inventory turns were flat with the year ago quarter at 9.5 and remained substantially
higher than pre-recession levels. |
|
| • | We maintained our investment grade credit statistics with our debt to EBITDA ratio at
2.0 and EBITDA coverage ratio at 12.6, on a trailing twelve months basis. |
7
Risk Factors
The discussion of Avnet’s business and operations should be read together with the risk factors
contained in Item 1A of its 2010 Annual Report on Form 10-K, filed with the Securities and Exchange
Commission, which describe various risks and uncertainties to which the Company is or may become
subject. These risks and uncertainties have the potential to affect Avnet’s business, financial
condition, results of operations, cash flows, strategies or prospects in a material and adverse
manner.
Non-GAAP Financial Information
In addition to disclosing financial results that are determined in accordance with generally
accepted accounting principles in the United States (“GAAP”), the Company also discloses in this
press release certain non-GAAP financial information including adjusted operating income, adjusted
net income and adjusted diluted earnings per share, as well as revenue adjusted for the impact of
acquisitions and other items (as defined in the Pro Forma (Organic) Revenue section of this
release). Management believes pro forma revenue is a useful measure for evaluating current period
performance as compared with prior periods and for understanding underlying trends.
Management believes that operating income adjusted for restructuring, integration and other items
is a useful measure to help investors better assess and understand the Company’s operating
performance, especially when comparing results with previous periods or forecasting performance for
future periods, primarily because management views the excluded items to be outside of Avnet’s
normal operating results. Management analyzes operating income without the impact of these items as
an indicator of ongoing margin performance and underlying trends in the business. Management also
uses these non-GAAP measures to establish operational goals and, in some cases, for measuring
performance for compensation purposes.
Management believes net income and EPS adjusted for the impact of the items described above is
useful to investors because it provides a measure of the Company’s net profitability on a more
comparable basis to historical periods and provides a more meaningful basis for forecasting future
performance. Additionally, because of management’s focus on generating shareholder value, of which
net profitability is a primary driver, management believes net income and EPS excluding the impact
of these items provides an important measure of the Company’s net results of operations for the
investing public.
Other metrics management monitors in its assessment of business performance include return on
working capital (ROWC), return on capital employed (ROCE) and working capital velocity.
| • | ROWC is defined as annualized operating income, excluding restructuring,
integration and other items, divided by the sum of the monthly average balances of
receivables and inventory less accounts payable. |
||
| • | Working capital velocity (“WC velocity”) is defined as annualized sales divided
by the sum of the monthly average balances of accounts receivable and inventory less
accounts payable. |
||
| • | ROCE is defined as annualized tax affected operating income, excluding
restructuring, integration and other items, divided by the monthly average balances of
interest-bearing debt and equity less cash and cash equivalents (“average capital”). |
However, analysis of results and outlook on a non-GAAP basis should be used as a complement to, and
in conjunction with, data presented in accordance with GAAP.
8
First Quarter Fiscal 2011
| First Quarter Fiscal 2011 | ||||||||||||||||
| Diluted | ||||||||||||||||
| Op Income | Pre-tax | Net Income | EPS | |||||||||||||
| $ in thousands, except per share data | ||||||||||||||||
GAAP results |
$ | 194,462 | $ | 204,799 | $ | 138,174 | $ | 0.90 | ||||||||
Restructuring, integration and other charges |
28,067 | 28,067 | 20,161 | 0.13 | ||||||||||||
Gain on bargain purchase and other |
— | (29,023 | ) | (29,577 | ) | (0.19 | ) | |||||||||
Income tax
adjustments |
— | — | 13,932 | 0.09 | ||||||||||||
Total adjustments |
28,067 | (956 | ) | 4,516 | 0.03 | |||||||||||
Adjusted results |
$ | 222,529 | $ | 203,843 | $ | 142,690 | 0.93 | |||||||||
Items impacting the first quarter of fiscal 2011 consisted of the following:
| • | restructuring, integration and other charges of $28.1 million pre-tax which were incurred
primarily in connection with the acquisition and integration of acquired businesses and
consisted of $10.8 million for transaction costs associated with the recent acquisitions, $8.3
million for severance, $7.3 million for integration-related costs, $2.4 million for facility
exit related costs and other charges, and a reversal of $0.7 million to adjust prior year
restructuring reserves; |
|
| • | a gain on the bargain purchase of $31.0 million pre-and after tax related to the Unidux
acquisition for which the gain was not taxable partially offset by $2.0 million pre-tax of
charges primarily related to the write down of two buildings in EMEA; and |
|
| • | an income tax adjustment of $13.9 million primarily related to the non-cash write-off of a
deferred tax asset associated with the integration of an acquisition. |
First Quarter Fiscal 2010
| First Quarter Fiscal 2010 | ||||||||||||||||
| Diluted | ||||||||||||||||
| Op Income | Pre-tax | Net Income | EPS | |||||||||||||
| $ in thousands, except per share data | ||||||||||||||||
GAAP results |
$ | 89,000 | $ | 76,635 | $ | 50,895 | $ | 0.33 | ||||||||
Restructuring, integration and other charges |
18,072 | 18,072 | 13,202 | 0.09 | ||||||||||||
Income tax
adjustments |
— | — | 3,145 | 0.02 | ||||||||||||
Total adjustments |
18,072 | 18,072 | 16,347 | 0.11 | ||||||||||||
Adjusted results |
$ | 107,072 | $ | 94,707 | $ | 67,242 | 0.44 | |||||||||
Items impacting the first quarter of fiscal 2010 consisted of the following:
| • | restructuring, integration and other charges of $18.1 million pre-tax consisted of
severance costs, facility exit costs, and fixed asset write-downs related to previously
announced cost reduction actions, a reversal of excess prior year restructuring reserves, and
integration costs associated with acquired businesses and other charges; |
|
| • | a net increase in taxes of $3.1 million related an adjustment for a prior year tax return
and additional tax reserves, net of a benefit from a favorable income tax audit settlement. |
9
Pro Forma (Organic) Revenue
Pro forma or Organic revenue is defined as reported revenue adjusted for (i) the impact of
acquisitions by adjusting Avnet’s prior periods to include the sales of businesses acquired as if
the acquisitions had occurred at the beginning of fiscal 2010; (ii) the impact of the extra week
of sales in the prior year first quarter due to the “52/53 week” fiscal year; and (iii) the
impact of the transfer of the existing embedded business from TS Americas to EM Americas which
occurred in the first quarter of fiscal 2011, which did not have an impact to Avnet on a
consolidated basis but did impact the groups by $98 million. Sales taking into account the
combination of these adjustments is referred to as “pro forma sales” or “organic sales”.
Revenue adjusted for this impact is presented in the following table:
| Revenue | Acquisition | Extra Week | Pro forma | |||||||||||||
| as Reported | Revenue | in Q1 FY 10 | Revenue | |||||||||||||
| (in thousands) | ||||||||||||||||
Q1 Fiscal 2011 |
$ | 6,182,388 | $ | 21,387 | $ | — | $ | 6,203,775 | ||||||||
Q1 Fiscal 2010 |
$ | 4,355,036 | $ | 969,174 | $ | (417,780 | ) | $ | 4,906,430 | |||||||
Q2 Fiscal 2010 |
4,834,524 | 1,108,575 | — | 5,943,099 | ||||||||||||
Q3 Fiscal 2010 |
4,756,786 | 1,026,859 | — | 5,783,645 | ||||||||||||
Q4 Fiscal 2010 |
5,213,826 | 921,216 | — | 6,135,042 | ||||||||||||
Fiscal year 2010 |
$ | 19,160,172 | $ | 4,025,824 | $ | (417,780 | ) | $ | 22,768,216 | |||||||
“Acquisition Revenue” as presented in the preceding table includes the following acquisitions:
| Acquired Business | Operating Group | Acquisition Date | ||
Bell Micro Products Inc. |
EM/TS | July 2010 | ||
Tallard Technologies |
TS | July 2010 | ||
Unidux |
EM | July 2010 |
10
The following table presents the calculation for ROWC, WC velocity and ROCE. The reconciliation to
the nearest GAAP metric is either presented below or in a prior table in this Non-GAAP Information
section.
| Q1 FY 11 | Q1 FY 10 | |||||||||||
Sales |
6,182,388 | 4,355,036 | ||||||||||
Sales, annualized (1) |
(a | ) | 24,729,552 | 16,486,923 | ||||||||
Adjusted operating income (2) |
222,529 | 107,072 | ||||||||||
Adjusted operating income, annualized (1) |
(b | ) | 890,115 | 405,346 | ||||||||
Adjusted effective tax rate (2) |
30.00 | % | 29.43 | % | ||||||||
Adjusted operating income, net after tax |
(c | ) | 623,081 | 286,052 | ||||||||
Average monthly working capital (3) |
||||||||||||
Accounts receivable |
4,089,995 | 2,621,529 | ||||||||||
Inventory |
2,295,139 | 1,508,930 | ||||||||||
Accounts payable |
(3,140,987 | ) | (1,966,382 | ) | ||||||||
Average working capital |
(d | ) | 3,244,147 | 2,164,078 | ||||||||
Average monthly total capital (3) |
(e | ) | 4,197,598 | 2,910,604 | ||||||||
ROWC = (b) / (d) |
27.44 | % | 18.73 | % | ||||||||
WC Velocity = (a) / (d) |
7.62 | 7.62 | ||||||||||
ROCE = (c ) / (e) |
14.84 | % | 9.83 | % | ||||||||
| (1) | First quarter of fiscal 2010 annualized is based uon a 14 week quarter as fiscal 2010
was a 53 week year. Fiscal 2011 is a 52 week year. |
|
| (2) | See reconciliation to GAAP amounts in the preceding tables in this Non-GAAP
Financial Information Section. |
|
| (3) | For averaging purposes, the working capital and total capital for Bell Micro was
included as of the beginning of fiscal 2011. |
11