Attached files
Exhibit 99.02

3Q10 Earnings Presentation
AllianceBernstein.com
Oct 28, 2010
Peter S. Kraus
Chairman & Chief Executive Officer
David A. Steyn
Chief Operating Officer
John B. Howard
Chief Financial Officer
Third Quarter 2010 Review

3Q10 Earnings Presentation
2
AllianceBernstein.com
Certain statements provided by management in this presentation are “forward-looking statements” within the meaning of the Private Securities Litigation
Reform Act of 1995. Such forward-looking statements are subject to risks, uncertainties, and other factors that could cause actual results to differ
materially from future results expressed or implied by such forward-looking statements. The most significant of these factors include, but are not limited
to, the following: the performance of financial markets, the investment performance of sponsored investment products and separately-managed
accounts, general economic conditions, industry trends, future acquisitions, competitive conditions, and current and proposed government regulations,
including changes in tax regulations and rates and the manner in which the earnings of publicly-traded partnerships are taxed. AllianceBernstein cautions
readers to carefully consider such factors. Further, such forward-looking statements speak only as of the date on which such statements are made;
AllianceBernstein undertakes no obligation to update any forward-looking statements to reflect events or circumstances after the date of such
statements. For further information regarding these forward-looking statements and the factors that could cause actual results to differ, see “Risk
Factors” and “Cautions Regarding Forward-Looking Statements” in AllianceBernstein’s Form 10-K for the year ended December 31, 2009 and
subsequent Forms 10-Q. Any or all of the forward-looking statements made in this presentation, Form 10-K, Form 10-Q, other documents
AllianceBernstein files with or furnishes to the SEC, and any other public statements issued by AllianceBernstein, may turn out to be wrong. It is
important to remember that other factors besides those listed in “Risk Factors” and “Cautions Regarding Forward-Looking Statements”, and those listed
below, could also adversely affect AllianceBernstein’s financial condition, results of operations and business prospects.
The forward-looking statements referred to in the preceding paragraph include statements regarding:
< The pipeline of new institutional mandates not yet funded: Before they are funded, institutional mandates do not represent legally binding
commitments to fund and, accordingly, the possibility exists that not all mandates will be funded in the amounts and at the times currently anticipated.
commitments to fund and, accordingly, the possibility exists that not all mandates will be funded in the amounts and at the times currently anticipated.
< The degree to which the $90 million real estate charge will reduce occupancy costs on existing real estate in 2011 and subsequent years:
The charge we recorded this quarter and our estimates of reduced occupancy costs in future years are based on our current assumptions of when we
can sub-lease our space and current market rental rates, both of which are factors largely beyond our control. If our assumptions prove to be incorrect,
we may be forced to take an additional charge and/or our estimated occupancy cost reductions may be less than we currently anticipate.
< Our intention to continue to engage in open market purchases of Holding Units, from time to time, to help fund anticipated obligations
under our incentive compensation award program: The number of Holding Units needed in future periods to make incentive compensation awards is
dependent upon various factors, some of which are beyond our control, including fluctuation in the price of a Holding Unit.
under our incentive compensation award program: The number of Holding Units needed in future periods to make incentive compensation awards is
dependent upon various factors, some of which are beyond our control, including fluctuation in the price of a Holding Unit.
< Our initiatives continuing to progress: Changes and volatility in political, economic, capital market or industry conditions can result in changes in
demand for our products and services or impact the value of our assets under management, all of which may significantly hinder our ability to continue
forward with our initiatives.
demand for our products and services or impact the value of our assets under management, all of which may significantly hinder our ability to continue
forward with our initiatives.
Cautions Regarding Forward-Looking Statements
3Q10 Earnings Presentation
3
AllianceBernstein.com
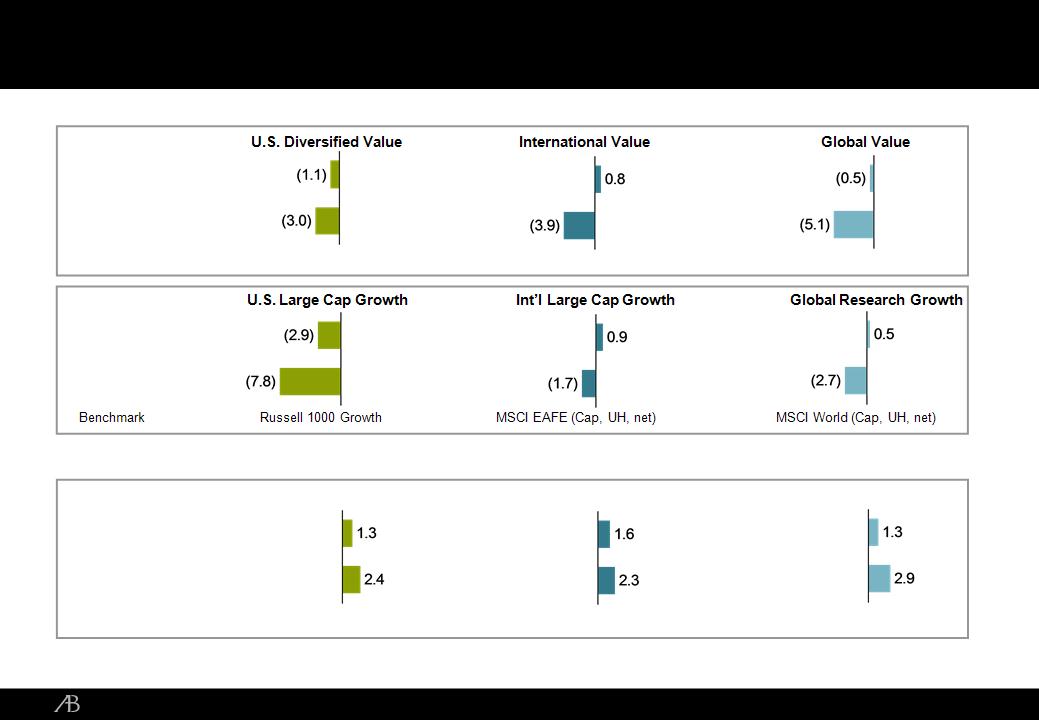
Benchmark Russell 1000 Value MSCI EAFE (Cap, UH, net) MSCI World (Cap, UH, net)
Institutional Equity Composites vs. Benchmarks (Percent)
Performance is preliminary as of Sept 30, 2010.
The information in this table is provided solely for use in connection with this presentation, and is not directed toward existing or potential investment advisory clients of AllianceBernstein.
Investment performance of composites is presented after investment management fees.
3Q10
2010 YTD
3Q10
2010 YTD
3Q10
2010 YTD
Institutional Fixed Income Composites vs. Benchmarks (Percent)
Benchmark Custom Index JPM EMBI Global Barclays Global Aggregate
Bond Index (Unhedged)
Bond Index (Unhedged)
Strategic Core Plus
Global Plus
Emerging Market Debt
Relative Investment Performance
3Q10 Earnings Presentation
4
AllianceBernstein.com
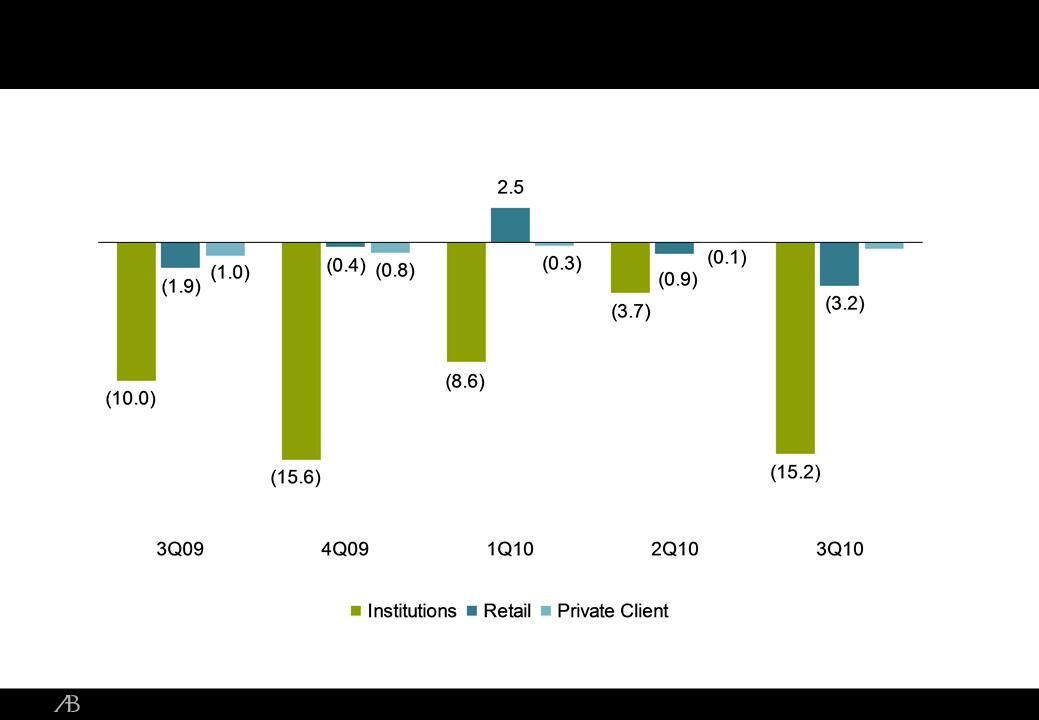
In U.S. dollars billions
Total: (12.9) (16.8) (6.4) (4.7) (18.9)
(0.5)
Net Flows By Distribution Channel
3Q10 Earnings Presentation
5
AllianceBernstein.com
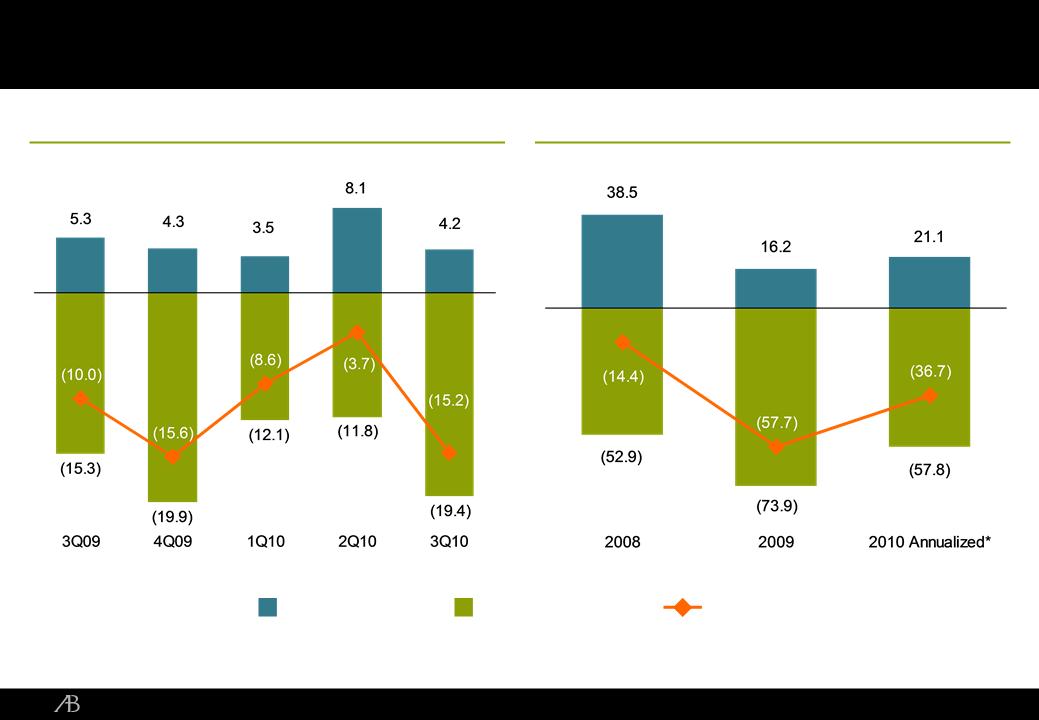
Gross Inflows
Net Flows
Gross Outflows
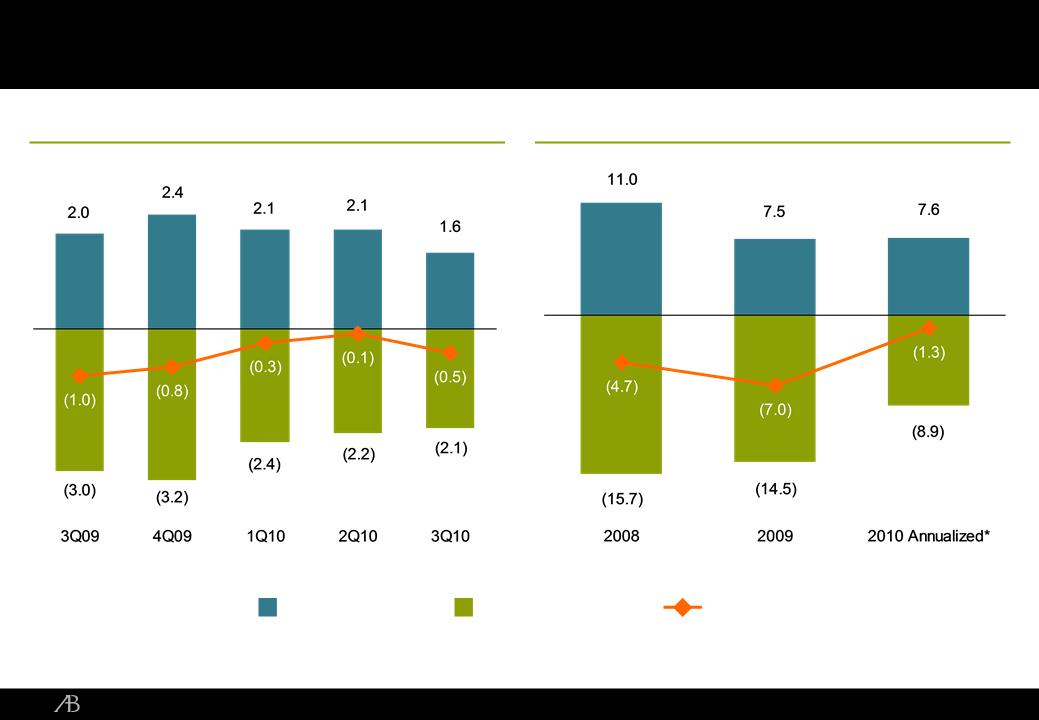
*YTD numbers annualized {Gross Inflows, $15.8, Gross Outflows, ($43.3), Net Flows, ($27.5)}
Quarterly View
Annual Trend
In U.S. dollar billions
Institutional Flow Trends
3Q10 Earnings Presentation
6
AllianceBernstein.com
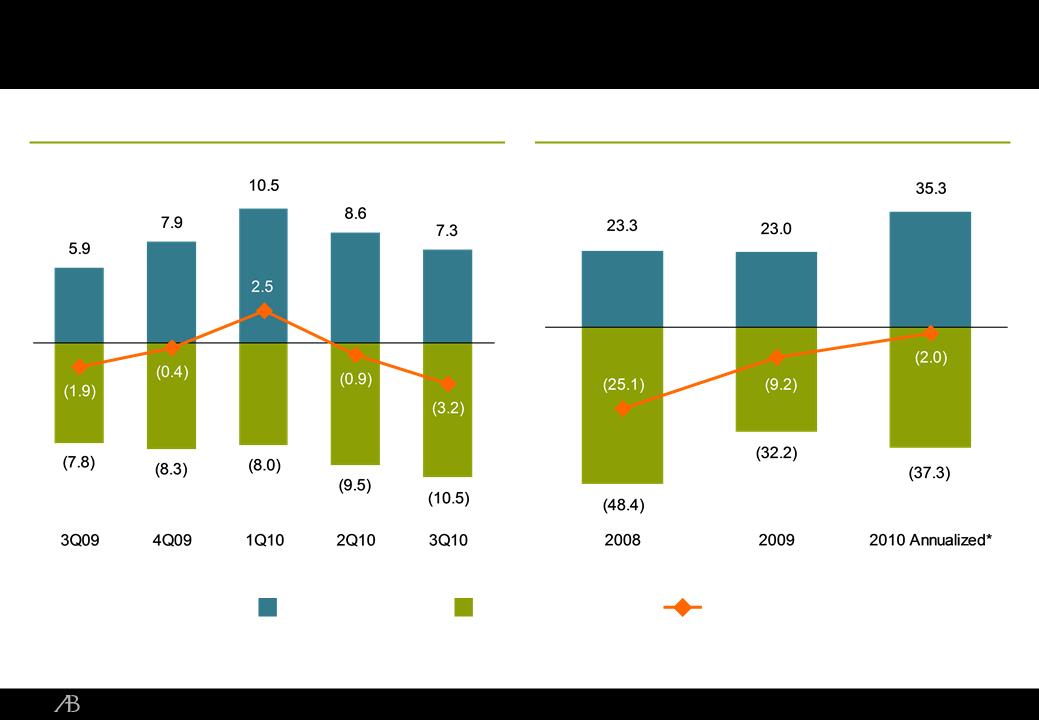
Gross Inflows
Net Flows
Gross Outflows
*YTD numbers annualized {Gross Inflows, $26.5, Gross Outflows, ($28.0), Net Flows, ($1.5)}
Quarterly View
Annual Trend
In U.S. dollar billions
Retail Flow Trends
3Q10 Earnings Presentation
7
AllianceBernstein.com
Gross Inflows
Net Flows
Gross Outflows
* YTD numbers annualized {Gross Inflows, $5.7, Gross Outflows, ($6.7), Net Flows, ($1.0)}
Quarterly View
Annual Trend
In U.S. dollar billions
Private Client Flow Trends

3Q10 Earnings Presentation
8
AllianceBernstein.com
< Revenue down 18% versus prior quarter, with both U.S. and Europe impacted by weak market
volumes
volumes
< Sustained investment despite market deceleration
<4 new analysts added in the U.S.
<Expect 25+ staff in Hong Kong/Singapore by year-end
< Strong recognition in annual Institutional Investor All-America survey
= Bernstein analysts voted #1 in 10 different sectors
= Bernstein placed 6th overall in league table, 4th when weighted by analyst rankings
Bernstein Research Services

3Q10 Earnings Presentation
9
AllianceBernstein.com
Financial Highlights: Third Quarter 2010
< Adjusted EPU for 3Q of 36 cents (versus 2Q adjusted EPU of 37 cents)
< Adjusted Revenues were down $16m (2%) from 2Q
< Adjusted Operating Margin of 19.3% for 3Q, down from 20.7% in 2Q
< 2010 full year effective tax rate estimated to be 9.3%, down from 10.3% at the end of 2Q
< Recorded a $90 million real estate charge in 3Q to reflect our intention to sublease over
300,000 sq/ft in NY
300,000 sq/ft in NY
= 2011 savings of approximately $21M; approximately $23M in 2012 and subsequent years
= At current level of Units outstanding, 2011 impact would be $0.07 and 2012 and forward $0.08 annually
< Inclusive of the real estate charge, GAAP EPU for 3Q of 12 cents (versus 2Q EPU of 31 cents).
Excluding real estate charge, GAAP EPU of 44 cents
Excluding real estate charge, GAAP EPU of 44 cents
< Repurchased 1.9 million units in 3Q; 4.9 million units repurchased year-to-date

3Q10 Earnings Presentation
10
AllianceBernstein.com
Please refer to pages 33-37 for additional information on the reconciliation of GAAP financial results to adjusted financial results
Percentages are calculated using expenses rounded to the nearest thousand
(1) Contingent proceeds from sale of cash management business to Federated completed in 2Q10
|
|
3Q
2010 |
2Q
2010 |
Percent
Change |
3Q
2009 |
Percent
Change |
|
Net Revenues
|
$758
|
$688
|
10%
|
$806
|
(6%)
|
|
Operating Expenses (excluding real estate charge)
|
610
|
580
|
5%
|
583
|
5%
|
|
Real Estate Charge
|
90
|
0
|
n/m
|
0
|
n/m
|
|
Operating Income
|
58
|
108
|
(47%)
|
223
|
(74%)
|
|
Non-Operating Income(1)
|
0
|
2
|
n/m
|
17
|
n/m
|
|
Income Before Income Taxes
|
58
|
110
|
(48%)
|
240
|
(76%)
|
|
Income Taxes
|
3
|
13
|
(77%)
|
14
|
(78%)
|
|
Net Income
|
55
|
97
|
(44%)
|
226
|
(76%)
|
|
Net (Income) Loss of Consolidated Entities
Attributable to Non-Controlling Interests |
(3)
|
9
|
n/m
|
(27)
|
(89%)
|
|
Net Income Attributable to AllianceBernstein Unitholders
|
$52
|
$106
|
(51%)
|
$199
|
(74%)
|
|
AllianceBernstein Holding GAAP Diluted Net Income per Unit
|
$0.12
|
$0.31
|
(61%)
|
$0.67
|
(82%)
|
|
|
|
|
|
|
|
|
AllianceBernstein Holding Adjusted Diluted Net Income Per Unit
|
$0.36
|
$0.37
|
(3%)
|
$0.48
|
(25%)
|
In U.S. dollars millions (excluding per-Unit amounts)
Third Quarter 2010 Income Statement

3Q10 Earnings Presentation
11
AllianceBernstein.com
Percentages are calculated using revenues and expenses rounded to the nearest thousand
(1) Includes investment (gains) losses and dividends and interest on deferred compensation-related investments and 90% of the investment (gains) losses of our consolidated venture capital fund
Please refer to pages 33-37 for additional information on the reconciliation of GAAP financial results to adjusted financial results
<Adjusted revenues down 2% from 2Q10
<Base fees down 2% from 2Q10 due to lower average AUM
<Bernstein Research revenues down 18% from 2Q10 due to lower global equity market volumes
|
Revenues (in U.S. dollar millions) |
3Q
2010 |
2Q
2010 |
Percent
Change |
3Q
2009 |
Percent
Change |
|
Base Fees
|
$498
|
$510
|
(2%)
|
$484
|
3%
|
|
Performance Fees
|
6
|
3
|
92%
|
0
|
n/m
|
|
Bernstein Research
|
96
|
117
|
(18%)
|
109
|
(12%)
|
|
Distribution
|
85
|
83
|
2%
|
74
|
16%
|
|
Investment Gains (Losses)
|
41
|
(57)
|
n/m
|
107
|
(61%)
|
|
Other Revenues
|
33
|
33
|
0%
|
33
|
(1%)
|
|
Total Revenues
|
759
|
689
|
10%
|
807
|
(6%)
|
|
Less: Interest Expense
|
1
|
1
|
(33%)
|
1
|
3%
|
|
GAAP Net Revenues
|
$758
|
$688
|
10%
|
$806
|
(6%)
|
|
Investment (Gains) Losses(1)
|
(40)
|
45
|
n/m
|
(100)
|
(61%)
|
|
Distribution and Servicing Costs
|
(84)
|
(83)
|
1%
|
(75)
|
12%
|
|
Adjusted Net Revenues
|
$634
|
$650
|
(2%)
|
$631
|
0%
|
attributable to non-controlling interests
Third Quarter 2010 Revenues

3Q10 Earnings Presentation
12
AllianceBernstein.com
Percentages are calculated using expenses rounded to the nearest thousand
< Adjusted operating expenses down 1% versus 2Q10
< Employee compensation: maintained 3Q10 compensation ratio at 49.8%; flat from 2Q10
< Incentive Compensation increased from 2Q10 due to higher amortization of deferred comp mark-to-market(1)
|
Operating Expenses (in U.S. dollar millions)
|
3Q
2010 |
2Q
2010 |
Percent
Change |
3Q
2009 |
Percent
Change |
|
Compensation & Benefits
|
|
|
|
|
|
|
Base Compensation
|
$110
|
$110
|
(1%)
|
$112
|
(2%)
|
|
Incentive Compensation
|
148
|
115
|
29%
|
144
|
3%
|
|
Commissions, Fringes & Other
|
85
|
88
|
(3%)
|
80
|
6%
|
|
Total Compensation & Benefits
|
$343
|
$313
|
10%
|
$336
|
2%
|
|
Promotion & Servicing
|
131
|
133
|
(2%)
|
118
|
11%
|
|
General & Administrative
|
130
|
129
|
1%
|
123
|
6%
|
|
Real Estate Charge
|
90
|
0
|
n/m
|
0
|
n/m
|
|
Other
|
6
|
5
|
0%
|
6
|
(2%)
|
|
Total GAAP Operating Expenses
|
$700
|
$580
|
21%
|
$583
|
20%
|
|
Deferred Compensation Expenses
|
(15)
|
18
|
n/m
|
(18)
|
(17%)
|
|
Distribution-Related Expenses
|
(84)
|
(83)
|
1%
|
(75)
|
12%
|
|
Real Estate Charge
|
(90)
|
0
|
n/m
|
0
|
n/m
|
|
Non- Controlling Interest excluding Venture Fund
|
1
|
0
|
n/m
|
(1)
|
n/m
|
|
Total Adjusted Operating Expenses
|
$512
|
$515
|
(1%)
|
$489
|
5%
|
(1) Please refer to page 29 for additional information on the deferred compensation net P&L trends
Third Quarter 2010 Operating Expenses

3Q10 Earnings Presentation
13
AllianceBernstein.com
Please refer to pages 33-37 for additional information on the reconciliation of GAAP financial results to adjusted financial results
Percentages are calculated using revenues and expenses rounded to the nearest thousand
(1) Net impact of investment (gains) losses and employee compensation related to the mark-to-market of deferred compensation balances
|
|
3Q
2010 |
2Q
2010 |
Percent
Change |
3Q
2009 |
Percent
Change |
|
AllianceBernstein L.P.
|
|
|
|
|
|
|
GAAP Operating Income
|
$58
|
$108
|
(47%)
|
$223
|
(74%)
|
|
Net P&L impact of MTM of deferred compensation(1)
|
(23)
|
18
|
n/m
|
(54)
|
(60%)
|
|
Real estate charge
|
90
|
0
|
n/m
|
0
|
n/m
|
|
Net (Income) Loss of Consolidated Entities Attributable to
Non-Controlling Interests
|
(3)
|
9
|
n/m
|
(27)
|
(89%)
|
|
Adjusted Operating Income
|
$122
|
$135
|
(9%)
|
$142
|
(14%)
|
|
|
|
|
|
|
|
|
GAAP Operating Margin (including non-controlling interests)
|
7.2%
|
17.0%
|
|
24.4%
|
|
|
Adjusted Operating Margin
|
19.3%
|
20.7%
|
|
22.5%
|
|
< Adjusted earnings of 36 cents per Unit, versus 37 cents in 2Q10
< Adjusted operating margin fell by 1% in 3Q10 from 2Q10
< YTD adjusted operating margin of 21.4%, up from 18.4% for full year 2009
In U.S. dollar millions
Third Quarter 2010 GAAP to Adjusted Reconciliation

3Q10 Earnings Presentation
14
AllianceBernstein.com
Q & A
AllianceBernstein Third Quarter 2010 Review

3Q10 Earnings Presentation
15
AllianceBernstein.com
Appendix
AllianceBernstein Third Quarter 2010 Review

3Q10 Earnings Presentation
16
AllianceBernstein.com
Performance is preliminary.
*Prior to 2001, MSCI EM gross dividends reinvested was used.
As of Sept 30, 2010
Investment performance of composites is presented after investment management fees. Periods of more than one year are annualized.
The information in this table is provided solely for use in connection with this presentation, and is not directed toward existing or potential investment advisory clients of AllianceBernstein.
Institutional Equity Composites vs. Benchmarks
|
|
|
Periods Ended September 30, 2010
|
|
|||
|
Service
|
3Q
2010 |
One
Year |
Three
Years |
Five
Years |
10
Years |
Benchmark
|
|
US Diversified Value
|
(1.1)
|
(3.3)
|
(3.2)
|
(2.4)
|
0.5
|
Russell 1000 Value
|
|
US Strategic Value
|
(2.8)
|
(6.1)
|
(6.8)
|
(4.5)
|
3.7
|
S&P 500
|
|
US Strategic Value
|
(1.6)
|
(4.9)
|
(4.6)
|
(3.4)
|
0.7
|
Russell 1000 Value
|
|
International Value
|
0.8
|
(4.7)
|
(5.4)
|
(3.0)
|
2.6
|
MSCI EAFE (Cap, UH, net)
|
|
International Strategic Value
|
0.3
|
(4.8)
|
(6.7)
|
(3.3)
|
N/A
|
MSCI EAFE (Cap, UH, net)
|
|
Global Value
|
(0.5)
|
(5.7)
|
(7.1)
|
(3.8)
|
3.9
|
MSCI World (Cap, UH, net)
|
|
Global Strategic Value
|
0.0
|
(4.2)
|
(9.1)
|
(4.7)
|
N/A
|
MSCI World (Cap, UH, net)
|
|
Emerging Markets Value
|
2.4
|
(2.5)
|
(1.0)
|
(2.0)
|
3.3
|
MSCI EM (Cap, UH, net)*
|
Institutional Value Equity: Relative Performance

3Q10 Earnings Presentation
17
AllianceBernstein.com
Performance is preliminary.
*Prior to 2001, MSCI EM gross dividends reinvested was used.
As of Sept 30, 2010
Investment performance of composites is presented after investment management fees. Periods of more than one year are annualized.
The information in this table is provided solely for use in connection with this presentation, and is not directed toward existing or potential investment advisory clients of AllianceBernstein.
Institutional Equity Composites vs. Benchmarks
|
|
|
Periods Ended September 30, 2010
|
|
|||
|
Service
|
3Q
2010 |
One
Year |
Three
Years |
Five
Years |
10
Years |
Benchmark
|
|
Global Research Growth
|
0.5
|
(1.1)
|
(6.3)
|
(4.5)
|
(1.9)
|
MSCI World (Cap, UH, net)
|
|
US Large Cap Growth
|
(2.9)
|
(10.1)
|
(2.8)
|
(2.5)
|
0.0
|
Russell 1000 Growth
|
|
Int'l Research Growth All Country
|
1.1
|
1.3
|
(2.6)
|
(0.7)
|
N/A
|
MSCI ACWI ex US (Cap, UH, net)
|
|
US Research Growth
|
(0.2)
|
(4.3)
|
(3.5)
|
(2.8)
|
(2.5)
|
S&P 500 Index
|
|
US Thematic Research
|
4.2
|
2.7
|
1.4
|
(0.5)
|
0.8
|
S&P 500 Index
|
|
US Small Cap Growth
|
4.4
|
7.3
|
(0.1)
|
1.3
|
1.1
|
Russell 2000 Growth
|
|
Global Large Cap Growth
|
1.5
|
1.2
|
(4.3)
|
(2.5)
|
(3.4)
|
MSCI World (Cap, UH, net)
|
|
Int'l Large Cap Growth
|
0.9
|
2.4
|
(3.8)
|
(2.9)
|
|
MSCI EAFE (Cap, UH, net)
|
|
Emerging Markets Growth
|
(0.6)
|
(0.1)
|
(3.2)
|
(2.9)
|
(1.3)
|
MSCI EM (Cap, UH, net)*
|
|
(1.9)
|
Institutional Growth Equity: Relative Performance

3Q10 Earnings Presentation
18
AllianceBernstein.com
Performance is preliminary.
As of Sept 30, 2010
Investment performance of composites is presented after investment management fees. Periods of more than one year are annualized.
The information in this table is provided solely for use in connection with this presentation, and is not directed toward existing or potential investment advisory clients of AllianceBernstein.
Institutional Blend Strategies Equity Composites vs. Benchmarks
|
|
|
|
|
|||
|
|
|
Periods Ended September 30, 2010
|
|
|||
|
Service
|
3Q
2010 |
One
Year |
Three
Years |
Five
Years |
10
Years |
Benchmark
|
|
Global Blend Strategies
|
(0.1)
|
(3.5)
|
(6.7)
|
(4.1)
|
N/A
|
MSCI World (Cap, UH, net)
|
|
International Blend Strategies
|
0.7
|
(1.0)
|
(4.1)
|
(2.8)
|
N/A
|
MSCI EAFE (Cap, UH, net)
|
|
US Blend Strategies
|
(1.9)
|
(7.1)
|
(3.4)
|
(2.9)
|
N/A
|
S&P 500
|
|
Emerging Markets Blend Strategies
|
0.5
|
(1.8)
|
(2.3)
|
(2.7)
|
N/A
|
MSCI EM (Cap, UH, net)
|
|
|
Institutional Blend Strategies: Relative Performance

3Q10 Earnings Presentation
19
AllianceBernstein.com
Performance is preliminary.
As of Sept 30, 2010
Investment performance of composites is presented after investment management fees. Periods of more than one year are annualized.
*The benchmarks listed are the current benchmarks for the investments service—certain benchmarks have evolved over time and therefore are time blended.
The information in this table is provided solely for use in connection with this presentation, and is not directed toward existing or potential investment advisory clients of AllianceBernstein.
Institutional Fixed Income Composites vs. Benchmarks*
|
|
|
|
|
|
||
|
|
|
Periods Ended September 30, 2010
|
|
|||
|
Service
|
3Q
2010 |
One
Year |
Three
Years |
Five
Years |
10
Years |
Benchmark
|
|
Corporate Bonds
|
0.2
|
1.0
|
(0.1)
|
(0.0)
|
0.1
|
Custom Corporate Index
|
|
Strategic Core Plus
|
1.3
|
4.0
|
0.8
|
0.5
|
N/A
|
Custom Index
|
|
Global Plus
|
1.3
|
4.1
|
(0.5)
|
(0.0)
|
N/A
|
Barclays Global Aggregate
Bond Index (Unhedged) |
|
Global Fixed Income
|
0.7
|
3.9
|
1.4
|
1.1
|
0.7
|
CitiGroup WGBI - Unhedged
|
|
Emerging Market Debt
|
1.6
|
3.4
|
1.8
|
1.8
|
3.1
|
JPM EMBI Global
|
|
Low Duration
|
0.4
|
2.8
|
(1.5)
|
(1.2)
|
(0.5)
|
BofA Merrill Lynch U.S. Treasury (1-3 Years)
|
|
|
Institutional Fixed Income: Relative Performance

3Q10 Earnings Presentation
20
AllianceBernstein.com
Performance is preliminary.
As of Sept 30, 2010
Investment performance of composites is presented after investment management fees. Periods of more than one year are annualized.
*The Fully Diversified 60% stocks/40% bonds (simulation) is meant to be illustrative of the value generated by the "total solution" approach AllianceBernstein encourages for most clients: a
diversified allocation across investment portfolios of varying types aimed at optimizing return and volatility over time. The Bernstein Fully Diversified Portfolio is composed of specific proportions of
each of the products that follow, which were included in the simulation as of the following dates: Strategic Value—January 1, 1983; Strategic Growth—January 1, 1983 (ACM Large Cap Growth
used as a proxy for Strategic Growth through January 1, 2001; Strategic Growth used thereafter); Intermediate Municipal Bond Composite—January 1, 1983; Bernstein Tax-Managed International
Fund—July 1, 1992; Emerging Markets Fund—January 1, 1996; AllianceBernstein Institutional REIT Fund—July 1, 2001 (The AllianceBernstein Institutional REIT Fund was removed from the
simulation on December 31, 2008) DAA Overlay - April 1, 2010. The portfolio was rebalanced quarterly through December 31, 2005; monthly thereafter. Simulated performance results have certain
inherent limitations. The results may not reflect the impact that certain material economic and market factors might have had on actual decision making if they were reflective of a managed account.
No representation is being made that any account will, or is likely to, achieve profits or losses similar to those described herein.
Source: Standard and Poor’s, Morgan Stanley, Lipper and AllianceBernstein
|
|
|
|
|
|
|
|
|||
|
|
|
Periods Ended September 30, 2010
|
|||
|
Service
|
3Q
2010 |
One
Year |
Three
Years |
Five
Years |
10
Years |
|
Fully Diversified Simulation*
|
7.5
|
5.4
|
(5.1)
|
1.1
|
3.4
|
|
S&P 500
|
11.3
|
10.2
|
(7.2)
|
0.6
|
(0.4)
|
|
|
|
|
|
|
|
|
MSCI World (Cap, UH, net)
|
13.8
|
6.8
|
(8.3)
|
1.3
|
0.8
|
|
|
|
|
|
|
|
|
Lipper Short/Int Blended Muni Fund Avg
|
2.2
|
4.0
|
4.2
|
3.6
|
3.9
|
|
|
Private Client: Absolute Performance

3Q10 Earnings Presentation
21
AllianceBernstein.com
Retail Mutual Funds vs. Lipper Averages
NOTE: The information in this table is provided solely for use in connection with this presentation, and is not directed toward existing or potential investment advisory clients of AllianceBernstein.
Investment performance of mutual funds is presented after investment management fees.
(1) Performance figures other than 3Q2010 and One Year are positively affected by class action settlement proceeds.
Source: AllianceBernstein and Lipper. Mutual Fund and Lipper performance data through 9/30/10.
|
|
|
|
|
|
||
|
|
|
Periods Ended September 30, 2010
|
|
|||
|
Service
|
3Q
2010 |
One
Year |
Three
Years |
Five
Years |
Ten
Years |
Lipper Average
|
|
International Value
|
1.1
|
(2.7)
|
(6.0)
|
(3.1)
|
N/A
|
International Large Cap Value
|
|
Growth & Income(1)
|
1.9
|
1.3
|
(1.3)
|
(0.5)
|
(1.8)
|
Large Cap Value
|
|
U.S. Small/Mid Cap Value
|
2.2
|
3.8
|
2.8
|
2.7
|
N/A
|
Small Cap Value
|
|
U.S. Value
|
(1.4)
|
(3.5)
|
(4.9)
|
(3.3)
|
N/A
|
Large Cap Value
|
|
Global Value
|
|
(1.5)
|
(5.2)
|
(1.8)
|
N/A
|
Global Large Cap Value
|
|
1.5
|
Retail Value Equity: Relative Performance

3Q10 Earnings Presentation
22
AllianceBernstein.com
Retail Mutual Funds vs. Lipper Averages
NOTE: The information in this table is provided solely for use in connection with this presentation, and is not directed toward existing or potential investment advisory clients of AllianceBernstein.
Investment performance of mutual funds is presented after investment management fees.
Investment performance of mutual funds is presented after investment management fees.
(1) Performance figures other than 3Q2010 and One Year are positively affected by class action settlement proceeds.
Source: AllianceBernstein, Morningstar, and Lipper. Mutual Fund, Morningstar, and Lipper performance data through 9/30/10.
|
|
|
|
|
|
||
|
|
|
Periods Ended September 30, 2010
|
|
|||
|
Service
|
3Q
2010 |
One
Year |
Three
Years |
Five
Years |
Ten
Years |
Lipper Average
|
|
Global Growth
|
0.2
|
(3.1)
|
|
(5.0)
|
N/A
|
Global Large-Cap Growth
|
|
Global Thematic Growth
|
1.3
|
(2.1)
|
1.8
|
(0.2)
|
(3.9)
|
Global Multi-Cap Growth
|
|
International Growth
|
1.6
|
0.6
|
(1.3)
|
(1.1)
|
2.7
|
International Large-Cap Growth
|
|
U.S. Large Cap Growth(1)
|
(2.4)
|
(2.9)
|
4.0
|
1.4
|
(0.8)
|
Large-Cap Growth
|
|
Emerging Markets
|
1.0
|
1.2
|
(2.0)
|
(2.8)
|
(2.6)
|
Equity Emerging Mkts Global
|
|
U.S. Growth(1)
|
(0.2)
|
0.7
|
(1.7)
|
(2.4)
|
(0.4)
|
Large-Cap Growth
|
|
U.S. Small/Mid Cap Growth
|
5.9
|
9.9
|
0.3
|
(0.9)
|
0.4
|
Mid Cap Growth
|
|
(6.4)
|
Retail Growth Equity: Relative Performance

3Q10 Earnings Presentation
23
AllianceBernstein.com
Retail Fixed Income Funds vs. Lipper Averages
NOTE: The information in this table is provided solely for use in connection with this presentation, and is not directed toward existing or potential investment advisory clients of AllianceBernstein.
Investment performance of mutual funds is presented after investment management fees.
Source: AllianceBernstein, Morningstar, and Lipper. Mutual Fund, Morningstar, and Lipper performance data through 9/30/10.
|
|
|
|
|
|
||
|
|
|
Periods Ended September 30, 2010
|
|
|||
|
Service
|
3Q
2010 |
One
Year |
Three
Years |
Five
Years |
Ten
Years |
Lipper Average
|
|
Global High Yield Portfolio
|
(4.2)
|
6.4
|
2.8
|
1.4
|
(0.2)
|
Bond Global High Yield
|
|
American Income Portfolio
|
2.6
|
6.1
|
2.1
|
1.8
|
2.3
|
Bond USD
|
|
Global Bond
|
(1.7)
|
3.4
|
1.3
|
2.1
|
1.5
|
Global Income
|
|
High Income
|
|
3.6
|
5.9
|
4.5
|
|
High Current Yield
|
|
1.9
|
|
7.3
|
Retail Fixed Income: Relative Performance

3Q10 Earnings Presentation
24
AllianceBernstein.com
Retail Mutual Funds vs. Lipper Averages
NOTE: The information in this table is provided solely for use in connection with this presentation, and is not directed toward existing or potential investment advisory clients of AllianceBernstein.
Investment performance of mutual funds is presented after investment management fees.
Source: AllianceBernstein and Morningstar. Mutual fund and Morningstar performance data through 9/30/10.
|
|
|
|
|
|
||
|
|
|
Periods Ended September 30, 2010
|
|
|||
|
Service
|
3Q
2010 |
One
Year |
Three
Years |
Five
Years |
10 Years
|
Lipper Average
|
|
Conservative Wealth
|
0.4
|
(1.1)
|
(1.1)
|
(0.0)
|
0.1
|
Mixed-Asset Target Alloc Consv
|
|
Balanced Wealth
|
2.1
|
(0.0)
|
(1.6)
|
(0.0)
|
0.4
|
Mixed-Asset Target Alloc Moderate
|
|
Wealth Appreciation
|
0.6
|
(1.8)
|
(2.5)
|
(1.4)
|
(1.8)
|
Global Multi-Cap Core
|
Wealth Strategies: Relative Performance

3Q10 Earnings Presentation
25
AllianceBernstein.com
In U.S. dollars billions
|
|
Institutions
|
Retail
|
Private Client
|
Total
|
||||||||
|
Client Domicile:
|
US
|
Non-US
|
Total
|
US
|
Non-US
|
Total
|
US
|
Non-US
|
Total
|
US
|
Non-US
|
Total
|
|
Beginning of Period
|
$143.6
|
$127.0
|
$270.6
|
$77.0
|
$39.2
|
$116.2
|
$69.0
|
$1.9
|
$70.9
|
$289.6
|
$168.1
|
$457.7
|
|
Sales/New Accounts
|
0.4
|
3.8
|
4.2
|
2.3
|
5.0
|
7.3
|
1.6
|
0.0
|
1.6
|
4.3
|
8.8
|
13.1
|
|
Redemptions/Terminations
|
(8.4)
|
(5.7)
|
(14.1)
|
(4.5)
|
(4.4)
|
(8.9)
|
(1.3)
|
0.0
|
(1.3)
|
(14.2)
|
(10.1)
|
(24.3)
|
|
Net Cash Flows
|
1.4
|
(6.7)
|
(5.3)
|
(1.0)
|
(0.6)
|
(1.6)
|
(0.7)
|
(0.1)
|
(0.8)
|
(0.3)
|
(7.4)
|
(7.7)
|
|
Net Flows
|
(6.6)
|
(8.6)
|
(15.2)
|
(3.2)
|
0.0
|
(3.2)
|
(0.4)
|
(0.1)
|
(0.5)
|
(10.2)
|
(8.7)
|
(18.9)
|
|
Investment Performance
|
12.8
|
14.8
|
27.6
|
8.2
|
4.4
|
12.6
|
5.2
|
0.1
|
5.3
|
26.2
|
19.3
|
45.5
|
|
End of Period
|
$149.8
|
$133.2
|
$283.0
|
$82.0
|
$43.6
|
$125.6
|
$73.8
|
$1.9
|
$75.7
|
$305.6
|
$178.7
|
$484.3
|
Three-months ended 9/30/10 AUM Rollforward by Distribution Channel

3Q10 Earnings Presentation
26
AllianceBernstein.com
In U.S. dollars billions
(1) Includes index, structured, asset allocation services and other non-actively managed AUM
(2) Approximately $74 billion in Blend Strategies AUM are reported in their respective services
|
|
|
|
|
|
Value Equity
|
Growth Equity
|
Fixed Income
|
Other(1)
|
Total
|
||||||||||
|
Client Domicile:
|
US
|
Non-US
|
Total
|
US
|
Non-US
|
Total
|
US
|
Non-US
|
Total
|
US
|
Non-US
|
Total
|
US
|
Non-US
|
Total
|
|
Beginning of Period
|
$87.2
|
$52.0
|
$139.2
|
$52.5
|
$22.0
|
$74.5
|
$116.4
|
$82.1
|
$198.5
|
$33.5
|
$12.0
|
$45.5
|
$289.6
|
$168.1
|
$457.7
|
|
Sales/New Accounts
|
0.9
|
1.9
|
2.8
|
0.6
|
0.2
|
0.8
|
2.5
|
6.5
|
9.0
|
0.3
|
0.2
|
0.5
|
4.3
|
8.8
|
13.1
|
|
Redemptions/Terminations
|
(5.7)
|
(2.4)
|
(8.1)
|
(5.3)
|
(1.6)
|
(6.9)
|
(2.2)
|
(5.8)
|
(8.0)
|
(1.0)
|
(0.3)
|
(1.3)
|
(14.2)
|
(10.1)
|
(24.3)
|
|
Net Cash Flows
|
(1.0)
|
(1.1)
|
(2.1)
|
(1.0)
|
(0.5)
|
(1.5)
|
1.6
|
(2.5)
|
(0.9)
|
0.1
|
(3.3)
|
(3.2)
|
(0.3)
|
(7.4)
|
(7.7)
|
|
Net Flows
|
(5.8)
|
(1.6)
|
(7.4)
|
(5.7)
|
(1.9)
|
(7.6)
|
1.9
|
(1.8)
|
0.1
|
(0.6)
|
(3.4)
|
(4.0)
|
(10.2)
|
(8.7)
|
(18.9)
|
|
Investment Performance
|
11.8
|
7.9
|
19.7
|
7.0
|
3.3
|
10.3
|
3.6
|
7.2
|
10.8
|
3.8
|
0.9
|
4.7
|
26.2
|
19.3
|
45.5
|
|
End of Period(2)
|
$93.2
|
$58.3
|
$151.5
|
$53.8
|
$23.4
|
$77.2
|
$121.9
|
$87.5
|
$209.4
|
$36.7
|
$9.5
|
$46.2
|
$305.6
|
$178.7
|
$484.3
|
Three-months ended 9/30/10 AUM Rollforward by Investment Service
3Q10 Earnings Presentation
27
AllianceBernstein.com
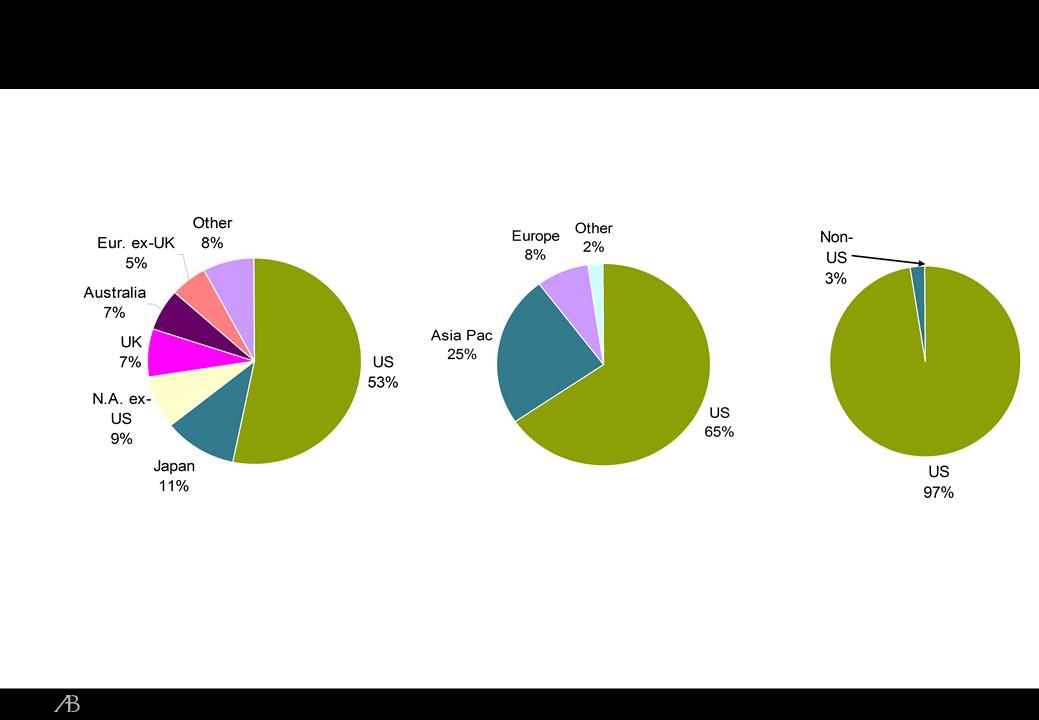
In U.S. dollars billions
As of Sept 30, 2010
Retail
Institutions
Private Client
$283.0 $125.6 $75.7
AUM by Region

3Q10 Earnings Presentation
28
AllianceBernstein.com
Percentages are calculated using AUM rounded to the nearest million and revenues to the nearest thousand
In U.S. dollars
(1) 3Q10 Reflects performance fees from TALF fund
|
|
3Q
2010 |
2Q
2010 |
Percent
Change |
3Q
2009 |
Percent
Change |
|
Ending AUM ($ Billions)
|
$484
|
$458
|
6%
|
$498
|
(3%)
|
|
Average AUM ($ Billions)
|
$473
|
$482
|
(2%)
|
$474
|
0%
|
|
|
|
|
|
|
|
|
By Fee Type ($ Millions):
|
|
|
|
|
|
|
Base Fees
|
$498
|
$510
|
(2%)
|
$484
|
3%
|
|
Performance Fees (1)
|
6
|
3
|
92%
|
0
|
n/m
|
|
Total
|
$504
|
$513
|
(2%)
|
$484
|
4%
|
|
|
|
|
|
|
|
|
Base Fees By Channel ($ Millions):
|
|
|
|
|
|
|
Institutions
|
$181
|
$186
|
(2%)
|
$203
|
(11%)
|
|
Retail
|
161
|
158
|
2%
|
136
|
18%
|
|
Private Client
|
156
|
166
|
(6%)
|
145
|
7%
|
|
Total
|
$498
|
$510
|
(2%)
|
$484
|
3%
|
|
|
|
|
|
|
|
Third Quarter 2010 Advisory Fees

3Q10 Earnings Presentation
29
AllianceBernstein.com
In U.S. dollars millions
|
|
|
|
|
|
|
|
|
|
|
2Q
2009 |
3Q
2009 |
4Q
2009 |
1Q
2010 |
2Q
2010 |
3Q
2010 |
|
|
Revenues
|
|
|
|
|
|
|
|
|
Investment Gains (Losses)
|
$63
|
$71
|
$15
|
$11
|
($37)
|
$36
|
|
|
Dividends
|
2
|
1
|
4
|
1
|
-
|
1
|
|
|
Total Revenues
|
$65
|
$72
|
$19
|
$12
|
($37)
|
$37
|
|
|
Expenses
|
|
|
|
|
|
|
|
|
Amortization of Original Awards
|
$39
|
$40
|
$36
|
$31
|
$31
|
$27
|
|
|
Amortization of MTM - Prior Periods
|
(16)
|
(11)
|
(6)
|
(4)
|
(3)
|
(5)
|
|
|
Amortization of MTM - Current Quarter
|
25
|
28
|
8
|
4
|
(16)
|
19
|
|
|
% of Investment Gains (Losses)
|
40%
|
39%
|
53%
|
36%
|
43%
|
53%
|
|
|
Dividends
|
1
|
1
|
4
|
1
|
-
|
1
|
|
|
Sub-Total of Mutual Fund Expenses
|
49
|
58
|
42
|
32
|
12
|
42
|
|
|
Amortization of AB Units
|
10
|
11
|
19
|
23
|
24
|
23
|
|
|
Other
|
4
|
4
|
1
|
3
|
3
|
3
|
|
|
Total Expenses
|
$63
|
$73
|
$62
|
$58
|
$39
|
$68
|
|
|
Net P&L impact of Mutual Fund Grants
|
$16
|
$14
|
($23)
|
($20)
|
($49)
|
($5)
|
|
|
|
Six-Quarter Deferred Compensation Net P&L Trend

3Q10 Earnings Presentation
30
AllianceBernstein.com
In U.S. dollars millions
|
|
|
|
|
Assets
|
Sept 30, 2010
|
Dec 31, 2009
|
|
Cash and cash equivalents
|
$616
|
$614
|
|
Cash and securities, segregated
|
740
|
985
|
|
Receivables, net
|
1,320
|
1,099
|
|
Investments:
|
|
|
|
Deferred compensation - related
|
358
|
401
|
|
Other
|
532
|
374
|
|
Goodwill
|
2,893
|
2,893
|
|
Intangible assets, net
|
208
|
224
|
|
Deferred sales commissions, net
|
82
|
90
|
|
Other (incl. furniture & equipment, net)
|
457
|
535
|
|
Total Assets
|
$7,206
|
$7,215
|
|
|
|
|
|
Liabilities and Capital
|
|
|
|
Liabilities:
|
|
|
|
Payables
|
$1,630
|
$1,670
|
|
Accounts payable and accrued expenses
|
424
|
278
|
|
Accrued compensation and benefits
|
546
|
316
|
|
Debt
|
109
|
249
|
|
Total Liabilities
|
2,709
|
2,513
|
|
|
|
|
|
Partners' capital attributable to AllianceBernstein Unitholders
|
4,352
|
4,530
|
|
Non-controlling interests in consolidated entities
|
145
|
172
|
|
Total Capital
|
4,497
|
4,702
|
|
Total Liabilities and Capital
|
$7,206
|
$7,215
|
Consolidated Balance Sheet

3Q10 Earnings Presentation
31
AllianceBernstein.com
In U.S. dollars millions
|
|
|
|
|
|
Nine Months Ended
|
|
|
|
September 30, 2010
|
September 30, 2009
|
|
Cash Flows From Operating Activities:
|
|
|
|
Net Income
|
$283
|
$388
|
|
Non-cash items:
|
|
|
|
Amortization of deferred sales commissions
|
36
|
42
|
|
Amortization of non-cash deferred compensation
|
86
|
52
|
|
Depreciation and other amortization
|
61
|
63
|
|
Unrealized (gains) on deferred compensation - related investments
|
(24)
|
(163)
|
|
Unrealized loss (gain) on consolidated venture capital fund
|
27
|
(9)
|
|
Non-cash real estate charge
|
102
|
2
|
|
Other
|
(7)
|
(16)
|
|
Changes in assets and liabilities
|
128
|
216
|
|
Net cash provided by operating activities
|
692
|
575
|
|
|
|
|
|
Cash Flows From Investing Activities:
|
|
|
|
Purchases of investments
|
-
|
(10)
|
|
Proceeds from sales of investments
|
2
|
4
|
|
Additions to furniture, equipment and leaseholds, net
|
(10)
|
(44)
|
|
Net cash used in investing activities
|
(8)
|
(50)
|
|
|
|
|
|
Cash Flows From Financing Activities:
|
|
|
|
(Repayment) of commercial paper, net
|
(150)
|
(259)
|
|
Proceeds from bank loans, net
|
10
|
25
|
|
Increase (Decrease) in overdrafts payable
|
33
|
(26)
|
|
Distributions to General Partner and Unitholders
|
(448)
|
(266)
|
|
Purchases of Holding Units to fund deferred compensation awards, net
|
(137)
|
-
|
|
Other
|
6
|
(17)
|
|
Net cash used in financing activities
|
(686)
|
(543)
|
|
|
|
|
|
Effect of exchange rate changes on cash and cash equivalents
|
4
|
36
|
|
|
|
|
|
Net increase in cash and cash equivalents
|
2
|
18
|
|
Cash and cash equivalents at the beginning of period
|
614
|
553
|
|
Cash and cash equivalents at the end of period
|
$616
|
$571
|
Consolidated Statement of Cash Flows

3Q10 Earnings Presentation
32
AllianceBernstein.com
Percentages are calculated using income, earnings and expenses rounded to the nearest thousand
In U.S. dollars millions (except per Unit amounts)
Please refer to pages 33-37 for additional information on the reconciliation of GAAP financial results to adjusted financial results
|
|
3Q
2010 |
2Q
2010 |
Percent
Change |
3Q
2009 |
Percent
Change |
|
AllianceBernstein
|
|
|
|
|
|
|
Net Income Attributable to AllianceBernstein
|
$52
|
$106
|
(51%)
|
$199
|
(74%)
|
|
Weighted Average Equity Ownership Interest
|
36.7%
|
36.7%
|
|
34.5%
|
|
|
AllianceBernstein Holding
|
|
|
|
|
|
|
Equity in Net Income
Attributable to AllianceBernstein |
$19
|
$39
|
(51%)
|
$69
|
(72%)
|
|
Income Taxes
|
7
|
7
|
(6%)
|
6
|
8%
|
|
Net Income
|
$12
|
$32
|
(62%)
|
$63
|
(80%)
|
|
Diluted Net Income Per Unit, GAAP basis
|
$0.12
|
$0.31
|
(61%)
|
$0.67
|
(82%)
|
|
Distributions Per Unit
|
$0.12
|
$0.31
|
(61%)
|
$0.67
|
(82%)
|
|
Adjusted Diluted Net Income Per Unit
|
$0.36
|
$0.37
|
(3%)
|
$0.48
|
(25%)
|
|
|
|
|
|
|
|
AllianceBernstein Holding Financial Results

3Q10 Earnings Presentation
33
AllianceBernstein.com
|
|
|
|
|
|
Three Months Ended
|
|
|
|
|
||
|
$ thousands, unaudited
|
9/30/10
|
|
6/30/10
|
|
3/31/10
|
|
12/31/09
|
|
9/30/09
|
|
6/30/09
|
|
Net Revenues, GAAP basis
|
$757,567
|
|
$688,343
|
|
$725,086
|
|
$781,861
|
|
$806,014
|
|
$721,440
|
|
Exclude:
|
|
|
|
|
|
|
|
|
|
|
|
|
Deferred compensation-related investment (gains) losses
|
(36,013)
|
|
36,797
|
|
(11,159)
|
|
(14,763)
|
|
(70,873)
|
|
(63,110)
|
|
Deferred compensation-related dividends and interest
|
(830)
|
|
(920)
|
|
(800)
|
|
(4,084)
|
|
(1,381)
|
|
(1,591)
|
|
90% of consolidated venture capital fund investment (gains) losses
|
(2,056)
|
|
9,304
|
|
16,849
|
|
1,627
|
|
(27,155)
|
|
(417)
|
|
Distribution-related payments
|
(72,501)
|
|
(71,015)
|
|
(66,750)
|
|
(69,400)
|
|
(61,842)
|
|
(55,149)
|
|
Amortization of deferred sales commissions
|
(11,780)
|
|
(12,147)
|
|
(12,121)
|
|
(12,819)
|
|
(13,363)
|
|
(13,844)
|
|
Adjusted Net Revenues
|
$634,387
|
|
$650,362
|
|
$651,105
|
|
$682,422
|
|
$631,400
|
|
$587,329
|
|
|
|
|
|
|
|
|
|
|
|
|
|
|
Operating Income, GAAP basis
|
$57,480
|
|
$107,649
|
|
$139,982
|
|
$200,256
|
|
$223,470
|
|
$133,312
|
|
Exclude:
|
|
|
|
|
|
|
|
|
|
|
|
|
Deferred compensation-related investment (gains) losses
|
(36,013)
|
|
36,797
|
|
(11,159)
|
|
(14,763)
|
|
(70,873)
|
|
(63,110)
|
|
Deferred compensation-related dividends and interest
|
(830)
|
|
(920)
|
|
(800)
|
|
(4,084)
|
|
(1,381)
|
|
(1,591)
|
|
Deferred compensation-related mark-to-market vesting expense (credit)
|
14,158
|
|
(19,082)
|
|
357
|
|
1,556
|
|
16,722
|
|
8,590
|
|
Deferred compensation-related dividends and interest expense
|
731
|
|
810
|
|
682
|
|
3,760
|
|
1,240
|
|
1,431
|
|
Net impact of deferred compensation-related investments
|
(21,954)
|
|
17,605
|
|
(10,920)
|
|
(13,531)
|
|
(54,292)
|
|
(54,680)
|
|
Real estate charges
|
89,598
|
|
-
|
|
11,983
|
|
2,548
|
|
-
|
|
-
|
|
Total Exclusions:
|
67,644
|
|
17,605
|
|
1,063
|
|
(10,983)
|
|
(54,292)
|
|
(54,680)
|
|
Include:
|
|
|
|
|
|
|
|
|
|
|
|
|
Net (income) loss of consolidated entities attributable to non-controlling
interests |
(2,919)
|
|
9,339
|
|
16,773
|
|
733
|
|
(27,154)
|
|
(1,300)
|
|
Adjusted Operating Income
|
$122,205
|
|
$134,593
|
|
$157,818
|
|
$190,006
|
|
$142,024
|
|
$77,332
|
|
Operating Margin, GAAP basis incl. non-controlling interests
|
7.2%
|
|
17.0%
|
|
21.6%
|
|
25.7%
|
|
24.4%
|
|
18.3%
|
|
Adjusted Operating Margin
|
19.3%
|
|
20.7%
|
|
24.2%
|
|
27.8%
|
|
22.5%
|
|
13.2%
|
AllianceBernstein Adjusted Earnings Reconciliation

3Q10 Earnings Presentation
AllianceBernstein.com
34
AllianceBernstein Holding Adjusted Earnings Reconciliation
|
|
|
|
|
|
Three Months Ended
|
|
|
|
|
||
|
$ thousands except per unit amounts, unaudited
|
9/30/10 |
|
6/30/10 |
|
3/31/10 |
|
12/31/0 9 |
|
9/30/09 |
|
6/30/09 |
|
Diluted Net Income, GAAP basis
|
$ 12,384
|
|
$ 32,256
|
|
$ 47,858
|
|
$ 60,402
|
|
$ 62,836
|
|
$ 38,262
|
|
Impact on net income of AllianceBernstein L.P. non-GAAP
adjustments |
24,190
|
|
6,290
|
|
378
|
|
(3,746)
|
|
(18,230)
|
|
(18,304)
|
|
Adjusted Diluted Net Income
|
$ 36,574
|
|
$ 38,546
|
|
$ 48,236
|
|
$ 56,656
|
|
$ 44,606
|
|
$ 19,958
|
|
|
|
|
|
|
|
|
|
|
|
|
|
|
Diluted Net Income per Unit, GAAP basis
|
$ 0.12
|
|
$ 0.31
|
|
$ 0.46
|
|
$ 0.62
|
|
$ 0.67
|
|
$ 0.41
|
|
Impact of AllianceBernstein L.P. non-GAAP adjustments
|
0.24
|
|
0.06
|
|
0.01
|
|
(0.03)
|
|
(0.19)
|
|
(0.19)
|
|
Adjusted Diluted Net Income per Unit
|
$ 0.36
|
|
$ 0.37
|
|
$ 0.47
|
|
$ 0.59
|
|
$ 0.48
|
|
$ 0.22
|

3Q10 Earnings Presentation
AllianceBernstein.com
35
AllianceBernstein Adjusted Earnings Reconciliation
|
|
Nine Months Ended
|
||
|
$ thousands, unaudited
|
9/30/10
|
|
9/30/09
|
|
Net Revenues, GAAP basis
|
$2,170,996
|
|
$2,125,018
|
|
Exclude:
|
|
|
|
|
Deferred compensation-related investment (gains) losses
|
(10,375)
|
|
(105,738)
|
|
Deferred compensation-related dividends and interest
|
(2,550)
|
|
(4,442)
|
|
90% of consolidated venture capital fund investment losses (gains)
|
24,097
|
|
(22,257)
|
|
Distribution-related payments
|
(210,265)
|
|
(164,802)
|
|
Amortization of deferred sales commissions
|
(36,048)
|
|
(42,104)
|
|
Adjusted Net Revenues
|
$1,935,855
|
|
$1,785,675
|
|
|
|
|
|
|
Operating Income, GAAP basis
|
$305,111
|
|
$390,572
|
|
Exclude:
|
|
|
|
|
Deferred compensation-related investment (gains) losses
|
(10,375)
|
|
(105,738)
|
|
Deferred compensation-related dividends and interest
|
(2,550)
|
|
(4,442)
|
|
Deferred compensation-related mark-to-market vesting (credit) expense
|
(4,568)
|
|
(3,704)
|
|
Deferred compensation-related dividends and interest expense
|
2,223
|
|
3,974
|
|
Net impact of deferred compensation-related investments
|
(15,270)
|
|
(109,910)
|
|
Real estate charges
|
101,582
|
|
5,728
|
|
Total Exclusions:
|
86,312
|
|
(104,182)
|
|
Include:
|
|
|
|
|
Net loss (income) of consolidated entities attributable to non-controlling interests
|
23,193
|
|
(23,114)
|
|
Adjusted Operating Income
|
$414,616
|
|
$263,276
|
|
Operating Margin, GAAP basis incl. non-controlling interests
|
15.1%
|
|
17.3%
|
|
Adjusted Operating Margin
|
21.4%
|
|
14.7%
|

3Q10 Earnings Presentation
36
AllianceBernstein.com
|
|
Nine Months Ended
|
||
|
$ thousands except per unit amounts, unaudited
|
9/30/10
|
|
9/30/09
|
|
Diluted Net Income, GAAP basis
|
$ 92,461
|
|
$ 107,672
|
|
Impact on net income of AllianceBernstein L.P. non-GAAP adjustments
|
30,793
|
|
(34,919)
|
|
Adjusted Diluted Net Income
|
$ 123,254
|
|
$ 72,753
|
|
|
|
|
|
|
Diluted Net Income per Unit, GAAP basis
|
$ 0.90
|
|
$ 1.17
|
|
Impact of AllianceBernstein L.P. non-GAAP adjustments
|
0.30
|
|
(0.38)
|
|
Adjusted Diluted Net Income per Unit
|
$ 1.20
|
|
$ 0.79
|
AllianceBernstein Holding Adjusted Earnings Reconciliation

3Q10 Earnings Presentation
37
AllianceBernstein.com
AllianceBernstein L.P.
Notes to Condensed Consolidated Statements of Income and Supplemental Information
(Unaudited)
Adjusted Net Revenues
Adjusted net revenues excludes investment gains and losses and dividends and interest on deferred compensation-related investments, and 90% of the investment gains and losses of our
consolidated venture capital fund attributable to non-controlling interests. In addition, adjusted net revenues offset distribution-related payments to third parties as well as amortization of
deferred sales commissions against distribution revenues. We believe the offset of distribution-related payments from net revenues is useful for our investors and other users of our financial
statements because such presentation appropriately reflects the nature of these costs as pass-through payments to third parties who perform functions on behalf of our sponsored mutual
funds and/or shareholders of these funds. Amortization of deferred sales commissions is offset against net revenues because such costs, over time, offset distribution revenues earned by the
company.
Adjusted Operating Income
Adjusted operating income represents operating income on a GAAP basis (1) excluding the impact on net revenues and compensation expense of the mark-to-market gains and losses (as
well as the dividends and interest) associated with employee deferred compensation-related investments, (2) excluding real estate charges, and (3) including the net loss or income of
consolidated entities attributable to non-controlling interests.
well as the dividends and interest) associated with employee deferred compensation-related investments, (2) excluding real estate charges, and (3) including the net loss or income of
consolidated entities attributable to non-controlling interests.
(1) Prior to 2009, a large proportion of employee compensation was in the form of deferred awards that were notionally invested in AllianceBernstein investment services and generally vested
over a period of four years. AllianceBernstein has economically hedged the exposure to market movements by purchasing and holding these investments on its balance sheet. The full value of
the investments’ appreciation (depreciation) is recorded within investment gains and losses on the income statement in the current period. U.S. GAAP requires the appreciation (depreciation)
in the compensation liability to be expensed over the award vesting period in proportion to the vested amount of the award as part of compensation expense. This creates a timing difference
between the recognition of the compensation expense and the investment gain or loss impacting operating income which will fluctuate over the life of the award and net to zero at the end of
the multi-year vesting period. Although during periods of high market volatility these timing differences have an impact on operating income and operating margin, over the life of the award any
impact is ultimately offset. Because these plans are economically hedged, management believes it is useful to reflect the offset ultimately achieved from hedging the investments’ market
exposure in the calculation of adjusted operating income, adjusted operating margin and adjusted diluted net income per Holding Unit, which will produce core operating results from period to
period. The non-GAAP measures exclude gains and losses and dividends and interest on deferred compensation-related investments included in revenues and compensation expense, thus
eliminating the timing differences created by different treatment under U.S. GAAP of the market movement on the expense and the investments.
(2) Real estate charges have been excluded because, often, they are relatively large in nature and are not considered part of our core operating results when comparing financial results from
period to period and to industry peers.
period to period and to industry peers.
(3) Most of the net income or loss of consolidated entities attributable to non-controlling interests relates to the 90% limited partner interests held by third parties in our consolidated venture
capital fund. We own a 10% limited partner interest in the fund. Because we are the general partner of the venture capital fund and are deemed to have a controlling interest, U.S. GAAP
requires us to consolidate the financial results of the fund. However, recognizing 100% of the gains or losses in operating income while only retaining 10% is not reflective of our underlying
financial results at the operating income level. As a result, we are excluding the 90% limited partner interests we do not own from our adjusted operating income. Similarly, net income of joint
ventures attributable to non-controlling interests, although not significant, is excluded because it does not reflect the economic interest attributable to AllianceBernstein.
Adjusted Operating Margin
Adjusted operating margin allows us to monitor our financial performance and efficiency from period to period and to compare our performance to industry peers without the volatility noted
above in our discussion of adjusted operating income. Adjusted operating margin is derived by dividing adjusted operating income by adjusted net revenues.
above in our discussion of adjusted operating income. Adjusted operating margin is derived by dividing adjusted operating income by adjusted net revenues.
AllianceBernstein Adjusted Financial Results Reconciliation