Attached files
| file | filename |
|---|---|
| 8-K - FORM 8-K - BOSTON PROPERTIES INC | d8k.htm |
| EX-99.2 - PRESS RELEASE DATED OCTOBER 26, 2010 - BOSTON PROPERTIES INC | dex992.htm |
Exhibit 99.1


Supplemental Operating and Financial Data
for the Quarter Ended September 30, 2010
Boston Properties, Inc.
Third Quarter 2010
Table of Contents
| Page | ||||
| Company Profile |
3 | |||
| Investor Information |
4 | |||
| Research Coverage |
5 | |||
| Financial Highlights |
6 | |||
| Consolidated Balance Sheets |
7 | |||
| Consolidated Income Statements |
8 | |||
| Funds From Operations |
9 | |||
| Reconciliation to Diluted Funds From Operations |
10 | |||
| Funds Available for Distribution and Interest Coverage Ratios |
11 | |||
| Capital Structure |
12 | |||
| Debt Analysis |
13-15 | |||
| Unconsolidated Joint Ventures |
16-17 | |||
| Value-Added Fund |
18 | |||
| Portfolio Overview-Square Footage |
19 | |||
| In-Service Property Listing |
20-22 | |||
| Top 20 Tenants and Tenant Diversification |
23 | |||
| Office Properties-Lease Expiration Roll Out |
24 | |||
| Office/Technical Properties-Lease Expiration Roll Out |
25 | |||
| Retail Properties - Lease Expiration Roll Out |
26 | |||
| Grand Total - Office, Office/Technical, Industrial and Retail Properties |
27 | |||
| Greater Boston Area Lease Expiration Roll Out |
28-29 | |||
| Washington, D.C. Area Lease Expiration Roll Out |
30-31 | |||
| San Francisco Area Lease Expiration Roll Out |
32-33 | |||
| Midtown Manhattan Area Lease Expiration Roll Out |
34-35 | |||
| Princeton Area Lease Expiration Roll Out |
36-37 | |||
| CBD/Suburban Lease Expiration Roll Out |
38-39 | |||
| Hotel Performance and Occupancy Analysis |
40 | |||
| Same Property Performance |
41 | |||
| Reconciliation to Same Property Performance and Net Income |
42-43 | |||
| Leasing Activity |
44 | |||
| Capital Expenditures, Tenant Improvements and Leasing Commissions |
45 | |||
| Acquisitions/Dispositions |
46 | |||
| Value Creation Pipeline - Construction in Progress |
47 | |||
| Value Creation Pipeline - Land Parcels and Purchase Options |
48 | |||
| Definitions |
49-50 | |||
This supplemental package contains forward-looking statements within the meaning of the Federal securities laws. You can identify these statements by our use of the words “assumes,” “believes,” “estimates,” “expects,” “guidance,” “intends,” “plans,” “projects,” and similar expressions that do not relate to historical matters. You should exercise caution in interpreting and relying on forward-looking statements because they involve known and unknown risks, uncertainties and other factors which are, in some cases, beyond Boston Properties’ control and could materially affect actual results, performance or achievements. These factors include, without limitation, the ability to enter into new leases or renew leases on favorable terms, dependence on tenants’ financial condition, the uncertainties of real estate development, acquisition and disposition activity, the ability to effectively integrate acquisitions, the ability of our joint venture partners to satisfy their obligations, the costs and availability of financing, the effectiveness of our interest rate hedging programs, the effects of local economic and market conditions, the effects of acquisitions, dispositions and possible impairment charges on our operating results, the impact of newly adopted accounting principles on the Company’s accounting policies and on period-to-period comparisons of financial results, regulatory changes and other risks and uncertainties detailed from time to time in the Company’s filings with the Securities and Exchange Commission. Boston Properties does not undertake a duty to update or revise any forward-looking statement, whether as a result of new information, future events or otherwise.
2
Boston Properties, Inc.
Third Quarter 2010
COMPANY PROFILE
The Company
Boston Properties, Inc. (the “Company”), a self-administered and self-managed real estate investment trust (REIT), is one of the largest owners, managers, and developers of first-class office properties in the United States, with a significant presence in five markets: Boston, Washington, D.C., Midtown Manhattan, San Francisco, and Princeton, N.J. The Company was founded in 1970 by Mortimer B. Zuckerman and Edward H. Linde in Boston, where it maintains its headquarters. Boston Properties became a public company in June 1997. The Company acquires, develops, and manages its properties through full-service regional offices. Its property portfolio is comprised primarily of first-class office space, one hotel, two residential properties and three retail properties. Boston Properties is well-known for its in-house building management expertise and responsiveness to tenants’ needs. The Company holds a superior track record in developing premium Central Business District (CBD) office buildings, suburban office centers and build-to-suit projects for the U.S. government and a diverse array of creditworthy tenants.
Management
Boston Properties’ senior management team is among the most respected and accomplished in the REIT industry. Our deep and talented team of thirty-four individuals averages twenty-six years of real estate experience and sixteen years with Boston Properties. We believe that our size, management depth, financial strength, reputation, and relationships of key personnel provide a competitive advantage to realize growth through property development and acquisitions. Boston Properties benefits from the reputation and relationships of key personnel, including Mortimer B. Zuckerman, Chairman of the Board of Directors and Chief Executive Officer; Douglas T. Linde, President; E. Mitchell Norville, Executive Vice President and Chief Operating Officer; Raymond A. Ritchey, Executive Vice President and National Director of Acquisitions and Development; and Michael E. LaBelle, Chief Financial Officer. Our senior management team’s national reputation helps us attract business and investment opportunities. In addition, our other senior officers that serve as Regional Managers have strong reputations that assist in identifying and closing on new opportunities, having opportunities brought to us, and in negotiating with tenants and build-to-suit prospects. Additionally, Boston Properties’ Board of Directors consists of nine distinguished members, the majority of whom serve as Independent Directors.
Strategy
Boston Properties’ primary business objective is to maximize return on investment in an effort to provide its stockholders with the greatest possible total return. To achieve this objective, the Company maintains a consistent strategy that includes the following:
| • | concentrating on a few carefully selected markets characterized by high barriers to the creation of new supply and strong real estate fundamentals where tenants have demonstrated a preference for high-quality office buildings and other facilities; |
| • | selectively acquiring assets which increase its penetration in these select markets; |
| • | taking on complex, technically-challenging projects that leverage the skills of its management team to successfully develop, acquire, and reposition properties; |
| • | exploring joint-venture opportunities with partners who seek to benefit from the Company’s depth of development and management expertise; |
| • | pursuing the sale of properties (on a selective basis) to take advantage of its value creation and the demand for its premier properties; and |
| • | continuing to enhance the Company’s balanced capital structure through its access to a variety of capital sources. |
Snapshot
(as of September 30, 2010)
| Corporate Headquarters |
Boston, Massachusetts | |
| Markets |
Boston, Midtown Manhattan, Washington, D.C., San Francisco, and Princeton, N.J. | |
| Fiscal Year-End |
December 31 | |
| Total Properties (includes unconsolidated joint ventures, other than the Value-Added Fund) |
145 | |
| Total Square Feet (includes unconsolidated joint ventures, other than the Value-Added Fund, and structured parking) |
51.0 million | |
| Common Shares and Units Outstanding |
||
| (as converted, but excluding outperformance plan units) |
162.5 million | |
| Dividend - Quarter/Annualized |
$0.50/$2.00 | |
| Dividend Yield |
2.41% | |
| Total Combined Market Capitalization |
$22.5 billion | |
| Senior Debt Ratings |
Baa2 (Moody’s); BBB (Fitch); A- (S&P) | |
3
Boston Properties, Inc.
Third Quarter 2010
INVESTOR INFORMATION
| Board of Directors |
Management | |||||
| Mortimer B. Zuckerman | Dr. Jacob A. Frenkel | E. Mitchell Norville | Robert E. Pester | |||
| Chairman of the Board and Chief Executive Officer |
Director | Executive Vice President, Chief Operating Officer | Senior Vice President and Regional Manager of San Francisco | |||
| Douglas T. Linde | Alan J. Patricof | Raymond A. Ritchey | Robert E. Selsam | |||
| President and Director | Director, Chair of Audit Committee |
Executive Vice President, National Director of Acquisitions & Development | Senior Vice President and Regional Manager of New York | |||
| Lawrence S. Bacow | Martin Turchin | Michael E. LaBelle | Frank D. Burt | |||
| Director | Director | Senior Vice President, Chief Financial Officer | Senior Vice President, General Counsel | |||
| Zoë Baird | David A. Twardock | |||||
| Director, Chair of Nominating & Corporate Governance Committee |
Director, Chair of Compensation Committee |
Peter D. Johnston | Michael R. Walsh | |||
| Senior Vice President and Regional Manager of Washington, D.C. |
Senior Vice President, Finance | |||||
| Carol B. Einiger | Bryan J. Koop | Arthur S. Flashman | ||||
| Director | Senior Vice President and Regional Manager of Boston |
Vice President, Controller | ||||
| Mitchell S. Landis | ||||||
| Senior Vice President and Regional Manager of Princeton | ||||||
| Company Information | ||||||
| Corporate Headquarters | Trading Symbol | Investor Relations | Inquires | |||
| 800 Boylston Street | BXP | Boston Properties, Inc. | Inquiries should be directed to | |||
| Suite 1900 | 800 Boylston Street, Suite 1900 | Michael Walsh, Senior Vice President, Finance | ||||
| Boston, MA 02199 | Stock Exchange Listing | Boston, MA 02199 | at 617.236.3410 or | |||
| (t) 617.236.3300 | New York Stock Exchange | (t) 617.236.3322 | mwalsh@bostonproperties.com | |||
| (f) 617.236.3311 | (f) 617.236.3311 | |||||
| www.bostonproperties.com | Arista Joyner, Investor Relations Manager | |||||
| at 617.236.3343 or | ||||||
| ajoyner@bostonproperties.com | ||||||
Common Stock Data (NYSE: BXP)
Boston Properties’ common stock has the following characteristics (based on information reported by the New York Stock Exchange):
| Q3 2010 | Q2 2010 | Q1 2010 | Q4 2009 | Q3 2009 | ||||||||||||||||
| High Closing Price |
$ | 88.88 | $ | 83.39 | $ | 77.14 | $ | 70.80 | $ | 70.55 | ||||||||||
| Low Closing Price |
$ | 69.08 | $ | 71.34 | $ | 62.49 | $ | 57.25 | $ | 43.62 | ||||||||||
| Average Closing Price |
$ | 81.80 | $ | 77.51 | $ | 69.14 | $ | 65.43 | $ | 57.27 | ||||||||||
| Closing Price, at the end of the quarter |
$ | 83.12 | $ | 71.34 | $ | 75.44 | $ | 67.07 | $ | 65.55 | ||||||||||
| Dividends per share - annualized |
$ | 2.00 | $ | 2.00 | $ | 2.00 | $ | 2.00 | $ | 2.00 | ||||||||||
| Closing dividend yield - annualized |
2.41 | % | 2.80 | % | 2.65 | % | 2.98 | % | 3.05 | % | ||||||||||
| Closing common shares outstanding, plus common, preferred and LTIP units on an as-converted basis (but excluding outperformance plan units) (thousands) (1) |
162,534 | 162,086 | 161,911 | 161,571 | 161,462 | |||||||||||||||
| Closing market value of outstanding shares and units (thousands) |
$ | 13,509,826 | $ | 11,563,216 | $ | 12,214,566 | $ | 10,836,567 | $ | 10,583,834 | ||||||||||
| (1) | For additional detail, see page 12. |
Timing
Quarterly results for the remainder of 2010 will be announced according to the following schedule:
Fourth Quarter Tentatively January 25, 2011
4
Boston Properties, Inc.
Third Quarter 2010
RESEARCH COVERAGE
| Equity Research Coverage |
Debt Research Coverage |
Rating Agencies | ||||
| John Eade | Steve Sakwa / Ian Weissman | Thomas Cook | Janice Svec | |||
| Argus Research Company | ISI Group | Citi Investment Research | Fitch Ratings | |||
| 212.427.7500 | 212.446.9462 / 212.446.9461 | 212.723.1112 | 212.908.0304 | |||
| Jeffrey Spector / Jamie Feldman | Steve Benyik | John Giordano | Karen Nickerson | |||
| Bank of America-Merrill Lynch | Jefferies & Co. | Credit Suisse Securities | Moody’s Investors Service | |||
| 212.449.6329 / 212.449.6339 | 212.707.6348 | 212.538.4935 | 212.553.4924 | |||
| Ross Smotrich / Jeff Langbaum | Mitch Germain | Mark Streeter | James Fielding | |||
| Barclays Capital | JMP Securities | J.P. Morgan Securities | Standard & Poor’s | |||
| 212.526.2306 / 212.526.0971 | 212.906.3546 | 212.834.5086 | 212.438.2452 | |||
| Michael Bilerman / Joshua Attie | Anthony Paolone / Michael Mueller | Thierry Perrein / Jason Jones | ||||
| Citigroup Global Markets | J.P. Morgan Securities | Wells Fargo | ||||
| 212.816.1383 / 212.816.1685 | 212.622.6682 / 212.622.6689 | 704.715.8455 / 704.715.7932 | ||||
| James Sullivan / Stephen Boyd | Sheila McGrath / Kristin Brown | |||||
| Cowen and Company | Keefe, Bruyette & Woods | |||||
| 646.562.1380 / 646.562.1382 | 212.887.7793 / 212.887.7738 | |||||
| Andrew Rosivach | Jordan Sadler / Craig Mailman | |||||
| Credit Suisse | KeyBanc Capital Markets | |||||
| 415.249.7942 | 917.368.2280 / 917.368.2316 | |||||
| John Perry | Robert Stevenson | |||||
| Deutsche Bank Securities | Macquarie Research | |||||
| 212.250.4912 | 212.857.6168 | |||||
| Sri Nagarajan / Evan Smith | David Rodgers / Mike Carroll | |||||
| FBR Capital Markets | RBC Capital Markets | |||||
| 646.885.5429 / 646.885.5431 | 440.715.2647 / 440.715.2649 | |||||
| David Harris | Alexander Goldfarb / James Milam | |||||
| Gleacher & Company | Sandler O’Neill & Partners | |||||
| 203.532.7332 | 212.466.7937 / 212.466.8066 | |||||
| Jay Habermann / Sloan Bohlen | John Guinee / Erin Aslakson | |||||
| Goldman Sachs & Company | Stifel, Nicolaus & Company | |||||
| 917.343.4260 / 212.902.2796 | 443.224.1307 / 443.224.1350 | |||||
| Michael Knott / Lukas Hartwich | Ross Nussbaum / Rob Salisbury | |||||
| Green Street Advisors | UBS Securities | |||||
| 949.640.8780 / 949.640.8780 | 212.713.2484 / 212.713.4760 | |||||
With the exception of Green Street Advisors, an independent research firm, the equity analysts listed above are those analysts that, according to First Call Corporation, have published research material on the Company and are listed as covering the Company. Please note that any opinions, estimates or forecasts regarding Boston Properties’ performance made by the analysts listed above do not represent the opinions, estimates or forecasts of Boston Properties or its management. Boston Properties does not by its reference above imply its endorsement of or concurrence with any information, conclusions or recommendations made by any of such analysts.
5
Boston Properties, Inc.
Third Quarter 2010
FINANCIAL HIGHLIGHTS
(unaudited and in thousands, except per share amounts)
This section includes non-GAAP financial measures, which are accompanied by what we consider the most directly comparable financial measures calculated and presented in accordance with GAAP. Quantitative reconciliations of the differences between the non-GAAP financial measures presented and the most directly comparable GAAP financial measures are shown on pages 9-11. A description of the non-GAAP financial measures we present and a statement of the reasons why management believes the non-GAAP measures provide useful information to investors about the Company’s financial condition and results of operations can be found on pages 49-50.
| Three Months Ended | ||||||||||||||||||||
| 30-Sep-10 | 30-Jun-10 | 31-Mar-10 | 31-Dec-09 | 30-Sep-09 | ||||||||||||||||
| Selected Items: |
||||||||||||||||||||
| Revenue |
$ | 388,224 | $ | 395,958 | $ | 379,781 | $ | 377,912 | $ | 377,303 | ||||||||||
| Straight-line rent (1) |
$ | 22,861 | $ | 27,038 | $ | 29,068 | $ | 13,279 | $ | 16,224 | ||||||||||
| Fair value lease revenue (1) (2) |
$ | 19,368 | $ | 19,748 | $ | 23,319 | $ | 23,705 | $ | 24,343 | ||||||||||
| Company share of funds from operations from unconsolidated joint ventures |
$ | 38,167 | $ | 37,589 | $ | 38,923 | $ | 31,469 | $ | 37,612 | ||||||||||
| Lease termination fees (included in revenue) (1) |
$ | 5,225 | $ | 4,156 | $ | 1,907 | $ | 1,060 | $ | 474 | ||||||||||
| ASC 470-20 (formerly known as FSP APB 14-1) interest expense adjustment |
$ | 9,453 | $ | 9,263 | $ | 10,112 | $ | 9,893 | $ | 9,848 | ||||||||||
| Capitalized interest |
$ | 9,302 | $ | 9,023 | $ | 8,087 | $ | 11,637 | $ | 12,982 | ||||||||||
| Capitalized wages |
$ | 3,247 | $ | 2,745 | $ | 2,524 | $ | 2,929 | $ | 3,037 | ||||||||||
| Operating Margins [(rental revenue - rental expense)/rental revenue] (3) |
67.2 | % | 68.1 | % | 67.3 | % | 66.9 | % | 65.9 | % | ||||||||||
| Impairment losses on investments in unconsolidated joint ventures (4) |
$ | — | $ | — | $ | — | $ | 6,198 | $ | — | ||||||||||
| Net income attributable to Boston Properties, Inc. |
$ | 57,668 | $ | 61,412 | $ | 52,714 | $ | 53,317 | $ | 65,795 | ||||||||||
| Funds from operations (FFO) attributable to Boston Properties, Inc. |
$ | 150,847 | $ | 156,870 | $ | 149,596 | $ | 146,056 | $ | 158,450 | ||||||||||
| FFO per share - diluted |
$ | 1.07 | $ | 1.12 | $ | 1.07 | $ | 1.04 | $ | 1.13 | ||||||||||
| Net income attributable to Boston Properties, Inc. per share - basic |
$ | 0.41 | $ | 0.44 | $ | 0.38 | $ | 0.38 | $ | 0.47 | ||||||||||
| Net income attributable to Boston Properties, Inc. per share - diluted |
$ | 0.41 | $ | 0.44 | $ | 0.38 | $ | 0.38 | $ | 0.47 | ||||||||||
| Dividends per common share |
$ | 0.50 | $ | 0.50 | $ | 0.50 | $ | 0.50 | $ | 0.50 | ||||||||||
| Funds available for distribution to common shareholders and common unitholders (FAD) (5) |
$ | 114,097 | $ | 121,829 | $ | 55,328 | $ | 120,838 | $ | 129,195 | ||||||||||
| Ratios: |
||||||||||||||||||||
| Interest Coverage Ratio (excluding capitalized interest) - cash basis (6) |
2.77 | 2.73 | 2.80 | 3.08 | 3.50 | |||||||||||||||
| Interest Coverage Ratio (including capitalized interest) - cash basis (6) |
2.50 | 2.47 | 2.54 | 2.67 | 2.92 | |||||||||||||||
| FFO Payout Ratio |
46.73 | % | 44.64 | % | 46.73 | % | 48.08 | % | 44.25 | % | ||||||||||
| FAD Payout Ratio |
70.63 | % | 65.97 | % | 145.10 | % | 66.29 | % | 61.89 | % | ||||||||||
| 30-Sep-10 | 30-Jun-10 | 31-Mar-10 | 31-Dec-09 | 30-Sep-09 | ||||||||||||||||
| Capitalization: |
||||||||||||||||||||
| Common Stock Price @ Quarter End |
$ | 83.12 | $ | 71.34 | $ | 75.44 | $ | 67.07 | $ | 65.55 | ||||||||||
| Equity Value @ Quarter End |
$ | 13,509,826 | $ | 11,563,216 | $ | 12,214,566 | $ | 10,836,567 | $ | 10,583,834 | ||||||||||
| Total Consolidated Debt |
$ | 7,444,886 | $ | 7,229,300 | $ | 6,674,899 | $ | 6,719,771 | $ | 6,008,990 | ||||||||||
| Total Consolidated Market Capitalization |
$ | 20,954,712 | $ | 18,792,516 | $ | 18,889,465 | $ | 17,556,338 | $ | 16,592,824 | ||||||||||
| Total Consolidated Debt/Total Consolidated Market Capitalization (7) |
35.53 | % | 38.47 | % | 35.34 | % | 38.28 | % | 36.21 | % | ||||||||||
| BXP’s Share of Joint Venture Debt |
$ | 1,558,597 | $ | 1,535,198 | $ | 1,520,976 | $ | 1,555,494 | $ | 1,555,560 | ||||||||||
| Total Combined Debt |
$ | 9,003,483 | $ | 8,764,498 | $ | 8,195,875 | $ | 8,275,265 | $ | 7,564,550 | ||||||||||
| Total Combined Market Capitalization (8) |
$ | 22,513,309 | $ | 20,327,714 | $ | 20,410,440 | $ | 19,111,832 | $ | 18,148,384 | ||||||||||
| Total Combined Debt/Total Combined Market Capitalization (8) (9) |
39.99 | % | 43.12 | % | 40.16 | % | 43.30 | % | 41.68 | % | ||||||||||
| (1) | Includes the Company’s share of unconsolidated joint venture amounts. For additional detail, see page 17. |
| (2) | Represents the net adjustment for above- and below-market leases that are being amortized over the terms of the respective leases in place at the property acquisition dates. |
| (3) | Rental Expense consists of operating expenses and real estate taxes. Amounts are exclusive of the gross up of reimbursable electricity and other amounts totaling $9,211, $9,311, $9,131, $8,813 and $9,641 for the three months ended September 30, 2010, June 30, 2010, March 31, 2010, December 31, 2009 and September 30, 2009, respectively. |
| (4) | Represents the non-cash impairment losses on the Company’s investments in unconsolidated joint ventures in accordance with guidance included in Accounting Standards Codification (“ASC”) 323 “Investments-Equity Method and Joint Ventures” (formerly known as APB No. 18, “The Equity Method of Accounting for Investments in Common Stock”) and ASC 360 “Property, Plant and Equipment” (formerly known as SFAS No. 144 “Accounting for the Impairment or Disposal of Long Lived Assets”). |
| (5) | For a quantitative reconciliation of the differences between FAD and FFO, see page 11. |
| (6) | For additional detail, see page 11. |
| (7) | For disclosures related to our definition of Total Consolidated Debt to Total Consolidated Market Capitalization Ratio, see page 49. |
| (8) | For additional detail, see page 12. |
| (9) | For disclosures related to our definition of Total Combined Debt to Total Combined Market Capitalization Ratio, see page 49. |
6
Boston Properties, Inc.
Third Quarter 2010
CONSOLIDATED BALANCE SHEETS
(unaudited and in thousands)
| 30-Sep-10 | 30-Jun-10 | 31-Mar-10 | 31-Dec-09 | 30-Sep-09 | ||||||||||||||||
| ASSETS | ||||||||||||||||||||
| Real estate |
$ | 10,015,347 | $ | 9,984,329 | $ | 9,823,024 | $ | 9,817,388 | $ | 9,768,619 | ||||||||||
| Development in progress (1) |
1,003,508 | 632,731 | 662,809 | 563,645 | 976,758 | |||||||||||||||
| Land held for future development (1) |
754,120 | 732,006 | 730,201 | 718,525 | 241,617 | |||||||||||||||
| Less accumulated depreciation |
(2,243,265 | ) | (2,173,300 | ) | (2,103,274 | ) | (2,033,677 | ) | (1,966,780 | ) | ||||||||||
| Total real estate |
9,529,710 | 9,175,766 | 9,112,760 | 9,065,881 | 9,020,214 | |||||||||||||||
| Cash and cash equivalents |
1,270,074 | 1,703,448 | 1,220,392 | 1,448,933 | 782,106 | |||||||||||||||
| Cash held in escrows (2) |
300,771 | 25,382 | 20,848 | 21,867 | 20,681 | |||||||||||||||
| Marketable securities |
7,911 | 7,026 | 7,592 | 9,946 | 10,436 | |||||||||||||||
| Tenant and other receivables, net |
113,655 | 98,602 | 102,085 | 93,240 | 71,845 | |||||||||||||||
| Note receivable (3) |
270,000 | 270,000 | 270,000 | 270,000 | 270,000 | |||||||||||||||
| Accrued rental income, net |
421,008 | 401,054 | 376,942 | 363,121 | 353,709 | |||||||||||||||
| Deferred charges, net |
300,882 | 289,388 | 291,564 | 294,395 | 288,642 | |||||||||||||||
| Prepaid expenses and other assets |
42,391 | 22,385 | 50,998 | 17,684 | 41,977 | |||||||||||||||
| Investments in unconsolidated joint ventures |
792,434 | 794,650 | 798,161 | 763,636 | 772,167 | |||||||||||||||
| Total assets |
$ | 13,048,836 | $ | 12,787,701 | $ | 12,251,342 | $ | 12,348,703 | $ | 11,631,777 | ||||||||||
| LIABILITIES AND EQUITY | ||||||||||||||||||||
| Liabilities: |
||||||||||||||||||||
| Mortgage notes payable (2) |
$ | 2,813,338 | $ | 2,608,577 | $ | 2,637,534 | $ | 2,643,301 | $ | 2,643,497 | ||||||||||
| Unsecured senior notes, net of discount |
2,872,058 | 2,871,909 | 2,172,525 | 2,172,389 | 1,472,740 | |||||||||||||||
| Unsecured exchangeable senior notes, net of discount |
1,759,490 | 1,748,814 | 1,864,840 | 1,904,081 | 1,892,753 | |||||||||||||||
| Unsecured line of credit |
— | — | — | — | — | |||||||||||||||
| Accounts payable and accrued expenses |
199,534 | 177,000 | 189,633 | 220,089 | 229,177 | |||||||||||||||
| Dividends and distributions payable |
81,068 | 80,865 | 80,756 | 80,536 | 80,463 | |||||||||||||||
| Accrued interest payable |
84,689 | 80,521 | 69,166 | 76,058 | 49,536 | |||||||||||||||
| Other liabilities |
104,914 | 95,423 | 115,755 | 127,538 | 131,193 | |||||||||||||||
| Total liabilities |
7,915,091 | 7,663,109 | 7,130,209 | 7,223,992 | 6,499,359 | |||||||||||||||
| Commitments and contingencies |
— | — | — | — | — | |||||||||||||||
| Noncontrolling interest: |
||||||||||||||||||||
| Redeemable preferred units of the Operating Partnership |
55,652 | 55,652 | 55,652 | 55,652 | 55,652 | |||||||||||||||
| Equity: |
||||||||||||||||||||
| Stockholders’ equity attributable to Boston Properties, Inc.: |
||||||||||||||||||||
| Excess stock, $.01 par value, 150,000,000 shares authorized, none issued or outstanding |
— | — | — | — | — | |||||||||||||||
| Preferred stock, $.01 par value, 50,000,000 shares authorized, none issued or outstanding |
— | — | — | — | — | |||||||||||||||
| Common stock, $.01 par value, 250,000,000 shares authorized, 140,058,421, 139,273,399, 139,003,995, 138,880,010 and 138,702,374 outstanding, respectively |
1,401 | 1,393 | 1,390 | 1,389 | 1,387 | |||||||||||||||
| Additional paid-in capital |
4,424,711 | 4,394,435 | 4,381,075 | 4,373,679 | 4,362,874 | |||||||||||||||
| Earnings in excess of dividends |
58,051 | 70,426 | 78,645 | 95,433 | 111,463 | |||||||||||||||
| Treasury common stock, at cost |
(2,722 | ) | (2,722 | ) | (2,722 | ) | (2,722 | ) | (2,722 | ) | ||||||||||
| Accumulated other comprehensive loss |
(19,530 | ) | (20,155 | ) | (21,145 | ) | (21,777 | ) | (22,411 | ) | ||||||||||
| Total stockholders’ equity attributable to Boston Properties, Inc. |
4,461,911 | 4,443,377 | 4,437,243 | 4,446,002 | 4,450,591 | |||||||||||||||
| Noncontrolling interests: |
||||||||||||||||||||
| Common units of the Operating Partnership |
609,454 | 619,224 | 622,263 | 617,386 | 620,460 | |||||||||||||||
| Property partnerships |
6,728 | 6,339 | 5,975 | 5,671 | 5,715 | |||||||||||||||
| Total equity |
5,078,093 | 5,068,940 | 5,065,481 | 5,069,059 | 5,076,766 | |||||||||||||||
| Total liabilities and equity |
$ | 13,048,836 | $ | 12,787,701 | $ | 12,251,342 | $ | 12,348,703 | $ | 11,631,777 | ||||||||||
| (1) | Effective as of December 31, 2009, land held for future development includes land and improvement costs associated with the Company’s 250 West 55th Street project, which was previously included in development in progress. The Company announced in February 2009 that it was suspending construction of the 1,000,000 square foot office project and during the fourth quarter of 2009 the Company completed the construction of foundations and steel/deck to grade to facilitate a restart of construction in the future. |
| (2) | On September 24, 2010, in connection with the acquisition of 510 Madison Avenue in New York City, the Company caused the assignment of the existing mortgage to a new lender and subsequently increased the amount borrowed to $267.5 million, which amount is fully secured by cash deposits included within the caption “Cash held in escrows.” |
| (3) | The note receivable consists of a partner loan from the Company to the unconsolidated joint venture entity that owns the General Motors Building. The unconsolidated entity has a corresponding note payable to the Company, see page 17. |
7
Boston Properties, Inc.
Third Quarter 2010
CONSOLIDATED INCOME STATEMENTS
(in thousands, except for per share amounts)
(unaudited)
| Three Months Ended | ||||||||||||||||||||
| 30-Sep-10 | 30-Jun-10 | 31-Mar-10 | 31-Dec-09 | 30-Sep-09 | ||||||||||||||||
| Revenue: |
||||||||||||||||||||
| Rental |
||||||||||||||||||||
| Base Rent |
$ | 310,459 | $ | 305,823 | $ | 302,383 | $ | 295,448 | $ | 291,602 | ||||||||||
| Recoveries from tenants |
45,646 | 44,340 | 45,544 | 46,769 | 51,901 | |||||||||||||||
| Parking and other |
15,850 | 16,423 | 15,297 | 15,357 | 15,883 | |||||||||||||||
| Total rental revenue |
371,955 | 366,586 | 363,224 | 357,574 | 359,386 | |||||||||||||||
| Hotel revenue |
8,016 | 8,371 | 5,903 | 10,277 | 6,650 | |||||||||||||||
| Development and management services (1) |
6,439 | 18,884 | 8,944 | 8,277 | 9,754 | |||||||||||||||
| Interest and other |
1,814 | 2,117 | 1,710 | 1,784 | 1,513 | |||||||||||||||
| Total revenue |
388,224 | 395,958 | 379,781 | 377,912 | 377,303 | |||||||||||||||
| Expenses: |
||||||||||||||||||||
| Operating |
71,100 | 68,039 | 69,062 | 69,280 | 70,261 | |||||||||||||||
| Real estate taxes |
56,941 | 55,245 | 55,923 | 54,908 | 58,759 | |||||||||||||||
| Hotel operating |
6,194 | 6,089 | 5,268 | 7,717 | 5,418 | |||||||||||||||
| General and administrative (2) (3) |
18,067 | 17,648 | 26,822 | 19,506 | 19,989 | |||||||||||||||
| Acquisition costs (4) |
1,893 | — | — | — | — | |||||||||||||||
| Interest (5) (6) |
97,103 | 96,755 | 92,029 | 88,180 | 77,090 | |||||||||||||||
| Depreciation and amortization |
81,133 | 81,400 | 83,075 | 79,125 | 78,181 | |||||||||||||||
| Gain from suspension of development (7) |
— | — | (7,200 | ) | — | — | ||||||||||||||
| Losses from early extinguishments of debt (8) |
— | 6,051 | 2,170 | — | 16 | |||||||||||||||
| Losses (gains) from investments in securities (2) |
(731 | ) | 678 | (200 | ) | (510 | ) | (1,317 | ) | |||||||||||
| Total expenses |
331,700 | 331,905 | 326,949 | 318,206 | 308,397 | |||||||||||||||
| Income before income from unconsolidated joint ventures, gains on sales of real estate and net income attributable to noncontrolling interests |
56,524 | 64,053 | 52,832 | 59,706 | 68,906 | |||||||||||||||
| Income from unconsolidated joint ventures (9) |
11,565 | 7,465 | 7,910 | 962 | 6,350 | |||||||||||||||
| Gains on sales of real estate (1) |
— | 969 | 1,765 | 2,078 | 2,394 | |||||||||||||||
| Net income |
68,089 | 72,487 | 62,507 | 62,746 | 77,650 | |||||||||||||||
| Net income attributable to noncontrolling interests: |
||||||||||||||||||||
| Noncontrolling interests in property partnerships |
(889 | ) | (864 | ) | (804 | ) | (463 | ) | (1,114 | ) | ||||||||||
| Noncontrolling interest - common units of the Operating Partnership (10) |
(8,712 | ) | (9,250 | ) | (7,870 | ) | (7,841 | ) | (9,662 | ) | ||||||||||
| Noncontrolling interest in gains on sales of real estate - common units of the |
||||||||||||||||||||
| Operating Partnership (10) |
— | (125 | ) | (227 | ) | (265 | ) | (307 | ) | |||||||||||
| Noncontrolling interest - redeemable preferred units of the Operating Partnership |
(820 | ) | (836 | ) | (892 | ) | (860 | ) | (772 | ) | ||||||||||
| Net income attributable to Boston Properties, Inc. |
$ | 57,668 | $ | 61,412 | $ | 52,714 | $ | 53,317 | $ | 65,795 | ||||||||||
| INCOME PER SHARE OF COMMON STOCK (EPS) |
||||||||||||||||||||
| Net income attributable to Boston Properties, Inc. per share - basic |
$ | 0.41 | $ | 0.44 | $ | 0.38 | $ | 0.38 | $ | 0.47 | ||||||||||
| Net income attributable to Boston Properties, Inc. per share - diluted |
$ | 0.41 | $ | 0.44 | $ | 0.38 | $ | 0.38 | $ | 0.47 | ||||||||||
| (1) | During the three months ended June 30, 2010, the Company satisfied the requirements of its master lease agreement related to the 2006 sale of 280 Park Avenue in New York City, resulting in the recognition of the remaining deferred gain on sale of real estate totaling approximately $1.0 million. In conjunction with the satisfaction of the master lease agreement, the property management and leasing agreement entered into with the seller at the time of the sale was terminated, resulting in the recognition of deferred management fees totaling approximately $12.2 million. |
| (2) | Losses (gains) from investments in securities includes $(731), $678, $(200), $(486) and $(1,285) and general and administrative expense includes $521, $(675), $288, $444 and $1,263 for the three months ended September 30, 2010, June 30, 2010, March 31, 2010, December 31, 2009 and September 30, 2009, respectively, related to the Company’s deferred compensation plan. |
| (3) | For the three months ended March 31, 2010, general and administrative expense includes an aggregate of approximately $5.8 million of remaining stock-based compensation granted between 2006 and 2009 to Edward H. Linde, our former Chief Executive Officer, which expense was accelerated as a result of his passing on January 10, 2010. |
| (4) | Effective January 1, 2009, the Company is required to expense costs incurred during the period associated with the acquisitions and pending acquisitions of real estate such as legal, due diligence and other closing related costs in accordance with ASC 805 “Business Combinations” (formerly known as SFAS No. 141(R)). |
| (5) | Interest expense is reported net of capitalized interest of $9,302, $9,023, $8,087, $11,637 and $12,982 for the three months ended September 30, 2010, June 30, 2010, March 31, 2010, December 31, 2009 and September 30, 2009, respectively. |
| (6) | Includes additional non-cash interest expense related to the adoption of ASC 470-20 (formerly known as FSP No. APB 14-1). For additional detail, see page 12. |
| (7) | On February 6, 2009, the Company announced that it was suspending construction on its 1,000,000 square foot office building at 250 West 55th Street in New York City. During the first quarter of 2009, the Company recognized costs aggregating approximately $27.8 million related to the suspension of development, which amount included a $20.0 million contractual amount due pursuant to a lease agreement. During December 2009, the Company completed the construction of foundations and steel/deck to grade to facilitate a restart of construction in the future and as a result ceased interest capitalization on the project. On January 19, 2010, the Company paid $12.8 million related to the termination of the lease agreement. As a result, the Company recognized approximately $7.2 million of income during the first quarter of 2010. |
| (8) | During the three months ended March 31, 2010, the Company’s Operating Partnership repurchased approximately $53.6 million aggregate principal amount of its 2.875% exchangeable senior notes due 2037 for approximately $53.0 million. The repurchased notes had an aggregate carrying value of approximately $50.8 million, resulting in the recognition of a loss on extinguishment of approximately $2.2 million. During the three months ended June 30, 2010, the Company’s Operating Partnership repurchased approximately $132.8 million aggregate principal amount of its 2.875% exchangeable senior notes due 2037 for approximately $132.5 million. These repurchased notes had an aggregate carrying value of approximately $126.4 million, resulting in the recognition of a loss on extinguishment of approximately $6.1 million. |
| (9) | Includes a non-cash impairment loss aggregating approximately $6.2 million for the three months ended December 31, 2009. In accordance with guidance included in ASC 323 “Investments-Equity Method and Joint Ventures” (formerly known as APB No. 18 “The Equity Method of Accounting for Investments in Common Stock”) and ASC 360 “Property, Plant and Equipment” (formerly known as SFAS No. 144 “Accounting for the Impairment or Disposal of Long Lived Assets”). |
| (10) | Equals noncontrolling interest - common units of the Operating Partnership’s share of 12.73%, 12.87%, 12.88%, 12.77% and 12.81% of income before net income attributable to noncontrolling interests in Operating Partnership after deduction for preferred distributions for the three months ended September 30, 2010, June 30, 2010, March 31, 2010, December 31, 2009 and September 30, 2009, respectively. |
8
Boston Properties, Inc.
Third Quarter 2010
FUNDS FROM OPERATIONS (FFO)
(in thousands, except for per share amounts)
(unaudited)
| Three Months Ended | ||||||||||||||||||||
| 30-Sep-10 | 30-Jun-10 | 31-Mar-10 | 31-Dec-09 | 30-Sep-09 | ||||||||||||||||
| Net income attributable to Boston Properties, Inc. |
$ | 57,668 | $ | 61,412 | $ | 52,714 | $ | 53,317 | $ | 65,795 | ||||||||||
| Add: |
||||||||||||||||||||
| Noncontrolling interest in gains on sales of real estate - common units of the |
||||||||||||||||||||
| Operating Partnership |
— | 125 | 227 | 265 | 307 | |||||||||||||||
| Noncontrolling interest - common units of the Operating Partnership |
8,712 | 9,250 | 7,870 | 7,841 | 9,662 | |||||||||||||||
| Noncontrolling interest - redeemable preferred units of the Operating Partnership |
820 | 836 | 892 | 860 | 772 | |||||||||||||||
| Noncontrolling interests in property partnerships |
889 | 864 | 804 | 463 | 1,114 | |||||||||||||||
| Less: |
||||||||||||||||||||
| Income from unconsolidated joint ventures |
11,565 | 7,465 | 7,910 | 962 | 6,350 | |||||||||||||||
| Gains on sales of real estate |
— | 969 | 1,765 | 2,078 | 2,394 | |||||||||||||||
| Income before income from unconsolidated joint ventures, gains on sales of real estate and net income attributable to noncontrolling interests |
56,524 | 64,053 | 52,832 | 59,706 | 68,906 | |||||||||||||||
| Add: |
||||||||||||||||||||
| Real estate depreciation and amortization (1) |
107,300 | 111,055 | 113,618 | 109,153 | 108,975 | |||||||||||||||
| Income from unconsolidated joint ventures (2) |
11,565 | 7,465 | 7,910 | 962 | 6,350 | |||||||||||||||
| Less: |
||||||||||||||||||||
| Noncontrolling interests in property partnerships’ share of funds from operations |
1,724 | 1,697 | 1,755 | 1,523 | 1,731 | |||||||||||||||
| Noncontrolling interest - redeemable preferred units of the Operating Partnership |
820 | 836 | 892 | 860 | 772 | |||||||||||||||
| Funds from operations (FFO) attributable to the Operating Partnership |
172,845 | 180,040 | 171,713 | 167,438 | 181,728 | |||||||||||||||
| Less: |
||||||||||||||||||||
| Noncontrolling interest - common units of the Operating Partnership’s share of funds from operations |
21,998 | 23,170 | 22,117 | 21,382 | 23,278 | |||||||||||||||
| FFO attributable to Boston Properties, Inc. (3) |
$ | 150,847 | $ | 156,870 | $ | 149,596 | $ | 146,056 | $ | 158,450 | ||||||||||
| FFO per share - basic (2) |
$ | 1.08 | $ | 1.13 | $ | 1.08 | $ | 1.05 | $ | 1.14 | ||||||||||
| Weighted average shares outstanding - basic |
139,595 | 139,113 | 138,931 | 138,761 | 138,641 | |||||||||||||||
| FFO per share - diluted (2) |
$ | 1.07 | $ | 1.12 | $ | 1.07 | $ | 1.04 | $ | 1.13 | ||||||||||
| Weighted average shares outstanding - diluted |
141,654 | 141,287 | 141,058 | 140,920 | 140,686 | |||||||||||||||
| (1) | Real estate depreciation and amortization consists of depreciation and amortization from the consolidated statements of operations of $81,133, $81,400, $83,075, $79,125 and $78,181, our share of unconsolidated joint venture real estate depreciation and amortization of $26,602, $30,124, $31,013, $30,507 and $31,262, less corporate related depreciation of $435, $469, $470, $479 and $468 for the three months ended September 30, 2010, June 30, 2010, March 31, 2010, December 31, 2009 and September 30, 2009, respectively. |
| (2) | Includes a non-cash impairment loss aggregating approximately $6.2 million, or $0.04 per share diluted, for the three months ended December 31, 2009 in accordance with guidance included in ASC 323 “Investments-Equity Method and Joint Ventures” (formerly known as APB No. 18 “The Equity Method of Accounting for Investments in Common Stock”) and ASC 360 “Property, Plant and Equipment” (formerly known as SFAS No. 144 “Accounting for the Impairment or Disposal of Long Lived Assets”). |
| (3) | Based on weighted average shares for the quarter. The Company’s share for the quarter ended September 30, 2010, June 30, 2010, March 31, 2010, December 31, 2009 and September 30, 2009 was 87.27%, 87.13%, 87.12%, 87.23% and 87.19%, respectively. |
9
Boston Properties, Inc.
Third Quarter 2010
RECONCILIATION TO DILUTED FUNDS FROM OPERATIONS
(in thousands, except for per share amounts)
(unaudited)
| September 30, 2010 | June 30, 2010 | March 31, 2010 | December 31, 2009 | September 30, 2009 | ||||||||||||||||||||||||||||||||||||
| Income (Numerator) |
Shares/Units (Denominator) |
Income (Numerator) |
Shares/Units (Denominator) |
Income (Numerator) |
Shares/Units (Denominator) |
Income (Numerator) |
Shares/Units (Denominator) |
Income (Numerator) |
Shares/Units (Denominator) |
|||||||||||||||||||||||||||||||
| Basic FFO |
$ | 172,845 | 159,952 | $ | 180,040 | 159,660 | $ | 171,713 | 159,472 | $ | 167,438 | 159,076 | $ | 181,728 | 159,009 | |||||||||||||||||||||||||
| Effect of Dilutive Securities |
||||||||||||||||||||||||||||||||||||||||
| Convertible Preferred Units |
820 | 1,461 | 836 | 1,461 | 892 | 1,461 | 860 | 1,461 | 772 | 1,461 | ||||||||||||||||||||||||||||||
| Stock based compensation |
— | 598 | — | 713 | — | 666 | — | 698 | — | 584 | ||||||||||||||||||||||||||||||
| Diluted FFO |
$ | 173,665 | 162,011 | $ | 180,876 | 161,834 | $ | 172,605 | 161,599 | $ | 168,298 | 161,235 | $ | 182,500 | 161,054 | |||||||||||||||||||||||||
| Less: |
||||||||||||||||||||||||||||||||||||||||
| Noncontrolling interest - common units of the Operating Partnership’s share of diluted funds from operations |
21,822 | 20,357 | 22,965 | 20,547 | 21,940 | 20,541 | 21,204 | 20,315 | 23,080 | 20,368 | ||||||||||||||||||||||||||||||
| Company’s share of diluted FFO (1) |
$ | 151,843 | 141,654 | $ | 157,911 | 141,287 | $ | 150,665 | 141,058 | $ | 147,094 | 140,920 | $ | 159,420 | 140,686 | |||||||||||||||||||||||||
| FFO per share - basic |
$ | 1.08 | $ | 1.13 | $ | 1.08 | $ | 1.05 | $ | 1.14 | ||||||||||||||||||||||||||||||
| FFO per share - diluted |
$ | 1.07 | $ | 1.12 | $ | 1.07 | $ | 1.04 | $ | 1.13 | ||||||||||||||||||||||||||||||
| (1) | Based on weighted average diluted shares for the quarter. The Company’s share for the quarter ended September 30, 2010, June 30, 2010, March 31, 2010, December 31, 2009 and September 30, 2009 was 87.43%, 87.30%, 87.29%, 87.40% and 87.35%, respectively. |
10
Boston Properties, Inc.
Third Quarter 2010
Funds Available for Distribution (FAD)
(in thousands)
| Three Months Ended | ||||||||||||||||||||||||
| 30-Sep-10 | 30-Jun-10 | 31-Mar-10 | 31-Dec-09 | 30-Sep-09 | ||||||||||||||||||||
| Basic FFO (see page 9) |
$ | 172,845 | $ | 180,040 | $ | 171,713 | $ | 167,438 | $ | 181,728 | ||||||||||||||
| 2nd generation tenant improvements and leasing commissions |
(31,154 | ) | (26,451 | ) | (90,072 | ) | (28,886 | ) | (26,638 | ) | ||||||||||||||
| Straight-line rent (1) |
(22,861 | ) | (27,038 | ) | (29,068 | ) | (13,279 | ) | (16,224 | ) | ||||||||||||||
| Recurring capital expenditures |
(3,070 | ) | (1,996 | ) | (1,044 | ) | (8,854 | ) | (4,443 | ) | ||||||||||||||
| Fair value interest adjustment (1) |
1,196 | 1,552 | 1,795 | 1,755 | 1,723 | |||||||||||||||||||
| ASC 470-20 (formerly known as FSP APB 14-1) interest expense adjustment |
9,453 | 9,263 | 10,112 | 9,893 | 9,848 | |||||||||||||||||||
| Fair value lease revenue (1) (2) |
(19,368 | ) | (19,748 | ) | (23,319 | ) | (23,705 | ) | (24,343 | ) | ||||||||||||||
| Hotel improvements, equipment upgrades and replacements |
(231 | ) | (182 | ) | (307 | ) | (198 | ) | (376 | ) | ||||||||||||||
| Non real estate depreciation |
435 | 469 | 470 | 479 | 468 | |||||||||||||||||||
| Stock-based compensation |
6,380 | 6,334 | 14,011 | 6,500 | 6,483 | |||||||||||||||||||
| Impairment losses on investments in unconsolidated joint ventures (3) |
— | — | — | 6,198 | — | |||||||||||||||||||
| Gain from suspension of development |
— | — | (7,200 | ) | — | — | ||||||||||||||||||
| Losses from early extinguishments of debt |
— | 6,051 | # | 2,170 | — | — | ||||||||||||||||||
| Non-cash termination income (including fair value lease amounts) |
— | (849 | ) | (585 | ) | — | — | |||||||||||||||||
| Non-cash income from termination of management agreement |
— | (12,212 | ) | — | — | — | ||||||||||||||||||
| Partners’ share of joint venture 2nd generation tenant improvement and leasing commissions |
472 | 6,596 | 6,652 | 3,497 | 969 | |||||||||||||||||||
| Funds available for distribution to common shareholders and common unitholders (FAD) |
$ | 114,097 | $ | 121,829 | $ | 55,328 | $ | 120,838 | $ | 129,195 | ||||||||||||||
Interest Coverage Ratios
(in thousands, except for ratio amounts)
| Three Months Ended | ||||||||||||||||||||
| 30-Sep-10 | 30-Jun-10 | 31-Mar-10 | 31-Dec-09 | 30-Sep-09 | ||||||||||||||||
| Excluding Capitalized Interest |
||||||||||||||||||||
| Income before income from unconsolidated joint ventures, gains on sales of real estate and net income attributable to noncontrolling interests |
$ | 56,524 | $ | 64,053 | $ | 52,832 | $ | 59,706 | $ | 68,906 | ||||||||||
| Interest expense |
97,103 | 96,755 | 92,029 | 88,180 | 77,090 | |||||||||||||||
| Depreciation and amortization expense |
81,133 | 81,400 | 83,075 | 79,125 | 78,181 | |||||||||||||||
| Depreciation from joint ventures |
26,602 | 30,124 | 31,013 | 30,507 | 31,262 | |||||||||||||||
| Income from unconsolidated joint ventures |
11,565 | 7,465 | 7,910 | 962 | 6,350 | |||||||||||||||
| Impairment losses on investments in unconsolidated joint ventures (3) |
— | — | — | 6,198 | — | |||||||||||||||
| Gain from suspension of development |
— | — | (7,200 | ) | — | — | ||||||||||||||
| Losses from early extinguishments of debt |
— | 6,051 | 2,170 | — | — | |||||||||||||||
| Non-cash termination income (including fair value lease amounts) |
— | (849 | ) | (585 | ) | — | — | |||||||||||||
| Non-cash income from termination of management agreement |
— | (12,212 | ) | — | — | — | ||||||||||||||
| Stock-based compensation |
6,380 | 6,334 | 14,011 | 6,500 | 6,483 | |||||||||||||||
| Straight-line rent (1) |
(22,861 | ) | (27,038 | ) | (29,068 | ) | (13,279 | ) | (16,224 | ) | ||||||||||
| Fair value lease revenue (1) (2) |
(19,368 | ) | (19,748 | ) | (23,319 | ) | (23,705 | ) | (24,343 | ) | ||||||||||
| Subtotal |
237,078 | 232,335 | 222,868 | 234,194 | 227,705 | |||||||||||||||
| Divided by: |
||||||||||||||||||||
| Adjusted interest expense (4) (5) |
85,504 | 85,145 | 79,677 | 76,033 | 65,120 | |||||||||||||||
| Interest Coverage Ratio |
2.77 | 2.73 | 2.80 | 3.08 | 3.50 | |||||||||||||||
| Including Capitalized Interest |
||||||||||||||||||||
| Income before income from unconsolidated joint ventures, gains on sales of real estate and net income attributable to noncontrolling interests |
$ | 56,524 | $ | 64,053 | $ | 52,832 | $ | 59,706 | $ | 68,906 | ||||||||||
| Interest expense |
97,103 | 96,755 | 92,029 | 88,180 | 77,090 | |||||||||||||||
| Depreciation and amortization expense |
81,133 | 81,400 | 83,075 | 79,125 | 78,181 | |||||||||||||||
| Depreciation from joint ventures |
26,602 | 30,124 | 31,013 | 30,507 | 31,262 | |||||||||||||||
| Income from unconsolidated joint ventures |
11,565 | 7,465 | 7,910 | 962 | 6,350 | |||||||||||||||
| Impairment losses on investments in unconsolidated joint ventures (3) |
— | — | — | 6,198 | — | |||||||||||||||
| Gain from suspension of development |
— | — | (7,200 | ) | — | — | ||||||||||||||
| Losses from early extinguishments of debt |
— | 6,051 | 2,170 | — | — | |||||||||||||||
| Non-cash termination income (including fair value lease amounts) |
— | (849 | ) | (585 | ) | — | — | |||||||||||||
| Non-cash income from termination of management agreement |
— | (12,212 | ) | — | — | — | ||||||||||||||
| Stock-based compensation |
6,380 | 6,334 | 14,011 | 6,500 | 6,483 | |||||||||||||||
| Straight-line rent (1) |
(22,861 | ) | (27,038 | ) | (29,068 | ) | (13,279 | ) | (16,224 | ) | ||||||||||
| Fair value lease revenue (1) (2) |
(19,368 | ) | (19,748 | ) | (23,319 | ) | (23,705 | ) | (24,343 | ) | ||||||||||
| Subtotal |
237,078 | 232,335 | 222,868 | 234,194 | 227,705 | |||||||||||||||
| Divided by: |
||||||||||||||||||||
| Adjusted interest expense (4) (5) (6) |
94,806 | 94,168 | 87,764 | 87,670 | 78,102 | |||||||||||||||
| Interest Coverage Ratio |
2.50 | 2.47 | 2.54 | 2.67 | 2.92 | |||||||||||||||
| (1) | Includes the Company’s share of unconsolidated joint venture amounts. |
| (2) | Represents the net adjustment for above- and below-market leases that are being amortized over the terms of the respective leases in place at the property acquisition dates. |
| (3) | Represents the non-cash impairment losses on the Company’s investments in unconsolidated joint ventures in accordance with guidance included in ASC 323 “Investments-Equity Method and Joint Ventures” (formerly known as APB No. 18, “The Equity Method of Accounting for Investments in Common Stock”) and ASC 360 “Property, Plant and Equipment” (formerly known as SFAS No. 144 “Accounting for the Impairment or Disposal of Long Lived Assets”). |
| (4) | Excludes the impact of the ASC 470-20 (formerly known as FSP APB 14-1) interest expense adjustment of $9,453, $9,263, $10,112, $9,893 and $9,848 for the three months ended September 30, 2010, June 30, 2010, March 31, 2010, December 31, 2009 and September 30, 2009, respectively. |
| (5) | Excludes amortization of financing costs of $2,146, $2,347, $2,240, $2,254 and $2,122 for the three months ended September 30, 2010, June 30, 2010, March 31, 2010, December 31, 2009 and September 30, 2009, respectively. |
| (6) | Includes capitalized interest of $9,302, $9,023, $8,087, $11,637 and $12,982 for the three months ended September 30, 2010, June 30, 2010, March 31, 2010, December 31, 2009 and September 30, 2009, respectively. |
11
Boston Properties, Inc.
Third Quarter 2010
CAPITAL STRUCTURE
Consolidated Debt
(in thousands)
| Aggregate Principal September 30, 2010 |
||||
| Mortgage Notes Payable |
$ | 2,807,238 | ||
| Unsecured Line of Credit |
— | |||
| Unsecured Senior Notes, at face value |
2,875,000 | |||
| Unsecured Exchangeable Senior Notes, at face value |
1,873,694 | |||
| Total Debt |
7,555,932 | |||
| Fair Value Adjustment on Mortgage Notes Payable |
6,100 | |||
| Discount on Unsecured Senior Notes |
(2,942 | ) | ||
| Discount on Unsecured Exchangeable Senior Notes |
(9,785 | ) | ||
| ASC 470-20 (formerly known as FSP APB 14-1) Adjustment (1) |
(104,419 | ) | ||
| Total Consolidated Debt |
$ | 7,444,886 | ||
Boston Properties Limited Partnership Unsecured Senior Notes
| Settlement Date |
4/19/2010 | 10/9/2009 | 5/22/2003 | 3/18/2003 | 1/17/2003 | 12/13/2002 | Total/Average | |||||||||||||||||||||
| Principal Amount |
$ | 700,000 | $ | 700,000 | $ | 250,000 | $ | 300,000 | $ | 175,000 | $ | 750,000 | $ | 2,875,000 | ||||||||||||||
| Yield (on issue date) |
5.708 | % | 5.967 | % | 5.194 | % | 5.693 | % | 6.291 | % | 6.381 | % | 5.94 | % | ||||||||||||||
| Coupon |
5.625 | % | 5.875 | % | 5.000 | % | 5.625 | % | 6.250 | % | 6.250 | % | 5.83 | % | ||||||||||||||
| Public Offering Price |
99.891 | % | 99.931 | % | 99.329 | % | 99.898 | % | 99.763 | % | 99.650 | % | 99.78 | % | ||||||||||||||
| Ratings: |
||||||||||||||||||||||||||||
| Moody’s |
Baa2 (stable) | Baa2 (stable) | Baa2 (stable) | Baa2 (stable) | Baa2 (stable) | Baa2 (stable) | ||||||||||||||||||||||
| S&P |
A- (negative) | A- (negative) | A- (negative) | A- (negative) | A- (negative) | A- (negative) | ||||||||||||||||||||||
| Fitch |
BBB (stable) | BBB (stable) | BBB (stable) | BBB (stable) | BBB (stable) | BBB (stable) | ||||||||||||||||||||||
| Maturity Date |
11/15/2020 | 10/15/2019 | 6/1/2015 | 4/15/2015 | 1/15/2013 | 1/15/2013 | ||||||||||||||||||||||
| Discount |
$ | 745 | $ | 447 | $ | 773 | $ | 140 | $ | 134 | $ | 703 | $ | 2,942 | ||||||||||||||
| Unsecured Senior Notes, net of discount |
$ | 699,255 | $ | 699,553 | $ | 249,227 | $ | 299,860 | $ | 174,866 | $ | 749,297 | $ | 2,872,058 | ||||||||||||||
| Boston Properties Limited Partnership Unsecured Exchangeable Senior Notes
|
| |||||||||||||||||||||||||||
| Settlement Date |
8/19/2008 | 2/6/2007 | 4/6/2006 | Total/Average | ||||||||||||||||||||||||
| Original Principal Amount |
$ | 747,500 | $ | 862,500 | $ | 450,000 | $ | 2,060,000 | ||||||||||||||||||||
| Principal Amount at Quarter End |
$ | 747,500 | $ | 676,194 | $ | 450,000 | $ | 1,873,694 | ||||||||||||||||||||
| Yield (on issue date) |
4.037 | % | 3.462 | % | 3.787 | % | 3.769 | % | ||||||||||||||||||||
| GAAP Yield |
6.555 | % | 5.630 | % | 5.958 | % | 6.078 | % | ||||||||||||||||||||
| Coupon |
3.625 | % | 2.875 | % | 3.750 | % | ||||||||||||||||||||||
| Exchange Rate |
8.5051 | 7.0430 | 10.0066 | |||||||||||||||||||||||||
| Exchange Price |
$ | 136.13 | (2) | $ | 141.98 | $ | 99.93 | |||||||||||||||||||||
| First Optional Redemption Date |
N/A | 2/20/2012 | 5/18/2013 | |||||||||||||||||||||||||
| Maturity Date |
2/15/2014 | 2/15/2037 | 5/15/2036 | |||||||||||||||||||||||||
| Discount |
$ | 4,765 | $ | 5,020 | $ | — | $ | 9,785 | ||||||||||||||||||||
| ASC 470-20 (FSP APB 14-1) Adjustment (1) |
$ | 60,991 | $ | 19,446 | $ | 23,982 | $ | 104,419 | ||||||||||||||||||||
| Unsecured Senior Exchangeable Notes |
$ | 681,744 | $ | 651,728 | $ | 426,018 | $ | 1,759,490 | ||||||||||||||||||||
Equity
(in thousands)
| Shares/Units Outstanding as of 09/30/10 |
Common Stock Equivalents |
Equivalent (3) | ||||||||||
| Common Stock |
140,058 | 140,058 | (4) | $ | 11,641,621 | |||||||
| Common Operating Partnership Units |
21,015 | 21,015 | (5) | $ | 1,746,767 | |||||||
| Series Two Preferred Operating Partnership Units |
1,113 | 1,461 | $ | 121,438 | ||||||||
| Total Equity |
162,534 | $ | 13,509,826 | |||||||||
| Total Consolidated Debt |
$ | 7,444,886 | ||||||||||
| Total Consolidated Market Capitalization |
$ | 20,954,712 | ||||||||||
| BXP’s share of Joint Venture Debt |
$ | 1,558,597 | (6) | |||||||||
| Total Combined Debt (7) |
$ | 9,003,483 | ||||||||||
| Total Combined Market Capitalization (8) |
$ | 22,513,309 | ||||||||||
| (1) | Represents the remaining debt discount which will be amortized over the period during which the exchangeable senior notes are expected to be outstanding (i.e., through the first optional redemption dates or, in the case of the exchangeable senior notes due 2014, the maturity date) as additional non-cash interest expense. |
| (2) | The initial exchange rate is 8.5051 shares per $1,000 principal amount of the notes (or an initial exchange price of approximately $117.58 per share of Boston Properties, Inc.’s common stock). In addition, the Company entered into capped call transactions with affiliates of certain of the initial purchasers, which are intended to reduce the potential dilution upon future exchange of the notes. The capped call transactions are expected to have the effect of increasing the effective exchange price to the Company of the notes from $117.58 to approximately $137.17 per share (subject to adjustments), representing an overall effective premium of approximately 40% over the closing price on August 13, 2008 of $97.98 per share of Boston Properties, Inc.’s common stock. The net cost of the capped call transactions was approximately $44.4 million. As of September 30, 2010, the exchange price was $136.13 per share. |
| (3) | Value based on September 30, 2010 closing price of $83.12 per share of common stock. |
| (4) | Includes 117 shares of restricted stock. |
| (5) | Includes 1,520 long-term incentive plan units, but excludes 1,081 unvested outperformance plan units. |
| (6) | Excludes the Company’s share ($270,000) of the aggregate of $450,000 of loans made to the joint venture that owns the General Motors Building by its partners. |
| (7) | For disclosures relating to our definition of Total Combined Debt, see page 49. |
| (8) | For disclosures relating to our definition of Total Combined Market Capitalization, see page 49. |
12
Boston Properties, Inc.
Third Quarter 2010
DEBT ANALYSIS (1)
Debt Maturities and Principal Payments
as of September 30, 2010
(in thousands)
| 2010 | 2011 | 2012 | 2013 | 2014 | Thereafter | Total | ||||||||||||||||||||||
| Floating Rate Debt |
||||||||||||||||||||||||||||
| Mortgage Notes Payable |
$ | 247,715 | $ | 97,169 | $ | 267,845 | $ | 827 | $ | 48,828 | $ | — | $ | 662,384 | ||||||||||||||
| Unsecured Line of Credit |
— | — | — | — | — | — | — | |||||||||||||||||||||
| Total Floating Debt |
$ | 247,715 | $ | 97,169 | $ | 267,845 | $ | 827 | $ | 48,828 | $ | — | $ | 662,384 | ||||||||||||||
| Fixed Rate Debt |
||||||||||||||||||||||||||||
| Mortgage Notes Payable |
$ | 5,184 | $ | 549,209 | $ | 105,059 | $ | 100,436 | $ | 76,409 | $ | 1,308,557 | $ | 2,144,854 | ||||||||||||||
| Fair Value Adjustment |
1,007 | 2,605 | 1,582 | 632 | 137 | 137 | 6,100 | |||||||||||||||||||||
| Mortgage Notes Payable |
6,191 | 551,814 | 106,641 | 101,068 | 76,546 | 1,308,694 | 2,150,954 | |||||||||||||||||||||
| Unsecured Exchangeable Senior Notes, net of discount (2) |
— | — | 671,174 | 450,000 | 742,735 | — | 1,863,909 | |||||||||||||||||||||
| ASC 470-20 (formerly known as FSP APB 14-1) Adjustment |
(9,605 | ) | (39,997 | ) | (29,327 | ) | (23,052 | ) | (2,438 | ) | — | (104,419 | ) | |||||||||||||||
| Unsecured Exchangeable Senior Notes |
(9,605 | ) | (39,997 | ) | 641,847 | 426,948 | 740,297 | — | 1,759,490 | |||||||||||||||||||
| Unsecured Senior Notes, net of discount |
— | — | — | 924,163 | — | 1,947,895 | 2,872,058 | |||||||||||||||||||||
| Total Fixed Debt |
$ | (3,414 | ) | $ | 511,817 | $ | 748,488 | $ | 1,452,179 | $ | 816,843 | $ | 3,256,589 | $ | 6,782,502 | |||||||||||||
| Total Consolidated Debt |
$ | 244,301 | $ | 608,986 | $ | 1,016,333 | $ | 1,453,006 | $ | 865,671 | $ | 3,256,589 | $ | 7,444,886 | ||||||||||||||
| GAAP Weighted Average Floating Rate Debt |
1.73 | % | 1.68 | % | 0.64 | % | 3.43 | % | 3.43 | % | 0.00 | % | 1.41 | % | ||||||||||||||
| GAAP Weighted Average Fixed Rate Debt |
6.37 | % | 7.02 | % | 5.64 | % | 6.22 | % | 6.48 | % | 5.83 | % | 6.06 | % | ||||||||||||||
| Total GAAP Weighted Average Rate |
1.85 | % | 6.22 | % | 4.33 | % | 6.22 | % | 6.29 | % | 5.83 | % | 5.65 | % | ||||||||||||||
| Total Stated Weighted Average Rate |
1.65 | % | 6.35 | % | 3.08 | % | 5.60 | % | 3.96 | % | 5.77 | % | 5.08 | % | ||||||||||||||
Unsecured Debt
Unsecured Line of Credit - Matures August 3, 2011
(in thousands)
| Facility | Outstanding at 09/30/10 |
Letters of Credit |
Remaining Capacity at 09/30/10 |
|||||||||||||||||
| $ | 1,000,000 | $ | — | $ | 14,103 | $ | 985,897 | |||||||||||||
| Unsecured and Secured Debt Analysis |
||||||||||||||||||||
| % of Total Debt | Stated Weighted Average Rate |
GAAP Weighted Average Rate |
Weighted Average Maturity |
|||||||||||||||||
| Unsecured Debt |
62.21 | % | 5.03 | % | 5.99 | % | 4.8 | years | ||||||||||||
| Secured Debt |
37.79 | % | 5.17 | % | 5.09 | % | 3.8 | years | ||||||||||||
| Total Consolidated Debt |
100.00 | % | 5.08 | % | 5.65 | % | 4.4 | years | ||||||||||||
| Floating and Fixed Rate Debt Analysis |
| |||||||||||||||||||
| % of Total Debt | Stated Weighted Average Rate |
GAAP Weighted Average Rate |
Weighted Average Maturity |
|||||||||||||||||
| Floating Rate Debt |
8.90 | % | 1.23 | % | 1.41 | % | 1.0 | years | ||||||||||||
| Fixed Rate Debt |
91.10 | % | 5.46 | % | 6.06 | % | 4.8 | years | ||||||||||||
| Total Consolidated Debt |
100.00 | % | 5.08 | % | 5.65 | % | 4.4 | years | ||||||||||||
| (1) | Excludes unconsolidated joint ventures. |
| (2) | For our unsecured exchangeable notes, amounts are included in the year in which the first optional redemption date occurs (or, in the case of the exchangeable notes due 2014, the year of maturity). |
13
Boston Properties, Inc.
Third Quarter 2010
DEBT MATURITIES AND PRINCIPAL PAYMENTS (1)
as of September 30, 2010
(in thousands)
| Property |
2010 | 2011 | 2012 | 2013 | 2014 | Thereafter | Total | |||||||||||||||||||||
| 599 Lexington Avenue |
$ | — | $ | — | $ | — | $ | — | $ | — | $ | 750,000 | $ | 750,000 | ||||||||||||||
| 601 Lexington Avenue |
2,442 | 456,633 | — | — | — | — | 459,075 | (2) | ||||||||||||||||||||
| Embarcadero Center Four |
— | 4,520 | 4,803 | 5,105 | 5,425 | 355,147 | 375,000 | |||||||||||||||||||||
| 510 Madison Avenue |
267,500 | 267,500 | (3) | |||||||||||||||||||||||||
| South of Market |
187,957 | — | — | — | — | — | 187,957 | (4) | ||||||||||||||||||||
| 505 9th Street |
497 | 2,057 | 2,177 | 2,306 | 2,441 | 118,919 | 128,397 | |||||||||||||||||||||
| Wisconsin Place Office |
— | 97,169 | — | — | — | — | 97,169 | (5) | ||||||||||||||||||||
| One Freedom Square |
361 | 1,521 | 65,511 | — | — | — | 67,393 | (2) | ||||||||||||||||||||
| New Dominion Technology Park, Building Two |
— | — | — | — | 63,000 | — | 63,000 | |||||||||||||||||||||
| Democracy Tower |
59,758 | — | — | — | — | — | 59,758 | (6) | ||||||||||||||||||||
| 140 Kendrick Street |
254 | 1,061 | 1,143 | 47,889 | — | — | 50,347 | (2) | ||||||||||||||||||||
| Reservoir Place |
— | — | 345 | 827 | 48,828 | — | 50,000 | |||||||||||||||||||||
| New Dominion Technology Park, Building One |
— | 1,846 | 1,987 | 2,140 | 2,304 | 40,975 | 49,252 | |||||||||||||||||||||
| 1330 Connecticut Avenue |
358 | 44,796 | — | — | — | — | 45,154 | (2) | ||||||||||||||||||||
| Kingstowne Two and Retail |
370 | 1,535 | 1,630 | 1,730 | 1,837 | 31,227 | 38,329 | (2) | ||||||||||||||||||||
| 10 & 20 Burlington Mall Rd & 91 Hartwell |
273 | 32,618 | — | — | — | — | 32,891 | |||||||||||||||||||||
| Montvale Center |
— | — | 25,000 | — | — | — | 25,000 | |||||||||||||||||||||
| Sumner Square |
207 | 865 | 930 | 22,896 | — | — | 24,898 | |||||||||||||||||||||
| Kingstowne One |
149 | 618 | 657 | 17,062 | — | — | 18,486 | (2) | ||||||||||||||||||||
| University Place |
273 | 1,139 | 1,221 | 1,308 | 1,402 | 12,289 | 17,632 | |||||||||||||||||||||
| Atlantic Wharf |
— | — | — | — | — | — | — | (7) | ||||||||||||||||||||
| 252,899 | 646,378 | 372,904 | 101,263 | 125,237 | 1,308,557 | 2,807,238 | ||||||||||||||||||||||
| Aggregate Fair Value Adjustments |
1,007 | 2,605 | 1,582 | 632 | 137 | 137 | 6,100 | |||||||||||||||||||||
| 253,906 | 648,983 | 374,486 | 101,895 | 125,374 | 1,308,694 | 2,813,338 | ||||||||||||||||||||||
| Unsecured Exchangeable Senior Notes, net of discount |
— | — | 671,174 | 450,000 | 742,735 | — | 1,863,909 | (8) | ||||||||||||||||||||
| ASC 470-20 (formerly known as FSP APB 14-1) Adjustment |
(9,605 | ) | (39,997 | ) | (29,327 | ) | (23,052 | ) | (2,438 | ) | — | (104,419 | ) | |||||||||||||||
| (9,605 | ) | (39,997 | ) | 641,847 | 426,948 | 740,297 | — | 1,759,490 | ||||||||||||||||||||
| Unsecured Senior Notes, net of discount |
— | — | — | 924,163 | — | 1,947,895 | 2,872,058 | |||||||||||||||||||||
| Unsecured Line of Credit |
— | — | — | — | — | — | — | (9) | ||||||||||||||||||||
| $ | 244,301 | $ | 608,986 | $ | 1,016,333 | $ | 1,453,006 | $ | 865,671 | $ | 3,256,589 | $ | 7,444,886 | |||||||||||||||
| % of Total Consolidated Debt |
3.28 | % | 8.18 | % | 13.65 | % | 19.52 | % | 11.63 | % | 43.74 | % | 100.00 | % | ||||||||||||||
| Balloon Payments |
$ | 247,715 | $ | 625,866 | $ | 1,028,380 | $ | 1,460,415 | $ | 854,081 | $ | 3,205,050 | $ | 7,421,507 | ||||||||||||||
| Scheduled Amortization |
$ | 6,191 | $ | 23,117 | $ | 17,280 | $ | 15,643 | $ | 14,028 | $ | 51,539 | $ | 127,798 | ||||||||||||||
| (1) | Excludes unconsolidated joint ventures. For information on our unconsolidated joint venture debt, see page 16. |
| (2) | This property has a fair value adjustment which is aggregated below. |
| (3) | The mortgage is fully secured by cash deposits. |
| (4) | Loan was scheduled to mature on November 21, 2010. On October 20, 2010, the Company used available cash to repay this loan. |
| (5) | Loan matures on January 29, 2011 and has two, one-year extension options subject to certain conditions. |
| (6) | Loan was scheduled to mature on December 19, 2010. On October 20, 2010, the Company used available cash to repay this loan. |
| (7) | As of September 30, 2010, the Company has not drawn any amounts under its $215.0 million construction loan facility. Loan matures on April 21, 2012 and has two, one-year extension options subject to certain conditions. On October 1, 2010, the Company released from collateral the residential portion of the project and reduced the loan commitment from $215.0 million to $192.5 million. |
| (8) | For our unsecured exchangeable senior notes, amounts are included in the year in which the first optional redemption date occurs (or, in the case of the unsecured exchangeable senior notes due 2014, the year of maturity). |
| (9) | The Unsecured Line of Credit matures on August 3, 2011. |
14
Boston Properties, Inc.
Third Quarter 2010
Senior Unsecured Debt Covenant Compliance Ratios
(in thousands)
In the fourth quarter of 2002, the Company’s operating partnership (Boston Properties Limited Partnership) received investment grade ratings on its senior unsecured debt securities and thereafter issued unsecured notes. The notes were issued under an indenture, dated as of December 13, 2002, by and between Boston Properties Limited Partnership and The Bank of New York, as trustee, as supplemented, which, among other things, requires us to comply with the following limitations on incurrence of debt: Limitation on Outstanding Debt; Limitation on Secured Debt; Ratio of Annualized Consolidated EBITDA to Annualized Interest Expense; and Maintenance of Unencumbered Assets. Compliance with these restrictive covenants requires us to apply specialized terms the meanings of which are described in detail in our filings with the SEC, and to calculate ratios in the manner prescribed by the indenture.
This section presents such ratios as of September 30, 2010 to show that the Company’s Operating Partnership was in compliance with the terms of the indenture, as amended, which has been filed with the SEC. This section also presents certain other indenture-related data which we believe assists investors in the Company’s unsecured debt securities. Management is not presenting these ratios and the related calculations for any other purpose or for any other period, and is not intending for these measures to otherwise provide information to investors about the Company’s financial condition or results of operations. Investors should not rely on these measures other than for purposes of testing our compliance with the indenture.
| Senior Notes Issued Prior to October 9, 2009 |
Senior Notes Issued On or After October 9, 2009 |
|||||||||||
| September 30, 2010 | ||||||||||||
| Total Assets: |
||||||||||||
| Capitalized Property Value (1) |
$ | 15,670,286 | $ | 16,066,457 | ||||||||
| Cash and Cash Equivalents (2) |
1,270,074 | 1,270,074 | ||||||||||
| Investments in Marketable Securities |
7,911 | 7,911 | ||||||||||
| Undeveloped Land, at Cost |
754,120 | 754,120 | ||||||||||
| Development in Process, at Cost (including Joint Venture %) |
|
1,015,363 | 1,015,363 | |||||||||
| Total Assets |
$ | 18,717,754 | $ | 19,113,925 | ||||||||
| Unencumbered Assets |
$ | 11,177,188 | $ | 11,410,032 | ||||||||
| Secured Debt (Fixed and Variable) (2) (3) |
$ | 2,539,738 | $ | 2,539,738 | ||||||||
| Joint Venture Debt |
1,558,597 | 1,558,597 | ||||||||||
| Contingent Liabilities & Letters of Credit |
16,535 | 16,535 | ||||||||||
| Unsecured Debt (4) |
4,748,694 | 4,748,694 | ||||||||||
| Total Outstanding Debt |
$ | 8,863,564 | $ | 8,863,564 | ||||||||
| Consolidated EBITDA: |
||||||||||||
| Income before income from unconsolidated joint ventures, gains on sales of real estate and income attributable to noncontrolling interests (per Consolidated Income Statement) |
|
$ | 56,524 | $ | 56,524 | |||||||
| Add: Interest Expense (per Consolidated Income Statement) |
|
97,103 | 97,103 | |||||||||
| Add: Depreciation and Amortization (per Consolidated Income Statement) |
|
81,133 | 81,133 | |||||||||
| Add: Losses (Gains) from Investments in Securities (per Consolidated Income Statement) |
|
(731 | ) | (731 | ) | |||||||
| EBITDA |
234,029 | 234,029 | ||||||||||
| Add: Company share of unconsolidated joint venture EBITDA |
|
60,109 | 60,109 | |||||||||
| Consolidated EBITDA |
$ | 294,138 | $ | 294,138 | ||||||||
| Adjusted Interest Expense: |
||||||||||||
| Interest Expense (per Consolidated Income Statement) |
|
$ | 97,103 | $ | 97,103 | |||||||
| Add: Company share of unconsolidated joint venture interest expense |
|
24,433 | 24,433 | |||||||||
| Less: Amortization of financing costs |
|
(2,146 | ) | (2,146 | ) | |||||||
| Less: Interest expense funded by construction loan draws |
|
— | — | |||||||||
| Adjusted Interest Expense |
$ | 119,390 | $ | 119,390 | ||||||||
| Test | Actual | Actual | ||||||||||
| Covenant Ratios and Related Data |
||||||||||||
| Total Outstanding Debt/Total Assets |
Less than 60% | 47.4 | % | 46.4 | % | |||||||
| Secured Debt/Total Assets |
Less than 50% | 21.9 | % | 21.4 | % | |||||||
| Interest Coverage (Annualized Consolidated EBITDA to Annualized Interest Expense) |
Greater than 1.50x | 2.46 | 2.46 | |||||||||
| Unencumbered Assets/ Unsecured Debt |
Greater than 150% | 235.4 | % | 240.3 | % | |||||||
| Unencumbered Consolidated EBITDA |
$ | 168,112 | $ | 168,112 | ||||||||
| Unencumbered Interest Coverage (Unencumbered Consolidated EBITDA to Unsecured Interest Expense) |
2.44 | 2.44 | ||||||||||
| % of Unencumbered Consolidated EBITDA to Consolidated EBITDA |
57.2 | % | 57.2 | % | ||||||||
| # of unencumbered properties |
105 | 105 | ||||||||||
| (1) | For senior notes issued prior to October 9, 2009, Capitalized Property Value is determined for each property and is the greater of (A) annualized EBITDA capitalized at an 8.5% rate for CBD properties and a 9.0% rate for non-CBD properties, and (B) the undepreciated book value as determined under GAAP. Capitalized Property Value for the senior notes issued on or after October 9, 2009 will be determined for each property and is the greater of (A) annualized EBITDA capitalized at an 8.0% rate for CBD properties and a 9.0% rate for non-CBD properties, and (B) the undepreciated book value as determined under GAAP. |
| (2) | Based on the Company’s covenant definitions, the debt and restricted cash associated with 510 Madison Avenue, which is fully secured by cash deposits, has been excluded. |
| (3) | Excludes fair value adjustment of $6,100. |
| (4) | Excludes debt discount of $12,727 and ASC 470-20 (formerly known as FSP APB 14-1) adjustment of $104,419. |
15
Boston Properties, Inc.
Third Quarter 2010
UNCONSOLIDATED JOINT VENTURE DEBT ANALYSIS (*)
Debt Maturities and Principal Payments by Property
(in thousands)
| Property |
2010 | 2011 | 2012 | 2013 | 2014 | Thereafter | Total | |||||||||||||||||||||
| General Motors Building (60%) |
$ | — | $ | — | $ | — | $ | — | $ | — | $ | 963,600 | $ | 963,600 | (1)(2) | |||||||||||||
| 125 West 55th Street (60%) |
376 | 1,562 | 1,659 | 1,763 | 1,874 | 116,352 | 123,586 | |||||||||||||||||||||
| Two Grand Central Tower (60%) |
332 | 1,380 | 1,465 | 1,556 | 1,652 | 101,072 | 107,457 | |||||||||||||||||||||
| Metropolitan Square (51%) |
— | — | — | 662 | 1,187 | 87,401 | 89,250 | |||||||||||||||||||||
| 540 Madison Avenue (60%) |
60 | 240 | 240 | 70,920 | — | — | 71,460 | (3) | ||||||||||||||||||||
| Market Square North (50%) |
— | — | — | 161 | 993 | 63,846 | 65,000 | (4) | ||||||||||||||||||||
| 901 New York Avenue (25%) |
171 | 705 | 742 | 782 | 823 | 37,590 | 40,813 | |||||||||||||||||||||
| Annapolis Junction (50%) |
— | 21,349 | — | — | — | — | 21,349 | (5) | ||||||||||||||||||||
| 500 North Capitol (30%) |
— | — | — | 6,600 | — | — | 6,600 | |||||||||||||||||||||
| Wisconsin Place Retail (5%) |
— | 3,227 | — | — | — | — | 3,227 | (5) | ||||||||||||||||||||
| 939 | 28,463 | 4,106 | 82,444 | 6,529 | 1,369,861 | 1,492,342 | ||||||||||||||||||||||
| Aggregate Fair Value Adjustments |
1,584 | 6,620 | 7,102 | 7,186 | 7,087 | 22,317 | 51,895 | |||||||||||||||||||||
| $ | 2,523 | $ | 35,083 | $ | 11,208 | $ | 89,630 | $ | 13,616 | $ | 1,392,178 | $ | 1,544,237 | |||||||||||||||
| GAAP Weighted Average Rate |
6.00 | % | 2.19 | % | 6.00 | % | 6.66 | % | 5.77 | % | 6.39 | % | 6.32 | % | ||||||||||||||
| % of Total Debt |
0.16 | % | 2.27 | % | 0.73 | % | 5.80 | % | 0.88 | % | 90.15 | % | 100.00 | % | ||||||||||||||
Floating and Fixed Rate Debt Analysis
| % of Total Debt | Stated Weighted Average Rate (1) |
GAAP Weighted Average Rate |
Weighted
Average Maturity |
|||||||||||||||
| Floating Rate Debt |
2.09 | % | 2.39 | % | 2.59 | % | 1.2 | years | ||||||||||
| Fixed Rate Debt |
97.91 | % | 5.86 | % | 6.40 | % | 7.0 | years | ||||||||||
| Total Debt |
100.00 | % | 5.79 | % | 6.32 | % | 6.9 | years | ||||||||||
| (*) | All amounts represent the Company’s share. Amounts exclude the Value-Added Fund. See page 18 for additional information on debt pertaining to the Value-Added Fund. |
| (1) | Excludes the Company’s share ($270,000) of the aggregate of $450,000 of loans made to the joint venture by its partners. |
| (2) | This property has a fair value adjustment which is aggregated below. Although these mortgages require interest only payments with a balloon payment at maturity, the fair value adjustment is amortized over the term of the loan. |
| (3) | This property has a fair value adjustment which is aggregated below. |
| (4) | On September 20, 2010, Market Square North’s mortgage loan was refinanced with a new mortgage loan totaling $130,000, bearing interest at a fixed rate of 4.85% per annum and maturing on October 1, 2020. |
| (5) | Loan has a one-year extension option subject to certain conditions. |
16
Boston Properties, Inc.
Third Quarter 2010
UNCONSOLIDATED JOINT VENTURES
Balance Sheet Information
(unaudited and in thousands)
as of September 30, 2010
| General Motors Building |
125 West 55th Street |
Two Grand Central Tower |
540 Madison Avenue |
Market Square North |
Metropolitan Square |
901 New York Avenue |
Wisconsin Place (1) |
Annapolis Junction (2) |
Eighth Avenue and 46th Street (2) |
500 North Capitol |
Subtotal | Value-Added Fund (3)(4) |
Total Unconsolidated Joint Ventures |
|||||||||||||||||||||||||||||||||||||||||||
| Investment (5) |
$ | 676,383 | (6) | $ | 113,831 | $ | 96,002 | $ | 70,246 | $ | 7,638 | $ | 14,556 | $ | (1,333 | ) | $ | 54,187 | $ | 7,795 | $ | 10,398 | $ | 1,963 | $ | 1,051,666 | $ | 10,768 | $ | 1,062,434 | ||||||||||||||||||||||||||
| Note Receivable (6) |
270,000 | — | — | — | — | — | — | — | — | — | — | 270,000 | — | 270,000 | ||||||||||||||||||||||||||||||||||||||||||
| Net Equity (5) |
$ | 406,383 | $ | 113,831 | $ | 96,002 | $ | 70,246 | $ | 7,638 | $ | 14,556 | $ | (1,333 | ) | $ | 54,187 | $ | 7,795 | $ | 10,398 | $ | 1,963 | $ | 781,666 | $ | 10,768 | $ | 792,434 | |||||||||||||||||||||||||||
| Mortgage/Construction loans payable (5) (7) |
$ | 963,600 | $ | 123,586 | $ | 107,457 | $ | 71,460 | $ | 65,000 | $ | 89,250 | $ | 40,813 | $ | 3,227 | $ | 21,349 | $ | — | $ | 6,600 | $ | 1,492,342 | $ | 66,255 | $ | 1,558,597 | ||||||||||||||||||||||||||||
| BXP’s nominal ownership percentage |
60.00 | % | 60.00 | % | 60.00 | % | 60.00 | % | 50.00 | % | 51.00 | % | 25.00 | % | 23.89 | % | 50.00 | % | 50.00 | % | 30.00 | % | 36.92 | % | ||||||||||||||||||||||||||||||||
Results of Operations
(unaudited and in thousands)
for the three months ended September 30, 2010
| General Motors Building |
125 West 55th Street |
Two Grand Central Tower |
540 Madison Avenue |
Market Square North |
Metropolitan Square |
901 New York Avenue |
Wisconsin Place (1) |
Annapolis Junction (2) |
Eighth Avenue and 46th Street (2) |
500 North Capitol |
Subtotal | Value- Added Fund (3) |
Total Unconsolidated Joint Ventures |
|||||||||||||||||||||||||||||||||||||||||||
| REVENUE |
||||||||||||||||||||||||||||||||||||||||||||||||||||||||
| Rental |
$ | 54,389 | $ | 9,992 | $ | 9,898 | $ | 6,969 | $ | 5,518 | $ | 8,010 | $ | 8,341 | $ | 2,205 | $ | 4,232 | $ | — | $ | 1,981 | $ | 111,535 | $ | 4,506 | $ | 116,041 | ||||||||||||||||||||||||||||
| Straight-line rent |
3,496 | 1,302 | (104 | ) | 215 | (171 | ) | 409 | (12 | ) | 955 | 4 | — | — | 6,094 | (181 | ) | 5,913 | ||||||||||||||||||||||||||||||||||||||
| Fair value lease revenue |
27,578 | 622 | 1,428 | 534 | — | — | — | — | — | — | 18 | 30,180 | 298 | 30,478 | ||||||||||||||||||||||||||||||||||||||||||
| Termination Income |
— | — | 2,526 | 165 | — | — | 3 | — | — | — | — | 2,694 | — | 2,694 | ||||||||||||||||||||||||||||||||||||||||||
| Total revenue |
85,463 | 11,916 | 13,748 | 7,883 | 5,347 | 8,419 | 8,332 | 3,160 | 4,236 | — | 1,999 | 150,503 | 4,623 | 155,126 | ||||||||||||||||||||||||||||||||||||||||||
| EXPENSES |
||||||||||||||||||||||||||||||||||||||||||||||||||||||||
| Operating |
20,517 | 3,420 | 4,291 | 2,868 | 2,307 | 3,224 | 3,286 | 1,380 | 1,474 | 40 | 807 | 43,614 | 1,932 | 45,546 | ||||||||||||||||||||||||||||||||||||||||||
| NET OPERATING INCOME |
64,946 | 8,496 | 9,457 | 5,015 | 3,040 | 5,195 | 5,046 | 1,780 | 2,762 | (40 | ) | 1,192 | 106,889 | 2,691 | 109,580 | |||||||||||||||||||||||||||||||||||||||||
| Interest |
26,395 | 3,179 | 2,723 | 1,918 | 1,583 | 2,540 | 2,147 | 420 | 190 | — | 413 | 41,508 | 2,734 | 44,242 | ||||||||||||||||||||||||||||||||||||||||||
| Interest other - partner loans |
14,878 | — | — | — | — | — | — | — | — | — | — | 14,878 | — | 14,878 | ||||||||||||||||||||||||||||||||||||||||||
| Depreciation and amortization |
30,522 | 4,098 | 3,896 | 2,089 | 913 | 1,858 | 1,380 | 1,985 | (189 | ) | — | 1,833 | 48,385 | 2,163 | 50,548 | |||||||||||||||||||||||||||||||||||||||||
| SUBTOTAL |
71,795 | 7,277 | 6,619 | 4,007 | 2,496 | 4,398 | 3,527 | 2,405 | 1 | — | 2,246 | 104,771 | 4,897 | 109,668 | ||||||||||||||||||||||||||||||||||||||||||
| Gains on sale of real estate |
— | — | — | — | — | — | — | — | — | — | — | — | — | — | ||||||||||||||||||||||||||||||||||||||||||
| Guaranty obligation (8) |
— | — | — | — | — | — | — | — | — | — | — | — | 3,581 | 3,581 | ||||||||||||||||||||||||||||||||||||||||||
| Impairment loss |
— | — | — | — | — | — | — | — | — | — | — | — | — | — | ||||||||||||||||||||||||||||||||||||||||||
| Losses from early extinguishment of debt |
— | — | — | — | — | — | — | — | — | — | — | — | — | — | ||||||||||||||||||||||||||||||||||||||||||
| NET INCOME/(LOSS) |
$ | (6,849 | ) | $ | 1,219 | $ | 2,838 | $ | 1,008 | $ | 544 | $ | 797 | $ | 1,519 | $ | (625 | ) | $ | 2,761 | $ | (40 | ) | $ | (1,054 | ) | $ | 2,118 | $ | (5,787 | ) | $ | (3,669 | ) | ||||||||||||||||||||||
| BXP’s share of net income/(loss) |
$ | (4,109 | ) | $ | 731 | $ | 1,703 | $ | 605 | $ | 272 | $ | 406 | $ | 830 | (9) | $ | (370 | ) | $ | 1,381 | $ | (20 | ) | $ | (316 | ) | $ | 1,112 | $ | (1,613 | )(4) | $ | (501 | ) | |||||||||||||||||||||
| Basis differential (10) |
— | $ | 472 | 1,001 | 310 | — | — | — | — | — | — | — | 1,782 | 1,358 | (4) | 3,140 | ||||||||||||||||||||||||||||||||||||||||
| Impairment loss on investment |
— | — | — | — | — | — | — | — | — | — | — | — | — | — | ||||||||||||||||||||||||||||||||||||||||||
| Elimination of inter-entity interest on partner loan |
8,927 | — | — | — | — | — | — | — | — | — | — | 8,927 | — | 8,927 | ||||||||||||||||||||||||||||||||||||||||||
| Income/(loss) from unconsolidated joint ventures |
$ | 4,818 | $ | 1,204 | $ | 2,704 | $ | 914 | $ | 272 | $ | 406 | $ | 830 | $ | (370 | ) | $ | 1,381 | $ | (20 | ) | $ | (316 | ) | $ | 11,820 | $ | (255 | )(4) | $ | 11,565 | ||||||||||||||||||||||||
| BXP’s share of depreciation & amortization |
18,313 | 2,070 | 1,691 | 1,029 | 456 | 948 | 520 | (9) | 489 | (95 | ) | — | 550 | 25,971 | 631 | (4) | 26,602 | |||||||||||||||||||||||||||||||||||||||
| BXP’s share of Funds from Operations (FFO) |
$ | 23,131 | $ | 3,274 | $ | 4,395 | $ | 1,943 | $ | 728 | $ | 1,354 | $ | 1,350 | $ | 119 | $ | 1,286 | $ | (20 | ) | $ | 234 | $ | 37,791 | $ | 376 | (4) | $ | 38,167 | ||||||||||||||||||||||||||
| BXP’s share of net operating income/(loss) |
$ | 38,968 | $ | 5,180 | $ | 6,028 | $ | 3,094 | $ | 1,520 | $ | 2,649 | $ | 1,262 | $ | 142 | $ | 1,381 | $ | (20 | ) | $ | 358 | $ | 60,561 | $ | 1,162 | (4) | $ | 61,723 | ||||||||||||||||||||||||||
| (1) | Represents the Company’s interest in the joint venture entity that owns the land and infrastructure, as well as a nominal interest in the retail component of the project. The entity that owns the office component of the project, of which the Company has a 66.67% interest, has been consolidated within the accounts of the Company. The Company’s 5% ownership interest in the retail component of the project is not included in the Company’s property listing (approximately 5,900 square feet represents our share). |
| (2) | Property is currently not in service (i.e., under construction or undeveloped land). Two of three land parcels of Annapolis Junction are undeveloped land. |
| (3) | For additional information on the Value-Added Fund, see page 18. Information presented includes costs which relate to the organization and operations of the Value-Added Fund. The investments held by the Value-Added Fund are not included in the Company’s portfolio information tables or any other portfolio level statistics and therefore are presented on page 18. |
| (4) | Represents the Company’s 25% interest in 300 Billerica Road and Circle Star, as well as a 39.5% interest in Mountain View Research Park and Mountain View Technology Park. |
| (5) | Represents the Company’s share. |
| (6) | Includes the Company’s share ($270,000) of the aggregate of $450,000 of loans made to the joint venture by its partners. |
| (7) | Excludes fair value adjustments. |
| (8) | On October 20, 2010 the Company’s Value-Added Fund conveyed the fee simple title to its One and Two Circle Star Way properties and paid approximately $3.8 million, of which $3.6 million has been recognized as Guaranty obligation and $0.2 million is included in Net Income/(Loss) during the period, to the lender in satisfaction of its outstanding obligations under the existing mortgage loan. The mortgage loan had an outstanding principal amount of $42.0 million, bore interest at a fixed rate of 6.57% per annum and was scheduled to mature on September 1, 2013. The Value-Added Fund had guaranteed the payment of (1) an aggregate of approximately $5.0 million of unfunded tenant improvements costs and leasing commissions and (2) one year of real estate taxes of approximately $0.8 million. The Company had an effective ownership interest of 25% in the One and Two Circle Star Way properties. |
| (9) | Reflects the changes in the allocation percentages pursuant to the achievement of specified investment return thresholds as provided for in the joint venture agreement. |
| (10) | Represents adjustment related to the impairment of the carrying values of certain of the Company’s investments in unconsolidated joint ventures and certain losses related to the Company’s investment in the Value-Added Fund. |
17
Boston Properties, Inc.
Third Quarter 2010
Boston Properties Office Value-Added Fund, L.P.
On October 25, 2004, the Company formed Boston Properties Office Value-Added Fund, L.P. (the “Value-Added Fund”), a strategic partnership with third parties, to pursue the acquisition of value-added investments in non-core office assets within the Company’s existing markets. The Value-Added Fund had total equity commitments of $140 million. The Company receives asset management, property management, leasing and redevelopment fees and, if certain return thresholds are achieved, will be entitled to an additional promoted interest.
On January 7, 2008, the Company transferred the Mountain View properties to its Value-Added Fund. In connection with the transfer of the Research Park and Technology Park properties to the Value-Added Fund, the Company and its partners agreed to certain modifications to the Value-Added Fund’s original terms, including bifurcating the Value-Added Fund’s promote structure such that Research Park and Technology Park will be accounted for separately from the non-Mountain View properties currently owned by the Value-Added Fund (i.e., Circle Star and 300 Billerica Road). As a result of the modifications, the Company’s interest in the Mountain View properties is approximately 39.5% and its interest in the non-Mountain View properties is 25%. The Company does not expect that the Value-Added Fund will make any future investments in new properties. The investments held by the Value-Added Fund are not included in the Company’s portfolio information tables or any other portfolio level statistics and therefore are presented below.
Property Information
| Property Name |
Number of Buildings |
Square Feet | Leased % | Annual Revenue per leased SF (1) |
Mortgage Notes Payable (2) |
|||||||||||||||
| 300 Billerica Road, Chelmsford, MA |
1 | 110,882 | 100.0 | % | $ | 9.11 | $ | 1,875 | (3) | |||||||||||
| Circle Star, San Carlos, CA |
2 | 206,945 | — | — | 10,500 | (4)(7) | ||||||||||||||
| Mountain View Research Park, Mountain View, CA |
16 | 600,449 | 76.3 | % | 31.45 | 44,243 | (5) | |||||||||||||
| Mountain View Technology Park, Mountain View, CA |
7 | 135,279 | 64.3 | % | 26.80 | 9,638 | (6) | |||||||||||||
| Total |
26 | 1,053,555 | 62.3 | % | $ | 27.06 | $ | 66,255 | ||||||||||||
Results of Operations
(unaudited and in thousands)
for the three months ended September 30, 2010
| Value-Added Fund |
||||
| REVENUE |
||||
| Rental |
$ | 4,506 | ||
| Straight-line rent |
(181 | ) | ||
| Fair value lease revenue |
298 | |||
| Total revenue |
4,623 | |||
| EXPENSES |
||||
| Operating |
1,932 | |||
| SUBTOTAL |
2,691 | |||
| Interest |
2,734 | |||
| Depreciation and amortization |
2,163 | |||
| SUBTOTAL |
4,897 | |||
| Gains on sale of real estate |
— | |||
| Guaranty obligation (7) |
3,581 | |||
| Impairment loss |
— | |||
| Loss from early extinguishment of debt |
— | |||
| NET INCOME |
$ | (5,787 | ) | |
| BXP’s share of net income |
$ | (1,613 | ) | |
| Basis differential (8) |
1,358 | |||
| Impairment loss on investment |
— | |||
| Loss from Value-Added Fund |
$ | (255 | ) | |
| BXP’s share of depreciation & amortization |
631 | |||
| BXP’s share of Funds from Operations (FFO) |
$ | 376 | ||
| The Company’s Equity in the Value-Added Fund |
$ | 10,768 | ||
| (1) | For disclosures relating to our definition of Annualized Revenue, see page 50. |
| (2) | Represents the Company’s share. |
| (3) | The mortgage bears interest at a fixed rate of 5.69% and matures on January 1, 2016. |
| (4) | The mortgage bears interest at a fixed rate of 6.57% and matures on September 1, 2013. |
| (5) | The mortgage bears interest at a variable rate of LIBOR plus 1.75% and matures on May 31, 2011, with two, one-year extension options. The Value-Added Fund has entered into three (3) interest rate swap contracts to fix the one-month LIBOR index rate at 3.63% per annum on an aggregate notional amount of $103 million. The swap contracts went into effect on June 2, 2008 and expire on April 1, 2011. |
| (6) | The mortgage bears interest at a variable rate of LIBOR plus 1.50% and matures on March 31, 2011, with two, one-year extension options. The Value-Added Fund has entered into an interest rate swap contract to fix the one-month LIBOR index rate at 4.085% per annum on a notional amount of $24 million. The swap contract went into effect on June 12, 2008 and expires on March 31, 2011. |
| (7) | On October 20, 2010 the Company’s Value-Added Fund conveyed the fee simple title to its One and Two Circle Star Way properties and paid approximately $3.8 million, of which $3.6 million has been recognized as Guaranty obligation and $0.2 million is included in Net Income/(Loss) during the period, to the lender in satisfaction of its outstanding obligations under the existing mortgage loan. The mortgage loan had an outstanding principal amount of $42.0 million, bore interest at a fixed rate of 6.57% per annum and was scheduled to mature on September 1, 2013. The Value-Added Fund had guaranteed the payment of (1) an aggregate of approximately $5.0 million of unfunded tenant improvements costs and leasing commissions and (2) one year of real estate taxes of approximately $0.8 million. The Company had an effective ownership interest of 25% in the One and Two Circle Star Way properties. |
| (8) | Represents adjustment related to the impairment of the carrying values and certain losses related to the Company’s investment in the Value-Added Fund. |
18
Boston Properties, Inc.
Third Quarter 2010
PORTFOLIO OVERVIEW
Rentable Square Footage and Percentage of Portfolio Net Operating Income of In-Service Properties by Location and Type of Property
for the Quarter Ended September 30, 2010 (1) (2) (3)
| Geographic Area |
Square Feet Office (3) |
% of NOI Office (4) |
Square Feet Office/ Technical |
% of NOI Office/ Technical (4) |
Square Feet Total (3) |
Square Feet % of Total |
% of NOI Hotel (4) |
% of NOI Total (4) |
||||||||||||||||||||||||
| Greater Boston |
8,538,331 | 19.3 | % | 834,062 | 1.7 | % | 9,372,393 | 26.1 | % | 0.6 | % | 21.6 | % | |||||||||||||||||||
| Greater Washington |
9,365,778 | (5) | 21.9 | % | 756,325 | 1.0 | % | 10,122,103 | (5) | 28.2 | % | — | 22.9 | % | ||||||||||||||||||
| Greater San Francisco |
4,980,929 | 11.1 | % | — | — | 4,980,929 | 13.9 | % | — | 11.1 | % | |||||||||||||||||||||
| Midtown Manhattan |
8,933,931 | (6) | 41.8 | % | — | — | 8,933,931 | (6) | 24.9 | % | — | 41.8 | % | |||||||||||||||||||
| Princeton/East Brunswick, NJ |
2,452,529 | 2.6 | % | — | — | 2,452,529 | 6.8 | % | — | 2.6 | % | |||||||||||||||||||||
| 34,271,498 | 96.7 | % | 1,590,387 | 2.7 | % | 35,861,885 | 100.0 | % | 0.6 | % | 100.0 | % | ||||||||||||||||||||
| % of Total |
95.6 | % | 4.4 | % | 100.0 | % | ||||||||||||||||||||||||||
Percentage of Portfolio Net Operating Income of In-Service Properties
by Location and Type of Property (2) (4)
| Geographic Area |
CBD | Suburban | Total | |||||||||
| Greater Boston |
15.5 | % | 6.1 | % | 21.6 | % | ||||||
| Greater Washington |
8.7 | % | 14.2 | % | 22.9 | % | ||||||
| Greater San Francisco |
8.9 | % | 2.2 | % | 11.1 | % | ||||||
| Midtown Manhattan |
41.8 | % | — | 41.8 | % | |||||||
| Princeton/East Brunswick, NJ |
— | 2.6 | % | 2.6 | % | |||||||
| Total |
74.9 | % | 25.1 | % | 100.0 | % | ||||||
Hotel Properties
| Hotel Properties |
Number of Rooms |
Square Feet |
||||||
| Cambridge Center Marriott, Cambridge, MA |
433 | 330,400 | ||||||
| Total Hotel Properties |
433 | 330,400 | ||||||
Structured Parking
| Number of Spaces |
Square Feet |
|||||||
| Total Structured Parking |
38,651 | 12,844,106 | ||||||
| (1) | For disclosures relating to our definition of In-Service Properties, see page 50. |
| (2) | Portfolio Net Operating Income is a non-GAAP financial measure. For a quantitative reconciliation of Portfolio NOI to net income available to common shareholders, see page 42. For disclosures relating to our use of Portfolio NOI see page 50. |
| (3) | Includes approximately 1,700,000 square feet of retail space. |
| (4) | The calculation for percentage of Portfolio Net Operating Income excludes termination income. |
| (5) | Includes 586,950 square feet at Metropolitan Square which is 51% owned by Boston Properties, 401,324 square feet at Market Square North which is 50% owned by Boston Properties, 539,229 square feet at 901 New York Avenue which is 25% owned by Boston Properties, 321,943 square feet at 505 9th Street, N.W. which is 50% owned by Boston Properties, 117,599 square feet at Annapolis Junction which is 50% owned by Boston Properties, 299,136 square feet at Wisconsin Place which is 66.67% owned by Boston Properties and 175,698 square feet at 500 North Capitol which is 30% owned by Boston Properties. |
| (6) | Includes 1,800,321 square feet at the General Motors Building, 581,267 square feet at 125 West 55th Street, 639,269 square feet at Two Grand Central Tower and 288,580 square feet at 540 Madison Avenue, each of which is 60% owned by Boston Properties. |
19
Boston Properties, Inc.
Third Quarter 2010
In-Service Property Listing
as of September 30, 2010
| Sub Market |
Number of Buildings |
Square Feet |
Leased % | Annualized Revenue Per Leased SF (1) |
Encumbered with secured debt (Y/N) |
Central Business District (CBD) or Suburban (S) |
||||||||||||||||||||
| Greater Boston |
||||||||||||||||||||||||||
| Office |
||||||||||||||||||||||||||
| 800 Boylston Street - The Prudential Center |
CBD Boston MA |
1 | 1,226,029 | 90.4 | % | $ | 47.89 | N | CBD | |||||||||||||||||
| 111 Huntington Avenue - The Prudential Center |
CBD Boston MA |
1 | 859,641 | 94.2 | % | 61.76 | N | CBD | ||||||||||||||||||
| 101 Huntington Avenue - The Prudential Center |
CBD Boston MA |
1 | 505,939 | 100.0 | % | 41.16 | N | CBD | ||||||||||||||||||
| The Shops at the Prudential Center |
CBD Boston MA |
1 | 510,405 | 99.0 | % | 69.97 | N | CBD | ||||||||||||||||||
| Shaws Supermarket at the Prudential Center |
CBD Boston MA |
1 | 57,235 | 100.0 | % | 49.44 | N | CBD | ||||||||||||||||||
| One Cambridge Center |
East Cambridge MA |
1 | 215,573 | 90.4 | % | 41.39 | N | CBD | ||||||||||||||||||
| Three Cambridge Center |
East Cambridge MA |
1 | 108,152 | 43.0 | % | 21.91 | N | CBD | ||||||||||||||||||
| Four Cambridge Center |
East Cambridge MA |
1 | 199,131 | 58.6 | % | 42.93 | N | CBD | ||||||||||||||||||
| Five Cambridge Center |
East Cambridge MA |
1 | 240,480 | 100.0 | % | 45.98 | N | CBD | ||||||||||||||||||
| Eight Cambridge Center |
East Cambridge MA |
1 | 177,226 | 100.0 | % | 40.92 | N | CBD | ||||||||||||||||||
| Ten Cambridge Center |
East Cambridge MA |
1 | 152,664 | 100.0 | % | 40.56 | N | CBD | ||||||||||||||||||
| Eleven Cambridge Center |
East Cambridge MA |
1 | 79,616 | 100.0 | % | 48.59 | N | CBD | ||||||||||||||||||
| University Place |
Mid-Cambridge MA |
1 | 195,282 | 100.0 | % | 39.79 | Y | CBD | ||||||||||||||||||
| Reservoir Place |
Route 128 Mass Turnpike MA |
1 | 526,080 | 79.2 | % | 32.76 | Y | S | ||||||||||||||||||
| Reservoir Place North |
Route 128 Mass Turnpike MA |
1 | 73,258 | 100.0 | % | 29.15 | N | S | ||||||||||||||||||
| 140 Kendrick Street |
Route 128 Mass Turnpike MA |
3 | 380,987 | 100.0 | % | 31.54 | Y | S | ||||||||||||||||||
| 230 CityPoint |
Route 128 Mass Turnpike MA |
1 | 299,944 | 98.5 | % | 35.64 | N | S | ||||||||||||||||||
| 77 CityPoint |
Route 128 Mass Turnpike MA |
1 | 209,707 | 100.0 | % | 42.81 | N | S | ||||||||||||||||||
| (2) Waltham Office Center |
Route 128 Mass Turnpike MA |
1 | 67,005 | 38.3 | % | 16.47 | N | S | ||||||||||||||||||
| 195 West Street |
Route 128 Mass Turnpike MA |
1 | 63,500 | 100.0 | % | 37.99 | N | S | ||||||||||||||||||
| 200 West Street |
Route 128 Mass Turnpike MA |
1 | 255,430 | 32.4 | % | 31.99 | N | S | ||||||||||||||||||
| (3) Weston Corporate Center |
Route 128 Mass Turnpike MA |
1 | 356,367 | 100.0 | % | 40.92 | N | S | ||||||||||||||||||
| Waltham Weston Corporate Center |
Route 128 Mass Turnpike MA |
1 | 306,789 | 76.3 | % | 36.87 | N | S | ||||||||||||||||||
| 10 & 20 Burlington Mall Road |
Route 128 Northwest MA |
2 | 153,081 | 87.4 | % | 24.97 | Y | S | ||||||||||||||||||
| Bedford Business Park |
Route 128 Northwest MA |
1 | 92,207 | 100.0 | % | 28.06 | N | S | ||||||||||||||||||
| 32 Hartwell Avenue |
Route 128 Northwest MA |
1 | 69,154 | 100.0 | % | 25.49 | N | S | ||||||||||||||||||
| 91 Hartwell Avenue |
Route 128 Northwest MA |
1 | 121,425 | 47.0 | % | 28.67 | Y | S | ||||||||||||||||||
| 92 Hayden Avenue |
Route 128 Northwest MA |
1 | 31,100 | 100.0 | % | 34.94 | N | S | ||||||||||||||||||
| 100 Hayden Avenue |
Route 128 Northwest MA |
1 | 55,924 | 100.0 | % | 34.22 | N | S | ||||||||||||||||||
| 33 Hayden Avenue |
Route 128 Northwest MA |
1 | 80,128 | 100.0 | % | 32.84 | N | S | ||||||||||||||||||
| Lexington Office Park |
Route 128 Northwest MA |
2 | 166,745 | 75.1 | % | 26.91 | N | S | ||||||||||||||||||
| 191 Spring Street |
Route 128 Northwest MA |
1 | 158,900 | 100.0 | % | 31.35 | N | S | ||||||||||||||||||
| 181 Spring Street |
Route 128 Northwest MA |
1 | 55,793 | 50.2 | % | 32.54 | N | S | ||||||||||||||||||
| 201 Spring Street |
Route 128 Northwest MA |
1 | 106,300 | 100.0 | % | 32.79 | N | S | ||||||||||||||||||
| 40 Shattuck Road |
Route 128 Northwest MA |
1 | 121,216 | 75.9 | % | 21.30 | N | S | ||||||||||||||||||
| Quorum Office Park |
Route 128 Northwest MA |
2 | 259,918 | 100.0 | % | 24.33 | N | S | ||||||||||||||||||
| 41 | 8,538,331 | 89.2 | % | $ | 42.51 | |||||||||||||||||||||
| Office/Technical |
||||||||||||||||||||||||||
| Seven Cambridge Center |
East Cambridge MA |
1 | 231,028 | 100.0 | % | $ | 83.83 | N | CBD | |||||||||||||||||
| Fourteen Cambridge Center |
East Cambridge MA |
1 | 67,362 | 100.0 | % | 24.72 | N | CBD | ||||||||||||||||||
| (2) 103 Fourth Avenue |
Route 128 Mass Turnpike MA |
1 | 62,476 | 58.5 | % | 24.29 | N | S | ||||||||||||||||||
| Bedford Business Park |
Route 128 Northwest MA |
2 | 379,056 | 62.7 | % | 20.49 | N | S | ||||||||||||||||||
| 17 Hartwell Avenue |
Route 128 Northwest MA |
1 | 30,000 | 100.0 | % | 15.25 | N | S | ||||||||||||||||||
| 164 Lexington Road |
Route 128 Northwest MA |
1 | 64,140 | 0.0 | % | — | N | S | ||||||||||||||||||
| 7 | 834,062 | 72.3 | % | $ | 45.21 | |||||||||||||||||||||
| Total Greater Boston: | 48 | 9,372,393 | 87.7 | % | $ | 42.71 | ||||||||||||||||||||
| (1) | For disclosures relating to our definition of Annualized Revenue, see page 50. |
| (2) | Property held for redevelopment. |
| (3) | Not included in Same Property analysis. |
20
Boston Properties, Inc.
Third Quarter 2010
In-Service Property Listing (continued)
as of September 30, 2010
| Sub Market |
Number of Buildings |
Square Feet |
Leased % | Annualized Revenue Per Leased SF (1) |
Encumbered with secured debt (Y/N) |
Central Business District (CBD) or Suburban (S) |
||||||||||||||||||||
| Greater Washington, DC |
||||||||||||||||||||||||||
| Office |
||||||||||||||||||||||||||
| Capital Gallery |
Southwest Washington DC |
1 | 621,009 | 100.0 | % | $ | 48.35 | N | CBD | |||||||||||||||||
| 500 E Street, S. W. |
Southwest Washington DC |
1 | 248,336 | 100.0 | % | 44.46 | N | CBD | ||||||||||||||||||
| Metropolitan Square (51% ownership) |
East End Washington DC |
1 | 586,950 | 99.6 | % | 52.16 | Y | CBD | ||||||||||||||||||
| 1301 New York Avenue |
East End Washington DC |
1 | 188,357 | 100.0 | % | 46.14 | N | CBD | ||||||||||||||||||
| Market Square North (50% ownership) |
East End Washington DC |
1 | 401,324 | 90.9 | % | 57.52 | Y | CBD | ||||||||||||||||||
| (2)(3) 500 North Capitol (30% ownership) |
CBD Washington DC |
1 | 175,698 | 100.0 | % | 43.03 | Y | CBD | ||||||||||||||||||
| 505 9th Street, N.W. (50% ownership) |
CBD Washington DC |
1 | 321,943 | 96.0 | % | 62.48 | Y | CBD | ||||||||||||||||||
| 901 New York Avenue (25% ownership) |
CBD Washington DC |
1 | 539,229 | 99.8 | % | 60.29 | Y | CBD | ||||||||||||||||||
| 1333 New Hampshire Avenue |
CBD Washington DC |
1 | 315,371 | 100.0 | % | 48.93 | N | CBD | ||||||||||||||||||
| 1330 Connecticut Avenue |
CBD Washington DC |
1 | 252,136 | 98.3 | % | 57.06 | Y | CBD | ||||||||||||||||||
| (3) 635 Massachusetts Avenue |
CBD Washington DC |
1 | 211,000 | 100.0 | % | 28.31 | N | CBD | ||||||||||||||||||
| Sumner Square |
CBD Washington DC |
1 | 208,665 | 96.8 | % | 44.03 | Y | CBD | ||||||||||||||||||
| Annapolis Junction (50% ownership) |
Arundel County, MD |
1 | 117,599 | 100.0 | % | 141.06 | Y | S | ||||||||||||||||||
| Montvale Center |
Montgomery County MD |
1 | 123,392 | 81.7 | % | 26.60 | Y | S | ||||||||||||||||||
| One Preserve Parkway |
Montgomery County MD |
1 | 183,734 | 76.7 | % | 35.18 | N | S | ||||||||||||||||||
| 2600 Tower Oaks Boulevard |
Montgomery County MD |
1 | 178,865 | 87.3 | % | 38.92 | N | S | ||||||||||||||||||
| Wisconsin Place (66.67% ownership) |
Montgomery County MD |
1 | 299,136 | 96.5 | % | 46.26 | Y | S | ||||||||||||||||||
| (2) Democracy Tower |
Fairfax County VA |
1 | 235,436 | 100.0 | % | 46.12 | Y | S | ||||||||||||||||||
| Kingstowne One |
Fairfax County VA |
1 | 150,838 | 100.0 | % | 37.56 | Y | S | ||||||||||||||||||
| Kingstowne Two |
Fairfax County VA |
1 | 156,251 | 98.2 | % | 38.10 | Y | S | ||||||||||||||||||
| Kingstowne Retail |
Fairfax County VA |
1 | 88,288 | 100.0 | % | 30.79 | Y | S | ||||||||||||||||||
| One Freedom Square |
Fairfax County VA |
1 | 423,922 | 96.0 | % | 41.20 | Y | S | ||||||||||||||||||
| Two Freedom Square |
Fairfax County VA |
1 | 421,142 | 100.0 | % | 46.15 | N | S | ||||||||||||||||||
| One Reston Overlook |
Fairfax County VA |
1 | 312,685 | 100.0 | % | 31.28 | N | S | ||||||||||||||||||
| Two Reston Overlook |
Fairfax County VA |
1 | 134,615 | 91.8 | % | 33.00 | N | S | ||||||||||||||||||
| One and Two Discovery Square |
Fairfax County VA |
2 | 366,990 | 95.3 | % | 45.74 | N | S | ||||||||||||||||||
| New Dominion Technology Park - Building One |
Fairfax County VA |
1 | 235,201 | 100.0 | % | 33.05 | Y | S | ||||||||||||||||||
| New Dominion Technology Park - Building Two |
Fairfax County VA |
1 | 257,400 | 100.0 | % | 39.48 | Y | S | ||||||||||||||||||
| Reston Corporate Center |
Fairfax County VA |
2 | 261,046 | 100.0 | % | 35.15 | N | S | ||||||||||||||||||
| South of Market |
Fairfax County VA |
3 | 647,682 | 97.5 | % | 45.13 | Y | S | ||||||||||||||||||
| 12290 Sunrise Valley |
Fairfax County VA |
1 | 182,424 | 100.0 | % | 38.25 | N | S | ||||||||||||||||||
| (3) 12300 Sunrise Valley |
Fairfax County VA |
1 | 255,244 | 100.0 | % | 45.98 | N | S | ||||||||||||||||||
| (3) 12310 Sunrise Valley |
Fairfax County VA |
1 | 263,870 | 100.0 | % | 46.36 | N | S | ||||||||||||||||||
| 37 | 9,365,778 | 97.6 | % | $ | 46.65 | |||||||||||||||||||||
| Office/Technical |
||||||||||||||||||||||||||
| (3) 6601 Springfield Center Drive |
Fairfax County VA |
1 | 26,388 | 100.0 | % | $ | 11.33 | N | S | |||||||||||||||||
| 7435 Boston Boulevard |
Fairfax County VA |
1 | 103,557 | 100.0 | % | 20.96 | N | S | ||||||||||||||||||
| 7451 Boston Boulevard |
Fairfax County VA |
1 | 47,001 | 100.0 | % | 23.79 | N | S | ||||||||||||||||||
| 7450 Boston Boulevard |
Fairfax County VA |
1 | 62,402 | 100.0 | % | 20.20 | N | S | ||||||||||||||||||
| 7374 Boston Boulevard |
Fairfax County VA |
1 | 57,321 | 100.0 | % | 16.46 | N | S | ||||||||||||||||||
| 8000 Grainger Court |
Fairfax County VA |
1 | 88,775 | 100.0 | % | 19.74 | N | S | ||||||||||||||||||
| 7500 Boston Boulevard |
Fairfax County VA |
1 | 79,971 | 100.0 | % | 15.07 | N | S | ||||||||||||||||||
| 7501 Boston Boulevard |
Fairfax County VA |
1 | 75,756 | 100.0 | % | 23.26 | N | S | ||||||||||||||||||
| 7601 Boston Boulevard |
Fairfax County VA |
1 | 103,750 | 100.0 | % | 14.38 | N | S | ||||||||||||||||||
| 7375 Boston Boulevard |
Fairfax County VA |
1 | 26,865 | 100.0 | % | 20.35 | N | S | ||||||||||||||||||
| 8000 Corporate Court |
Fairfax County VA |
1 | 52,539 | 100.0 | % | 20.58 | N | S | ||||||||||||||||||
| 7300 Boston Boulevard |
Fairfax County VA |
1 | 32,000 | 100.0 | % | 27.52 | N | S | ||||||||||||||||||
| 12 | 756,325 | 100.0 | % | $ | 19.19 | |||||||||||||||||||||
| Total Greater Washington: | 49 | 10,122,103 | 97.8 | % | $ | 44.55 | ||||||||||||||||||||
| (1) | For disclosures relating to our definition of Annualized Revenue, see page 50. |
| (2) | Not included in Same Property analysis. |
| (3) | Property held for redevelopment. |
21
Boston Properties, Inc.
Third Quarter 2010
In-Service Property Listing (continued)
as of September 30, 2010
| Sub Market |
Number of Buildings |
Square Feet |
Leased % | Annualized Revenue Per Leased SF (1) |
Encumbered with secured debt (Y/N) |
Central Business District (CBD) or Suburban (S) |
||||||||||||||||||||
| Midtown Manhattan |
||||||||||||||||||||||||||
| Office |
||||||||||||||||||||||||||
| 599 Lexington Avenue |
Park Avenue NY |
1 | 1,043,467 | 97.9 | % | $ | 79.98 | Y | CBD | |||||||||||||||||
| 601 Lexington Avenue |
Park Avenue NY |
1 | 1,629,685 | 96.0 | % | 82.04 | Y | CBD | ||||||||||||||||||
| 399 Park Avenue |
Park Avenue NY |
1 | 1,707,476 | 98.8 | % | 80.74 | N | CBD | ||||||||||||||||||
| Times Square Tower |
Times Square NY |
1 | 1,243,866 | 99.4 | % | 72.32 | N | CBD | ||||||||||||||||||
| General Motors Building (60% ownership) |
Plaza District NY |
1 | 1,800,321 | 98.4 | % | 113.61 | Y | CBD | ||||||||||||||||||
| 540 Madison Avenue (60% ownership) |
Plaza District NY |
1 | 288,580 | 95.2 | % | 101.44 | Y | CBD | ||||||||||||||||||
| 125 West 55th Street (60% ownership) |
Sixth/Rock Center NY |
1 | 581,267 | 100.0 | % | 66.29 | Y | CBD | ||||||||||||||||||
| Two Grand Central Tower (60% ownership) |
Grand Central District NY |
1 | 639,269 | 90.8 | % | 61.74 | Y | CBD | ||||||||||||||||||
| Total Midtown Manhattan: | 8 | 8,933,931 | 97.6 | % | $ | 84.81 | ||||||||||||||||||||
| Princeton/East Brunswick, NJ |
||||||||||||||||||||||||||
| Office |
||||||||||||||||||||||||||
| 101 Carnegie Center |
Princeton NJ |
1 | 123,659 | 100.0 | % | $ | 29.34 | N | S | |||||||||||||||||
| 104 Carnegie Center |
Princeton NJ |
1 | 102,830 | 97.2 | % | 35.07 | N | S | ||||||||||||||||||
| 105 Carnegie Center |
Princeton NJ |
1 | 69,955 | 55.3 | % | 29.46 | N | S | ||||||||||||||||||
| 201 Carnegie Center |
Princeton NJ |
— | 6,500 | 100.0 | % | 30.57 | N | S | ||||||||||||||||||
| 202 Carnegie Center |
Princeton NJ |
1 | 130,582 | 78.7 | % | 32.19 | N | S | ||||||||||||||||||
| 206 Carnegie Center |
Princeton NJ |
1 | 161,763 | 100.0 | % | 33.85 | N | S | ||||||||||||||||||
| 210 Carnegie Center |
Princeton NJ |
1 | 162,368 | 92.8 | % | 36.95 | N | S | ||||||||||||||||||
| 211 Carnegie Center |
Princeton NJ |
1 | 47,025 | 100.0 | % | 32.27 | N | S | ||||||||||||||||||
| 212 Carnegie Center |
Princeton NJ |
1 | 149,354 | 82.0 | % | 36.18 | N | S | ||||||||||||||||||
| 214 Carnegie Center |
Princeton NJ |
1 | 150,774 | 77.7 | % | 31.91 | N | S | ||||||||||||||||||
| 302 Carnegie Center |
Princeton NJ |
1 | 64,926 | 100.0 | % | 33.15 | N | S | ||||||||||||||||||
| 502 Carnegie Center |
Princeton NJ |
1 | 118,120 | 82.1 | % | 34.94 | N | S | ||||||||||||||||||
| 504 Carnegie Center |
Princeton NJ |
1 | 121,990 | 100.0 | % | 30.05 | N | S | ||||||||||||||||||
| 506 Carnegie Center |
Princeton NJ |
1 | 145,213 | 100.0 | % | 34.32 | N | S | ||||||||||||||||||
| 508 Carnegie Center |
Princeton NJ |
1 | 128,662 | 57.8 | % | 33.00 | N | S | ||||||||||||||||||
| 510 Carnegie Center |
Princeton NJ |
1 | 234,160 | 100.0 | % | 29.38 | N | S | ||||||||||||||||||
| (2) 701 Carnegie Center |
Princeton NJ |
1 | 120,000 | 100.0 | % | 36.32 | N | S | ||||||||||||||||||
| 16 | 2,037,881 | 89.7 | % | $ | 33.03 | |||||||||||||||||||||
| One Tower Center |
East Brunswick NJ |
1 | 414,648 | 47.2 | % | $ | 32.03 | N | S | |||||||||||||||||
| 1 | 414,648 | 47.2 | % | $ | 32.03 | |||||||||||||||||||||
| Total Princeton/East Brunswick, NJ: | 17 | 2,452,529 | 82.5 | % | $ | 32.94 | ||||||||||||||||||||
| Greater San Francisco |
||||||||||||||||||||||||||
| Office |
||||||||||||||||||||||||||
| Embarcadero Center One |
CBD San Francisco CA |
1 | 833,723 | 87.1 | % | $ | 47.35 | N | CBD | |||||||||||||||||
| Embarcadero Center Two |
CBD San Francisco CA |
1 | 779,768 | 96.9 | % | 50.69 | N | CBD | ||||||||||||||||||
| Embarcadero Center Three |
CBD San Francisco CA |
1 | 775,086 | 91.7 | % | 42.36 | N | CBD | ||||||||||||||||||
| Embarcadero Center Four |
CBD San Francisco CA |
1 | 936,791 | 91.1 | % | 63.00 | Y | CBD | ||||||||||||||||||
| 4 | 3,325,368 | 91.6 | % | $ | 51.33 | |||||||||||||||||||||
| 611 Gateway |
South San Francisco CA |
1 | 256,302 | 100.0 | % | $ | 34.54 | N | S | |||||||||||||||||
| 601 and 651 Gateway |
South San Francisco CA |
2 | 506,224 | 97.5 | % | 32.91 | N | S | ||||||||||||||||||
| 303 Almaden |
San Jose CA |
1 | 158,499 | 90.8 | % | 34.89 | N | CBD | ||||||||||||||||||
| (3) North First Business Park |
San Jose CA |
5 | 190,636 | 75.8 | % | 16.77 | N | S | ||||||||||||||||||
| 3200 Zanker Road |
San Jose CA |
4 | 543,900 | 100.0 | % | 15.13 | N | S | ||||||||||||||||||
| 13 | 1,655,561 | 95.6 | % | $ | 25.77 | |||||||||||||||||||||
| Total Greater San Francisco: | 17 | 4,980,929 | 92.9 | % | $ | 42.55 | ||||||||||||||||||||
| Total In-Service Properties: | 139 | 35,861,885 | 93.4 | % | $ | 53.60 | ||||||||||||||||||||
| (1) | For disclosures relating to our definition of Annualized Revenue, see page 50. |
| (2) | Not included in Same Property analysis. |
| (3) | Property held for redevelopment. |
22
Boston Properties, Inc.
Third Quarter 2010
TOP 20 TENANTS LISTING AND PORTFOLIO TENANT DIVERSIFICATION
TOP 20 TENANTS BY SQUARE FEET LEASED
| Tenant |
Sq. Ft. | % of Portfolio |
||||||||
| 1 |
US Government | 2,002,912 | (1) | 5.59 | % | |||||
| 2 |
Lockheed Martin | 1,290,756 | 3.60 | % | ||||||
| 3 |
Citibank | 1,047,695 | (2) | 2.92 | % | |||||
| 4 |
Kirkland & Ellis | 648,566 | (3) | 1.81 | % | |||||
| 5 |
Genentech | 640,271 | 1.79 | % | ||||||
| 6 |
Biogen | 576,393 | 1.61 | % | ||||||
| 7 |
Ropes & Gray | 528,931 | 1.47 | % | ||||||
| 8 |
O’Melveny & Myers | 511,659 | 1.43 | % | ||||||
| 9 |
Shearman & Sterling | 472,808 | 1.32 | % | ||||||
| 10 |
Weil Gotshal Manges | 444,982 | (4) | 1.24 | % | |||||
| 11 |
Parametric Technology | 380,987 | 1.06 | % | ||||||
| 12 |
Finnegan Henderson Farabow | 363,744 | (5) | 1.01 | % | |||||
| 13 |
Microsoft | 342,478 | (6) | 0.95 | % | |||||
| 14 |
Ann Taylor | 338,942 | 0.95 | % | ||||||
| 15 |
Accenture | 310,312 | 0.87 | % | ||||||
| 16 |
Bingham McCutchen | 301,385 | 0.84 | % | ||||||
| 17 |
URS Energy & Construction | 299,079 | 0.83 | % | ||||||
| 18 |
Northrop Grumman | 297,716 | 0.83 | % | ||||||
| 19 |
Aramis (Estee Lauder) | 295,610 | (7) | 0.82 | % | |||||
| 20 |
Akin Gump Strauss Hauer & Feld | 290,132 | 0.81 | % | ||||||
| Total % of Portfolio Square Feet | 31.75 | % | ||||||||
| Total % of Portfolio Revenue | 32.75 | % | ||||||||
Notable Signed Deals (8)
| Tenant | Property |
Sq. Ft. | ||||
| Wellington Management | Atlantic Wharf | 454,000 | ||||
| Defense Intelligence Agency (US Government) |
12300 & 12310 Sunrise Valley | 523,000 | ||||
| Mass Financial Services (MFS) | 111 Huntington Avenue | 279,000 | ||||
| Hunton & Williams LLP | 2200 Pennsylvania Avenue | 189,806 | ||||
| (1) | Includes 28,384, 68,173, 75,074 & 175,698 square feet of space in properties in which Boston Properties has a 60%, 51%, 50% & 30% interest, respectively. |
| (2) | Includes 10,080 & 2,761 square feet of space in properties in which Boston Properties has a 60% and 51% interest, respectively. |
| (3) | Includes 256,904 square feet of space in a property in which Boston Properties has a 51% interest. |
| (4) | All space is in a property in which Boston Properties has a 60% interest. |
| (5) | Includes 266,539 square feet of space in a property in which Boston Properties has a 25% interest. |
| (6) | Includes 133,725 square feet of space in a property in which Boston Properties has a 67% interest. |
| (7) | All space is in a property in which Boston Properties has a 60% interest. |
| (8) | Represents leases signed with occupancy commencing in the future. |
TENANT DIVERSIFICATION (GROSS RENT) *
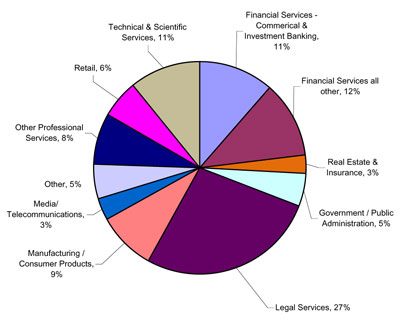
| * | The classification of the Company’s tenants is based on the U.S. Government’s North American Industry Classification System (NAICS), which has replaced the Standard Industrial Classification (SIC) system. |
23
Boston Properties, Inc.
Third Quarter 2010
IN-SERVICE OFFICE PROPERTIES
Lease Expirations (1) (2)
| Year of Lease |
Rentable Square Footage Subject to Expiring Leases |
Current Annualized Revenues Under Expiring Leases |
Current Annualized Revenues Under Expiring Leases p.s.f. |
Annualized Revenues Under Expiring Leases with future step-ups |
Annualized Revenues Under Expiring Leases with future step-ups - p.s.f. |
Percentage of Total Square Feet |
||||||||||||||||||
| 2010 |
716,549 | $ | 24,232,620 | $ | 33.82 | $ | 24,232,620 | $ | 33.82 | 2.19 | % | |||||||||||||
| 2011 |
2,666,272 | 131,922,554 | 49.48 | 132,197,125 | 49.58 | 8.15 | % | |||||||||||||||||
| 2012 |
2,837,055 | 136,423,387 | 48.09 | 131,546,622 | 46.37 | 8.67 | % | |||||||||||||||||
| 2013 |
1,563,843 | 64,505,408 | 41.25 | 66,378,205 | 42.45 | 4.78 | % | |||||||||||||||||
| 2014 |
2,882,806 | 117,087,228 | 40.62 | 127,108,104 | 44.09 | 8.81 | % | |||||||||||||||||
| 2015 |
2,487,397 | 119,096,276 | 47.88 | 132,741,010 | 53.37 | 7.60 | % | |||||||||||||||||
| 2016 |
2,467,764 | 122,095,132 | 49.48 | 132,475,188 | 53.68 | 7.54 | % | |||||||||||||||||
| 2017 |
3,122,111 | 209,110,125 | 66.98 | 225,413,878 | 72.20 | 9.54 | % | |||||||||||||||||
| 2018 |
574,010 | 42,009,627 | 73.19 | 47,055,738 | 81.98 | 1.75 | % | |||||||||||||||||
| 2019 |
2,915,806 | 166,338,533 | 57.05 | 185,507,448 | 63.62 | 8.91 | % | |||||||||||||||||
| Thereafter |
7,964,234 | 490,759,960 | 61.62 | 577,167,295 | 72.47 | 24.35 | % | |||||||||||||||||
Occupancy By Location (3)
| CBD | Suburban | Total | ||||||||||||||||||||||
| Location |
30-Sep-10 | 30-Sep-09 | 30-Sep-10 | 30-Sep-09 | 30-Sep-10 | 30-Sep-09 | ||||||||||||||||||
| Midtown Manhattan |
97.6 | % | 93.7 | % | n/a | n/a | 97.6 | % | 93.7 | % | ||||||||||||||
| Greater Boston |
92.6 | % | 95.7 | % | 85.5 | % | 89.1 | % | 89.2 | % | 92.7 | % | ||||||||||||
| Greater Washington |
98.4 | % | 99.4 | % | 96.9 | % | 92.6 | % | 97.6 | % | 95.5 | % | ||||||||||||
| Greater San Francisco |
91.6 | % | 91.0 | % | 96.1 | % | 90.1 | % | 92.9 | % | 90.7 | % | ||||||||||||
| Princeton/East Brunswick, NJ |
n/a | n/a | 82.5 | % | 81.3 | % | 82.5 | % | 81.3 | % | ||||||||||||||
| Total Portfolio |
95.7 | % | 94.7 | % | 90.7 | % | 89.3 | % | 93.7 | % | 92.6 | % | ||||||||||||
| (1) | For disclosures relating to our definition of Annualized Revenue, see page 50. |
| (2) | Includes 100% of unconsolidated joint venture properties. Does not include any data on properties owned by the Value-Added Fund. |
| (3) | Includes approximately 1,700,000 square feet of retail space. |
24
Boston Properties, Inc.
Third Quarter 2010
IN-SERVICE OFFICE/TECHNICAL PROPERTIES
Lease Expirations (1) (2)
| Year of Lease Expiration |
Rentable Square Footage Subject to Expiring Leases |
Current Annualized Revenues Under Expiring Leases |
Current Annualized Revenues Under Expiring Leases p.s.f. |
Annualized Revenues Under Expiring Leases with future step-ups |
Annualized Revenues Under Expiring Leases with future step-ups - p.s.f. |
Percentage of Total Square Feet |
||||||||||||||||||
| 2010 |
239,478 | $ | 5,032,439 | $ | 21.01 | $ | 5,032,439 | $ | 21.01 | 15.06 | % | |||||||||||||
| 2011 |
153,637 | 2,817,846 | 18.34 | 2,375,421 | 15.46 | 9.66 | % | |||||||||||||||||
| 2012 |
185,359 | 4,025,245 | 21.72 | 4,083,972 | 22.03 | 11.65 | % | |||||||||||||||||
| 2013 |
7,479 | 148,517 | 19.86 | 154,497 | 20.66 | 0.47 | % | |||||||||||||||||
| 2014 |
258,020 | 4,691,608 | 18.18 | 4,942,371 | 19.15 | 16.22 | % | |||||||||||||||||
| 2015 |
37,777 | 694,864 | 18.39 | 770,498 | 20.40 | 2.38 | % | |||||||||||||||||
| 2016 |
225,532 | 18,991,330 | 84.21 | 19,291,288 | 85.54 | 14.18 | % | |||||||||||||||||
| 2017 |
— | — | — | — | — | 0.00 | % | |||||||||||||||||
| 2018 |
— | — | — | — | — | 0.00 | % | |||||||||||||||||
| 2019 |
— | — | — | — | — | 0.00 | % | |||||||||||||||||
| Thereafter |
237,776 | 4,871,666 | 20.49 | 5,190,554 | 21.83 | 14.95 | % | |||||||||||||||||
| Occupancy By Location
|
| |||||||||||||||||||||||
| CBD | Suburban | Total | ||||||||||||||||||||||
| Location |
30-Sep-10 | 30-Sep-09 | 30-Sep-10 | 30-Sep-09 | 30-Sep-10 | 30-Sep-09 | ||||||||||||||||||
| Midtown Manhattan |
n/a | n/a | n/a | n/a | n/a | n/a | ||||||||||||||||||
| Greater Boston |
100.0 | % | 100.0 | % | 56.8 | % | 56.8 | % | 72.3 | % | 72.3 | % | ||||||||||||
| Greater Washington |
n/a | n/a | 100.0 | % | 91.6 | % | 100.0 | % | 91.6 | % | ||||||||||||||
| Greater San Francisco |
n/a | n/a | n/a | n/a | n/a | n/a | ||||||||||||||||||
| Princeton/East Brunswick, NJ |
n/a | n/a | n/a | n/a | n/a | n/a | ||||||||||||||||||
| Total Portfolio |
100.0 | % | 100.0 | % | 82.1 | % | 77.9 | % | 85.5 | % | 81.9 | % | ||||||||||||
| (1) | For disclosures relating to our definition of Annualized Revenue, see page 50. |
| (2) | Includes 100% of unconsolidated joint venture properties. Does not include any data on properties owned by the Value-Added Fund. |
25
Boston Properties, Inc.
Third Quarter 2010
IN-SERVICE RETAIL PROPERTIES
Lease Expirations (1) (2)
| Year of Lease |
Rentable Square Footage Subject to Expiring Leases |
Current Annualized Revenues Under Expiring Leases |
Current Annualized Revenues Under Expiring Leases p.s.f. |
Annualized Revenues Under Expiring Leases with future step-ups |
Annualized Revenues Under Expiring Leases with future step-ups - p.s.f. |
Percentage of Total Square Feet |
||||||||||||||||||
| 2010 |
62,497 | $ | 2,414,927 | $ | 38.64 | $ | 2,426,927 | $ | 38.83 | 4.01 | % | |||||||||||||
| 2011 |
56,167 | 6,035,305 | 107.45 | 5,968,634 | 106.27 | 3.60 | % | |||||||||||||||||
| 2012 |
143,008 | 9,520,006 | 66.57 | 9,710,999 | 67.91 | 9.17 | % | |||||||||||||||||
| 2013 |
73,339 | 6,153,554 | 83.91 | 6,274,273 | 85.55 | 4.70 | % | |||||||||||||||||
| 2014 |
53,902 | 4,918,384 | 91.25 | 5,186,318 | 96.22 | 3.46 | % | |||||||||||||||||
| 2015 |
145,287 | 12,988,772 | 89.40 | 14,151,040 | 97.40 | 9.32 | % | |||||||||||||||||
| 2016 |
154,287 | 17,148,859 | 111.15 | 18,787,473 | 121.77 | 9.89 | % | |||||||||||||||||
| 2017 |
107,995 | 6,758,260 | 62.58 | 7,222,706 | 66.88 | 6.92 | % | |||||||||||||||||
| 2018 |
227,785 | 10,469,518 | 45.96 | 11,217,147 | 49.24 | 14.61 | % | |||||||||||||||||
| 2019 |
55,477 | 3,716,258 | 66.99 | 4,357,615 | 78.55 | 3.56 | % | |||||||||||||||||
| Thereafter |
479,847 | 27,794,890 | 57.92 | 34,544,550 | 71.99 | 30.77 | % | |||||||||||||||||
| (1) | For disclosures relating to our definition of Annualized Revenue, see page 50. |
| (2) | Includes 100% of unconsolidated joint venture properties. Does not include any data on properties owned by the Value-Added Fund. |
26
Boston Properties, Inc.
Third Quarter 2010
GRAND TOTAL OF ALL
IN-SERVICE PROPERTIES
Lease Expirations (1) (2)
| Year of Lease |
Rentable Square Footage Subject to Expiring Leases |
Current Annualized Revenues Under Expiring Leases |
Current Annualized Revenues Under Expiring Leases p.s.f. |
Annualized Revenues Under Expiring Leases with future step-ups |
Annualized Revenues Under Expiring Leases with future step-ups - p.s.f. |
Percentage of Total Square Feet |
||||||||||||||||||
| 2010 |
1,018,524 | $ | 31,679,986 | $ | 31.10 | $ | 31,691,986 | $ | 31.12 | 2.8 | % | |||||||||||||
| 2011 |
2,876,076 | 140,775,705 | 48.95 | 140,541,179 | 48.87 | 8.0 | % | |||||||||||||||||
| 2012 |
3,165,422 | 149,968,638 | 47.38 | 145,341,594 | 45.92 | 8.8 | % | |||||||||||||||||
| 2013 |
1,644,661 | 70,807,478 | 43.05 | 72,806,975 | 44.27 | 4.6 | % | |||||||||||||||||
| 2014 |
3,194,728 | 126,697,220 | 39.66 | 137,236,794 | 42.96 | 8.9 | % | |||||||||||||||||
| 2015 |
2,670,461 | 132,779,913 | 49.72 | 147,662,549 | 55.29 | 7.4 | % | |||||||||||||||||
| 2016 |
2,847,583 | 158,235,321 | 55.57 | 170,553,949 | 59.89 | 7.9 | % | |||||||||||||||||
| 2017 |
3,230,106 | 215,868,385 | 66.83 | 232,636,584 | 72.02 | 9.0 | % | |||||||||||||||||
| 2018 |
801,795 | 52,479,145 | 65.45 | 58,272,885 | 72.68 | 2.2 | % | |||||||||||||||||
| 2019 |
2,971,283 | 170,054,791 | 57.23 | 189,865,063 | 63.90 | 8.3 | % | |||||||||||||||||
| Thereafter |
8,681,857 | 523,426,516 | 60.29 | 616,902,399 | 71.06 | 24.2 | % | |||||||||||||||||
| Occupancy By Location
|
| |||||||||||||||||||||||
| CBD | Suburban | Total | ||||||||||||||||||||||
| Location |
30-Sep-10 | 30-Sep-09 | 30-Sep-10 | 30-Sep-09 | 30-Sep-10 | 30-Sep-09 | ||||||||||||||||||
| Midtown Manhattan |
97.6 | % | 93.7 | % | n/a | n/a | 97.6 | % | 93.7 | % | ||||||||||||||
| Greater Boston |
93.0 | % | 96.0 | % | 82.1 | % | 85.1 | % | 87.7 | % | 90.8 | % | ||||||||||||
| Greater Washington |
98.4 | % | 99.4 | % | 97.3 | % | 92.5 | % | 97.8 | % | 95.2 | % | ||||||||||||
| Greater San Francisco |
91.6 | % | 91.0 | % | 96.1 | % | 90.1 | % | 92.9 | % | 90.7 | % | ||||||||||||
| Princeton/East Brunswick, NJ |
n/a | n/a | 82.5 | % | 81.3 | % | 82.5 | % | 81.3 | % | ||||||||||||||
| Total Portfolio |
95.7 | % | 94.8 | % | 89.9 | % | 88.2 | % | 93.4 | % | 92.1 | % | ||||||||||||
| (1) | For disclosures relating to our definition of Annualized Revenue, see page 50. |
| (2) | Includes 100% of unconsolidated joint venture properties. Does not include any data on properties owned by the Value-Added Fund. |
27
Boston Properties, Inc.
Third Quarter 2010
IN-SERVICE GREATER BOSTON PROPERTIES
Lease Expirations - Greater Boston (1) (2)
| OFFICE | OFFICE/TECHNICAL | |||||||||||||||||||||||||||||||||||||||
| Year of Lease |
Rentable Square Footage Subject to Expiring Leases |
Current Annualized Revenues Under Expiring Leases |
Per Square Foot |
Annualized Revenues Under Expiring Leases with future step-ups |
Per Square Foot |
Rentable Square Footage Subject to Expiring Leases |
Current Annualized Revenues Under Expiring Leases |
Per Square Foot |
Annualized Revenues Under Expiring Leases with future step-ups |
Per Square Foot |
||||||||||||||||||||||||||||||
| 2010 |
149,446 | $ | 5,208,687 | $ | 34.85 | $ | 5,208,687 | $ | 34.85 | — | $ | — | $ | — | $ | — | $ | — | ||||||||||||||||||||||
| 2011 |
774,417 | 27,044,645 | 34.92 | 26,966,130 | 34.82 | 36,528 | 887,324 | 24.29 | 428,532 | 11.73 | ||||||||||||||||||||||||||||||
| 2012 |
977,287 | 35,129,173 | 35.95 | 35,560,669 | 36.39 | 67,362 | 1,665,183 | 24.72 | 1,665,183 | 24.72 | ||||||||||||||||||||||||||||||
| 2013 |
521,263 | 21,165,943 | 40.61 | 22,230,461 | 42.65 | — | — | — | — | — | ||||||||||||||||||||||||||||||
| 2014 |
536,066 | 19,441,103 | 36.27 | 19,813,691 | 36.96 | 30,000 | 457,500 | 15.25 | 457,500 | 15.25 | ||||||||||||||||||||||||||||||
| 2015 |
747,050 | 26,969,074 | 36.10 | 29,451,577 | 39.42 | — | — | — | — | — | ||||||||||||||||||||||||||||||
| 2016 |
329,422 | 10,709,667 | 32.51 | 11,685,974 | 35.47 | 225,532 | 18,991,330 | 84.21 | 19,291,288 | 85.54 | ||||||||||||||||||||||||||||||
| 2017 |
371,288 | 16,337,473 | 44.00 | 18,788,169 | 50.60 | — | — | — | — | — | ||||||||||||||||||||||||||||||
| 2018 |
12,123 | 425,188 | 35.07 | 422,960 | 34.89 | — | — | — | — | — | ||||||||||||||||||||||||||||||
| 2019 |
576,611 | 24,207,746 | 41.98 | 26,375,038 | 45.74 | — | — | — | — | — | ||||||||||||||||||||||||||||||
| Thereafter |
1,792,950 | 92,259,806 | 51.46 | 104,471,573 | 58.27 | 237,776 | 4,871,666 | 20.49 | 5,190,554 | 21.83 | ||||||||||||||||||||||||||||||
| Retail | Total Property Types | |||||||||||||||||||||||||||||||||||||||
| Year of Lease |
Rentable Square Footage Subject to Expiring Leases |
Current Annualized Revenues Under Expiring Leases |
Per Square Foot |
Annualized Revenues Under Expiring Leases with future step-ups |
Per Square Foot |
Rentable Square Footage Subject to Expiring Leases |
Current Annualized Revenues Under Expiring Leases |
Per Square Foot |
Annualized Revenues Under Expiring Leases with future step-ups |
Per Square Foot |
||||||||||||||||||||||||||||||
| 2010 |
1,521 | $ | 655,435 | $ | 430.92 | $ | 667,435 | $ | 438.81 | (3) | 150,967 | $ | 5,864,122 | $ | 38.84 | $ | 5,876,122 | $ | 38.92 | |||||||||||||||||||||
| 2011 |
25,499 | 3,779,047 | 148.20 | 3,690,607 | 144.74 | (4) | 836,444 | 31,711,015 | 37.91 | 31,085,268 | 37.16 | |||||||||||||||||||||||||||||
| 2012 |
61,021 | 2,315,286 | 37.94 | 2,315,285 | 37.94 | 1,105,670 | 39,109,642 | 35.37 | 39,541,136 | 35.76 | ||||||||||||||||||||||||||||||
| 2013 |
28,464 | 3,502,019 | 123.03 | 3,503,460 | 123.08 | 549,727 | 24,667,961 | 44.87 | 25,733,920 | 46.81 | ||||||||||||||||||||||||||||||
| 2014 |
16,492 | 2,154,072 | 130.61 | 2,186,293 | 132.57 | 582,558 | 22,052,676 | 37.85 | 22,457,484 | 38.55 | ||||||||||||||||||||||||||||||
| 2015 |
72,607 | 5,353,688 | 73.74 | 5,424,070 | 74.70 | 819,657 | 32,322,763 | 39.43 | 34,875,647 | 42.55 | ||||||||||||||||||||||||||||||
| 2016 |
14,617 | 1,776,577 | 121.54 | 1,850,442 | 126.60 | 569,571 | 31,477,574 | 55.27 | 32,827,703 | 57.64 | (5) | |||||||||||||||||||||||||||||
| 2017 |
43,745 | 2,658,473 | 60.77 | 2,819,584 | 64.45 | 415,033 | 18,995,946 | 45.77 | 21,607,753 | 52.06 | ||||||||||||||||||||||||||||||
| 2018 |
171,701 | 7,327,968 | 42.68 | 7,644,861 | 44.52 | 183,824 | 7,753,156 | 42.18 | 8,067,821 | 43.89 | ||||||||||||||||||||||||||||||
| 2019 |
16,025 | 1,735,414 | 108.29 | 2,066,071 | 128.93 | 592,636 | 25,943,159 | 43.78 | 28,441,108 | 47.99 | ||||||||||||||||||||||||||||||
| Thereafter |
230,945 | 9,850,037 | 42.65 | 11,496,105 | 49.78 | 2,261,671 | 106,981,509 | 47.30 | 121,158,232 | 53.57 | ||||||||||||||||||||||||||||||
| (1) | For disclosures relating to our definition of Annualized Revenue, see page 50. |
| (2) | Includes 100% of unconsolidated joint venture properties. Does not include any data on properties owned by the Value-Added Fund. |
| (3) | Excluding kiosks with one square foot at the Prudential Center, current and future expiring rents would be $115.89 per square foot and $115.89 per square foot in 2010. |
| (4) | Excluding kiosks with one square foot at the Prudential Center, current and future expiring rents would be $94.34 per square foot and $95.31 per square foot in 2011. |
| (5) | Includes 225,532 square feet of research/laboratory space, excluding the research/laboratory space current and future expiring rents would be $35.77 per square foot and $38.84 per square foot in 2016. |
28
Boston Properties, Inc.
Third Quarter 2010
IN-SERVICE GREATER BOSTON PROPERTIES
Quarterly Lease Expirations - Greater Boston (1) (2)
| OFFICE | OFFICE/TECHNICAL | |||||||||||||||||||||||||||||||||||||||
| Lease Expiration |
Rentable Square Footage Subject to Expiring Leases |
Current Annualized Revenues Under Expiring Leases |
Per Square Foot |
Annualized Revenues Under Expiring Leases with future step-ups |
Per Square Foot |
Rentable Square Footage Subject to Expiring Leases |
Current Annualized Revenues Under Expiring Leases |
Per Square Foot |
Annualized Revenues Under Expiring Leases with future step-ups |
Per Square Foot |
||||||||||||||||||||||||||||||
| Q1 2010 |
— | $ | — | $ | — | $ | — | $ | — | — | $ | — | $ | — | $ | — | $ | — | ||||||||||||||||||||||
| Q2 2010 |
— | — | — | — | — | — | — | — | — | — | ||||||||||||||||||||||||||||||
| Q3 2010 |
— | — | — | — | — | — | — | — | — | — | ||||||||||||||||||||||||||||||
| Q4 2010 |
149,446 | 5,208,687 | 34.85 | 5,208,687 | 34.85 | — | — | — | — | — | ||||||||||||||||||||||||||||||
| Total 2010 |
149,446 | $ | 5,208,687 | $ | 34.85 | $ | 5,208,687 | $ | 34.85 | — | $ | — | $ | — | $ | — | $ | — | ||||||||||||||||||||||
| Q1 2011 |
154,627 | $ | 5,624,602 | $ | 36.38 | $ | 5,624,602 | $ | 36.38 | — | $ | — | $ | — | $ | — | $ | — | ||||||||||||||||||||||
| Q2 2011 |
368,570 | 11,442,840 | 31.05 | 11,442,840 | 31.05 | — | — | — | — | — | ||||||||||||||||||||||||||||||
| Q3 2011 |
122,445 | 4,231,245 | 34.56 | 4,203,084 | 34.33 | 36,528 | 887,324 | 24.29 | 428,532 | 11.73 | ||||||||||||||||||||||||||||||
| Q4 2011 |
128,775 | 5,745,957 | 44.62 | 5,695,604 | 44.23 | — | — | — | — | — | ||||||||||||||||||||||||||||||
| Total 2011 |
774,417 | $ | 27,044,645 | $ | 34.92 | $ | 26,966,130 | $ | 34.82 | 36,528 | $ | 887,324 | $ | 24.29 | $ | 428,532 | $ | 11.73 | ||||||||||||||||||||||
| Retail | Total Property Types | |||||||||||||||||||||||||||||||||||||||
| Lease Expiration |
Rentable Square Footage Subject to Expiring Leases |
Current Annualized Revenues Under Expiring Leases |
Per Square Foot |
Annualized Revenues Under Expiring Leases with future step-ups |
Per Square Foot |
Rentable Square Footage Subject to Expiring Leases |
Current Annualized Revenues Under Expiring Leases |
Per Square Foot |
Annualized Revenues Under Expiring Leases with future step-ups |
Per Square Foot |
||||||||||||||||||||||||||||||
| Q1 2010 |
— | $ | — | $ | — | $ | — | $ | — | — | $ | — | $ | — | $ | — | $ | — | ||||||||||||||||||||||
| Q2 2010 |
— | — | — | — | — | — | — | — | — | — | ||||||||||||||||||||||||||||||
| Q3 2010 |
— | — | — | — | — | — | — | — | — | — | ||||||||||||||||||||||||||||||
| Q4 2010 |
1,521 | 655,435 | 430.92 | 667,435 | 438.81 | 150,967 | 5,864,122 | 38.84 | 5,876,122 | 38.92 | ||||||||||||||||||||||||||||||
| Total 2010 |
1,521 | $ | 655,435 | $ | 430.92 | $ | 667,435 | $ | 438.81 | (3) | 150,967 | $ | 5,864,122 | $ | 38.84 | $ | 5,876,122 | $ | 38.92 | |||||||||||||||||||||
| Q1 2011 |
13,278 | $ | 1,806,337 | $ | 136.04 | $ | 1,718,137 | $ | 129.40 | 167,905 | $ | 7,430,938 | $ | 44.26 | $ | 7,342,738 | $ | 43.73 | ||||||||||||||||||||||
| Q2 2011 |
1,934 | 617,102 | 319.08 | 618,218 | 319.66 | 370,504 | 12,059,942 | 32.55 | 12,061,058 | 32.55 | ||||||||||||||||||||||||||||||
| Q3 2011 |
7 | 431,250 | 61,607.13 | 405,150 | 57,878.55 | 158,980 | 5,549,819 | 34.91 | 5,036,765 | 31.68 | ||||||||||||||||||||||||||||||
| Q4 2011 |
10,280 | 924,358 | 89.92 | 949,102 | 92.33 | 139,055 | 6,670,315 | 47.97 | 6,644,706 | 47.78 | ||||||||||||||||||||||||||||||
| Total 2011 |
25,499 | $ | 3,779,047 | $ | 148.20 | $ | 3,690,607 | $ | 144.74 | (4) | 836,444 | $ | 31,711,015 | $ | 37.91 | $ | 31,085,268 | $ | 37.16 | |||||||||||||||||||||
| (1) | For disclosures relating to our definition of Annualized Revenue, see page 50. |
| (2) | Includes 100% of unconsolidated joint venture properties. Does not include any data on properties owned by the Value-Added Fund. |
| (3) | Excluding kiosks with one square foot at the Prudential Center, current and future expiring rents would be $115.89 per square foot and $115.89 per square foot in 2010. |
| (4) | Excluding kiosks with one square foot at the Prudential Center, current and future expiring rents would be $94.34 per square foot and $95.31 per square foot in 2011. |
29
Boston Properties, Inc.
Third Quarter 2010
IN-SERVICE GREATER WASHINGTON PROPERTIES
Lease Expirations - Greater Washington (1) (2)
| OFFICE | OFFICE/TECHNICAL | |||||||||||||||||||||||||||||||||||||||
| Year of Lease |
Rentable Square Footage Subject to Expiring Leases |
Current Annualized Revenues Under Expiring Leases |
Per Square Foot |
Annualized Revenues Under Expiring Leases with future step-ups |
Per Square Foot |
Rentable Square Footage Subject to Expiring Leases |
Current Annualized Revenues Under Expiring Leases |
Per Square Foot |
Annualized Revenues Under Expiring Leases with future step-ups |
Per Square Foot |
||||||||||||||||||||||||||||||
| 2010 |
115,423 | $ | 5,568,283 | $ | 48.24 | $ | 5,568,283 | $ | 48.24 | 239,478 | $ | 5,032,439 | $ | 21.01 | $ | 5,032,439 | $ | 21.01 | ||||||||||||||||||||||
| 2011 |
967,774 | 49,204,233 | 50.84 | 49,336,549 | 50.98 | (3)(5) | 117,109 | 1,930,523 | 16.48 | 1,946,889 | 16.62 | |||||||||||||||||||||||||||||
| 2012 |
1,077,445 | 47,695,705 | 44.27 | 48,501,026 | 45.01 | (6) | 117,997 | 2,360,062 | 20.00 | 2,418,789 | 20.50 | |||||||||||||||||||||||||||||
| 2013 |
172,780 | 9,010,157 | 52.15 | 9,331,014 | 54.01 | 7,479 | 148,517 | 19.86 | 154,497 | 20.66 | ||||||||||||||||||||||||||||||
| 2014 |
991,104 | 39,376,174 | 39.73 | 46,962,815 | 47.38 | 228,020 | 4,234,108 | 18.57 | 4,484,871 | 19.67 | ||||||||||||||||||||||||||||||
| 2015 |
695,161 | 30,731,823 | 44.21 | 34,636,641 | 49.83 | 37,777 | 694,864 | 18.39 | 770,498 | 20.40 | ||||||||||||||||||||||||||||||
| 2016 |
424,354 | 16,820,215 | 39.64 | 19,306,890 | 45.50 | — | — | — | — | — | ||||||||||||||||||||||||||||||
| 2017 |
857,165 | 46,507,154 | 54.26 | 50,275,922 | 58.65 | — | — | — | — | — | ||||||||||||||||||||||||||||||
| 2018 |
338,243 | 16,759,612 | 49.55 | 19,733,363 | 58.34 | — | — | — | — | — | ||||||||||||||||||||||||||||||
| 2019 |
1,091,151 | 52,704,545 | 48.30 | 61,944,833 | 56.77 | — | — | — | — | — | ||||||||||||||||||||||||||||||
| Thereafter |
2,024,699 | 94,302,497 | 46.58 | 119,612,111 | 59.08 | — | — | — | — | — | ||||||||||||||||||||||||||||||
| Retail | Total Property Types | |||||||||||||||||||||||||||||||||||||||
| Year of Lease |
Rentable Square Footage Subject to Expiring Leases |
Current Annualized Revenues Under Expiring Leases |
Per Square Foot |
Annualized Revenues Under Expiring Leases with future step-ups |
Per Square Foot |
Rentable Square Footage Subject to Expiring Leases |
Current Annualized Revenues Under Expiring Leases |
Per Square Foot |
Annualized Revenues Under Expiring Leases with future step-ups |
Per Square Foot |
||||||||||||||||||||||||||||||
| 2010 |
17,730 | $ | 815,940 | $ | 46.02 | $ | 815,940 | $ | 46.02 | 372,631 | $ | 11,416,661 | $ | 30.64 | $ | 11,416,661 | $ | 30.64 | ||||||||||||||||||||||
| 2011 |
7,181 | 329,055 | 45.82 | 330,960 | 46.09 | 1,092,064 | 51,463,811 | 47.13 | 51,614,397 | 47.26 | (4)(5) | |||||||||||||||||||||||||||||
| 2012 |
11,984 | 514,736 | 42.95 | 524,670 | 43.78 | 1,207,426 | 50,570,503 | 41.88 | 51,444,486 | 42.61 | (6) | |||||||||||||||||||||||||||||
| 2013 |
8,207 | 422,747 | 51.51 | 441,453 | 53.79 | 188,466 | 9,581,421 | 50.84 | 9,926,965 | 52.67 | ||||||||||||||||||||||||||||||
| 2014 |
12,053 | 647,254 | 53.70 | 694,840 | 57.65 | 1,231,177 | 44,257,536 | 35.95 | 52,142,526 | 42.35 | ||||||||||||||||||||||||||||||
| 2015 |
28,902 | 1,435,373 | 49.66 | 1,485,068 | 51.38 | 761,840 | 32,862,061 | 43.14 | 36,892,206 | 48.43 | ||||||||||||||||||||||||||||||
| 2016 |
18,379 | 930,071 | 50.61 | 1,025,165 | 55.78 | 442,733 | 17,750,286 | 40.09 | 20,332,055 | 45.92 | ||||||||||||||||||||||||||||||
| 2017 |
24,412 | 1,083,993 | 44.40 | 1,174,633 | 48.12 | 881,577 | 47,591,147 | 53.98 | 51,450,555 | 58.36 | ||||||||||||||||||||||||||||||
| 2018 |
39,165 | 2,369,868 | 60.51 | 2,676,393 | 68.34 | 377,408 | 19,129,481 | 50.69 | 22,409,757 | 59.38 | ||||||||||||||||||||||||||||||
| 2019 |
29,933 | 1,288,850 | 43.06 | 1,454,973 | 48.61 | 1,121,084 | 53,993,395 | 48.16 | 63,399,805 | 56.55 | ||||||||||||||||||||||||||||||
| Thereafter |
136,979 | 4,747,893 | 34.66 | 5,991,447 | 43.74 | 2,161,678 | 99,050,390 | 45.82 | 125,603,558 | 58.10 | ||||||||||||||||||||||||||||||
| (1) | For disclosures relating to our definition of Annualized Revenue, see page 50. |
| (2) | Includes 100% of unconsolidated joint venture properties. Does not include any data on properties owned by the Value-Added Fund. |
| (3) | Includes 85,375 square feet of SCIF space, excluding the SCIF space current and future expiring rents would be $40.22 per square foot and $40.43 per square foot in 2011. |
| (4) | Includes 85,375 square feet of SCIF space, excluding the SCIF space current and future expiring rents would be $36.53 per square foot and $36.73 per square foot in 2011. |
| (5) | Includes 267,870 square feet of space to be taken out of service for redevelopment, see page 47 for further details. |
| (6) | Includes 255,244 square feet of space to be taken out of service for redevelopment, see page 47 for further details. |
30
Boston Properties, Inc.
Third Quarter 2010
IN-SERVICE GREATER WASHINGTON PROPERTIES
Quarterly Lease Expirations - Greater Washington (1) (2)
| OFFICE | OFFICE/TECHNICAL | |||||||||||||||||||||||||||||||||||||||
| Lease Expiration |
Rentable Square Footage Subject to Expiring Leases |
Current Annualized Revenues Under Expiring Leases |
Per Square Foot |
Annualized Revenues Under Expiring Leases with future step-ups |
Per Square Foot |
Rentable Square Footage Subject to Expiring Leases |
Current Annualized Revenues Under Expiring Leases |
Per Square Foot |
Annualized Revenues Under Expiring Leases with future step-ups |
Per Square Foot |
||||||||||||||||||||||||||||||
| Q1 2010 |
— | $ | — | $ | — | $ | — | $ | — | — | $ | — | $ | — | $ | — | $ | — | ||||||||||||||||||||||
| Q2 2010 |
— | — | — | — | — | — | — | — | — | — | ||||||||||||||||||||||||||||||
| Q3 2010 |
— | — | — | — | — | — | — | — | — | — | ||||||||||||||||||||||||||||||
| Q4 2010 |
115,423 | 5,568,283 | 48.24 | 5,568,283 | 48.24 | 239,478 | 5,032,439 | 21.01 | 5,032,439 | 21.01 | ||||||||||||||||||||||||||||||
| Total 2010 |
115,423 | $ | 5,568,283 | $ | 48.24 | $ | 5,568,283 | $ | 48.24 | 239,478 | $ | 5,032,439 | $ | 21.01 | $ | 5,032,439 | $ | 21.01 | ||||||||||||||||||||||
| Q1 2011 |
422,653 | $ | 16,319,888 | $ | 38.61 | $ | 16,319,888 | $ | 38.61 | 57,321 | $ | 943,635 | $ | 16.46 | $ | 943,635 | $ | 16.46 | ||||||||||||||||||||||
| Q2 2011 |
239,661 | 18,710,138 | 78.07 | 18,791,028 | 78.41 | — | — | — | — | — | ||||||||||||||||||||||||||||||
| Q3 2011 |
278,124 | 12,909,439 | 46.42 | 12,915,852 | 46.44 | 59,788 | 986,888 | 16.51 | 1,003,254 | 16.78 | ||||||||||||||||||||||||||||||
| Q4 2011 |
27,336 | 1,264,768 | 46.27 | 1,309,780 | 47.91 | — | — | — | — | — | ||||||||||||||||||||||||||||||
| Total 2011 |
967,774 | $ | 49,204,233 | $ | 50.84 | $ | 49,336,549 | $ | 50.98 | (3)(5) | 117,109 | $ | 1,930,523 | $ | 16.48 | $ | 1,946,889 | $ | 16.62 | |||||||||||||||||||||
| Retail | Total Property Types | |||||||||||||||||||||||||||||||||||||||
| Lease Expiration by Quarter |
Rentable Square Footage Subject to Expiring Leases |
Current Annualized Revenues Under Expiring Leases |
Per Square Foot |
Annualized Revenues Under Expiring Leases with future step-ups |
Per Square Foot |
Rentable Square Footage Subject to Expiring Leases |
Current Annualized Revenues Under Expiring Leases |
Per Square Foot |
Annualized Revenues Under Expiring Leases with future step-ups |
Per Square Foot |
||||||||||||||||||||||||||||||
| Q1 2010 |
— | $ | — | $ | — | $ | — | $ | — | — | $ | — | $ | — | $ | — | $ | — | ||||||||||||||||||||||
| Q2 2010 |
— | — | — | — | — | — | — | — | — | — | ||||||||||||||||||||||||||||||
| Q3 2010 |
— | — | — | — | — | — | — | — | — | — | ||||||||||||||||||||||||||||||
| Q4 2010 |
17,730 | 815,940 | 46.02 | 815,940 | 46.02 | 372,631 | 11,416,661 | 30.64 | 11,416,661 | 30.64 | ||||||||||||||||||||||||||||||
| Total 2010 |
17,730 | $ | 815,940 | $ | 46.02 | $ | 815,940 | $ | 46.02 | 372,631 | $ | 11,416,661 | $ | 30.64 | $ | 11,416,661 | $ | 30.64 | ||||||||||||||||||||||
| Q1 2011 |
1,316 | $ | 79,056 | $ | 60.07 | $ | 79,056 | $ | 60.07 | 481,290 | $ | 17,342,579 | $ | 36.03 | $ | 17,342,579 | $ | 36.03 | ||||||||||||||||||||||
| Q2 2011 |
— | — | — | — | — | 239,661 | 18,710,138 | 78.07 | 18,791,028 | 78.41 | ||||||||||||||||||||||||||||||
| Q3 2011 |
3,074 | 132,706 | 43.17 | 132,706 | 43.17 | 340,986 | 14,029,033 | 41.14 | 14,051,812 | 41.21 | ||||||||||||||||||||||||||||||
| Q4 2011 |
2,791 | 117,294 | 42.03 | 119,198 | 42.71 | 30,127 | 1,382,062 | 45.87 | 1,428,978 | 47.43 | ||||||||||||||||||||||||||||||
| Total 2011 |
7,181 | $ | 329,055 | $ | 45.82 | $ | 330,960 | $ | 46.09 | 1,092,064 | $ | 51,463,811 | $ | 47.13 | $ | 51,614,397 | $ | 47.26 | (4)(5) | |||||||||||||||||||||
| (1) | For disclosures relating to our definition of Annualized Revenue, see page 50. |
| (2) | Includes 100% of unconsolidated joint venture properties. Does not include any data on properties owned by the Value-Added Fund. |
| (3) | Includes 85,375 square feet of SCIF space, excluding the SCIF space current and future expiring rents would be $40.22 per square foot and $40.43 per square foot in 2011. |
| (4) | Includes 85,375 square feet of SCIF space, excluding the SCIF space current and future expiring rents would be $36.53 per square foot and $36.73 per square foot in 2011. |
| (5) | Includes 267,870 square feet of space to be taken out of service for redevelopment, see page 47 for further details. |
31
Boston Properties, Inc.
Third Quarter 2010
IN-SERVICE GREATER SAN FRANCISCO PROPERTIES
Lease Expirations - Greater San Francisco (1) (2)
| OFFICE | OFFICE/TECHNICAL | |||||||||||||||||||||||||||||||||||||||
| Year of Lease |
Rentable Square Footage Subject to Expiring Leases |
Current Annualized Revenues Under Expiring Leases |
Per Square Foot |
Annualized Revenues Under Expiring Leases with future step-ups |
Per Square Foot |
Rentable Square Footage Subject to Expiring Leases |
Current Annualized Revenues Under Expiring Leases |
Per Square Foot |
Annualized Revenues Under Expiring Leases with future step-ups |
Per Square Foot |
||||||||||||||||||||||||||||||
| 2010 |
311,899 | $ | 6,002,254 | $ | 19.24 | $ | 6,002,254 | $ | 19.24 | — | $ | — | $ | — | $ | — | $ | — | ||||||||||||||||||||||
| 2011 |
404,657 | 26,369,413 | 65.16 | 26,524,824 | 65.55 | — | — | — | — | — | ||||||||||||||||||||||||||||||
| 2012 |
272,686 | 13,966,859 | 51.22 | 14,125,224 | 51.80 | — | — | — | — | — | ||||||||||||||||||||||||||||||
| 2013 |
510,222 | 14,444,159 | 28.31 | 14,735,375 | 28.88 | — | — | — | — | — | ||||||||||||||||||||||||||||||
| 2014 |
469,110 | 18,539,462 | 39.52 | 19,371,038 | 41.29 | — | — | — | — | — | ||||||||||||||||||||||||||||||
| 2015 |
467,120 | 17,743,285 | 37.98 | 19,471,243 | 41.68 | — | — | — | — | — | ||||||||||||||||||||||||||||||
| 2016 |
974,748 | 39,817,453 | 40.85 | 42,397,129 | 43.50 | — | — | — | — | — | ||||||||||||||||||||||||||||||
| 2017 |
291,684 | 12,546,587 | 43.01 | 13,480,584 | 46.22 | — | — | — | — | — | ||||||||||||||||||||||||||||||
| 2018 |
58,268 | 3,583,433 | 61.50 | 3,989,491 | 68.47 | — | — | — | — | — | ||||||||||||||||||||||||||||||
| 2019 |
80,697 | 3,546,128 | 43.94 | 3,868,916 | 47.94 | — | — | — | — | — | ||||||||||||||||||||||||||||||
| Thereafter |
505,873 | 27,445,964 | 54.25 | 30,215,309 | 59.73 | — | — | — | — | — | ||||||||||||||||||||||||||||||
| Retail | Total Property Types | |||||||||||||||||||||||||||||||||||||||
| Year of Lease |
Rentable Square Footage Subject to Expiring Leases |
Current Annualized Revenues Under Expiring Leases |
Per Square Foot |
Annualized Revenues Under Expiring Leases with future step-ups |
Per Square Foot |
Rentable Square Footage Subject to Expiring Leases |
Current Annualized Revenues Under Expiring Leases |
Per Square Foot |
Annualized Revenues Under Expiring Leases with future step-ups |
Per Square Foot |
||||||||||||||||||||||||||||||
| 2010 |
42,938 | $ | 919,552 | $ | 21.42 | $ | 919,552 | $ | 21.42 | 354,837 | $ | 6,921,806 | $ | 19.51 | $ | 6,921,806 | $ | 19.51 | ||||||||||||||||||||||
| 2011 |
10,817 | 564,881 | 52.22 | 566,596 | 52.38 | 415,474 | 26,934,294 | 64.83 | 27,091,420 | 65.21 | ||||||||||||||||||||||||||||||
| 2012 |
32,591 | 2,393,264 | 73.43 | 2,516,094 | 77.20 | 305,277 | 16,360,123 | 53.59 | 16,641,317 | 54.51 | ||||||||||||||||||||||||||||||
| 2013 |
34,986 | 2,051,645 | 58.64 | 2,138,562 | 61.13 | 545,208 | 16,495,803 | 30.26 | 16,873,936 | 30.95 | ||||||||||||||||||||||||||||||
| 2014 |
14,339 | 787,806 | 54.94 | 848,196 | 59.15 | 483,449 | 19,327,268 | 39.98 | 20,219,233 | 41.82 | ||||||||||||||||||||||||||||||
| 2015 |
33,790 | 1,817,463 | 53.79 | 1,897,101 | 56.14 | 500,910 | 19,560,748 | 39.05 | 21,368,344 | 42.66 | ||||||||||||||||||||||||||||||
| 2016 |
26,815 | 1,238,446 | 46.18 | 1,354,258 | 50.50 | 1,001,563 | 41,055,899 | 40.99 | 43,751,386 | 43.68 | ||||||||||||||||||||||||||||||
| 2017 |
13,153 | 722,955 | 54.96 | 781,791 | 59.44 | 304,837 | 13,269,542 | 43.53 | 14,262,375 | 46.79 | ||||||||||||||||||||||||||||||
| 2018 |
16,919 | 771,682 | 45.61 | 895,893 | 52.95 | 75,187 | 4,355,114 | 57.92 | 4,885,383 | 64.98 | ||||||||||||||||||||||||||||||
| 2019 |
5,642 | 295,420 | 52.36 | 344,092 | 60.99 | 86,339 | 3,841,548 | 44.49 | 4,213,007 | 48.80 | ||||||||||||||||||||||||||||||
| Thereafter |
13,451 | 444,721 | 33.06 | 490,679 | 36.48 | 519,324 | 27,890,685 | 53.71 | 30,705,988 | 59.13 | ||||||||||||||||||||||||||||||
| (1) | For disclosures relating to our definition of Annualized Revenue, see page 50. |
| (2) | Includes 100% of unconsolidated joint venture properties. Does not include any data on properties owned by the Value-Added Fund. |
32
Boston Properties, Inc.
Third Quarter 2010
IN-SERVICE GREATER SAN FRANCISCO PROPERTIES
Quarterly Lease Expirations - Greater San Francisco (1) (2)
| OFFICE | OFFICE/TECHNICAL | |||||||||||||||||||||||||||||||||||||||
| Lease Expiration |
Rentable Square Footage Subject to Expiring Leases |
Current Annualized Revenues Under Expiring Leases |
Per Square Foot |
Annualized Revenues Under Expiring Leases with future step-ups |
Per Square Foot |
Rentable Square Footage Subject to Expiring Leases |
Current Annualized Revenues Under Expiring Leases |
Per Square Foot |
Annualized Revenues Under Expiring Leases with future step-ups |
Per Square Foot |
||||||||||||||||||||||||||||||
| Q1 2010 |
— | $ | — | $ | — | $ | — | $ | — | — | $ | — | $ | — | $ | — | $ | — | ||||||||||||||||||||||
| Q2 2010 |
— | — | — | — | — | — | — | — | — | — | ||||||||||||||||||||||||||||||
| Q3 2010 |
— | — | — | — | — | — | — | — | — | — | ||||||||||||||||||||||||||||||
| Q4 2010 |
311,899 | 6,002,254 | 19.24 | 6,002,254 | 19.24 | — | — | — | — | — | ||||||||||||||||||||||||||||||
| Total 2010 |
311,899 | $ | 6,002,254 | $ | 19.24 | $ | 6,002,254 | $ | 19.24 | — | $ | — | $ | — | $ | — | $ | — | ||||||||||||||||||||||
| Q1 2011 |
10,294 | $ | 464,016 | $ | 45.08 | $ | 464,016 | $ | 45.08 | — | $ | — | $ | — | $ | — | $ | — | ||||||||||||||||||||||
| Q2 2011 |
65,933 | 3,082,774 | 46.76 | 3,090,571 | 46.87 | — | — | — | — | — | ||||||||||||||||||||||||||||||
| Q3 2011 |
135,086 | 11,501,627 | 85.14 | 11,508,815 | 85.20 | — | — | — | — | — | ||||||||||||||||||||||||||||||
| Q4 2011 |
193,344 | 11,320,997 | 58.55 | 11,461,423 | 59.28 | — | — | — | — | — | ||||||||||||||||||||||||||||||
| Total 2011 |
404,657 | $ | 26,369,413 | $ | 65.16 | $ | 26,524,824 | $ | 65.55 | — | $ | — | $ | — | $ | — | $ | — | ||||||||||||||||||||||
| Retail | Total Property Types | |||||||||||||||||||||||||||||||||||||||
| Lease Expiration |
Rentable Square Footage Subject to Expiring Leases |
Current Annualized Revenues Under Expiring Leases |
Per Square Foot |
Annualized Revenues Under Expiring Leases with future step-ups |
Per Square Foot |
Rentable Square Footage Subject to Expiring Leases |
Current Annualized Revenues Under Expiring Leases |
Per Square Foot |
Annualized Revenues Under Expiring Leases with future step-ups |
Per Square Foot |
||||||||||||||||||||||||||||||
| Q1 2010 |
— | $ | — | $ | — | $ | — | $ | — | — | $ | — | $ | — | $ | — | $ | — | ||||||||||||||||||||||
| Q2 2010 |
— | — | — | — | — | — | — | — | — | — | ||||||||||||||||||||||||||||||
| Q3 2010 |
— | — | — | — | — | — | — | — | — | — | ||||||||||||||||||||||||||||||
| Q4 2010 |
42,938 | 919,552 | 21.42 | 919,552 | 21.42 | 354,837 | 6,921,806 | 19.51 | 6,921,806 | 19.51 | ||||||||||||||||||||||||||||||
| Total 2010 |
42,938 | $ | 919,552 | $ | 21.42 | $ | 919,552 | $ | 21.42 | 354,837 | $ | 6,921,806 | $ | 19.51 | $ | 6,921,806 | $ | 19.51 | ||||||||||||||||||||||
| Q1 2011 |
7,355 | $ | 369,643 | $ | 50.26 | $ | 369,643 | $ | 50.26 | 17,649 | $ | 833,658 | $ | 47.24 | $ | 833,658 | 47.24 | |||||||||||||||||||||||
| Q2 2011 |
— | — | — | — | — | 65,933 | 3,082,774 | 46.76 | 3,090,571 | 46.87 | ||||||||||||||||||||||||||||||
| Q3 2011 |
180 | 27,049 | 150.27 | 27,049 | 150.27 | 135,266 | 11,528,675 | 85.23 | 11,535,864 | 85.28 | ||||||||||||||||||||||||||||||
| Q4 2011 |
3,282 | 168,189 | 51.25 | 169,904 | 51.77 | 196,626 | 11,489,186 | 58.43 | 11,631,327 | 59.15 | ||||||||||||||||||||||||||||||
| Total 2011 |
10,817 | $ | 564,881 | $ | 52.22 | $ | 566,596 | $ | 52.38 | 415,474 | $ | 26,934,294 | $ | 64.83 | $ | 27,091,420 | $ | 65.21 | ||||||||||||||||||||||
| (1) | For disclosures relating to our definition of Annualized Revenue, see page 50. |
| (2) | Includes 100% of unconsolidated joint venture properties. Does not include any data on properties owned by the Value-Added Fund. |
33
Boston Properties, Inc.
Third Quarter 2010
IN-SERVICE MIDTOWN MANHATTAN PROPERTIES
Lease Expirations - Midtown Manhattan (1) (2)
| OFFICE | OFFICE/TECHNICAL | |||||||||||||||||||||||||||||||||||||||
| Year of Lease |
Rentable Square Footage Subject to Expiring Leases |
Current Annualized Revenues Under Expiring Leases |
Per Square Foot |
Annualized Revenues Under Expiring Leases with future step-ups |
Per Square Foot |
Rentable Square Footage Subject to Expiring Leases |
Current Annualized Revenues Under Expiring Leases |
Per Square Foot |
Annualized Revenues Under Expiring Leases with future step-ups |
Per Square Foot |
||||||||||||||||||||||||||||||
| 2010 |
83,030 | $ | 5,489,605 | $ | 66.12 | $ | 5,489,605 | $ | 66.12 | — | $ | — | $ | — | $ | — | $ | — | ||||||||||||||||||||||
| 2011 |
210,531 | 18,348,842 | 87.16 | 18,423,192 | 87.51 | — | — | — | — | — | ||||||||||||||||||||||||||||||
| 2012 |
459,993 | 37,917,445 | 82.43 | 38,107,014 | 82.84 | — | — | — | — | — | ||||||||||||||||||||||||||||||
| 2013 |
132,200 | 12,234,604 | 92.55 | 12,234,604 | 92.55 | — | — | — | — | — | ||||||||||||||||||||||||||||||
| 2014 |
200,320 | 17,042,450 | 85.08 | 17,316,001 | 86.44 | — | — | — | — | — | ||||||||||||||||||||||||||||||
| 2015 |
387,482 | 37,726,978 | 97.36 | 42,893,686 | 110.70 | — | — | — | — | — | ||||||||||||||||||||||||||||||
| 2016 |
676,892 | 52,706,432 | 77.87 | 56,912,164 | 84.08 | — | — | — | — | — | ||||||||||||||||||||||||||||||
| 2017 |
1,454,094 | 129,390,661 | 88.98 | 138,347,179 | 95.14 | — | — | — | — | — | ||||||||||||||||||||||||||||||
| 2018 |
165,376 | 21,241,394 | 128.44 | 22,909,924 | 138.53 | — | — | — | — | — | ||||||||||||||||||||||||||||||
| 2019 |
1,018,587 | 81,437,119 | 79.95 | 88,341,621 | 86.73 | — | — | — | — | — | ||||||||||||||||||||||||||||||
| Thereafter |
3,520,712 | 272,393,581 | 77.37 | 318,030,190 | 90.33 | — | — | — | — | — | ||||||||||||||||||||||||||||||
| Retail | Total Property Types | |||||||||||||||||||||||||||||||||||||||
| Year of Lease |
Rentable Square Footage Subject to Expiring Leases |
Current Annualized Revenues Under Expiring Leases |
Per Square Foot |
Annualized Revenues Under Expiring Leases with future step-ups |
Per Square Foot |
Rentable Square Footage Subject to Expiring Leases |
Current Annualized Revenues Under Expiring Leases |
Per Square Foot |
Annualized Revenues Under Expiring Leases with future step-ups |
Per Square Foot |
||||||||||||||||||||||||||||||
| 2010 |
308 | $ | 24,000 | $ | 77.92 | $ | 24,000 | $ | 77.92 | 83,338 | $ | 5,513,605 | $ | 66.16 | $ | 5,513,605 | $ | 66.16 | ||||||||||||||||||||||
| 2011 |
12,670 | 1,362,322 | 107.52 | 1,380,472 | 108.96 | 223,201 | 19,711,163 | 88.31 | 19,803,663 | 88.73 | ||||||||||||||||||||||||||||||
| 2012 |
37,412 | 4,296,720 | 114.85 | 4,354,951 | 116.41 | 497,405 | 42,214,165 | 84.87 | 42,461,965 | 85.37 | ||||||||||||||||||||||||||||||
| 2013 |
1,682 | 177,143 | 105.32 | 190,798 | 113.44 | 133,882 | 12,411,748 | 92.71 | 12,425,403 | 92.81 | ||||||||||||||||||||||||||||||
| 2014 |
11,018 | 1,329,251 | 120.64 | 1,456,989 | 132.24 | 211,338 | 18,371,702 | 86.93 | 18,772,990 | 88.83 | ||||||||||||||||||||||||||||||
| 2015 |
9,988 | 4,382,248 | 438.75 | 5,344,801 | 535.12 | 397,470 | 42,109,226 | 105.94 | 48,238,487 | 121.36 | ||||||||||||||||||||||||||||||
| 2016 |
94,476 | 13,203,765 | 139.76 | 14,557,609 | 154.09 | 771,368 | 65,910,197 | 85.45 | 71,469,773 | 92.65 | ||||||||||||||||||||||||||||||
| 2017 |
26,685 | 2,292,839 | 85.92 | 2,446,698 | 91.69 | 1,480,779 | 131,683,500 | 88.93 | 140,793,877 | 95.08 | ||||||||||||||||||||||||||||||
| 2018 |
— | — | — | — | — | 165,376 | 21,241,394 | 128.44 | 22,909,924 | 138.53 | ||||||||||||||||||||||||||||||
| 2019 |
3,877 | 396,574 | 102.29 | 492,480 | 127.03 | 1,022,464 | 81,833,693 | 80.04 | 88,834,101 | 86.88 | ||||||||||||||||||||||||||||||
| Thereafter |
98,472 | 12,752,239 | 129.50 | 16,566,319 | 168.23 | 3,619,184 | 285,145,820 | 78.79 | 334,596,509 | 92.45 | ||||||||||||||||||||||||||||||
| (1) | For disclosures relating to our definition of Annualized Revenue, see page 50. |
| (2) | Includes 100% of unconsolidated joint venture properties. Does not include any data on properties owned by the Value-Added Fund. |
34
Boston Properties, Inc.
Third Quarter 2010
IN-SERVICE MIDTOWN MANHATTAN PROPERTIES
Quarterly Lease Expirations - Midtown Manhattan (1) (2)
| OFFICE | OFFICE/TECHNICAL | |||||||||||||||||||||||||||||||||||||||
| Lease Expiration |
Rentable Square Footage Subject to Expiring Leases |
Current Annualized Revenues Under Expiring Leases |
Per Square Foot |
Annualized Revenues Under Expiring Leases with future step-ups |
Per Square Foot |
Rentable Square Footage Subject to Expiring Leases |
Current Annualized Revenues Under Expiring Leases |
Per Square Foot |
Annualized Revenues Under Expiring Leases with future step-ups |
Per Square Foot |
||||||||||||||||||||||||||||||
| Q1 2010 |
— | $ | — | $ | — | $ | — | $ | — | — | $ | — | $ | — | $ | — | $ | — | ||||||||||||||||||||||
| Q2 2010 |
— | — | — | — | — | — | — | — | — | — | ||||||||||||||||||||||||||||||
| Q3 2010 |
— | — | — | — | — | — | — | — | — | — | ||||||||||||||||||||||||||||||
| Q4 2010 |
83,030 | 5,489,605 | 66.12 | 5,489,605 | 66.12 | — | — | — | — | — | ||||||||||||||||||||||||||||||
| Total 2010 |
83,030 | $ | 5,489,605 | $ | 66.12 | $ | 5,489,605 | $ | 66.12 | — | $ | — | $ | — | $ | — | $ | — | ||||||||||||||||||||||
| Q1 2011 |
34,929 | $ | 2,309,966 | $ | 66.13 | $ | 2,295,516 | $ | 65.72 | — | $ | — | $ | — | $ | — | $ | — | ||||||||||||||||||||||
| Q2 2011 |
82,781 | 7,056,112 | 85.24 | 7,078,366 | 85.51 | — | — | — | — | — | ||||||||||||||||||||||||||||||
| Q3 2011 |
24,834 | 1,518,675 | 61.15 | 1,518,675 | 61.15 | — | — | — | — | — | ||||||||||||||||||||||||||||||
| Q4 2011 |
67,987 | 7,464,088 | 109.79 | 7,530,635 | 110.77 | — | — | — | — | — | ||||||||||||||||||||||||||||||
| Total 2011 |
210,531 | $ | 18,348,842 | $ | 87.16 | $ | 18,423,192 | $ | 87.51 | — | $ | — | $ | — | $ | — | $ | — | ||||||||||||||||||||||
| Retail | Total Property Types | |||||||||||||||||||||||||||||||||||||||
| Lease Expiration |
Rentable Square Footage Subject to Expiring Leases |
Current Annualized Revenues Under Expiring Leases |
Per Square Foot |
Annualized Revenues Under Expiring Leases with future step-ups |
Per Square Foot |
Rentable Square Footage Subject to Expiring Leases |
Current Annualized Revenues Under Expiring Leases |
Per Square Foot |
Annualized Revenues Under Expiring Leases with future step-ups |
Per Square Foot |
||||||||||||||||||||||||||||||
| Q1 2010 |
— | $ | — | $ | — | $ | — | $ | — | — | $ | — | $ | — | $ | — | $ | — | ||||||||||||||||||||||
| Q2 2010 |
— | — | — | — | — | — | — | — | — | — | ||||||||||||||||||||||||||||||
| Q3 2010 |
— | — | — | — | — | — | — | — | — | — | ||||||||||||||||||||||||||||||
| Q4 2010 |
308 | 24,000 | 77.92 | 24,000 | 77.92 | 83,338 | 5,513,605 | 66.16 | 5,513,605 | 66.16 | ||||||||||||||||||||||||||||||
| Total 2010 |
308 | $ | 24,000 | $ | 77.92 | $ | 24,000 | $ | 77.92 | 83,338 | $ | 5,513,605 | $ | 66.16 | $ | 5,513,605 | $ | 66.16 | ||||||||||||||||||||||
| Q1 2011 |
715 | $ | 101,492 | $ | 141.95 | $ | 101,492 | $ | 141.95 | 35,644 | $ | 2,411,458 | $ | 67.65 | $ | 2,397,007 | $ | 67.25 | ||||||||||||||||||||||
| Q2 2011 |
1,200 | 169,545 | 141.29 | 169,545 | 141.29 | 83,981 | 7,225,657 | 86.04 | 7,247,911 | 86.30 | ||||||||||||||||||||||||||||||
| Q3 2011 |
1,605 | 437,588 | 272.64 | 437,588 | 272.64 | 26,439 | 1,956,263 | 73.99 | 1,956,263 | 73.99 | ||||||||||||||||||||||||||||||
| Q4 2011 |
9,150 | 653,697 | 71.44 | 671,847 | 73.43 | 77,137 | 8,117,785 | 105.24 | 8,202,481 | 106.34 | ||||||||||||||||||||||||||||||
| Total 2011 |
12,670 | $ | 1,362,322 | $ | 107.52 | $ | 1,380,472 | $ | 108.96 | 223,201 | $ | 19,711,163 | $ | 88.31 | $ | 19,803,663 | $ | 88.73 | ||||||||||||||||||||||
| (1) | For disclosures relating to our definition of Annualized Revenue, see page 50. |
| (2) | Includes 100% of unconsolidated joint venture properties. Does not include any data on properties owned by the Value-Added Fund. |
35
Boston Properties, Inc.
Third Quarter 2010
IN-SERVICE PRINCETON/EAST BRUNSWICK PROPERTIES
Lease Expirations - Princeton/East Brunswick (1) (2)
| OFFICE | OFFICE/TECHNICAL | |||||||||||||||||||||||||||||||||||||||
| Year of Lease |
Rentable Square Footage Subject to Expiring Leases |
Current Annualized Revenues Under Expiring Leases |
Per Square Foot |
Annualized Revenues Under Expiring Leases with future step-ups |
Per Square Foot |
Rentable Square Footage Subject to Expiring Leases |
Current Annualized Revenues Under Expiring Leases |
Per Square Foot |
Annualized Revenues Under Expiring Leases with future step-ups |
Per Square Foot |
||||||||||||||||||||||||||||||
| 2010 |
56,751 | $ | 1,963,791 | $ | 34.60 | $ | 1,963,791 | $ | 34.60 | — | $ | — | $ | — | $ | — | $ | — | ||||||||||||||||||||||
| 2011 |
308,893 | 10,955,422 | 35.47 | 10,946,431 | 35.44 | — | — | — | — | — | ||||||||||||||||||||||||||||||
| 2012 |
49,644 | 1,714,205 | 34.53 | 1,714,205 | 34.53 | — | — | — | — | — | ||||||||||||||||||||||||||||||
| 2013 |
227,378 | 7,650,545 | 33.65 | 7,846,751 | 34.51 | — | — | — | — | — | ||||||||||||||||||||||||||||||
| 2014 |
686,206 | 22,688,038 | 33.06 | 23,644,560 | 34.46 | — | — | — | — | — | ||||||||||||||||||||||||||||||
| 2015 |
190,584 | 5,925,116 | 31.09 | 6,287,864 | 32.99 | — | — | — | — | — | ||||||||||||||||||||||||||||||
| 2016 |
62,348 | 2,041,366 | 32.74 | 2,173,031 | 34.85 | — | — | — | — | — | ||||||||||||||||||||||||||||||
| 2017 |
147,880 | 4,328,251 | 29.27 | 4,522,025 | 30.58 | — | — | — | — | — | ||||||||||||||||||||||||||||||
| 2018 |
— | — | — | — | — | — | — | — | — | — | ||||||||||||||||||||||||||||||
| 2019 |
148,760 | 4,442,996 | 29.87 | 4,977,041 | 33.46 | — | — | — | — | — | ||||||||||||||||||||||||||||||
| Thereafter |
120,000 | 4,358,112 | 36.32 | 4,838,112 | 40.32 | — | — | — | — | — | ||||||||||||||||||||||||||||||
| Retail | Total Property Types | |||||||||||||||||||||||||||||||||||||||
| Year of Lease |
Rentable Square Footage Subject to Expiring Leases |
Current Annualized Revenues Under Expiring Leases |
Per Square Foot |
Annualized Revenues Under Expiring Leases with future step-ups |
Per Square Foot |
Rentable Square Footage Subject to Expiring Leases |
Current Annualized Revenues Under Expiring Leases |
Per Square Foot |
Annualized Revenues Under Expiring Leases with future step-ups |
Per Square Foot |
||||||||||||||||||||||||||||||
| 2010 |
— | $ | — | $ | — | $ | — | $ | — | 56,751 | $ | 1,963,791 | $ | 34.60 | $ | 1,963,791 | $ | 34.60 | ||||||||||||||||||||||
| 2011 |
— | — | — | — | — | 308,893 | 10,955,422 | 35.47 | 10,946,431 | 35.44 | ||||||||||||||||||||||||||||||
| 2012 |
— | — | — | — | — | 49,644 | 1,714,205 | 34.53 | 1,714,205 | 34.53 | ||||||||||||||||||||||||||||||
| 2013 |
— | — | — | — | — | 227,378 | 7,650,545 | 33.65 | 7,846,751 | 34.51 | ||||||||||||||||||||||||||||||
| 2014 |
— | — | — | — | — | 686,206 | 22,688,038 | 33.06 | 23,644,560 | 34.46 | ||||||||||||||||||||||||||||||
| 2015 |
— | — | — | — | — | 190,584 | 5,925,116 | 31.09 | 6,287,864 | 32.99 | ||||||||||||||||||||||||||||||
| 2016 |
— | — | — | — | — | 62,348 | 2,041,366 | 32.74 | 2,173,031 | 34.85 | ||||||||||||||||||||||||||||||
| 2017 |
— | — | — | — | — | 147,880 | 4,328,251 | 29.27 | 4,522,025 | 30.58 | ||||||||||||||||||||||||||||||
| 2018 |
— | — | — | — | — | — | — | — | — | — | ||||||||||||||||||||||||||||||
| 2019 |
— | — | — | — | — | 148,760 | 4,442,996 | 29.87 | 4,977,041 | 33.46 | ||||||||||||||||||||||||||||||
| Thereafter |
— | — | — | — | — | 120,000 | 4,358,112 | 36.32 | 4,838,112 | 40.32 | ||||||||||||||||||||||||||||||
| — | — | — | — | — | ||||||||||||||||||||||||||||||||||||
| (1) | For disclosures relating to our definition of Annualized Revenue, see page 50. |
| (2) | Includes 100% of unconsolidated joint venture properties. Does not include any data on properties owned by the Value-Added Fund. |
36
Boston Properties, Inc.
Third Quarter 2010
IN-SERVICE PRINCETON/EAST BRUNSWICK PROPERTIES
Quarterly Lease Expirations - Princeton/East Brunswick (1) (2)
| OFFICE | OFFICE/TECHNICAL | |||||||||||||||||||||||||||||||||||||||
| Lease Expiration |
Rentable Square Footage Subject to Expiring Leases |
Current Annualized Revenues Under Expiring Leases |
Per Square Foot |
Annualized Revenues Under Expiring Leases with future step-ups |
Per Square Foot |
Rentable Square Footage Subject to Expiring Leases |
Current Annualized Revenues Under Expiring Leases |
Per Square Foot |
Annualized Revenues Under Expiring Leases with future step-ups |
Per Square Foot |
||||||||||||||||||||||||||||||
| Q1 2010 |
— | $ | — | $ | — | $ | — | $ | — | — | $ | — | $ | — | $ | — | $ | — | ||||||||||||||||||||||
| Q2 2010 |
— | — | — | — | — | — | — | — | — | — | ||||||||||||||||||||||||||||||
| Q3 2010 |
— | — | — | — | — | — | — | — | — | — | ||||||||||||||||||||||||||||||
| Q4 2010 |
56,751 | 1,963,791 | 34.60 | 1,963,791 | 34.60 | — | — | — | — | — | ||||||||||||||||||||||||||||||
| Total 2010 |
56,751 | $ | 1,963,791 | $ | 34.60 | $ | 1,963,791 | $ | 34.60 | — | $ | — | $ | — | $ | — | $ | — | ||||||||||||||||||||||
| Q1 2011 |
110,728 | $ | 3,925,194 | $ | 35.45 | $ | 3,925,194 | $ | 35.45 | — | $ | — | $ | — | $ | — | $ | — | ||||||||||||||||||||||
| Q2 2011 |
3,477 | 116,212 | 33.42 | 119,689 | 34.42 | — | — | — | — | — | ||||||||||||||||||||||||||||||
| Q3 2011 |
117,093 | 4,196,847 | 35.84 | 4,184,379 | 35.74 | — | — | — | — | — | ||||||||||||||||||||||||||||||
| Q4 2011 |
77,595 | 2,717,170 | 35.02 | 2,717,170 | 35.02 | — | — | — | — | — | ||||||||||||||||||||||||||||||
| Total 2011 |
308,893 | $ | 10,955,422 | $ | 35.47 | $ | 10,946,431 | $ | 35.44 | — | $ | — | $ | — | $ | — | $ | — | ||||||||||||||||||||||
| Retail | Total Property Types | |||||||||||||||||||||||||||||||||||||||
| Lease Expiration |
Rentable Square Footage Subject to Expiring Leases |
Current Annualized Revenues Under Expiring Leases |
Per Square Foot |
Annualized Revenues Under Expiring Leases with future step-ups |
Per Square Foot |
Rentable Square Footage Subject to Expiring Leases |
Current Annualized Revenues Under Expiring Leases |
Per Square Foot |
Annualized Revenues Under Expiring Leases with future step-ups |
Per Square Foot |
||||||||||||||||||||||||||||||
| Q1 2010 |
— | $ | — | $ | — | $ | — | $ | — | — | $ | — | $ | — | $ | — | $ | — | ||||||||||||||||||||||
| Q2 2010 |
— | — | — | — | — | — | — | — | — | — | ||||||||||||||||||||||||||||||
| Q3 2010 |
— | — | — | — | — | — | — | — | — | — | ||||||||||||||||||||||||||||||
| Q4 2010 |
— | — | — | — | — | 56,751 | 1,963,791 | 34.60 | 1,963,791 | 34.60 | ||||||||||||||||||||||||||||||
| Total 2010 |
— | $ | — | $ | — | $ | — | $ | — | 56,751 | $ | 1,963,791 | $ | 34.60 | $ | 1,963,791 | $ | 34.60 | (3) | |||||||||||||||||||||
| Q1 2011 |
— | $ | — | $ | — | $ | — | $ | — | 110,728 | $ | 3,925,194 | $ | 35.45 | $ | 3,925,194 | $ | 35.45 | ||||||||||||||||||||||
| Q2 2011 |
— | — | — | — | — | 3,477 | 116,212 | 33.42 | 119,689 | 34.42 | ||||||||||||||||||||||||||||||
| Q3 2011 |
— | — | — | — | — | 117,093 | 4,196,847 | 35.84 | 4,184,379 | 35.74 | ||||||||||||||||||||||||||||||
| Q4 2011 |
— | — | — | — | — | 77,595 | 2,717,170 | 35.02 | 2,717,170 | 35.02 | ||||||||||||||||||||||||||||||
| Total 2011 |
— | $ | — | $ | — | $ | — | $ | — | 308,893 | $ | 10,955,422 | $ | 35.47 | $ | 10,946,431 | $ | 35.44 | ||||||||||||||||||||||
| (1) | For disclosures relating to our definition of Annualized Revenue, see page 50. |
| (2) | Includes 100% of unconsolidated joint venture properties. Does not include any data on properties owned by the Value-Added Fund. |
| (3) | Includes holdover rent on 9,024 square feet. Excluding holdover rent, the expiring rental rate would be $35.98 per square foot. |
37
Boston Properties, Inc.
Third Quarter 2010
CBD PROPERTIES
Lease Expirations (1) (2)
| Greater Boston | Greater Washington | |||||||||||||||||||||||||||||||||||||||
| Year of Lease Expiration |
Rentable Square Footage Subject to Expiring Leases |
Current Annualized Revenues Under Expiring Leases |
Per Square Foot |
Annualized Revenues Under Expiring Leases with future step-ups |
Per Square Foot |
Rentable Square Footage Subject to Expiring Leases |
Current Annualized Revenues Under Expiring Leases |
Per Square Foot |
Annualized Revenues Under Expiring Leases with future step-ups |
Per Square Foot |
||||||||||||||||||||||||||||||
| 2010 |
30,668 | $ | 1,906,523 | $ | 62.17 | $ | 1,918,523 | $ | 62.56 | 110,002 | $ | 5,402,981 | $ | 49.12 | $ | 5,402,981 | $ | 49.12 | ||||||||||||||||||||||
| 2011 |
292,846 | 16,439,437 | 56.14 | 16,404,112 | 56.02 | 285,982 | 12,990,444 | 45.42 | 13,025,433 | 45.55 | ||||||||||||||||||||||||||||||
| 2012 |
297,775 | 12,872,351 | 43.23 | 12,973,552 | 43.57 | 191,595 | 8,691,154 | 45.36 | 8,785,905 | 45.86 | ||||||||||||||||||||||||||||||
| 2013 |
307,007 | 17,275,821 | 56.27 | 17,930,991 | 58.41 | 34,022 | 1,709,739 | 50.25 | 1,796,207 | 52.80 | ||||||||||||||||||||||||||||||
| 2014 |
376,189 | 16,148,222 | 42.93 | 16,366,597 | 43.51 | 554,920 | 22,446,925 | 40.45 | 28,768,748 | 51.84 | ||||||||||||||||||||||||||||||
| 2015 |
396,596 | 19,164,705 | 48.32 | 20,313,393 | 51.22 | 344,732 | 19,589,218 | 56.82 | 21,245,347 | 61.63 | ||||||||||||||||||||||||||||||
| 2016 |
296,421 | 22,711,670 | 76.62 | 23,302,740 | 78.61 | (3) | 57,782 | 2,817,476 | 48.76 | 3,174,171 | 54.93 | |||||||||||||||||||||||||||||
| 2017 |
218,659 | 12,634,988 | 57.78 | 14,518,047 | 66.40 | 782,697 | 43,508,322 | 55.59 | 46,624,669 | 59.57 | ||||||||||||||||||||||||||||||
| 2018 |
171,701 | 7,327,968 | 42.68 | 7,644,861 | 44.52 | 66,223 | 4,250,492 | 64.18 | 4,871,639 | 73.56 | ||||||||||||||||||||||||||||||
| 2019 |
327,833 | 14,921,069 | 45.51 | 16,450,632 | 50.18 | 696,330 | 36,830,124 | 52.89 | 45,317,336 | 65.08 | ||||||||||||||||||||||||||||||
| Thereafter |
1,667,528 | 87,088,760 | 52.23 | 96,449,458 | 57.84 | 875,980 | 46,736,515 | 53.35 | 59,945,519 | 68.43 | ||||||||||||||||||||||||||||||
| New York | San Francisco | |||||||||||||||||||||||||||||||||||||||
| Year of Lease Expiration |
Rentable Square Footage Subject to Expiring Leases |
Current Annualized Revenues Under Expiring Leases |
Per Square Foot |
Annualized Revenues Under Expiring Leases with future step-ups |
Per Square Foot |
Rentable Square Footage Subject to Expiring Leases |
Current Annualized Revenues Under Expiring Leases |
Per Square Foot |
Annualized Revenues Under Expiring Leases with future step-ups |
Per Square Foot |
||||||||||||||||||||||||||||||
| 2010 |
83,338 | $ | 5,513,605 | $ | 66.16 | $ | 5,513,605 | $ | 66.16 | 82,537 | $ | 2,697,279 | $ | 32.68 | $ | 2,697,279 | $ | 32.68 | ||||||||||||||||||||||
| 2011 |
223,201 | 19,711,163 | 88.31 | 19,803,663 | 88.73 | 330,696 | 25,048,452 | 75.74 | 25,160,336 | 76.08 | ||||||||||||||||||||||||||||||
| 2012 |
497,405 | 42,214,165 | 84.87 | 42,461,965 | 85.37 | 266,734 | 15,051,213 | 56.43 | 15,268,116 | 57.24 | ||||||||||||||||||||||||||||||
| 2013 |
133,882 | 12,411,748 | 92.71 | 12,425,403 | 92.81 | 234,121 | 11,436,901 | 48.85 | 11,717,673 | 50.05 | ||||||||||||||||||||||||||||||
| 2014 |
211,338 | 18,371,702 | 86.93 | 18,772,990 | 88.83 | 227,147 | 10,475,182 | 46.12 | 10,905,804 | 48.01 | ||||||||||||||||||||||||||||||
| 2015 |
397,470 | 42,109,226 | 105.94 | 48,238,487 | 121.36 | 258,095 | 11,753,394 | 45.54 | 12,645,331 | 48.99 | ||||||||||||||||||||||||||||||
| 2016 |
771,368 | 65,910,197 | 85.45 | 71,469,773 | 92.65 | 873,175 | 37,795,748 | 43.29 | 40,042,107 | 45.86 | ||||||||||||||||||||||||||||||
| 2017 |
1,480,779 | 131,683,500 | 88.93 | 140,793,877 | 95.08 | 211,316 | 10,149,580 | 48.03 | 10,446,827 | 49.44 | ||||||||||||||||||||||||||||||
| 2018 |
165,376 | 21,241,394 | 128.44 | 22,909,924 | 138.53 | 75,187 | 4,355,114 | 57.92 | 4,885,383 | 64.98 | ||||||||||||||||||||||||||||||
| 2019 |
1,022,464 | 81,833,693 | 80.04 | 88,834,101 | 86.88 | 86,339 | 3,841,548 | 44.49 | 4,213,007 | 48.80 | ||||||||||||||||||||||||||||||
| Thereafter |
3,619,184 | 285,145,820 | 78.79 | 334,596,509 | 92.45 | 519,324 | 27,890,685 | 53.71 | 30,705,988 | 59.13 | ||||||||||||||||||||||||||||||
| Princeton/East Brunswick | Other | |||||||||||||||||||||||||||||||||||||||
| Year of Lease Expiration |
Rentable Square Footage Subject to Expiring Leases |
Current Annualized Revenues Under Expiring Leases |
Per Square Foot |
Annualized Revenues Under Expiring Leases with future step-ups |
Per Square Foot |
Rentable Square Footage Subject to Expiring Leases |
Current Annualized Revenues Under Expiring Leases |
Per Square Foot |
Annualized Revenues Under Expiring Leases with future step-ups |
Per Square Foot |
||||||||||||||||||||||||||||||
| 2010 |
— | $ | — | $ | — | $ | — | $ | — | — | $ | — | $ | — | $ | — | $ | — | ||||||||||||||||||||||
| 2011 |
— | — | — | — | — | — | — | — | — | — | ||||||||||||||||||||||||||||||
| 2012 |
— | — | — | — | — | — | — | — | — | — | ||||||||||||||||||||||||||||||
| 2013 |
— | — | — | — | — | — | — | — | — | — | ||||||||||||||||||||||||||||||
| 2014 |
— | — | — | — | — | — | — | — | — | — | ||||||||||||||||||||||||||||||
| 2015 |
— | — | — | — | — | — | — | — | — | — | ||||||||||||||||||||||||||||||
| 2016 |
— | — | — | — | — | — | — | — | — | — | ||||||||||||||||||||||||||||||
| 2017 |
— | — | — | — | — | — | — | — | — | — | ||||||||||||||||||||||||||||||
| 2018 |
— | — | — | — | — | — | — | — | — | — | ||||||||||||||||||||||||||||||
| 2019 |
— | — | — | — | — | — | — | — | — | — | ||||||||||||||||||||||||||||||
| Thereafter |
— | — | — | — | — | — | — | — | — | — | ||||||||||||||||||||||||||||||
| (1) | For disclosures relating to our definition of Annualized Revenue, see page 50. |
| (2) | Includes 100% of unconsolidated joint venture properties. Does not include any data on properties owned by the Value-Added Fund. |
| (3) | Includes 225,532 square feet of research/laboratory space. Excluding the research/laboratory space, current and future expiring rents would be $51.15 per square foot and $55.43 per square foot in 2016. |
38
Boston Properties, Inc.
Third Quarter 2010
SUBURBAN PROPERTIES
Lease Expirations (1) (2)
| Greater Boston | Greater Washington | |||||||||||||||||||||||||||||||||||||||
| Year of Lease |
Rentable Square Footage Subject to Expiring Leases |
Current Annualized Revenues Under Expiring Leases |
Per Square Foot |
Annualized Revenues Under Expiring Leases with future step-ups |
Per Square Foot |
Rentable Square Footage Subject to Expiring Leases |
Current Annualized Revenues Under Expiring Leases |
Per Square Foot |
Annualized Revenues Under Expiring Leases with future step-ups |
Per Square Foot |
||||||||||||||||||||||||||||||
| 2010 |
120,299 | $ | 3,957,599 | $ | 32.90 | $ | 3,957,599 | $ | 32.90 | 262,629 | $ | 6,013,680 | $ | 22.90 | $ | 6,013,680 | $ | 22.90 | ||||||||||||||||||||||
| 2011 |
543,598 | 15,271,578 | 28.09 | 14,681,156 | 27.01 | 806,082 | 38,473,367 | 47.73 | 38,588,964 | 47.87 | (3)(4) | |||||||||||||||||||||||||||||
| 2012 |
807,895 | 26,237,291 | 32.48 | 26,567,585 | 32.88 | 1,015,831 | 41,879,349 | 41.23 | 42,658,581 | 41.99 | (5) | |||||||||||||||||||||||||||||
| 2013 |
242,720 | 7,392,140 | 30.46 | 7,802,930 | 32.15 | 154,444 | 7,871,682 | 50.97 | 8,130,758 | 52.65 | ||||||||||||||||||||||||||||||
| 2014 |
206,369 | 5,904,453 | 28.61 | 6,090,887 | 29.51 | 676,257 | 21,810,611 | 32.25 | 23,373,778 | 34.56 | ||||||||||||||||||||||||||||||
| 2015 |
423,061 | 13,158,057 | 31.10 | 14,562,254 | 34.42 | 417,108 | 13,272,843 | 31.82 | 15,646,859 | 37.51 | ||||||||||||||||||||||||||||||
| 2016 |
273,150 | 8,765,904 | 32.09 | 9,524,963 | 34.87 | 384,951 | 14,932,810 | 38.79 | 17,157,884 | 44.57 | ||||||||||||||||||||||||||||||
| 2017 |
196,374 | 6,360,957 | 32.39 | 7,089,705 | 36.10 | 98,880 | 4,082,825 | 41.29 | 4,825,886 | 48.81 | ||||||||||||||||||||||||||||||
| 2018 |
12,123 | 425,188 | 35.07 | 422,960 | 34.89 | 311,185 | 14,878,989 | 47.81 | 17,538,118 | 56.36 | ||||||||||||||||||||||||||||||
| 2019 |
264,803 | 11,022,090 | 41.62 | 11,990,476 | 45.28 | 424,754 | 17,163,271 | 40.41 | 18,082,469 | 42.57 | ||||||||||||||||||||||||||||||
| Thereafter |
594,143 | 19,892,748 | 33.48 | 24,708,775 | 41.59 | 1,285,698 | 52,313,875 | 88.05 | 65,658,039 | 51.07 | ||||||||||||||||||||||||||||||
| New York | San Francisco | |||||||||||||||||||||||||||||||||||||||
| Year of Lease |
Rentable Square Footage Subject to Expiring Leases |
Current Annualized Revenues Under Expiring Leases |
Per Square Foot |
Annualized Revenues Under Expiring Leases with future step-ups |
Per Square Foot |
Rentable Square Footage Subject to Expiring Leases |
Current Annualized Revenues Under Expiring Leases |
Per Square Foot |
Annualized Revenues Under Expiring Leases with future step-ups |
Per Square Foot |
||||||||||||||||||||||||||||||
| 2010 |
— | $ | — | $ | — | $ | — | $ | — | 272,300 | $ | 4,224,527 | $ | 15.51 | $ | 4,224,527 | $ | 15.51 | ||||||||||||||||||||||
| 2011 |
— | — | — | — | — | 84,778 | 1,885,841 | 22.24 | 1,931,085 | 22.78 | ||||||||||||||||||||||||||||||
| 2012 |
— | — | — | — | — | 38,543 | 1,308,910 | 33.96 | 1,373,202 | 35.63 | ||||||||||||||||||||||||||||||
| 2013 |
— | — | — | — | — | 311,087 | 5,058,902 | 16.26 | 5,156,263 | 16.57 | ||||||||||||||||||||||||||||||
| 2014 |
— | — | — | — | — | 256,302 | 8,852,086 | 34.54 | 9,313,429 | 36.34 | ||||||||||||||||||||||||||||||
| 2015 |
— | — | — | — | — | 242,815 | 7,807,354 | 32.15 | 8,723,013 | 35.92 | ||||||||||||||||||||||||||||||
| 2016 |
— | — | — | — | — | 128,388 | 3,260,151 | 25.39 | 3,709,280 | 28.89 | ||||||||||||||||||||||||||||||
| 2017 |
— | — | — | — | — | 93,521 | 3,119,962 | 33.36 | 3,815,548 | 40.80 | ||||||||||||||||||||||||||||||
| 2018 |
— | — | — | — | — | — | — | — | — | — | ||||||||||||||||||||||||||||||
| 2019 |
— | — | — | — | — | — | — | — | — | — | ||||||||||||||||||||||||||||||
| Thereafter |
— | — | — | — | — | — | — | — | — | — | ||||||||||||||||||||||||||||||
| Princeton/East Brunswick | Other | |||||||||||||||||||||||||||||||||||||||
| Year of Lease Expiration |
Rentable Square Footage Subject to Expiring Leases |
Current Annualized Revenues Under Expiring Leases |
Per Square Foot |
Annualized Revenues Under Expiring Leases with future step-ups |
Per Square Foot |
Rentable Square Footage Subject to Expiring Leases |
Current Annualized Revenues Under Expiring Leases |
Per Square Foot |
Annualized Revenues Under Expiring Leases with future step-ups |
Per Square Foot |
||||||||||||||||||||||||||||||
| 2010 |
56,751 | $ | 1,963,791 | $ | 34.60 | $ | 1,963,791 | $ | 34.60 | — | $ | — | $ | — | $ |
— |
|
$ | — | |||||||||||||||||||||
| 2011 |
308,893 | 10,955,422 | 35.47 | 10,946,431 | 35.44 | — | — | — | — | — | ||||||||||||||||||||||||||||||
| 2012 |
49,644 | 1,714,205 | 34.53 | 1,714,205 | 34.53 | — | — | — | — | — | ||||||||||||||||||||||||||||||
| 2013 |
227,378 | 7,650,545 | 33.65 | 7,846,751 | 34.51 | — | — | — | — | — | ||||||||||||||||||||||||||||||
| 2014 |
686,206 | 22,688,038 | 33.06 | 23,644,560 | 34.46 | — | — | — | — | — | ||||||||||||||||||||||||||||||
| 2015 |
190,584 | 5,925,116 | 31.09 | 6,287,864 | 32.99 | — | — | — | — | — | ||||||||||||||||||||||||||||||
| 2016 |
62,348 | 2,041,366 | 32.74 | 2,173,031 | 34.85 | — | — | — | — | — | ||||||||||||||||||||||||||||||
| 2017 |
147,880 | 4,328,251 | 29.27 | 4,522,025 | 30.58 | — | — | — | — | — | ||||||||||||||||||||||||||||||
| 2018 |
— | — | — | — | — | — | — | — | — | — | ||||||||||||||||||||||||||||||
| 2019 |
148,760 | 4,442,996 | 29.87 | 4,977,041 | 33.46 | — | — | — | — | — | ||||||||||||||||||||||||||||||
| Thereafter |
120,000 | 4,358,112 | 36.32 | 4,838,112 | 40.32 | — | — | — | — | — | ||||||||||||||||||||||||||||||
| (1) | For disclosures relating to our definition of Annualized Revenue, see page 50. |
| (2) | Includes 100% of unconsolidated joint venture properties. Does not include any data on properties owned by the Value-Added Fund. |
| (3) | Includes 85,375 square feet of SCIF space. Excluding the SCIF space, the current and future expiring rental rate would be $30.97 per square foot and $31.21 per square foot. |
| (4) | Includes 267,870 square feet of space to be taken out of service for redevelopment, see page 47 for further details. |
| (5) | Includes 255,244 square feet of space to be taken out of service for redevelopment, see page 47 for further details. |
39
Boston Properties, Inc.
Third Quarter 2010
HOTEL PERFORMANCE
Cambridge Center Marriott
| Third Quarter 2010 |
Third Quarter 2009 |
Percent Change |
Year to Date 2010 |
Year to Date 2009 |
Percent Change |
|||||||||||||||||||
| Occupancy |
84.1 | % | 79.2 | % | 6.2 | % | 80.3 | % | 75.4 | % | 6.5 | % | ||||||||||||
| Average Daily Rate |
$ | 198.69 | $ | 172.31 | 15.3 | % | $ | 188.59 | $ | 179.34 | 5.2 | % | ||||||||||||
| Revenue per available room |
$ | 167.00 | $ | 136.61 | 22.2 | % | $ | 151.42 | $ | 135.30 | 11.9 | % | ||||||||||||
| OCCUPANCY ANALYSIS
|
| |||||||||||||||||||||||
| Same Property Occupancy(1) - By Location
|
| |||||||||||||||||||||||
| CBD | Suburban | Total | ||||||||||||||||||||||
| Location |
30-Sep-10 | 30-Sep-09 | 30-Sep-10 | 30-Sep-09 | 30-Sep-10 | 30-Sep-09 | ||||||||||||||||||
| Greater Boston |
93.0 | % | 96.0 | % | 80.6 | % | 86.3 | % | 87.2 | % | 91.5 | % | ||||||||||||
| Greater Washington |
98.4 | % | 99.4 | % | 97.2 | % | 93.3 | % | 97.7 | % | 95.7 | % | ||||||||||||
| Midtown Manhattan |
97.6 | % | 93.7 | % | n/a | n/a | 97.6 | % | 93.7 | % | ||||||||||||||
| Princeton/East Brunswick, NJ |
n/a | n/a | 81.6 | % | 81.3 | % | 81.6 | % | 81.3 | % | ||||||||||||||
| Greater San Francisco |
91.6 | % | 91.0 | % | 96.1 | % | 90.1 | % | 92.9 | % | 90.7 | % | ||||||||||||
| Total Portfolio |
95.7 | % | 94.8 | % | 89.4 | % | 88.8 | % | 93.2 | % | 92.4 | % | ||||||||||||
| Same Property Occupancy(1) - By Type of Property
|
| |||||||||||||||||||||||
| CBD | Suburban | Total | ||||||||||||||||||||||
| 30-Sep-10 | 30-Sep-09 | 30-Sep-10 | 30-Sep-09 | 30-Sep-10 | 30-Sep-09 | |||||||||||||||||||
| Total Office Portfolio |
95.6 | % | 94.7 | % | 90.2 | % | 89.5 | % | 93.6 | % | 92.8 | % | ||||||||||||
| Total Office/Technical Portfolio |
100.0 | % | 100.0 | % | 82.1 | % | 82.1 | % | 85.5 | % | 85.5 | % | ||||||||||||
| Total Portfolio |
95.7 | % | 94.8 | % | 89.4 | % | 88.8 | % | 93.2 | % | 92.4 | % | ||||||||||||
| (1) | For disclosures related to our definition of Same Property, see page 50. |
40
Boston Properties, Inc.
Third Quarter 2010
SAME PROPERTY PERFORMANCE
Office, Office/Technical and Hotel Properties
| Office | Office/ Technical |
Hotel (1) | Total | |||||||||||||
| Number of Properties |
116 | 19 | 1 | 136 | ||||||||||||
| Square feet |
33,383,997 | 1,590,387 | 330,400 | 35,304,784 | ||||||||||||
| Percent of in-service properties |
97.4 | % | 100.0 | % | 100.0 | % | 97.5 | % | ||||||||
| Occupancy @ 09/30/09 |
92.8 | % | 85.5 | % | — | 92.4 | % | |||||||||
| Occupancy @ 09/30/10 |
93.6 | % | 85.5 | % | — | 93.2 | % | |||||||||
| Percent change from 3rd quarter 2010 over 3rd quarter 2009 (2): |
||||||||||||||||
| Rental revenue |
0.8 | % | -0.7 | % | 20.6 | % | ||||||||||
| Operating expenses and real estate taxes |
-1.7 | % | 1.4 | % | 14.3 | % | ||||||||||
| Consolidated Net Operating Income (3) - excluding hotel |
2.0 | %(2) | ||||||||||||||
| Consolidated Net Operating Income (3) - Hotel |
47.9 | %(2) | ||||||||||||||
| Net Operating Income - BXP’s share of unconsolidated joint ventures (3) (4) |
-2.7 | % (2) | ||||||||||||||
| Portfolio Net Operating Income (3) |
1.2 | % | ||||||||||||||
| Rental revenue - cash basis |
-1.1 | % | 0.2 | % | 20.6 | % | ||||||||||
| Consolidated Net Operating Income (3) - cash basis (5) excluding hotel |
-0.8 | % | -0.4 | % | -0.8 | % (2) | ||||||||||
| Consolidated Net Operating Income (3) - cash basis (5) - Hotel |
47.8 | %(2) | ||||||||||||||
| Net Operating Income - cash basis (5) - BXP’s share of unconsolidated joint ventures |
|
11.0 | %(2) | |||||||||||||
| Portfolio Net Operating Income (3) - cash basis (5) |
1.0 | % | ||||||||||||||
| Same Property Lease Analysis - quarter ended September 30, 2010
|
| |||||||||||||||
| Office | Office/ Technical |
Total | ||||||||||||||
| Vacant space available @ 7/1/2010 (sf) |
2,268,766 | 245,706 | 2,514,472 | |||||||||||||
| Square footage of leases expiring or terminated 7/1/2010-9/30/2010 |
654,245 | — | 654,245 | |||||||||||||
| Total space for lease (sf) |
2,923,011 | 245,706 | 3,168,717 | |||||||||||||
| New tenants (sf) |
615,587 | 14,338 | 629,925 | |||||||||||||
| Renewals (sf) |
163,804 | — | 163,804 | |||||||||||||
| Total space leased (sf) |
779,391 | 14,338 | 793,729 | |||||||||||||
| Space available @ 9/30/2010 (sf) |
2,143,620 | 231,368 | 2,374,988 | |||||||||||||
| Net (increase)/decrease in available space (sf) |
125,146 | 14,338 | 139,484 | |||||||||||||
| 2nd generation Average lease term (months) |
94 | 61 | 93 | |||||||||||||
| 2nd generation Average free rent (days) |
113 | 39 | 111 | |||||||||||||
| 2nd generation TI/Comm PSF |
$ | 41.82 | $ | 14.25 | $ | 41.30 | ||||||||||
| Increase (decrease) in 2nd generation gross rents (6) |
-2.46 | % | 6.16 | % | -2.37 | % | ||||||||||
| Increase (decrease) in 2nd generation net rents (6) |
-4.90 | % | 7.74 | % | -4.76 | % | ||||||||||
| (1) | Includes revenue and expenses from retail tenants at the hotel property. |
| (2) | See page 43 for a quantitative reconciliation of Same Property Net Operating Income (NOI) by reportable segment. |
| (3) | For a quantitative reconciliation of NOI to net income available to common shareholders, see page 42. For disclosures relating to our use of Portfolio NOI and Consolidated NOI, see page 50. |
| (4) | For disclosures related to the calculation of NOI from unconsolidated joint ventures, see page 17. |
| (5) | For a quantitative reconciliation of NOI to NOI on a cash basis, see page 42. |
| (6) | Represents change in rents on a “cash to cash” basis (actual rent at time of expiration vs. initial rent of new lease) and for only 2nd generation space after eliminating any space vacant for more than 12 months. The total footage being weighted is 564,580 square feet. |
41
Boston Properties, Inc.
Third Quarter 2010
Reconciliation of Net Operating Income to Net Income
| For the three months ended | ||||||||
| September 30, 2010 |
September 30, 2009 |
|||||||
| (in thousands) | ||||||||
| Net income attributable to Boston Properties, Inc. |
$ | 57,668 | $ | 65,795 | ||||
| Net income attributable to noncontrolling interests: |
||||||||
| Noncontrolling interest - redeemable preferred units of the Operating Partnership |
820 | 772 | ||||||
| Noncontrolling interest in gains on sales of real estate - common units of the Operating Partnership |
— | 307 | ||||||
| Noncontrolling interest - common units of the Operating Partnership |
8,712 | 9,662 | ||||||
| Noncontrolling interests in property partnerships |
889 | 1,114 | ||||||
| Gains on sales of real estate |
— | (2,394 | ) | |||||
| Income (loss) from unconsolidated joint ventures |
(11,565 | ) | (6,350 | ) | ||||
| Income before income (loss) from unconsolidated joint ventures, gains on sales of real estate and net income attributable to noncontrolling interests |
56,524 | 68,906 | ||||||
| Add: |
||||||||
| Losses (gains) from investments in securities |
(731 | ) | (1,317 | ) | ||||
| Losses from early extinguishment of debt |
— | 16 | ||||||
| Depreciation and amortization |
81,133 | 78,181 | ||||||
| Interest expense |
97,103 | 77,090 | ||||||
| Acquisition costs |
1,893 | |||||||
| General and administrative expense |
18,067 | 19,989 | ||||||
| Subtract: |
||||||||
| Interest and other income |
(1,814 | ) | (1,513 | ) | ||||
| Development and management services income |
(6,439 | ) | (9,754 | ) | ||||
| Consolidated Net Operating Income |
245,736 | 231,598 | ||||||
| Net Operating Income from unconsolidated joint ventures (BXP’s share) (1) |
61,723 | 61,553 | ||||||
| Combined Net Operating Income |
307,459 | 293,151 | ||||||
| Subtract: |
||||||||
| Net Operating Income from Value-Added Fund (BXP’s share) |
(1,162 | ) | (1,158 | ) | ||||
| Portfolio Net Operating Income |
$ | 306,297 | $ | 291,993 | ||||
| Same Property Net Operating Income |
293,580 | 290,007 | ||||||
| Net operating income from non Same Properties (2) |
7,492 | 1,512 | ||||||
| Termination income |
5,225 | 474 | ||||||
| Portfolio Net Operating Income |
$ | 306,297 | $ | 291,993 | ||||
| Same Property Net Operating Income |
293,580 | 290,007 | ||||||
| Less straight-line rent and fair value lease revenue |
39,850 | 38,826 | ||||||
| Same Property Net Operating Income - cash basis |
$ | 253,730 | $ | 251,181 | ||||
| (1) | For disclosures related to the calculation of Net Operating Income from unconsolidated joint ventures, see page 17. |
| (2) | Pages 20-22 indicate by footnote the properties which are not included as part of Same Property Net Operating Income. |
42
Boston Properties, Inc.
Third Quarter 2010
Same Property Net Operating Income by Reportable Segment
(in thousands)
| Office | Office/Technical | |||||||||||||||||||||||||||||||
| For the three months ended |
$ Change |
% Change |
For the three months ended |
$ Change |
% Change |
|||||||||||||||||||||||||||
| 30-Sep-10 | 30-Sep-09 | 30-Sep-10 | 30-Sep-09 | |||||||||||||||||||||||||||||
| Rental Revenue |
$ | 351,912 | $ | 345,985 | $ | 11,540 | $ | 11,624 | ||||||||||||||||||||||||
| Less Termination Income |
3,610 | 309 | — | — | ||||||||||||||||||||||||||||
| Rental revenue - subtotal |
348,302 | 345,676 | $ | 2,626 | 0.8 | % | 11,540 | 11,624 | $ | (84 | ) | -0.7 | % | |||||||||||||||||||
| Operating expenses and real estate taxes |
123,257 | 125,390 | (2,133 | ) | -1.7 | % | 3,415 | 3,367 | 48 | 1.4 | % | |||||||||||||||||||||
| Net Operating Income (1) |
$ | 225,045 | $ | 220,286 | $ | 4,759 | 2.2 | % | $ | 8,125 | $ | 8,257 | $ | (132 | ) | -1.6 | % | |||||||||||||||
| Rental revenue - subtotal |
$ | 348,302 | $ | 345,676 | $ | 11,540 | $ | 11,624 | ||||||||||||||||||||||||
| Less straight line rent and fair value lease revenue |
18,164 | 11,748 | 6,416 | 54.6 | % | (47 | ) | 56 | (103 | ) | -183.9 | % | ||||||||||||||||||||
| Rental revenue - cash basis |
330,138 | 333,928 | (3,790 | ) | -1.1 | % | 11,587 | 11,568 | 19 | 0.2 | % | |||||||||||||||||||||
| Less: |
||||||||||||||||||||||||||||||||
| Operating expenses and real estate taxes |
123,257 | 125,390 | (2,133 | ) | -1.7 | % | 3,415 | 3,367 | 48 | 1.4 | % | |||||||||||||||||||||
| Net Operating Income (2) - cash basis |
$ | 206,881 | $ | 208,538 | $ | (1,657 | ) | -0.8 | % | $ | 8,172 | $ | 8,201 | $ | (29 | ) | -0.4 | % | ||||||||||||||
| Sub-Total | Hotel | |||||||||||||||||||||||||||||||
| For the three months ended |
$ Change |
% Change |
For the three months ended |
$ Change |
% Change |
|||||||||||||||||||||||||||
| 30-Sep-10 | 30-Sep-09 | 30-Sep-10 | 30-Sep-09 | |||||||||||||||||||||||||||||
| Rental Revenue |
$ | 363,452 | $ | 357,609 | $ | 8,017 | $ | 6,650 | ||||||||||||||||||||||||
| Less Termination Income |
3,610 | 309 | — | — | ||||||||||||||||||||||||||||
| Rental revenue - subtotal |
359,842 | 357,300 | $ | 2,542 | 0.7 | % | 8,017 | 6,650 | $ | 1,367 | 20.6 | % | ||||||||||||||||||||
| Operating expenses and real estate taxes |
126,672 | 128,757 | (2,085 | ) | -1.6 | % | 6,194 | 5,417 | 777 | 14.3 | % | |||||||||||||||||||||
| Net Operating Income (1) |
$ | 233,170 | $ | 228,543 | $ | 4,627 | 2.0 | % | $ | 1,823 | $ | 1,233 | $ | 590 | 47.9 | % | ||||||||||||||||
| Rental revenue - subtotal |
$ | 359,842 | $ | 357,300 | $ | 8,017 | $ | 6,650 | ||||||||||||||||||||||||
| Less straight line rent and fair value lease revenue |
18,117 | 11,804 | 6,313 | 53.5 | % | (1 | ) | (1 | ) | — | 0.0 | % | ||||||||||||||||||||
| Rental revenue - cash basis |
341,725 | 345,496 | (3,771 | ) | -1.1 | % | 8,018 | 6,651 | 1,367 | 20.6 | % | |||||||||||||||||||||
| Less: |
||||||||||||||||||||||||||||||||
| Operating expenses and real estate taxes |
126,672 | 128,757 | (2,085 | ) | -1.6 | % | 6,194 | 5,417 | 777 | 14.3 | % | |||||||||||||||||||||
| Net Operating Income (2) - cash basis |
$ | 215,053 | $ | 216,739 | $ | (1,686 | ) | -0.8 | % | $ | 1,824 | $ | 1,234 | $ | 590 | 47.8 | % | |||||||||||||||
| Unconsolidated Joint Ventures (3) | Total | |||||||||||||||||||||||||||||||
| For the three months ended |
$ Change |
% Change |
For the three months ended |
$ Change |
% Change |
|||||||||||||||||||||||||||
| 30-Sep-10 | 30-Sep-09 | 30-Sep-10 | 30-Sep-09 | |||||||||||||||||||||||||||||
| Rental Revenue |
$ | 83,435 | $ | 82,056 | $ | 454,904 | $ | 446,315 | ||||||||||||||||||||||||
| Less Termination Income |
1,616 | 165 | 5,226 | 474 | ||||||||||||||||||||||||||||
| Rental revenue - subtotal |
81,819 | 81,891 | $ | (72 | ) | -0.1 | % | 449,678 | 445,841 | $ | 3,837 | 0.9 | % | |||||||||||||||||||
| Operating expenses and real estate taxes |
23,232 | 21,660 | 1,572 | 7.3 | % | 156,098 | 155,834 | 264 | 0.2 | % | ||||||||||||||||||||||
| Net Operating Income (1) |
$ | 58,587 | $ | 60,231 | $ | (1,644 | ) | -2.7 | % | $ | 293,580 | $ | 290,007 | $ | 3,573 | 1.2 | % | |||||||||||||||
| Rental revenue - subtotal |
$ | 81,819 | $ | 81,891 | $ | 449,678 | $ | 445,841 | ||||||||||||||||||||||||
| Less straight line rent and fair value lease revenue |
21,734 | 27,023 | (5,289 | ) | -19.6 | % | 39,850 | 38,826 | 1,024 | 2.6 | % | |||||||||||||||||||||
| Rental revenue - cash basis |
60,085 | 54,868 | 5,217 | 9.5 | % | 409,828 | 407,015 | 2,813 | 0.7 | % | ||||||||||||||||||||||
| Less: |
||||||||||||||||||||||||||||||||
| Operating expenses and real estate taxes |
23,232 | 21,660 | 1,572 | 7.3 | % | 156,098 | 155,834 | 264 | 0.2 | % | ||||||||||||||||||||||
| Net Operating Income (2) - cash basis |
$ | 36,853 | $ | 33,208 | $ | 3,645 | 11.0 | % | $ | 253,730 | $ | 251,181 | $ | 2,549 | 1.0 | % | ||||||||||||||||
| (1) | For a quantitative reconciliation of net operating income (NOI) to net income available to common shareholders, see page 42. For disclosures relating to our use of NOI see page 50. |
| (2) | For a quantitative reconciliation of NOI to NOI on a cash basis see page 42. For disclosures relating to our use of NOI see page 50. |
| (3) | Does not include the Value-Added Fund. |
43
Boston Properties, Inc.
Third Quarter 2010
LEASING ACTIVITY
All In-Service Properties - quarter ended September 30, 2010
| Office | Office/ Technical |
Total | ||||||||||
| Vacant space available @ 7/1/2010 (sf) |
2,268,766 | 245,706 | 2,514,472 | |||||||||
| Property dispositions/ assets taken out of service (sf) |
— | — | — | |||||||||
| Property acquisitions/ assets placed in-service (sf) |
— | — | — | |||||||||
| Leases expiring or terminated 7/1/2010-9/30/2010 (sf) |
654,245 | — | 654,245 | |||||||||
| Total space for lease (sf) |
2,923,011 | 245,706 | 3,168,717 | |||||||||
| New tenants (sf) |
615,587 | 14,338 | 629,925 | |||||||||
| Renewals (sf) |
163,804 | — | 163,804 | |||||||||
| Total space leased (sf) |
779,391 | 14,338 | 793,729 | (1) | ||||||||
| Space available @ 9/30/2010 (sf) |
2,143,620 | 231,368 | 2,374,988 | |||||||||
| Net (increase)/decrease in available space (sf) |
125,146 | 14,338 | 139,484 | |||||||||
| 2nd generation Average lease term (months) |
94 | 61 | 93 | |||||||||
| 2nd generation Average free rent (days) |
113 | 39 | 111 | |||||||||
| 2nd generation TI/Comm PSF |
$ | 41.82 | $ | 14.25 | $ | 41.30 | ||||||
| Increase (decrease) in 2nd generation gross rents (2) |
-2.46 | % | 6.16 | % | -2.37 | % | ||||||
| Increase (decrease) in 2nd generation net rents (3) |
-4.90 | % | 7.74 | % | -4.76 | % | ||||||
| All leases 1st Generation |
All leases 2nd Generation |
Incr (decr) in 2nd gen. gross cash rents (2) |
Incr (decr) in 2nd gen. net cash rents (3) |
Total Leased (4) |
Total square feet of leases executed in the quarter (5) |
|||||||||||||||||||
| Boston |
5,286 | 188,728 | 10.22 | % | 17.24 | % | 194,014 | 359,769 | ||||||||||||||||
| Washington |
34,040 | 213,000 | 0.14 | % | -0.47 | % | 247,040 | 1,089,743 | ||||||||||||||||
| New York |
— | 176,321 | 3.38 | % | 1.37 | % | 176,321 | 196,370 | ||||||||||||||||
| San Francisco |
— | 144,949 | -16.14 | % | -21.61 | % | 144,949 | 74,217 | ||||||||||||||||
| Princeton |
— | 31,405 | -5.42 | % | -8.54 | % | 31,405 | 2,242 | ||||||||||||||||
| 39,326 | 754,403 | -2.37 | % | -4.76 | % | 793,729 | 1,722,341 | |||||||||||||||||
| (1) | Details of 1st and 2nd generation space is located in chart below. |
| (2) | Represents increase (decrease) in gross rent (total base rent and expense reimbursements), comparing the change in rent at lease expiration vs. initial rent of the new lease for 2nd generation space that has been vacant for less than twelve months. The total footage being weighted is 564,580. |
| (3) | Represents increase (decrease) in net rent (base rent less base year expense), comparing the rent at lease expiration vs. initial rent of the new lease for 2nd generation space that has been vacant for less than twelve months. The total footage being weighted is 564,580. |
| (4) | Represents leases for which rental revenue has commenced in accordance with GAAP during the quarter. |
| (5) | Represents leases executed in the quarter for which the GAAP impact may be recognized in the current or future quarters, including properties currently under development. The total square feet of leases executed in the current quarter and recognized in the current quarter is 386,518. |
44
Boston Properties, Inc.
Third Quarter 2010
HISTORICALLY GENERATED CAPITAL EXPENDITURES,
TENANT IMPROVEMENT COSTS AND LEASING COMMISSIONS
Historical Capital Expenditures
(in thousands)
| Q3 2010 | Q2 2010 | Q1 2010 | 2009 | 2008 | 2007 | |||||||||||||||||||
| Recurring capital expenditures |
$ | 3,070 | $ | 1,996 | $ | 1,044 | $ | 27,813 | $ | 29,781 | $ | 36,599 | ||||||||||||
| Planned non-recurring capital expenditures associated with acquisition properties |
11 | 22 | 112 | 865 | 3,203 | 1,490 | ||||||||||||||||||
| Hotel improvements, equipment upgrades and replacements |
231 | 182 | 307 | 1,515 | 2,317 | (1) | 1,127 | |||||||||||||||||
| $ | 3,312 | $ | 2,200 | $ | 1,463 | $ | 30,193 | $ | 35,301 | $ | 39,216 | |||||||||||||
| 2nd Generation Tenant Improvements and Leasing Commissions |
||||||||||||||||||||||||
| Q3 2010 | Q2 2010 | Q1 2010 | 2009 | 2008 | 2007 | |||||||||||||||||||
| Office |
||||||||||||||||||||||||
| Square feet |
740,065 | 1,141,111 | 1,991,944 | 3,545,251 | 2,472,619 | 3,201,812 | ||||||||||||||||||
| Tenant improvement and lease commissions PSF |
$ | 41.82 | $ | 23.18 | $ | 45.21 | $ | 32.59 | $ | 30.17 | $ | 23.88 | ||||||||||||
| Office/Technical |
||||||||||||||||||||||||
| Square feet |
14,338 | — | 31,060 | 115,848 | 26,388 | 226,692 | ||||||||||||||||||
| Tenant improvement and lease commissions PSF |
$ | 14.25 | $ | — | $ | 0.51 | $ | 0.13 | $ | — | $ | 26.62 | ||||||||||||
| Average tenant improvement and lease commissions PSF |
$ | 41.30 | $ | 23.18 | $ | 44.46 | $ | 31.56 | $ | 29.85 | $ | 24.06 | ||||||||||||
| (1) | Includes approximately $723 of costs related to suites renovation at Cambridge Center Marriott. |
45
Boston Properties, Inc.
Third Quarter 2010
ACQUISITIONS/DISPOSITIONS
as of September 30, 2010
ACQUISITIONS
For the period from January 1, 2010 through September 30, 2010
| Property |
Date Acquired |
Square Feet |
Initial Investment |
Anticipated Future Investment |
Total Investment |
Percentage Leased |
||||||||||||||||||
| 500 North Capitol (30% ownership interest) |
Apr-10 | 175,698 | $ | 8,485,000 | $ | 28,000,000 | $ | 36,485,000 | 100 | % | ||||||||||||||
| Reston Virginia Land Parcel |
Jul-10 | N/A | 20,250,000 | — | 20,250,000 | N/A | ||||||||||||||||||
| 510 Madison Avenue |
Sep-10 | 347,000 | 310,670,771 | 64,329,229 | (1) | 375,000,000 | 1 | % | ||||||||||||||||
| Total Acquisitions |
522,698 | $ | 339,405,771 | $ | 92,329,229 | $ | 431,735,000 | 34 | % | |||||||||||||||
DISPOSITIONS
For the period from January 1, 2010 through September 30, 2010
| Property |
Date Disposed | Square Feet |
Gross Sales Price |
Book Gain | ||||||||||||
| 20 F Street Land (2) |
Apr-08 | — | $ | — | $ | 1,765,000 | ||||||||||
| 280 Park Avenue (3) |
Jun-06 | — | — | 969,000 | ||||||||||||
| Total Dispositions |
— | $ | — | $ | 2,734,000 | |||||||||||
| (1) | Estimated future equity requirements include approximately $18 million of capitalized interest. For additional detail, see page 47. |
| (2) | On April 14, 2008, the Company sold a parcel of land located in Washington, D.C. for approximately $33.7 million. The Company had previously entered into a development agreement with the buyer to develop a Class A office property on the parcel totaling approximately 165,000 net rentable square feet. The gain on sale totaling approximately $23.4 million was deferred and has been recognized over the construction period. During the six months ended June 30, 2010, the Company completed construction of the project and recognized the remaining gain on sale totaling approximately $1.8 million. |
| (3) | 280 Park Avenue was sold in 2006. The Company had entered into a master lease obligation with the buyer resulting in the deferral of a portion of the book gain on sale. During the three months ended June 30, 2010, the Company satisfied the remaining requirement of the master lease obligation and recognized the remaining deferred gain on sale of approximately $1.0 million. |
46
Boston Properties, Inc.
Third Quarter 2010
VALUE CREATION PIPELINE - CONSTRUCTION IN PROGRESS (1)
as of September 30, 2010
| Construction |
Initial |
Estimated |
Location |
# of Buildings |
Square feet |
Investment to Date (2) |
Estimated Total Investment (2) |
Total Construction Loan (2) |
Amount Drawn at September 30, 2010 |
Estimated Future Equity Requirement |
Percentage Leased (3) |
|||||||||||||||||||||||||||
| Office |
||||||||||||||||||||||||||||||||||||||
| Atlantic Wharf (4) |
Q1 2011 | Q1 2012 | Boston, MA | 1 | 790,000 | $ | 473,677,880 | $ | 552,900,000 | $ | 192,500,000 | (5) | $ | — | $ | (113,277,880 | )(5) | 68 | %(4) | |||||||||||||||||||
| 2200 Pennsylvania Avenue (6) |
Q2 2011 | Q2 2012 | Washington, DC | 1 | 460,000 | 123,957,615 | 230,000,000 | — | — | 106,042,385 | 74 | %(6) | ||||||||||||||||||||||||||
| 510 Madison Avenue (7) |
Q1 2011 | Q4 2012 | New York, NY | 1 | 347,000 | 310,670,771 | 375,000,000 | — | — | 64,329,229 | 1 | % | ||||||||||||||||||||||||||
| Total Office Properties under Construction |
3 | 1,597,000 | $ | 908,306,266 | $ | 1,157,900,000 | $ | 192,500,000 | $ | — | $ | 57,093,734 | 55 | % | ||||||||||||||||||||||||
| Residential |
||||||||||||||||||||||||||||||||||||||
| Atlantic Wharf - Residential (86 Units) (8) |
Q3 2011 | Q2 2012 | Boston, MA | 1 | 78,000 | $ | 26,684,670 | $ | 47,100,000 | $ | — | $ | — | $ | 20,415,330 | N/A | ||||||||||||||||||||||
| Atlantic Wharf - Retail |
10,000 | — | — | — | — | — | 0 | % | ||||||||||||||||||||||||||||||
| 2221 I Street, NW - Residential (335 units) (9) |
Q2 2011 | Q3 2012 | Washington, DC | 1 | 275,000 | 68,002,367 | 150,000,000 | — | — | 81,997,633 | N/A | |||||||||||||||||||||||||||
| 2221 I Street, NW - Retail |
50,000 | — | — | — | — | — | 100 | % | ||||||||||||||||||||||||||||||
| Total Residential Properties under Construction |
2 | 413,000 | $ | 94,687,037 | $ | 197,100,000 | $ | — | $ | — | $ | 102,412,963 | 83 | % | ||||||||||||||||||||||||
| Total Properties under Construction |
5 | 2,010,000 | $ | 1,002,993,303 | $ | 1,355,000,000 | $ |
192,500,000 |
|
$ | — | $ | 159,506,697 | 56 | % | |||||||||||||||||||||||
PROJECTS PLACED-IN-SERVICE DURING 2010
| Initial |
Estimated |
Location |
# of Buildings |
Square feet |
Investment to Date (2) |
Estimated Total Investment (2) |
Debt | Drawn at September 30, 2010 |
Estimated Future Equity Requirement |
Percentage Leased |
||||||||||||||||||||||||||||
| Weston Corporate Center |
Q2 2010 | Q2 2010 | Weston, MA | 1 | 356,367 | $ | 122,114,217 | $ | 127,500,000 | (10) | $ | — | $ | — | $ | 5,385,783 | 100 | % | ||||||||||||||||||||
| Total Projects Placed in Service |
1 | 356,367 | $ | 122,114,217 | $ | 127,500,000 | $ | — | $ | — | $ | 5,385,783 | 100 | % | ||||||||||||||||||||||||
IN-SERVICE PROPERTIES HELD FOR RE-DEVELOPMENT
| Sub Market |
Number of Buildings |
Square Feet |
Leased % | Annualized Revenue Per Leased SF (11) |
Encumbered with secured debt (Y/N) |
Central Business District (CBD) or Suburban (S) |
Estimated Future SF (12) |
|||||||||||||||||||||||
| 103 Fourth Avenue |
Route 128 Mass Turnpike MA |
1 | 62,476 | 58.5 | % | $ | 24.29 | N | S | 265,000 | ||||||||||||||||||||
| Waltham Office Center |
Route 128 Mass Turnpike MA |
1 | 67,005 | 38.3 | % | 16.47 | N | S | 414,000 | (13) | ||||||||||||||||||||
| 6601 Springfield Center Drive |
Fairfax County VA |
1 | 26,388 | 100.0 | % | 11.33 | N | S | 386,000 | (13) | ||||||||||||||||||||
| North First Business Park |
San Jose, CA |
5 | 190,636 | 75.8 | % | 16.77 | N | S | 683,000 | |||||||||||||||||||||
| 635 Massachusetts Avenue |
CBD Washington DC |
1 | 211,000 | 100.0 | % | 28.31 | N | CBD | 450,000 | |||||||||||||||||||||
| 500 North Capitol (30% ownership) |
CBD Washington DC |
1 | 175,698 | 100.0 | % | 43.03 | Y | CBD | 223,000 | |||||||||||||||||||||
| 12300 & 12310 Sunrise Valley (14) |
Fairfax County VA |
2 | 519,114 | 100.0 | % | 46.17 | N | S | 523,000 | |||||||||||||||||||||
| Total Properties held for Re-Development |
12 | 1,252,317 | 91.0 | % | $ | 36.47 | 2,944,000 | |||||||||||||||||||||||
| (1) | A project is classified as Construction in Progress when construction or supply contracts have been signed, physical improvements have commenced or a lease has been signed. |
| (2) | Includes net revenue during lease up period. |
| (3) | Represents office and retail percentage leased as of October 26, 2010 and excludes residential space. |
| (4) | Project includes 17,000 square feet of retail space. |
| (5) | On October 1, 2010, the Company modified the construction loan facility by releasing from collateral the residential portion of the project and reducing the loan commitment from $215.0 million to $192.5 million. |
The Company has not drawn from the construction loan to date, but reserves the right to do so in the future.
| (6) | Project includes 20,000 square feet of retail space and is subject to a ground lease expiring in 2068. |
| (7) | Acquired September 24, 2010; base building is expected to be completed in October 2010. Estimated future equity requirements include approximately $18 million of capitalized interest. |
| (8) | Project cost includes residential and retail components. Estimated Total Investment is net of $12.0 million of proceeds from the sale of Federal tax credits. |
| (9) | Project cost includes residential and retail components and is subject to a ground lease expiring in 2068. |
| (10) | Estimated total investment reduced from $129 million to $127.5 million due to savings in project costs. |
| (11) | For disclosures relating to our definition of Annualized Revenue, see page 50. |
| (12) | Included in Approximate Developable Square Feet of Value Creation Pipeline - Owned Land Parcels on page 48. |
| (13) | Total estimated square footage represents the entire site including the buildings reclassified to Land in Q1, 2010. |
| (14) | On September 14, 2010, the Company executed an approximately 523,000 square foot 20-year lease with the Defense Intelligence Agency (US Government) for the Company’s 12300 & 12310 Sunrise Valley Drive properties located in Reston, Virginia, which are currently 100% leased. The Company will commence redevelopment of 12310 Sunrise Drive in the third quarter 2011 and expects to have it available for occupancy during the first quarter of 2012. Redevelopment of 12300 Sunrise Valley Drive will commence in the second quarter of 2012 and availability for occupancy is expected during the second quarter of 2013. |
47
Boston Properties, Inc.
Third Quarter 2010
VALUE CREATION PIPELINE - OWNED LAND PARCELS
as of September 30, 2010
| Location |
Acreage | Approximate Developable Square Feet |
||||||
| San Jose, CA (1) (2) |
44.0 | 2,409,364 | ||||||
| Reston, VA (1) (3) |
36.3 | 1,253,886 | ||||||
| Waltham, MA (1) |
25.4 | 1,020,519 | ||||||
| New York, NY (4) |
1.0 | 1,000,000 | ||||||
| Gaithersburg, MD |
27.0 | 850,000 | ||||||
| Springfield, VA (1) |
17.8 | 773,612 | ||||||
| Dulles, VA |
76.6 | 760,000 | ||||||
| Rockville, MD |
58.1 | 759,000 | ||||||
| Boston, MA (5) |
1.0 | 450,000 | ||||||
| Marlborough, MA |
50.0 | 400,000 | ||||||
| Annapolis, MD (50% ownership) |
20.0 | 300,000 | ||||||
| Washington, DC (1) |
1.7 | 286,302 | ||||||
| Cambridge, MA |
1.1 | 170,000 | ||||||
| Andover, MA |
10.0 | 110,000 | ||||||
| New York, NY (50% ownership) (6) |
0.2 | TBD | ||||||
| 370.2 | 10,542,683 | |||||||
| VALUE CREATION PIPELINE - LAND PURCHASE OPTIONS as of September 30, 2010
|
| |||||||
| Location |
Acreage | Approximate Developable Square Feet |
||||||
| Princeton, NJ (7) |
143.1 | 1,780,000 | ||||||
| Cambridge, MA (8) |
— | 500,000 | ||||||
| 143.1 | 2,280,000 | |||||||
| (1) | Properties on-site positioned for future re-development are omitted from developable square feet and can be found on page 47. |
| (2) | Includes an additional 460,000 of developable square footage at our 3200 Zanker Road project. |
| (3) | On July 1, 2010, the Company acquired land in Reston Town Center permitted for 340,000 square feet of residential and retail use. |
| (4) | On November 30, 2009, we completed the construction of foundations and steel/deck to grade at 250 West 55th Street, to facilitate a restart of construction in the future. |
| (5) | Excludes 250,000 developable square feet of which the Company executed an agreement to ground lease with a Residential Developer. |
| (6) | The venture owns five lots with air rights and developable square footage remains to be determined. |
| (7) | Option to purchase at a fixed price of $30.50 per square foot plus annual non-refundable option payments of $125,000. |
| (8) | An additional 300,000 square feet of development rights for office/lab space was granted as part of a zoning change in Q3 2010. The Company also has the option to purchase 200,000 square feet of residential rights. |
48
Boston Properties, Inc.
Third Quarter 2010
Definitions
This section contains an explanation of certain non-GAAP financial measures we provide in other sections of this document, as well as the reasons why management believes these measures provide useful information to investors about the Company’s financial condition or results of operations. Additional detail can be found in the Company’s most recent annual report on Form 10-K and quarterly report on Form 10-Q, as well as other documents filed with or furnished to the SEC from time to time.
Funds from Operations
Pursuant to the revised definition of Funds from Operations adopted by the Board of Governors of the National Association of Real Estate Investment Trusts (“NAREIT”), we calculate Funds from Operations, or “FFO,” by adjusting net income (loss) attributable to Boston Properties, Inc. (computed in accordance with GAAP, including non-recurring items) for gains (or losses) from sales of properties, real estate related depreciation and amortization, and after adjustment for unconsolidated partnerships and joint ventures. FFO is a non-GAAP financial measure. The use of FFO, combined with the required primary GAAP presentations, has been fundamentally beneficial in improving the understanding of operating results of REITs among the investing public and making comparisons of REIT operating results more meaningful. Management generally considers FFO to be a useful measure for reviewing our comparative operating and financial performance because, by excluding gains and losses related to sales of previously depreciated operating real estate assets and excluding real estate asset depreciation and amortization (which can vary among owners of identical assets in similar condition based on historical cost accounting and useful life estimates), FFO can help one compare the operating performance of a company’s real estate between periods or as compared to different companies. Our computation of FFO may not be comparable to FFO reported by other REITs or real estate companies that do not define the term in accordance with the current NAREIT definition or that interpret the current NAREIT definition differently.
FFO should not be considered as an alternative to net income attributable to Boston Properties, Inc. (determined in accordance with GAAP) as an indication of our performance. FFO does not represent cash generated from operating activities determined in accordance with GAAP, and is not a measure of liquidity or an indicator of our ability to make cash distributions. We believe that to further understand our performance, FFO should be compared with our reported net income attributable to Boston Properties, Inc. and considered in addition to cash flows determined in accordance with GAAP, as presented in our consolidated financial statements.
Funds Available for Distribution (FAD)
In addition to FFO, we present Funds Available for Distribution (FAD) by (1) adding to FFO non-real estate depreciation, fair value interest adjustment, losses from early extinguishments of debt, impairments, ASC 470-20 (formerly known as FSP APB 14-1) interest expense adjustment, non-cash stock-based compensation expense, and partners’ share of joint venture 2nd generation tenant improvement and leasing commission, (2) eliminating the effects of straight-line rent and fair value lease revenue, (3) subtracting: recurring capital expenditures; hotel improvements, equipment upgrades and replacements; and second generation tenant improvement and leasing commissions (included in the period in which the lease commences); and (4) subtracting the gain from suspension of development, non-cash termination income and non-cash income from the termination of a management agreement. Although our FAD may not be comparable to that of other REITs and real estate companies, we believe it provides a meaningful indicator of our ability to fund cash needs and to make cash distributions to equity owners. In addition, we believe that to further understand our liquidity, FAD should be compared with our cash flows determined in accordance with GAAP, as presented in our consolidated financial statements. FAD does not represent cash generated from operating activities determined in accordance with GAAP, and FAD should not be considered as an alternative to net income (determined in accordance with GAAP) as an indication of our performance, as an alternative to net cash flows from operating activities (determined in accordance with GAAP), or as a measure of our liquidity.
Total Consolidated Debt to Total Consolidated Market Capitalization Ratio
Total consolidated debt to total consolidated market capitalization ratio, defined as total consolidated debt as a percentage of the market value of our outstanding equity securities plus our total consolidated debt, is a measure of leverage commonly used by analysts in the REIT sector. Total consolidated market capitalization is the sum of (A) our total consolidated indebtedness outstanding plus (B) the market value of our outstanding equity securities calculated using the closing price per share of common stock of the Company multiplied by the sum of (1) outstanding shares of common stock of the Company, (2) outstanding common units of limited partnership interest in Boston Properties Limited Partnership (excluding common units held by the Company), (3) common units issuable upon conversion of all outstanding Series Two Preferred Units of partnership interest in Boston Properties Limited Partnership and (4) common units issuable upon conversion of all outstanding LTIP Units, assuming all conditions have been met for the conversion of the LTIP Units. The calculation of total consolidated market capitalization does not include OPP Units because, unlike other LTIP Units, they are not earned until certain thresholds are achieved. We are presenting this ratio because our degree of leverage could affect our ability to obtain additional financing for working capital, capital expenditures, acquisitions, development or other general corporate purposes. Investors should understand that our total consolidated debt to total consolidated market capitalization ratio is in part a function of the market price of the common stock of the Company, and as such will fluctuate with changes in such price and does not necessarily reflect our capacity to incur additional debt to finance our activities or our ability to manage our existing debt obligations. However, for a company like ours, whose assets are primarily income-producing real estate, the total consolidated debt to total consolidated market capitalization ratio may provide investors with an alternate indication of leverage, so long as it is evaluated along with the ratio of indebtedness to other measures of asset value used by financial analysts and other financial ratios, as well as the various components of our outstanding indebtedness.
Total Combined Debt to Total Combined Market Capitalization Ratio
Total combined debt to total combined market capitalization ratio, defined as total combined debt (which equals our total consolidated debt plus our share of unconsolidated joint venture debt) as a percentage of the market value of our outstanding equity securities plus our total combined debt, is an alternative measure of leverage used by some analysts in the REIT sector. Total combined market capitalization is the sum of (A) our total combined debt plus (B) the market value of our outstanding equity securities calculated using the closing price per share of common stock of the Company multiplied by the sum of (1) outstanding shares of common stock of the Company, (2) outstanding common units of limited partnership interest in Boston Properties Limited Partnership (excluding common units held by the Company), (3) common units issuable upon conversion of all outstanding Series Two Preferred Units of partnership interest in Boston Properties Limited Partnership and (4) common units issuable upon conversion of all outstanding LTIP Units, assuming all conditions have been met for the conversion of the LTIP Units. The calculation of total combined market capitalization does not include OPP Units because, unlike other LTIP Units, they are not earned until certain thresholds are achieved.
We present this ratio because, following our acquisitions of the General Motors Building, Two Grand Central Tower, 125 West 55th Street and 540 Madison Avenue through unconsolidated joint ventures in June and August 2008, our share of unconsolidated joint venture debt increased significantly compared to prior periods when the amount of assets held through unconsolidated joint ventures was significantly smaller. In light of the difference between our total consolidated debt and our total combined debt, we believe that presenting our total combined debt to total combined market capitalization as well may provide investors with a more complete picture of our leverage. Investors should understand that our total combined debt to total combined market capitalization ratio is in part a function of the market price of the common stock of the Company, and as such will fluctuate with changes in such price and does not necessarily reflect our capacity to incur additional debt to finance our activities or our ability to manage our existing debt obligations. The total combined debt to total combined market capitalization ratio should be evaluated along with the ratio of indebtedness to other measures of asset value used by financial analysts and other financial ratios, as well as the various components of our outstanding indebtedness.
49
Boston Properties, Inc.
Third Quarter 2010
Definitions
Consolidated Net Operating Income (NOI)
Consolidated NOI is a non-GAAP financial measure equal to net income attributable to Boston Properties, Inc., the most directly comparable GAAP financial measure, plus income attributable to noncontrolling interests, corporate general and administrative expense, acquisition costs, depreciation and amortization, interest expense, losses from early extinguishments of debt and losses (gains) from investments in securities, less interest income, development and management services income, gain from suspension of development, gains from property dispositions, and income from unconsolidated joint ventures. In some cases we also present Consolidated NOI on a cash basis, which is Consolidated NOI after eliminating the effects of straight-lining of rent and fair value lease revenue. We use Consolidated NOI internally as a performance measure and believe Consolidated NOI provides useful information to investors regarding our financial condition and results of operations because it reflects only those income and expense items that are incurred at the property level. Therefore, we believe Consolidated NOI is a useful measure for evaluating the operating performance of our real estate assets. Our management also uses Consolidated NOI to evaluate regional property level performance and to make decisions about resource allocations. Further, we believe Consolidated NOI is useful to investors as a performance measure because, when compared across periods, Consolidated NOI reflects the impact on operations from trends in occupancy rates, rental rates, operating costs and acquisition and development activity on an unleveraged basis, providing perspective not immediately apparent from net income. Consolidated NOI excludes certain components from net income in order to provide results that are more closely related to a property’s results of operations. For example, interest expense is not necessarily linked to the operating performance of a real estate asset and is often incurred at the corporate level as opposed to the property level. In addition, depreciation and amortization, because of historical cost accounting and useful life estimates, may distort operating performance at the property level. Consolidated NOI presented by us may not be comparable to Consolidated NOI reported by other REITs that define Consolidated NOI differently. We believe that in order to facilitate a clear understanding of our operating results, Consolidated NOI should be examined in conjunction with net income as presented in our consolidated financial statements. Consolidated NOI should not be considered as an alternative to net income as an indication of our performance or to cash flows as a measure of our liquidity or ability to make distributions.
Combined Net Operating Income (NOI)
Combined NOI is a non-GAAP financial measure equal to Consolidated NOI plus our share of net operating income from unconsolidated joint ventures. In some cases we also present Combined NOI on a cash basis, which is Combined NOI after eliminating the effects of straight-lining of rent and fair value lease revenue. In addition to Consolidated NOI, we use Combined NOI internally as a performance measure and believe Combined NOI provides useful information to investors regarding our financial condition and results of operations because it includes the impact of our unconsolidated joint ventures, which have become significant. Therefore, we believe Combined NOI is a useful measure for evaluating the operating performance of all of our real estate assets, including those held by our unconsolidated joint ventures. Our management also uses Combined NOI to evaluate regional property level performance and to make decisions about resource allocations. Further, like Consolidated NOI, we believe Combined NOI is useful to investors as a performance measure because, when compared across periods, Combined NOI reflects the impact on operations from trends in occupancy rates, rental rates, operating costs and acquisition and development activity on an unleveraged basis, providing perspective not immediately apparent from net income. Combined NOI presented by us may not be comparable to Combined NOI reported by other REITs that define Combined NOI differently. We believe that in order to facilitate a clear understanding of our operating results, Combined NOI should be examined in conjunction with net income as presented in our consolidated financial statements. Combined NOI should not be considered as an alternative to net income as an indication of our performance or to cash flows as a measure of our liquidity or ability to make distributions.
Portfolio Net Operating Income (NOI)
Portfolio NOI is a non-GAAP financial measure equal to Combined NOI less our share of net operating income from the Value-Added Fund in recognition of the fact that we do not include non-core office properties held by the fund in the Company’s portfolio information tables or other portfolio level statistics because they have deficiencies in property characteristics which provide opportunity to create value. In some cases we also present Portfolio NOI on a cash basis, which is Portfolio NOI after eliminating the effects of straight-lining of rent and fair value lease revenue. In addition to Consolidated NOI and Combined NOI, we use Portfolio NOI internally as a performance measure and believe Portfolio NOI provides useful information to investors regarding our financial condition and results of operations because it includes the impact of our unconsolidated joint ventures, which have become significant, but excludes the impact of the Value-Added Fund. Therefore, we believe Portfolio NOI is a useful measure for evaluating the operating performance of our active portfolio, including both consolidated assets and those held by our unconsolidated joint ventures. Our management also uses Portfolio NOI to evaluate regional property level performance and to make decisions about resource allocations. Further, like Consolidated NOI and Combined NOI, we believe Portfolio NOI is useful to investors as a performance measure because, when compared across periods, Portfolio NOI reflects the impact on operations from trends in occupancy rates, rental rates, operating costs and acquisition and development activity on an unleveraged basis, providing perspective not immediately apparent from net income. Portfolio NOI presented by us may not be comparable to Portfolio NOI reported by other REITs that define Portfolio NOI differently. We believe that in order to facilitate a clear understanding of our operating results, Portfolio NOI should be examined in conjunction with net income as presented in our consolidated financial statements. Portfolio NOI should not be considered as an alternative to net income as an indication of our performance or to cash flows as a measure of our liquidity or ability to make distributions.
In-Service Properties
We treat a property as being “in-service” upon the earlier of (i) lease-up and completion of tenant improvements or (ii) one year after cessation of major construction activity under GAAP. The determination as to when a property should be treated as “in-service” involves a degree of judgment and is made by management based on the relevant facts and circumstances of the particular property. For portfolio operating and occupancy statistics we specify a single date for treating a property as “in-service” which is generally later than the date the property is placed in-service for GAAP. Under GAAP a property may be placed in service in stages as construction is completed and the property is held available for occupancy. In accordance with GAAP, when a portion of a property has been substantially completed and occupied or held available for occupancy, we cease capitalization on that portion, though we may not treat the property as being “in-service,” and continue to capitalize only those costs associated with the portion still under construction. In-service properties include properties held by our unconsolidated joint ventures (other than the Value-Added Fund).
Same Properties
In our analysis of NOI, particularly to make comparisons of NOI between periods meaningful, it is important to provide information for properties that were in-service and owned by us throughout each period presented. We refer to properties acquired or placed in-service prior to the beginning of the earliest period presented and owned by us through the end of the latest period presented as “Same Properties.” “Same Properties” therefore exclude properties placed in-service, acquired or repositioned after the beginning of the earliest period presented or disposed of prior to the end of the latest period presented. Accordingly, it takes at least one year and one quarter after a property is acquired or treated as “in-service” for that property to be included in “Same Properties.” Pages 20-22 indicate by footnote the “In-Service Properties” which are not included in “Same Properties.” “Same Properties NOI” includes our share of net operating income from unconsolidated joint ventures (other than the Value-Added Fund).
Annualized Revenue
Contractual rental obligations at the end of the reporting period, including contractual reimbursements, on an annualized cash basis.
Future Annualized Revenue
Contractual rental obligations at lease expiration, including current contractual reimbursements, on an annualized cash basis.
50