Attached files
Table of Contents
Index to Financial Statements
As filed with the Securities and Exchange Commission on October 25, 2010
Registration No. 333-168736
UNITED STATES
SECURITIES AND EXCHANGE COMMISSION
Washington, D.C. 20549
Amendment No. 1
to
Form S-1
REGISTRATION STATEMENT
UNDER
THE SECURITIES ACT OF 1933
Triangle Petroleum Corporation
(Exact name of registrant as specified in its charter)
| Nevada | 1311 | 98-0430762 | ||
| (State or other jurisdiction of incorporation or organization) |
(Primary Standard Industrial Classification Code Number) |
(I.R.S. Employer Identification Number) |
1625 Broadway, Suite 780
Denver, CO 80202
(303) 260-7125
(Address, including zip code, and telephone number, including area code, of registrant’s principal executive offices)
Peter J. Hill
President and Chief Executive Officer
Triangle Petroleum Corporation
1625 Broadway, Suite 780
Denver, CO 80202
(303) 260-7125
(Name, address, including zip code, and telephone number, including area code, of agent for service)
Copies to:
| Richard B. Aftanas, Esq. Skadden, Arps, Slate, Meagher & Flom LLP Four Times Square New York, NY 10036 Telephone: (212) 735-3000 Facsimile: (212) 735-2000 |
Robert G. Reedy Porter & Hedges LLP 1000 Main Street, 36th floor Houston, TX 77002 Telephone: (713) 226-6000 Facsimile: (713) 228-1331 |
Approximate date of commencement of proposed sale to the public: As soon as practicable after the effective date of this registration statement.
If any of the securities being registered on this Form are to be offered on a delayed or continuous basis pursuant to Rule 415 under the Securities Act of 1933 check the following box. ¨
If this Form is filed to register additional securities for an offering pursuant to Rule 462(b) under the Securities Act, please check the following box and list the Securities Act registration statement number of the earlier effective registration statement for the same offering. ¨
If this Form is a post-effective amendment filed pursuant to Rule 462(c) under the Securities Act, check the following box and list the Securities Act registration statement number of the earlier effective registration statement for the same offering. ¨
If this Form is a post-effective amendment filed pursuant to Rule 462(d) under the Securities Act, check the following box and list the Securities Act registration statement number of the earlier effective registration statement for the same offering. ¨
Indicate by check mark whether the registrant is a large accelerated filer, an accelerated filer, a non-accelerated filer, or a smaller reporting company. See the definitions of “large accelerated filer,” “accelerated filer” and “smaller reporting company” in Rule 12b-2 of the Exchange Act. (Check one):
| Large accelerated filer | ¨ | Accelerated filer | ¨ | |||||||
| Non-accelerated filer | ¨ | (Do not check if a smaller reporting company) | Smaller reporting company | x | ||||||
Table of Contents
Index to Financial Statements
CALCULATION OF REGISTRATION FEE
| Title of each class of securities to be registered |
Proposed maximum aggregate offering price(1)(2) |
Amount of fee(3) | ||
| Common Stock, par value $0.00001 per share |
$56,925,000 | $4,059 | ||
| (1) | Includes common stock to be sold upon exercise of the underwriters’ option. See “Underwriting.” |
| (2) | Estimated solely for the purpose of calculating the amount of the registration fee pursuant to Rule 457(o) under the Securities Act. |
| (3) | $3,565 of this amount was paid with the filing of the original registration statement on August 10, 2010. |
The registrant hereby amends this registration statement on such date or dates as may be necessary to delay its effective date until the registrant shall file a further amendment which specifically states that this registration statement shall thereafter become effective in accordance with Section 8(a) of the Securities Act of 1933 or until the registration statement shall become effective on such date as the Commission acting pursuant to said Section 8(a), may determine.
Table of Contents
Index to Financial Statements
The information in this prospectus is not complete and may be changed. We may not sell these securities until the registration statement filed with the Securities and Exchange Commission is effective. This prospectus is not an offer to sell these securities and it is not soliciting an offer to buy these securities in any state where the offer or sale is not permitted.
SUBJECT TO COMPLETION, DATED OCTOBER 25, 2010
PROSPECTUS
9,000,000 Shares

Triangle Petroleum Corporation
COMMON STOCK
Triangle Petroleum Corporation is offering 9,000,000 shares of its common stock.
Our common stock is traded on the OTC Bulletin Board under the symbol “TPLM.” We have received conditional approval to list our common stock on the NYSE Amex under the symbol “TPLM.” On October 22, 2010, the last reported sale price of our common stock on the OTC Bulletin Board was $5.40 per share (after giving effect to a 1-for-10 reverse stock split). Concurrently with the pricing of this offering, we will effectuate a 1-for-10 reverse stock split. After the reverse stock split and this offering, the market price of our common stock may be different from its current price.
Investing in our common stock involves significant risks. See “Risk Factors” beginning on page 9.
| Price
to Public |
Underwriting Discounts and Commissions |
Proceeds, Before Expenses, to Us |
||||||||||
| Per Share |
$ | $ | $ | |||||||||
| Total |
$ | $ | $ | |||||||||
The underwriters may also purchase up to an additional 1,350,000 shares of common stock from us at the public offering price above, less the underwriting discounts and commissions, within 30 days of the date of this prospectus to cover any over-allotments.
Neither the Securities and Exchange Commission nor any state securities commission has approved or disapproved of these securities, or determined if this prospectus is truthful or complete. Any representation to the contrary is a criminal offense.
The underwriters expect to deliver the shares of common stock to purchasers on or before , 2010.
Sole Book-Running Manager
Johnson Rice & Company L.L.C.
Co-Managers
| Canaccord Genuity | Rodman & Renshaw, LLC |
, 2010
Table of Contents
Index to Financial Statements
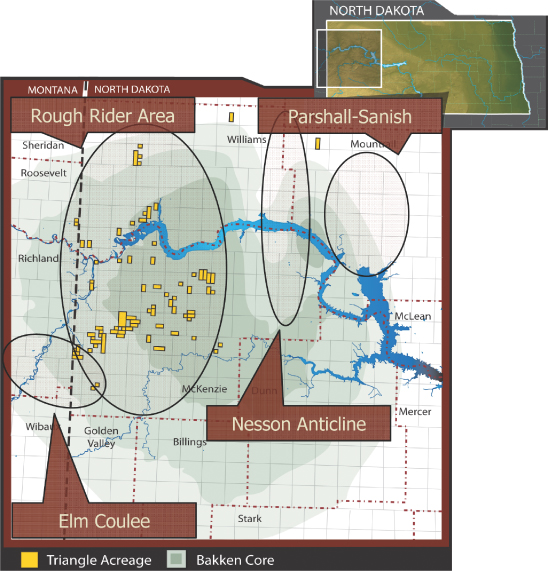
Triangle’s acreage position in the Williston Basin, including the planned Williston Purchase.
Table of Contents
Index to Financial Statements
| 1 | ||||
| 9 | ||||
| 24 | ||||
| 25 | ||||
| 27 | ||||
| 28 | ||||
| 29 | ||||
| 30 | ||||
| 32 | ||||
| 33 | ||||
| MANAGEMENT’S DISCUSSION AND ANALYSIS OF FINANCIAL CONDITION AND RESULTS OF OPERATIONS |
34 | |||
| 46 | ||||
| 58 | ||||
| 63 | ||||
| 67 | ||||
| 69 | ||||
| 70 | ||||
| 73 | ||||
| 76 | ||||
| 76 | ||||
| 76 | ||||
| F-1 | ||||
| A-1 | ||||
You should rely only on the information contained in this prospectus or in any free writing prospectus we may authorize to be delivered to you. Neither we nor the underwriters have authorized anyone to provide you with additional or different information. If anyone provides you with additional, different or inconsistent information, you should not rely on it. We and the underwriters are offering to sell, and seeking offers to buy, these securities only in jurisdictions where offers and sales are permitted. The information in this prospectus is accurate only as of the date of this prospectus, regardless of the time of delivery of this prospectus or of any sale of our common stock.
i
Table of Contents
Index to Financial Statements
This summary provides a brief overview of information contained elsewhere in this prospectus. Because it is abbreviated, this summary does not contain all of the information that you should consider before investing in our common stock. You should read the entire prospectus carefully before making an investment decision, including the information presented under the headings “Risk Factors,” “Cautionary Note Regarding Forward-Looking Statements” and “Management’s Discussion and Analysis of Financial Condition and Results of Operations” and the historical consolidated financial statements and related notes thereto included elsewhere in this prospectus. Unless otherwise indicated, information presented in this prospectus assumes that the underwriters’ option to purchase additional shares of common stock is not exercised. We have provided definitions for certain oil and natural gas terms used in this prospectus in the “Glossary of Oil and Natural Gas Terms” beginning on page A-1 of this prospectus.
Except where otherwise indicated, all information regarding share amounts and prices assume the consummation of the 1-for-10 reverse stock split to be effected prior to the closing of this offering. All dollar amounts are in U.S. dollars unless otherwise indicated. In this prospectus, unless the context otherwise requires, the terms “we,” “us” and “our” refer to Triangle Petroleum Corporation and its subsidiaries. Our fiscal year-end is January 31.
Overview
We are an oil and natural gas exploration and development company currently focused on the acquisition and development of unconventional shale oil resources. In late 2009, we adopted a new investment strategy shifting our area of focus from the Maritimes Basin in the Province of Nova Scotia to the Bakken Shale and Three Forks formations in the Williston Basin of North Dakota and Montana. In furtherance of our new strategy, to date, we have acquired, or committed to acquire, approximately 13,000 net acres primarily in McKenzie and Williams Counties of North Dakota. Having identified an area of focus in the Bakken Shale that we believe will generate attractive returns on invested capital, we are continuing to explore further opportunities in the region with a goal of reaching 30,000 net acres by the end of 2011.
In the Maritimes Basin, we hold over 400,000 net acres with numerous conventional and unconventional prospective reservoirs, including the Windsor and Horton Shales. As a result of the processing and interpretation of our proprietary 2D seismic data, we have identified a conventional exploration opportunity that we believe could hold significant natural gas reserves. We are currently marketing the prospect to industry partners as a farm-out opportunity and propose to enter into an agreement whereby we would maintain a working interest position and potential partners would agree to cover 100% of the capital costs of an initial exploration well.
Williston Basin
We have operated and non-operated leasehold positions in the Williston Basin. The operations of our non-operated leasehold positions are primarily conducted through agreements with Slawson Exploration, Inc., or Slawson, one of the largest private operators in the Williston Basin, and Kodiak Oil & Gas Corp., or Kodiak, a publicly traded oil and natural gas independent exploration and production company. Both companies are experienced operators in the development of the Bakken Shale and Three Forks formations. As of October 22, 2010, we have acquired, or committed to acquire, an aggregate of approximately 13,000 net acres in the Williston Basin in North Dakota. We are seeking to acquire new operated and non-operated acreage within these formations with additional experienced operators. In 2011, we also plan to drill our first operated well on the acreage that we expect to acquire as part of the Williston Purchase. See “—Recent Developments.” In addition, we have successfully recruited a new land staff and brokerage and title team, which in the past month has successfully acquired over 1,200 net acres, including approximately 700 net acres in the same township as the Williston Purchase.
1
Table of Contents
Index to Financial Statements
The Slawson participation agreement, or the Slawson Agreement, is confined to an agreed upon AMI within the Rough Rider area of McKenzie and Williams Counties in North Dakota. We have acquired approximately 6,000 net acres to date under the Slawson Agreement and have identified numerous drilling locations. We will spud our first well in October 2010 and plan to continue to drill additional wells through the end of 2011. Under the terms of the Slawson Agreement, we pay 33% of the gross well costs and between a 20% and 60% premium of our pro rata share of leasehold acquisition costs to earn a 30% working interest in all wells drilled within the AMI through January 15, 2012. We believe the terms of the Slawson Agreement are consistent with industry practice and will result in net costs to us that are substantially lower than we could achieve during the early phase of our development.
In May 2010, we entered into an agreement with Kodiak pursuant to which we have the opportunity to acquire approximately 2,600 net acres in an area of McKenzie County, or the Grizzly Project, located north and east of the Elm Coulee field. Under the terms of the agreement, we agreed to pay approximately $3.2 million to Kodiak in the form of future drilling carry for a 30% working interest in the Grizzly Project area. After the $3.2 million has been expended, we will have earned our approximately 2,600 net acres, with all future wells to be drilled according to our working interest position. As described below, we have drilled three gross wells in the Grizzly Project, two of which are awaiting completion and one of which has been production tested and is being prepared for production. We anticipate drilling an additional well by fiscal year-end.
Using industry accepted well-spacing parameters and a combination of short and long laterals, we believe that there could be over 100 unrisked drilling locations for the Bakken Shale and Three Forks formations on our acreage in the Williston Basin. Based on current industry expectations, we believe we can drill up to eight 9,500 foot lateral wells on 1,280 acre spacing units within our acreage. Consistent with leading field operators, we plan to perform multi-stage fracs with 25 to 30 stages on each lateral well. We also plan to drill shorter laterals on smaller units as dictated by our leasehold position.
In May 2010, we announced our plans to participate in the Roedeske Federal #12-21H well in McKenzie County with an approximate 15% working interest. The 9,000 foot lateral well was drilled on a 1,280 acre spacing unit and is awaiting completion with a 22-stage frac job. The well is operated by XTO Energy Inc.
In June 2010, we commenced a two well drilling program in the Grizzly Project with Kodiak as operator. The first well, the Grizzly #13-6H, is a 4,000 foot lateral re-entry of an existing wellbore. The estimated gross costs are $3.2 million and we have an approximate 26% working interest in this well. We anticipate that this well will be completed late in October 2010. The second well, the Grizzly #1-27H, is a 9,000 foot lateral well that was drilled on a 1,280 acre spacing unit. This well experienced mechanical difficulties during completion resulting in only 10 of 24 initially planned stages being completed, reducing the estimated cost of the well. The well produced 507 Boe during its initial 24 hour test and is currently being prepared for production. The gross estimated costs are $5.7 million and we have an approximate 26% working interest in this well.
We recently announced that Slawson will spud the first well of its joint venture with us on approximately October 30, 2010, the Bonanza #1-21-16H, located in the Rough Rider area in McKenzie County. We currently anticipate that Slawson will drill an additional nine wells in the Rough Rider area during the remainder of 2010 and 2011.
Maritimes Basin
We have an 87% working interest in approximately 474,625 gross acres (approximately 412,924 net acres) in the Windsor Sub-Basin of the Maritimes Basin located in the Province of Nova Scotia, Canada, or the Windsor Block. In October 2009, we completed an approximately 30-square kilometer 2D seismic shoot on the Windsor Block and completed processing and interpreting the data in the fiscal quarter ending January 31, 2010. We believe
2
Table of Contents
Index to Financial Statements
that this seismic program, combined with the completion operations on three previously drilled vertical exploration wells, satisfied the first-year requirements of our 10-year production lease. See “Business—Operations and Oil and Natural Gas Properties—Maritimes Basin” for a description of the terms of the lease. We have completed our interpretation of the seismic data on the Windsor Block and we are currently seeking partners to participate in the drilling of the test well and to participate in a joint venture to further evaluate the potential of the Windsor Block.
Our Strategy
Our goal is to increase stockholder value by increasing our Williston Basin leasehold position and converting such leasehold position into proven reserves, production and cash flow at attractive returns on invested capital. We are seeking to achieve this goal through the following strategies:
| • | Focus on the Williston Basin. We believe the Bakken Shale and Three Forks formations in the Williston Basin represent one of the largest oil deposits in North America. A report issued by the United States Geological Survey, or USGS, in April 2008 classified these formations as the largest continuous oil accumulation ever assessed by it in the contiguous United States. We expect to continue to aggressively pursue additional leasehold positions where our geologic model suggests the Bakken Shale and/or the Three Forks formations are believed to be prospective. We believe horizontal wells drilled on our acreage will generate attractive returns on invested capital given our outlook for the price of oil and the finding and development costs associated with converting the acreage from resource potential to proven and producing reserves. |
| • | Continue to pursue leasehold acquisitions at attractive costs. We believe significant additional acreage in the Williston Basin, prospective for the Bakken Shale and Three Forks formations, is and will be available for acquisition allowing us to reach our goal of 30,000 net acres by the end of 2011. We believe many of the active operators in the area have assembled sizeable leasehold positions and have shifted from a leasehold acquisition strategy to a development strategy, reducing the competition for additional leasehold acreage. We plan to explore various techniques to add acreage, including participating in state and federal lease sales, pursuing leasehold acquisitions, farm-in agreements with existing operators and farm-in opportunities on lease positions that are about to expire. We believe many operators will choose to farm-out lease positions rather than allow leases to expire, giving us an opportunity to add significant leasehold at attractive costs. |
| • | Maintain a balanced mix of operated and non-operated leasehold positions. Through our non-operated positions with Slawson and Kodiak, we plan to leverage our currently low overhead while broadening our operating experience by teaming with two of the most active and knowledgeable operators in the Williston Basin. We believe that Slawson’s and Kodiak’s long histories in the Williston Basin will also provide significant opportunities to expand our collective acreage position. We believe that the operations of Slawson and Kodiak will have lower costs resulting in higher returns than we can achieve on a stand-alone basis during the early phase of our development. With the majority of primary term leases extending three to five years from inception, we expect to build our operational capabilities and develop our operated acreage position prior to lease expiration. |
| • | Capture upside value in Nova Scotia. We hold approximately 412,924 net acres in the province of Nova Scotia in Canada that we believe contains multiple conventional and unconventional targets. Increased industry activity in the Maritimes Basin, along with other factors such as more restrictive permitting procedures in the Gulf of Mexico, has increased industry interest in this area. Recently, Southwestern Energy Company, a mid-cap independent exploration company, leased a large undeveloped acreage position in the province of New Brunswick and committed to spend $47 million on the development of such acreage. Additionally, Apache Corporation recently spudded the B-41 Green Road and the G-59 Will deMille wells pursuant to its December 2009 farm-out agreement with Corridor Resources Inc. We are currently seeking a farm-out arrangement whereby a partner will fund 100% of the cost of the first well drilled on our acreage. |
3
Table of Contents
Index to Financial Statements
| • | Maintain conservative leverage position to enhance financial flexibility. Acquisitions and farm-in opportunities will require us to move rapidly in many instances. As such, we expect to maintain excess cash balances and a conservative leverage position while we focus on leasehold acquisitions. Between now and the end of 2011, we expect to primarily use equity capital to fund our leasehold expansion and only add leverage where cash flow and reserve growth allow. |
Our Competitive Strengths
We have the following competitive strengths that we believe will help us to successfully execute our business strategies:
| • | We benefit from the increasing activity in the Bakken Shale and Three Forks formations acreage. Activity levels in the Williston Basin continue to increase with a drilling rig count of 134 at October 15, 2010 versus 65 at January 1, 2010. We benefit from the increasing number of wells drilled and the corresponding data available from public sources and the North Dakota Industrial Commission. This activity and data has begun to define the geographic extent of the Bakken Shale and Three Forks formations which we believe reduces the amount of risk we face on future leasehold acquisitions and development operations. In addition, the leading operators in the Williston Basin have developed drilling and completion technologies that have significantly reduced production risk, decreased per unit drilling and completion costs and enhanced returns. |
| • | Relatively small size allows us to make meaningful acquisitions. Our relatively small size provides us with the opportunity to acquire smaller acreage blocks that may be less attractive to larger operators inside and outside of the Williston Basin. These smaller blocks in aggregate will have a meaningful impact on our overall acreage position and should allow us to meet our goal of 30,000 net acres by year-end 2011. |
| • | Experienced management team with proven acquisition and operating capabilities. Peter Hill, our Chief Executive Officer, has over 37 years of oil and natural gas experience, including over 20 years with British Petroleum in a variety of roles including Chief Geologist, Chief of Staff for BP Exploration, President of BP Venezuela and Regional Director for Central and South America. He currently serves as the non-executive Chairman for Toreador Resources, a public company currently developing an oil shale prospect in the Paris Basin in France. He is complemented by Jonathan Samuels, our Chief Financial Officer, who spent over five years as a member of an energy focused investment management firm. |
| • | We have no outstanding indebtedness and following the offering we will have $44.7 million in cash. We expect to have approximately $44.7 million in cash after we close this offering. We will use this cash to meet our drilling commitments in 2010 and 2011 and pursue additional leasehold acquisitions, including under our recent agreement with Williston Exploration LLC. See “—Recent Developments.” |
Recent Developments
Williston Purchase—On October 5, 2010, we entered into a purchase and sale agreement with Williston Exploration LLC to acquire approximately 1,732 net acres in Williams County, North Dakota, or the Williston Purchase. These undeveloped acres are in contiguous blocks in three separate 1,280 acre drilling units and will provide our first operated drilling locations. The addition of this acreage will give us an opportunity to operate on a large portion of the acreage and we plan to drill up to two wells that we will operate by the end of 2011. The aggregate purchase price consists of up to approximately $2.2 million in cash and up to 433,500 shares of our common stock (after giving effect to the reverse stock split). We expect to close on a portion of the acres in December 2010 and on the remainder in February 2011.
4
Table of Contents
Index to Financial Statements
Oppenheimer Joint Venture—On October 22, we entered into an exploration and development agreement, or the Oppenheimer Agreement, with Oppenheimer Global Resource Private Equity Fund I and a related co-investment fund, or OGR, each a New York based investment fund managed by an affiliate of Oppenheimer & Co, Inc. Under the Oppenheimer Agreement, OGR has made a $25 million capital commitment to co-invest with us in our future acquisition and development of assets in the Williston Basin. $10 million of OGR’s initial capital, which OGR has the right to increase up to $19 million, is allocated for leasehold acquisition with the remainder available for well development. Further, OGR has the right to participate in up to 25% of our future activity in the Williston Basin. OGR will pay its share of leasehold costs in all leases in which it participates, plus a premium to us equal to an additional percentage of lease acquisition costs which is designed to remunerate us for our services in sourcing and managing the acreage activity in the Williston Basin. The acreage premium varies depending upon the level of lease acquisition costs. OGR will also bear 25% of all of our brokerage costs in the region. In addition, OGR will pay its proportional share of all drilling and completion costs, plus a 10% premium thereof to us for our services associated with well development. We will also earn an annual management fee as general and administrative expense reimbursement. Our current leasehold position, including the Grizzly Project, and any future leasehold acquisition pursuant to the Slawson Agreement, is excluded from the Oppenheimer Agreement.
Exploration and Development Activity—Beginning in the fourth quarter of 2010, we believe we will participate in the drilling of up to 20 gross (5.3 net) wells by the end of 2011. We anticipate participating in two gross (1.25 net) wells in the acreage being acquired from Williston Exploration LLC, 10 gross (2.0 net) wells on our Slawson AMI, two to four gross (0.7 to 1.40 net) wells in the Grizzly Project and up to four gross (0.6 net) wells in our other non-operated areas. With an average drilling and completion cost of $7.0 million per well, we have budgeted a range of anticipated drilling capital costs of $30 to $40 million over this period.
Reverse Stock Split and NYSE Amex Listing
Prior to the closing of this offering, we will complete a 1-for-10 reverse stock split, or the reverse stock split, which is intended to increase our ability to meet the minimum share price requirement of the NYSE Amex LLC, or AMEX. Although we have already received conditional approval to list our common stock on AMEX, such listing is conditioned upon completion of the reverse stock split and final approval of AMEX.
We received stockholder approval at our 2010 annual meeting of stockholders held on September 16, 2010 granting discretionary authority to our board of directors, or the Board, to effect the reverse stock split. In connection with the reverse stock split, we also received stockholder approval to amend our articles of incorporation to decrease the number of shares of authorized common stock from 150,000,000 shares to 70,000,000 shares. Such decrease is conditioned upon effecting the reverse stock split. We intend to amend our articles of incorporation to decrease the number of authorized shares simultaneously with the reverse stock split.
Corporate Information
We were incorporated in the State of Nevada on December 11, 2003 under the name Peloton Resources Inc. On May 10, 2005, we changed our name to Triangle Petroleum Corporation. Our principal executive office is located at 1625 Broadway, Suite 780, Denver, Colorado 80202 and our telephone number at that address is (303) 260-7125. Our website is www.trianglepetroleum.com. The information on our website is not part of this prospectus.
5
Table of Contents
Index to Financial Statements
THE OFFERING
| Issuer |
Triangle Petroleum Corporation |
| Common stock offered by us |
9,000,000 shares |
| Common stock outstanding immediately after this offering |
19,539,084 shares |
| Over-allotment option |
We have granted the underwriters a 30-day option to purchase up to an aggregate of 1,350,000 additional shares of our common stock to cover any over-allotments. |
| Use of proceeds |
We estimate that our net proceeds from this offering will be approximately $44 million after deducting the underwriting discounts and commissions and estimated offering expenses. |
We intend to use the net proceeds from this offering to fund our drilling and development expenditures, leasehold acquisitions, including the Williston Purchase, and general corporate purposes, including working capital.
| Dividend policy |
We have not and do not expect to declare or pay any cash or other dividends in the foreseeable future on our common stock. See “Dividend Policy.” |
| Risk factors |
You should carefully read and consider the information beginning on page 9 of this prospectus set forth under the heading “Risk Factors” and all other information set forth in this prospectus before deciding to invest in our common stock. |
| Proposed AMEX symbol |
“TPLM” |
The number of shares to be outstanding after this offering is based on (i) 10,105,584 shares of our common stock outstanding as of October 22, 2010 (after giving effect to the reverse stock split), (ii) up to 433,500 shares of our common stock that may be issued in connection with the Williston Purchase (after giving effect to the reverse stock split) and (iii) excludes 1,010,559 additional shares (after giving effect to the reverse stock split) that are authorized for future issuance under our equity incentive plans, of which 340,000 shares (after giving effect to the reverse stock split) may be issued pursuant to outstanding stock options.
Unless otherwise indicated, the information in this prospectus assumes that the underwriters will not exercise their over-allotment option.
6
Table of Contents
Index to Financial Statements
SUMMARY HISTORICAL CONSOLIDATED FINANCIAL DATA
The following table presents our summary historical consolidated financial data as of the dates and for the periods as indicated. The consolidated income statement and other consolidated financial data for each of the fiscal years in the three years ended January 31, 2010, and the consolidated balance sheet data as of each of such periods, have been derived from our consolidated financial statements, which have been audited by our independent registered public accounting firm. The consolidated income statement and other consolidated financial data for the fiscal six months ended July 31, 2009 and July 31, 2010, and the consolidated balance sheet data as of July 31, 2010, have been derived from our unaudited interim consolidated financial statements included elsewhere in this prospectus. The unaudited interim consolidated financial statements have been prepared on a basis consistent with the audited consolidated financial statements and, in the opinion of our management, include all adjustments (including normal recurring accruals) necessary for a fair presentation of such data. Our results for the interim period are not necessarily indicative of results for a full year. Our historical consolidated financial data should be read in conjunction with our historical consolidated financial statements and the accompanying notes and “Management’s Discussion and Analysis of Financial Condition and Results of Operations” included elsewhere in this prospectus.
| Years ended January 31, | Six months ended July 31, | |||||||||||||||||||
| 2008 | 2009 | 2010 | 2009 | 2010 | ||||||||||||||||
| (unaudited) | ||||||||||||||||||||
| INCOME STATEMENT |
||||||||||||||||||||
| Revenue, net of royalties |
$ | 586,804 | $ | 386,892 | $ | 131,245 | $ | 63,087 | $ | 41,722 | ||||||||||
| Operating Expenses |
||||||||||||||||||||
| Oil and gas production |
$ | 304,537 | $ | 125,777 | $ | 95,852 | $ | 52,576 | $ | 13,495 | ||||||||||
| Depletion and accretion |
441,881 | 200,050 | 188,788 | 91,477 | 131,795 | |||||||||||||||
| Depreciation—property and equipment |
40,429 | 39,448 | 26,198 | 11,674 | 13,864 | |||||||||||||||
| General and administrative |
5,800,116 | 4,045,906 | 3,987,012 | 1,675,148 | 1,655,125 | |||||||||||||||
| Foreign exchange (gain) loss |
317,656 | 2,682,873 | (753,950 | ) | (707,654 | ) | (30,141 | ) | ||||||||||||
| Gain on sale of assets |
— | (126,314 | ) | (1,266,294 | ) | (124,621 | ) | (976,900 | ) | |||||||||||
| Ceiling test write-down on oil and gas properties |
19,598,916 | 8,308,229 | — | — | — | |||||||||||||||
| Total Operating Expenses |
$ | 26,503,535 | $ | 15,275,969 | $ | 2,277,606 | $ | 998,600 | $ | 807,238 | ||||||||||
| Total Other Income (Expense) |
$ | (3,684,016 | ) | $ | 1,118,592 | $ | 6,260 | $ | 6,213 | $ | 373 | |||||||||
| Net Income (Loss) for the Period |
$ | (29,600,747 | ) | $ | (13,770,485 | ) | $ | (2,140,101 | ) | $ | (929,300 | ) | $ | (765,516 | ) | |||||
| STATEMENT OF CASH FLOWS |
||||||||||||||||||||
| Net Cash Used In Operating Activities |
$ | (4,246,258 | ) | $ | (3,898,095 | ) | $ | (2,099,940 | ) | $ | (890,162 | ) | $ | (1,640,608 | ) | |||||
| Net Cash Used In Investing Activities |
$ | (22,279,141 | ) | $ | (1,190,231 | ) | $ | (2,192,365 | ) | $ | (2,712,803 | ) | $ | (9,898,918 | ) | |||||
| Net Cash Provided By Financing Activities |
$ | 25,308,006 | $ | 12,002,541 | $ | — | $ | — | $ | 8,699,426 | ||||||||||
7
Table of Contents
Index to Financial Statements
| As of January 31, | As of July
31, 2010 |
|||||||||||
| 2009 | 2010 | |||||||||||
| (unaudited) | ||||||||||||
| BALANCE SHEET |
||||||||||||
| ASSETS |
||||||||||||
| Cash |
$ | 8,449,471 | $ | 4,878,601 | $ | 2,050,357 | ||||||
| Total Current Assets |
$ | 9,787,821 | $ | 5,535,021 | $ | 4,425,062 | ||||||
| Property and Equipment |
39,765 | 39,296 | 25,432 | |||||||||
| Oil and Gas Properties |
16,942,864 | 18,783,375 | 27,995,018 | |||||||||
| Total Assets |
$ | 26,770,450 | $ | 24,357,692 | $ | 32,445,512 | ||||||
| STOCKHOLDERS’ EQUITY |
||||||||||||
| Common Stock |
$ | 699 | $ | 699 | $ | 990 | ||||||
| Additional Paid-In Capital |
81,155,715 | 81,950,076 | 95,370,116 | |||||||||
| Warrants |
4,237,100 | 4,237,100 | — | |||||||||
| Deficit |
(61,564,544 | ) | (63,704,645 | ) | (64,469,788 | ) | ||||||
| Total Stockholders’ Equity |
$ | 23,828,970 | $ | 22,483,230 | $ | 30,901,318 | ||||||
8
Table of Contents
Index to Financial Statements
You should carefully consider the following risk factors and all other information contained in this prospectus in evaluating our business and prospects. The risks and uncertainties described below are not the only ones we face. Additional risks and uncertainties, other than those we describe below, that are not presently known to us or that we currently believe are immaterial, may also impair our business operations. If any of the following risks occur, our business, financial condition and results of operations could be harmed.
Risks Relating to Our Business
We have a history of losses which may continue and negatively impact our ability to achieve our business objectives.
We incurred net losses of $13,770,485 and $2,140,101 for the fiscal years ended January 31, 2009 and 2010, respectively, and a net loss of $765,516 for the fiscal six months ended July 31, 2010. We cannot assure you that we can achieve or sustain profitability on a quarterly or annual basis in the future. Our operations are subject to the risks and competition inherent in the oil and natural gas industry. We cannot assure you that future operations will be profitable. Revenues and profits, if any, will depend upon various factors, including whether we will be able to expand our revenues. We may not achieve our business objectives and the failure to achieve such goals would have an adverse impact on our business, financial condition and result of operations.
Oil and natural gas drilling is a speculative activity and involves numerous risks and substantial and uncertain costs that could adversely affect us.
An investment in us should be considered speculative due to the nature of our involvement in the exploration for, and the acquisition, development and production of, oil and natural gas. Oil and natural gas operations involve many risks, which even a combination of experience and knowledge and careful evaluation may not be able to overcome. There is no assurance that commercial quantities of oil and natural gas will be discovered or acquired by us.
We have substantial capital requirements that, if not met, may hinder our operations.
We anticipate that we will make substantial capital expenditures for the acquisition, exploration, development and production of oil and natural gas reserves in the future and for future drilling programs, including our obligations under the Slawson Agreement, the Kodiak Agreement and the Oppenheimer Agreement. If we have insufficient revenues, we may have a limited ability to expend the capital necessary to undertake or complete future drilling programs. We cannot assure you that debt or equity financing, or cash generated by operations, will be available or sufficient to meet these requirements or for other corporate purposes, or if debt or equity financing is available, that it will be on terms acceptable to us. Moreover, future activities may require us to alter our capitalization significantly. Our inability to access sufficient capital for our operations could have a material adverse effect on our business, financial condition, results of operations or prospects.
The termination of our agreements with Slawson, Kodiak or OGR could have a material adverse effect on our business, financial condition and results of operations.
Our agreements with Slawson, Kodiak and OGR are essential to us and our future development. Our agreement with Slawson remains in effect as long as there is a producing well and for a period of 90 days thereafter, but may be continued if another well is being drilled or reworked at the end of this period. Our agreement with OGR remains in effect until the third anniversary of its effective date unless either OGR achieves certain acquisition thresholds before that date and elects to extend the term of the agreement, or OGR fails to achieve certain thresholds and we elect to terminate the agreement. Also, OGR may terminate the agreement if our net worth falls below a certain level or OGR determines that changes in our executive management team or financial prospects are not satisfactory. Termination of any of these agreements would require us to seek another collaborative relationship in that territory. We cannot assure you that a suitable alternative third party would be
9
Table of Contents
Index to Financial Statements
identified, and even if identified, we cannot assure you that the terms of any new relationship would be commercially acceptable to us, and as a result, any such termination could have a material adverse effect on our business, financial condition and results of operations.
Our agreements with Slawson, Kodiak and OGR and other agreements that we may enter into, present a number of challenges that could have a material adverse effect on our business, financial condition and results of operations.
Our agreements with Slawson, Kodiak and OGR represent a significant portion of our business in the near future. In addition, as part of our business strategy, we plan to enter into other similar transactions, some of which may be material. These transactions typically involve a number of risks and present financial, managerial and operational challenges, including the existence of unknown potential disputes, liabilities or contingencies that arise after entering into these arrangements related to the counterparties to such arrangements. We could experience financial or other setbacks if such transactions encounter unanticipated problems due to challenges, including problems related to execution or integration. Any of these risks could reduce our revenues or increase our expenses, which could adversely affect our business, financial condition or results of operations.
We depend on successful exploration, development and acquisitions to develop any future reserves and grow production and revenue in the future.
Acquisitions of oil and natural gas acreage, reserves and assets are typically based on engineering and economic assessments made by independent engineers and our own assessments. These assessments will include a series of assumptions regarding such factors as recoverability and marketability of oil and natural gas, future prices of oil and natural gas and operating costs, future capital expenditures and royalties and other government levies which will be imposed over the producing life of the reserves. Many of these factors are subject to change and are beyond our control. In particular, the prices of and markets for oil and natural gas products may change from those anticipated at the time of making such assessment. In addition, all such assessments involve a measure of geologic and engineering uncertainty that could result in lower production and reserves than anticipated. Initial assessments of acquisitions may be based on reports by a firm of independent engineers that are not the same as the firm that we have used. Because each firm may have different evaluation methods and approaches, these initial assessments may differ significantly from the assessments of the firm used by us.
Properties we acquire may be in an unexpected condition and may subject us to increased costs and liabilities, including environmental liabilities. Although we review acquired properties prior to acquisition in a manner consistent with industry practices, such reviews are not capable of identifying all potential conditions. Generally, it is not feasible to review in depth every individual property involved in each acquisition. Ordinarily, we will focus our review efforts on the higher value properties or properties with known adverse conditions and will sample the remainder. However, even a detailed review of records and properties may not necessarily reveal existing or potential problems or permit a buyer to become sufficiently familiar with the properties to assess fully their condition or any deficiencies. Inspections may not always be performed on every well, and environmental problems, such as ground water contamination, are not necessarily observable even when an inspection is undertaken. As a result, we may not acquire good title to some of our acquired properties and we may assume unknown liabilities that could have a material adverse effect on our business, financial condition and results of operations.
We may have difficulty managing growth in our business, which could adversely affect our business plan, financial condition and results of operations.
Growth in accordance with our business plan, if achieved, will place a significant strain on our financial, technical, operational and management resources. As we expand our activities and increase the number of projects we are evaluating or in which we participate, there will be additional demands on these resources. The failure to continue to upgrade our technical, administrative, operating and financial control systems or the occurrences of unexpected expansion difficulties, including the failure to recruit and retain experienced
10
Table of Contents
Index to Financial Statements
managers, geologists, engineers and other professionals in the oil and natural gas industry, could have a material adverse effect on our business, financial condition and results of operations and our ability to timely execute our business plan.
Substantially all of our net leasehold acreage is undeveloped, and that acreage may not ultimately be developed or become commercially productive, which could have a material adverse effect on our future oil and natural gas reserves and production and, therefore, our future cash flow and income.
Substantially all of our net leasehold acreage is undeveloped, or acreage on which wells have not been drilled or completed to a point that would permit the production of commercial quantities of oil and natural gas. In addition, many of our oil and natural gas leases require us to drill wells that are commercially productive, and if we are unsuccessful in drilling such wells, we could lose our rights under such leases. We intend to use some of the proceeds from this offering to develop our leasehold acreage by funding our exploration, exploitation and development activities. Our future oil and natural gas reserves and production and, therefore, our future cash flow and income are highly dependent on successfully developing our undeveloped leasehold acreage.
We may be unable to successfully acquire additional leasehold interests or other oil and natural gas properties, which may inhibit our ability to grow our production.
Acquisitions of leasehold interests or other oil and natural gas properties have been an important element of our business, and we will continue to pursue acquisitions in the future. In the last several years, we have pursued and consummated leasehold or other property acquisitions that have provided us opportunities to expand our acreage position and, to a lesser extent, grow our production. Although we regularly engage in discussions and submit proposals regarding leasehold interests or other properties, suitable acquisitions may not be available in the future on reasonable terms.
As most of our properties are in the exploration stage, we cannot assure you that we will establish commercial discoveries on our properties.
Exploration for economically recoverable reserves of oil and natural gas is subject to a number of risks. Few properties that are explored are ultimately developed into producing oil and/or natural gas wells. Most of our properties are only in the exploration stage and we have only limited revenues from operations. While we do have a limited amount of production of natural gas, we may not establish commercial discoveries on any of our properties. Failure to do so would have a material adverse effect on our business, financial condition and results of operations.
We have a limited operating history in the Bakken Shale and Three Forks formations in North Dakota and if we are not successful in continuing to grow our business, then we may have to scale back or even cease our ongoing business operations.
We have a limited operating history in the Bakken Shale and Three Forks formations in North Dakota. Our success is significantly dependent on a successful acquisition, drilling, completion and production program. Our operations in the Bakken Shale and Three Forks formations will be subject to all the risks inherent in the establishment of a developing enterprise and the uncertainties arising from the absence of a significant operating history. We may be unable to locate recoverable reserves or operate on a profitable basis. We are in the early stage of the exploration and development phase of our plan and potential investors should be aware of the difficulties normally encountered by enterprises in this stage. If our business plan is not successful and we are not able to operate profitably, investors may lose some or all of their investment.
Our method of accounting for investments in oil and natural gas properties may result in impairment of asset value.
We follow the full cost method of accounting for oil and natural gas properties. Accordingly, all costs associated with the acquisition, exploration and development of oil and natural gas properties, including costs of
11
Table of Contents
Index to Financial Statements
undeveloped leasehold, geological and geophysical expenses, dry holes, leasehold equipment and legal due diligence costs directly related to acquisition, exploration and development activities, are capitalized. Capitalized costs of oil and natural gas properties also include estimated asset retirement costs recorded based on the fair value of the asset retirement obligation when incurred. The capitalized costs plus future development and dismantlement costs are depleted and charged to operations using the equivalent unit-of-production method based on proved oil and natural gas reserves as determined by our independent petroleum engineers. To the extent that such capitalized costs, net of depletion and amortization, exceed the present value of estimated future net revenues, discounted at 10%, from proved oil and natural gas reserves, after income tax effects, such excess costs are charged to operations, which may have a material adverse effect on our business, financial condition and results of operations. Once incurred, a write down of oil and natural gas properties is not reversible at a later date, even if oil or natural gas prices increase. See “Management’s Discussion and Analysis of Financial Condition and Results of Operations—Critical Accounting Policies—Investment in Oil and Natural Gas Properties” for a more detailed description of our method of accounting.
We cannot control the activities on the properties we do not operate and are unable to ensure their proper operation and profitability.
We currently do not operate substantially all of the properties in which we have an interest, including all of our acreage in the Bakken Shale and Three Forks formations; however, we currently control and intend to operate 10% to 15% of the acreage from the Williston Purchase. As a result, we have limited ability to exercise influence over, and control the risks associated with, operations of these properties. The failure of an operator of our wells to adequately perform operations, an operator’s breach of the applicable agreements or an operator’s failure to act in our best interests could reduce our production and revenues. The success and timing of our drilling and development activities on properties operated by others therefore depends upon a number of factors outside of our control, including the operator’s timing and amount of capital expenditures, expertise and financial resources, inclusion of other participants in drilling wells and use of technology.
Our lack of diversification will increase the risk of an investment in us.
Our current business focus is on the oil and natural gas industry in a limited number of properties, primarily in North Dakota. Larger companies have the ability to manage their risk by diversification. However, we currently lack diversification, in terms of both the nature and geographic scope of our business. As a result, we will likely be impacted more acutely by factors affecting our industry or the regions in which we operate, such as the Bakken Shale and Three Forks formations, than we would if our business were more diversified, increasing our risk profile.
Because we have a small asset base and have limited access to additional capital, we may have to limit our exploration activity, which may result in a loss of investment.
We have a small asset base and limited access to additional capital. Due to our brief operating history and historical operating losses, our operations have not been a source of liquidity and we expect to raise additional capital through equity financings. We presently do not have any available credit or bank financing sources of liquidity. We expect significant capital expenditures during the next 12 months for land acquisitions and drilling programs on our U.S. oil shale program and for overhead and working capital purposes. We cannot assure you that we will be successful in obtaining additional funding. In that event, we may not be able to complete our planned exploration programs. If additional financing is not available or is not available on acceptable terms, we will have to curtail our operations and investors may lose their investment.
If we are unable to raise additional funds or secure a new joint operating partner in the Windsor Block, we may be required to surrender the Windsor Block lease.
On April 15, 2009, we entered into a 10-year production lease for approximately 474,625 gross acres (approximately 412,924 net acres) of land. In April 2011, we are required to provide a technical report and the Nova Scotia government may request the surrender of certain lands they deem not adequately evaluated. At the
12
Table of Contents
Index to Financial Statements
end of the fifth year of the lease, areas of the land block not adequately drilled or otherwise evaluated may be subject to surrender. Since April 15, 2009, we have completed three exploration wells and acquired seismic data towards the production lease commitments. There is a risk that our joint venture partner in the Windsor Block will not be able to pay for their portion (13%) of the well costs, which could also slow down or stop exploration on the Windsor Block.
We will have to raise additional funds or secure a new joint operating partner in the Windsor Block to complete the exploration and development phase of our Windsor Block programs and we cannot assure you that we will be able to do so. There is a risk that we may not obtain the necessary additional funds or a new partner to continue operations and to determine the existence, discovery and successful exploitation of economically recoverable reserves and the attainment of profitable operations on our Windsor Block. If we do not obtain additional funds or secure a new partner, we may be required to surrender the lease.
We face strong competition from other oil and natural gas companies.
We encounter competition from other oil and natural gas companies in all areas of our operations, including the acquisition of exploratory prospects and proven properties. Our competitors include major oil and natural gas companies and numerous independent oil and natural gas companies, individuals and drilling and income programs. Many of our competitors have been engaged in the oil and natural gas business much longer than we have and possess substantially larger operating staffs and greater capital resources than us. These companies may be able to pay more for exploratory projects and productive oil and natural gas properties and may be able to define, evaluate, bid for and purchase a greater number of properties and prospects than our financial or human resources permit. In addition, these companies may be able to expend greater resources on the existing and changing technologies that we believe are and will be increasingly important to attaining success in the industry. Such competitors may also be in a better position to secure oilfield services and equipment on a timely basis or on more favorable terms. We may not be able to conduct our operations, evaluate and select suitable properties and consummate transactions successfully in this highly competitive environment.
Current global financial conditions have been characterized by increased volatility which could have a material adverse effect on our business, prospects, liquidity, financial condition and results of operations.
Current global financial conditions and recent market events have been characterized by increased volatility and the resulting tightening of the credit and capital markets has reduced the amount of available liquidity and overall economic activity. We cannot assure you that debt or equity financing, the ability to borrow funds or cash generated by operations will be available or sufficient to meet or satisfy our initiatives, objectives or requirements. Our inability to access sufficient amounts of capital on terms acceptable to us for our operations could have a material adverse effect on our business, prospects, liquidity, financial condition and results of operations.
The potential profitability of oil and natural gas properties depends upon factors beyond our control.
The potential profitability of oil and natural gas properties is dependent upon many factors beyond our control. For instance, world prices and markets for oil and natural gas are unpredictable, highly volatile, potentially subject to governmental fixing, pegging, controls or any combination of these and other factors, and respond to changes in domestic, international, political, social and economic environments. Additionally, due to worldwide economic uncertainty, the availability and cost of funds for production and other expenses have become increasingly difficult, if not impossible, to project. These changes and events may materially affect our financial performance. In addition, a productive well may become commercially unproductive in the event that water or other deleterious substances are encountered which impair or prevent the production of oil and/or natural gas from the well. In addition, production from any well may be unmarketable if it is impregnated with water or other deleterious substances. These factors cannot be accurately predicted and the combination of these factors may result in us not receiving an adequate return on invested capital.
13
Table of Contents
Index to Financial Statements
Seasonal weather conditions and other factors could adversely affect our ability to conduct drilling activities.
Our operations could be adversely affected by weather conditions and wildlife restrictions on federal leases. In the Williston Basin and in Canada, drilling and other oil and natural gas activities cannot be conducted as effectively during the winter months. Winter and severe weather conditions limit and may temporarily halt the ability to operate during such conditions. These constraints and the resulting shortages or high costs could delay or temporarily halt our oil and natural gas operations and materially increase our operating and capital costs, which could have a material adverse effect on our business, financial condition and results of operations.
If we are unable to retain the services of Dr. Hill and Mr. Samuels, or if we are unable to successfully recruit qualified managerial and field personnel having experience in oil and natural gas exploration, we may not be able to continue our operations.
Our success depends to a significant extent upon the continued services of our directors and officers and, in particular, Peter Hill, our Chief Executive Officer, and Jonathan Samuels, our Chief Financial Officer. Loss of the services of Dr. Hill or Mr. Samuels could have a material adverse effect on our growth, revenues and prospective business. We have not and do not expect to obtain key man insurance on our management. In addition, in order to successfully implement and manage our business plan, we will be dependent upon, among other things, successfully recruiting qualified managerial and field personnel having experience in the oil and natural gas exploration business. Competition for qualified individuals is intense. We cannot assure you that we will be able to retain existing employees or that we will be able to find, attract and retain qualified personnel on acceptable terms.
The marketability of natural resources will be affected by numerous factors beyond our control.
The markets and prices for oil and natural gas depend on numerous factors beyond our control. These factors include demand for oil and natural gas, which fluctuate with changes in market and economic conditions, and other factors, including:
| • | worldwide and domestic supplies of oil and natural gas; |
| • | actions taken by foreign oil and natural gas producing nations; |
| • | political conditions and events (including instability or armed conflict) in oil-producing or natural gas-producing regions; |
| • | the level of global and domestic oil and natural gas inventories; |
| • | the price and level of foreign imports; |
| • | the level of consumer demand; |
| • | the price and availability of alternative fuels; |
| • | the availability of pipeline or other takeaway capacity; |
| • | weather conditions; |
| • | terrorist activity; |
| • | domestic and foreign governmental regulations and taxes; and |
| • | the overall worldwide and domestic economic environment. |
Significant declines in oil and natural gas prices for an extended period may have the following effects on our business:
| • | adversely affect our financial condition, liquidity, ability to finance planned capital expenditures and results of operations; |
14
Table of Contents
Index to Financial Statements
| • | cause us to delay or postpone some of our capital projects; |
| • | reduce our revenues, operating income and cash flow; and |
| • | limit our access to sources of capital. |
We may have difficulty distributing our oil and natural gas production, which could harm our financial condition.
In order to sell the oil and natural gas that we are able to produce from the Williston Basin and the Maritimes Basin, we may have to make arrangements for storage and distribution to the market. We will rely on local infrastructure and the availability of transportation for storage and shipment of our products, but infrastructure development and storage and transportation facilities may be insufficient for our needs at commercially acceptable terms in the localities in which we operate. This situation could be exacerbated to the extent that our operations are conducted in remote areas that are difficult to access, such as areas that are distant from shipping and/or pipeline facilities. These factors may affect our ability to explore and develop properties and to store and transport our oil and natural gas production, which may increase our expenses.
Furthermore, weather conditions or natural disasters, actions by companies doing business in one or more of the areas in which we will operate or labor disputes may impair the distribution of oil and/or natural gas and in turn diminish our financial condition or ability to maintain our operations.
Our significant stockholders may have substantial influence over our business and affairs.
As of October 22, 2010, Cambrian Capital L.P. and Palo Alto Investors, LLC each own greater than 10% of our issued and outstanding shares of common stock. As a result, each of these investors currently has substantial influence over the outcome of certain matters requiring stockholder approval, including the power to, among other things:
| • | amend our articles of incorporation, other than with respect to the reverse stock split that has already been approved by our stockholders; |
| • | elect and remove our directors and control the appointment of our senior management; and |
| • | prevent our ability to be acquired and complete other significant corporate transactions. |
Oil and natural gas operations are subject to comprehensive regulation which may cause substantial delays or require capital outlays in excess of those anticipated, causing an adverse effect on us.
Oil and natural gas operations are subject to federal, state, provincial and local laws relating to the protection of the environment, including laws regulating removal of natural resources from the ground and the discharge of materials into the environment. Oil and natural gas operations are also subject to federal, state, provincial and local laws and regulations which seek to maintain health and safety standards by regulating the design and use of drilling methods and equipment. Various permits from government authorities are required for drilling operations to be conducted and no assurance can be given that such permits will be received. The failure or delay in obtaining the requisite approvals or permits may adversely affect our business, financial condition and results of operations.
Hydraulic fracturing, the process used for releasing oil and natural gas from shale rock, has recently come under increased scrutiny and could be the subject of further regulation that could impact the timing and cost of development.
The Environmental Protection Agency, or EPA, recently amended the Underground Injection Control, or UIC, provisions of the federal Safe Drinking Water Act, or the SDWA, to exclude hydraulic fracturing from the
15
Table of Contents
Index to Financial Statements
definition of “underground injection.” However, the U.S. Senate and House of Representatives are currently considering bills entitled the Fracturing Responsibility and Awareness of Chemicals Act, or the FRAC Act, to amend the SDWA to repeal this exemption. If enacted, the FRAC Act would amend the definition of “underground injection” in the SDWA to encompass hydraulic fracturing activities, which could require hydraulic fracturing operations to meet permitting and financial assurance requirements, adhere to certain construction specifications, fulfill monitoring, reporting, and recordkeeping obligations, and meet plugging and abandonment requirements. The FRAC Act also proposes to require the reporting and public disclosure of chemicals used in the fracturing process, which could make it easier for third parties opposing the hydraulic fracturing process to initiate legal proceedings based on allegations that specific chemicals used in the fracturing process could adversely affect groundwater.
Hydraulic fracturing is the primary production method used to produce reserves located in the Bakken Shale and Three Forks formations. Depending on the legislation that may ultimately be enacted or the regulations that may be adopted at the federal, state and/or provincial levels, exploration and production activities that entail hydraulic fracturing could be subject to additional regulation and permitting requirements. Individually or collectively, such new legislation or regulation could lead to operational delays or increased operating costs and could result in additional burdens that could increase the costs and delay the development of unconventional oil and natural gas resources from shale formations which are not commercial without the use of hydraulic fracturing. This could have an adverse effect on our business, financial condition and results of operations.
Exploration activities are subject to certain environmental regulations which may prevent or delay the commencement or continuance of our operations.
In general, our exploration activities are subject to certain federal, state, provincial and local laws and regulations relating to environmental quality and pollution control. Specifically, we are subject to legislation regarding emissions into the environment, water discharges and storage and disposition of hazardous wastes. These laws and regulations may require the acquisition of permits before drilling commences; restrict the types, quantities and concentration of various substances that can be released into the environment from drilling and production activities; limit or prohibit drilling activities on certain lands lying within wilderness, wetlands and other protected areas; require remedial measures to mitigate pollution from former operations, such as plugging abandoned wells; and impose substantial liabilities for pollution resulting from our operations. Such laws and regulations increase the costs of our exploration activities and may prevent or delay the commencement or continuance of a given operation. In addition, legislation has been enacted which requires well and facility sites to be abandoned and reclaimed to the satisfaction of state or provincial authorities. Such laws and regulations are frequently changed and we are unable to predict the ultimate cost of compliance.
With the introduction of the Kyoto Protocol, oil and natural gas producers may be required to reduce greenhouse gas emissions. This could result in, among other things, increased operating and capital expenditures for those producers. This could also make certain production of oil or natural gas by those producers uneconomic, resulting in reductions in such production. The Kyoto Protocol was ratified by the Canadian government in December of 2002 and commits Canada to reducing its greenhouse gas emissions levels to 6% below 1990 “business-as-usual” levels by 2012. It officially came into force on February 16, 2005. Since that date the Canadian government has indicated it will be unable to meet its Kyoto Protocol commitments. We are unable to predict the effect on our business, financial condition and results of operations of the ratification of the Kyoto Protocol by the Canadian federal government or its subsequent position that Canada cannot meet its commitments thereunder.
The first commitment period under the Kyoto Protocol ends in 2012. Government leaders and representatives from approximately 170 countries met in Copenhagen, Denmark from December 7 through 18, 2009, or the Copenhagen Conference, to attempt to negotiate a successor to the Kyoto Protocol. The Copenhagen Conference resulted in a broad political consensus rather than a binding international treaty, or the Copenhagen Accord, that has not been endorsed by all participating countries. The Copenhagen Accord reinforces the commitment to reducing the emissions of greenhouse gas, or GHGs, contained in the Kyoto Protocol and
16
Table of Contents
Index to Financial Statements
promises funding to help developing countries mitigate and adapt to climate change. In response to the Copenhagen Accord, the Canadian government indicated on January 29, 2010 that it will seek to achieve a 17% reduction in GHG emissions from its 2005 levels by 2020. We are unable to predict the effect that compliance with the Copenhagen Accord by the Canadian federal government will have on our business, financial condition and results of operation.
Climate change laws and regulations restricting emissions of greenhouse gases could result in increased operating costs and reduced demand for the oil and natural gas that we produce while the physical effects of climate change could disrupt our production and cause us to incur significant costs in preparing for, or responding to, those effects.
On December 15, 2009, the EPA published its findings that emissions of carbon dioxide, methane and other greenhouse gases present an endangerment to human health and the environment because emissions of such gases are, according to the EPA, contributing to the warming of the earth’s atmosphere and other climatic changes. These findings by the EPA allowed the agency to proceed with the adoption and implementation of regulations that would restrict emissions of greenhouse gases under existing provisions of the federal Clean Air Act. Consequently, the EPA proposed two sets of regulations that would require a reduction in emissions of greenhouse gases from motor vehicles and, also, could trigger permit review for greenhouse gas emissions from certain stationary sources. In addition, on October 30, 2009, the EPA published a final rule requiring the reporting of greenhouse gas emissions from specified large greenhouse gas emission sources in the United States beginning in 2011 for emissions occurring in 2010. The adoption and implementation of any regulations imposing reporting obligations on, or limiting emissions of greenhouse gases from, our equipment and operations could require us to incur costs to reduce emissions of greenhouse gases associated with our operations or could adversely affect demand for the oil and natural gas we produce.
Also, on June 26, 2009, the U.S. House of Representatives passed the American Clean Energy and Security Act of 2009, or ACESA, which would establish an economy-wide cap-and-trade program to reduce United States emissions of greenhouse gases including carbon dioxide and methane that may contribute to the warming of the Earth’s atmosphere and other climatic changes. If it becomes law, ACESA would require a 17% reduction in greenhouse gas emissions from 2005 levels by 2020 and just over an 80% reduction of such emissions by 2050. Under this legislation, the EPA would issue a capped and steadily declining number of tradable emissions allowances to certain major sources of greenhouse gas emissions so that such sources could continue to emit greenhouse gases into the atmosphere. These allowances would be expected to escalate significantly in cost over time. The net effect of ACESA will be to impose increasing costs on the combustion of carbon-based fuels such as oil, refined petroleum products and natural gas. The U.S. Senate has begun work on its own legislation for restricting domestic greenhouse gas emissions and President Obama has indicated his support of legislation to reduce greenhouse gas emissions through an emission allowance system. Although it is not possible at this time to predict when the Senate may act on climate change legislation or how any bill passed by the Senate would be reconciled with ACESA, any future federal laws or implementing regulations that may be adopted to address greenhouse gas emissions could require us to incur increased operating costs and could adversely affect demand for the oil and natural gas we produce.
Finally, it should be noted that some scientists have concluded that increasing concentrations of greenhouse gases in the Earth’s atmosphere may produce climate changes that have significant physical effects, such as increased frequency and severity of storms, floods and other climatic events. If any such effects were to occur, they could have an adverse effect on our exploration and production operations. Significant physical effects of climate change could also have an indirect effect on our financing and operations by disrupting the transportation or process-related services provided by midstream companies, service companies or suppliers with whom we have a business relationship. We may not be able to recover through insurance some or any of the damages, losses or costs that may result from potential physical effects of climate change and as a result, this could have a material adverse effect on our business, financial condition and results of operations.
17
Table of Contents
Index to Financial Statements
Exploratory drilling involves many risks and we may become liable for pollution or other liabilities which may have an adverse effect on our financial position and results of operations.
Drilling operations generally involve a high degree of risk. Hazards such as unusual or unexpected geological formations, power outages, labor disruptions, blow-outs, sour gas leakage, fire, inability to obtain suitable or adequate machinery, equipment or labor and other risks are involved. We may become subject to liability for pollution or hazards against which we cannot adequately insure or for which we may elect not to insure. Incurring any such liability may have a material adverse effect on our financial position and results of operations.
Any change in government regulation and/or administrative practices may have a negative impact on our ability to operate and on our profitability.
The laws, regulations, policies or current administrative practices of any government body, organization or regulatory agency in the United States or Canada or any other jurisdiction may be changed, applied or interpreted in a manner which will fundamentally alter our ability to carry on our business. The actions, policies or regulations, or changes thereto, of any government body or regulatory agency, or other special interest groups, may have a detrimental effect on us. Any or all of these situations may have a negative impact on our ability to operate and/or our profitability.
Aboriginal claims could have an adverse effect on us and our operations.
Aboriginal peoples have claimed aboriginal title and rights to portions of Canada where we operate, including in Nova Scotia, where our Windsor Block acreage is located. We are not aware that any claims have been made in respect of our property and assets. However, if a claim arose and was successful, it could have an adverse effect on us and our operations.
We do not plan to insure against all potential operating risks. We might incur substantial losses from, and be subject to substantial liability claims for, uninsured or underinsured risks related to our oil and natural gas operations.
We do not intend to insure against all risks. Our oil and natural gas exploration and production activities will be subject to hazards and risks associated with drilling for, producing and transporting oil and natural gas, and any of these risks can cause substantial losses resulting from:
| • | environmental hazards, such as uncontrollable flows of oil, natural gas, brine, well fluids, toxic gas or other pollution into the environment, including groundwater and shoreline contamination; |
| • | abnormally pressured formations; |
| • | mechanical difficulties, such as stuck oil field drilling and service tools and casing collapse; |
| • | fires and explosions; |
| • | personal injuries and death; |
| • | regulatory investigations and penalties; and |
| • | natural disasters. |
We might elect not to obtain insurance if we believe that the cost of available insurance is excessive relative to the risks presented. In addition, pollution and environmental risks generally are not fully insurable. Losses and liabilities arising from uninsured and underinsured events or in amounts in excess of existing insurance coverage could have a material adverse effect on our business, financial condition or results of operations.
18
Table of Contents
Index to Financial Statements
No assurance can be given that defects in our title to oil and natural gas interests do not exist.
Title to oil and natural gas interests is often not possible to determine without incurring substantial expense. An independent title review was completed with respect to certain of the oil and natural gas rights acquired by us and the interests in oil and natural gas rights owned by us. However, no assurance can be given that title defects do not exist. If a title defect does exist, it is possible that we may lose all or a portion of the properties to which the title defect relates. Our actual interest in certain properties may therefore vary from our records.
We have discovered material weaknesses in our internal accounting controls and our inability to correct these weaknesses could reduce confidence in our financial statements.
For the three fiscal years ended January 31, 2010 and the six fiscal months ended July 31, 2010, our management identified a material weakness related to our period-end financial reporting process. Specifically, we did not have sufficient personnel in our accounting and financial reporting functions, and as a result, we were not able to achieve adequate segregation of duties and were not able to provide adequate reviews of the financial statements. This control deficiency, which is pervasive in nature, results in a reasonable possibility that material misstatements of the financial statements will not be prevented or detected on a timely basis. Management will continue to monitor and evaluate the effectiveness of our disclosure controls and procedures and our internal controls over financial reporting on an ongoing basis and is committed to taking further action and implementing additional enhancements or improvements, as necessary and as funds allow. As part of this commitment, we will continue to assess our current personnel resources. As our activity levels increase, we will look to increase our personnel resources to increase segregation of duties. When funds are available to us and as operations increase, we plan to hire additional knowledgeable personnel to further support our current accounting personnel, which management estimates could cost approximately $100,000 per annum.
Although our management and audit committee intend for the new policies and procedures to provide sufficient assurance of future compliance, we are unable to determine at this time whether the new policies and procedures will be fully effective in correcting these weaknesses. Despite this, a control system, no matter how well conceived and operated, can provide only reasonable assurance that the objectives of the control system are met. Our management, including our Chief Executive Officer and Chief Financial Officer, does not expect that our disclosure controls and procedures or internal accounting controls will prevent all errors and fraud, even after instituting the changes described above. Because of the inherent limitations in all control systems, no evaluation of controls can provide absolute assurance that all control issues have been detected and further misstatements due to error or fraud may occur and not be detected.
We are subject to the requirements of Section 404(a) of the Sarbanes-Oxley Act. If we are unable to timely comply with Section 404(a) or if the costs related to compliance are significant, our profitability, stock price, financial condition and results of operations could be materially adversely affected.
We are required to comply with the provisions of Section 404(a) of the Sarbanes-Oxley Act of 2002. Section 404(a) requires that we document and test our internal controls over financial reporting and issue management’s assessment of our internal controls over financial reporting.
We believe that the out-of-pocket costs, the diversion of management’s attention from running the day-to-day operations and operational changes caused by the need to comply with the requirements of Section 404(a) of the Sarbanes-Oxley Act could be significant. If the time and costs associated with such compliance exceed our current expectations, our profitability, stock price, financial condition and results of operations could be materially adversely affected.
We cannot be certain at this time that we will identify any additional material weaknesses in our internal controls over financial reporting. If we fail to comply with the requirements of Section 404(a) or if we identify and report any additional material weaknesses, the accuracy and timeliness of the filing of our annual and
19
Table of Contents
Index to Financial Statements
quarterly reports may be materially adversely affected and could cause investors to lose confidence in our reported financial information, which could have a negative effect on the trading price of our common stock. In addition, material weaknesses in the effectiveness of our internal controls over financial reporting could result in an increased chance of fraud and the loss of customers, reduce our ability to obtain financing and require additional expenditures to comply with these requirements, each of which could have a material adverse effect on our business, financial condition and results of operations.
Our Canadian operations subject us to currency exchange rate risk, which could cause our financial condition and results of operations to fluctuate significantly from period to period.
A portion of our revenues are derived from our Canadian activities and operations. As a result, we translate the financial condition and results of operations of our Canadian operations into U.S. dollars. Therefore, our reported financial condition and results of operations are subject to changes in the exchange relationship between the two currencies. For example, as the relationship of the Canadian dollar strengthens against the U.S. dollar, our revenue denominated in Canadian dollars is favorably affected and conversely our expenses denominated in Canadian dollars are unfavorably affected. Monetary assets and liabilities denominated in foreign currencies are translated into U.S. dollars at rates of exchange in effect at the balance sheet date and gains and losses are recorded in earnings. Non-monetary assets, liabilities and items recorded in income arising from transactions denominated in foreign currencies are translated at rates of exchange in effect at the date of the transaction. Our foreign currency transactions are primarily undertaken in Canadian dollars. We have not, to the date of the consolidated financial statements included in this prospectus, entered into derivative instruments to offset the impact of foreign currency fluctuations.
Risks Relating to our Common Stock
The market price for our common stock may be highly volatile.
The market price for our common stock may be highly volatile and could be subject to wide fluctuations. Some of the factors that could negatively affect such share price include:
| • | actual or anticipated fluctuations in our quarterly results of operations; |
| • | liquidity; |
| • | sales of common stock by our stockholders; |
| • | changes in oil and natural gas prices; |
| • | changes in our cash flow from operations or earnings estimates; |
| • | publication of research reports about us or the oil and natural gas exploration and production industry generally; |
| • | increases in market interest rates which may increase our cost of capital; |
| • | changes in applicable laws or regulations, court rulings and enforcement and legal actions; |
| • | changes in market valuations of similar companies; |
| • | adverse market reaction to any indebtedness we incur in the future; |
| • | additions or departures of key management personnel; |
| • | actions by our stockholders; |
| • | commencement of or involvement in litigation; |
| • | news reports relating to trends, concerns, technological or competitive developments, regulatory changes and other related issues in our industry; |
20
Table of Contents
Index to Financial Statements
| • | speculation in the press or investment community regarding our business; |
| • | inability to list our common stock on a national securities exchange; |
| • | general market and economic conditions; and |
| • | domestic and international economic, legal and regulatory factors unrelated to our performance. |
Financial markets have recently experienced significant price and volume fluctuations that have affected the market prices of equity securities of companies and that have, in many cases, been unrelated to the operating performance, underlying asset values or prospects of such companies. Accordingly, the market price of our common stock may decline even if our results of operations, underlying asset values or prospects have not changed. Additionally, these factors, as well as other related factors, may cause decreases in asset values that are deemed to be other than temporary.
Limited trading volume in our common stock may contribute to price volatility.
As a relatively small company with a limited market capitalization, even if our shares are more widely disseminated, we are uncertain as to whether a more active trading market in our common stock will develop. As a result, relatively small trades may have a significant impact on the price of our common stock. In addition, because of the limited trading volume in our common stock and the price volatility of our common stock, you may be unable to sell your shares of common stock when you desire or at the price you desire. The inability to sell your shares in a declining market because of such illiquidity or at a price you desire may substantially increase your risk of loss.
Purchasers of common stock in this offering will experience immediate and substantial dilution of $1.36 per share.
Based on an assumed offering price of $5.40 per share (the last reported sale price of our common stock on October 22, 2010 after giving effect to the reverse stock split), purchasers of our common stock in this offering will experience immediate and substantial dilution of $1.36 per share in the pro forma as adjusted net tangible book value per share of our common stock from the offering price, and our pro forma as adjusted net tangible book value as of July 31, 2010 after giving effect to this offering would be $4.04 per share. See “Dilution” elsewhere in this prospectus.
We have broad discretion in the use of our net proceeds from this offering and may not use them effectively.
Our management will have broad discretion in the application of the net proceeds from this offering and could spend the proceeds in ways that do not improve our results of operations or enhance the value of our common stock. Our stockholders may not agree with our management’s choices in allocating and spending the net proceeds. These choices could result in additional financial losses that could have a material adverse effect on our business and cause the price of our common stock to decline. See “Use of Proceeds” elsewhere in this prospectus.
In the past, we have not paid dividends on our common stock and do not anticipate paying dividends on our common stock in the foreseeable future.
In the past, we have not paid dividends on our common stock and do not expect to declare or pay any cash or other dividends in the foreseeable future on our common stock, as we intend to use cash flow generated by operations to develop our business. Any future determination to pay cash dividends will be at the discretion of our Board and will be dependent upon our financial condition, results of operations, capital requirements and such other factors as our Board deems relevant.
21
Table of Contents
Index to Financial Statements
Although we have received conditional approval to list our common stock on AMEX concurrently with the issuance of shares pursuant to this offering, our common stock is currently subject to the “penny stock” rules of the Securities and Exchange Commission and the trading market in our securities is limited, which makes transactions in our common stock cumbersome and may reduce the value of an investment in our common stock.
As the reverse stock split and listing on AMEX have not yet been effected, our common stock is currently subject to the “penny stock” rules of the U.S. Securities and Exchange Commission, or the SEC. The SEC has adopted Rule 3a51-1 which establishes the definition of a “penny stock,” for the purposes relevant to us, as any equity security that is not (i) priced at $5.00 or more per share, as determined pursuant to Rule 3a51-1(d)(i) or (ii) registered, or approved for registration upon notice of issuance, on a national securities exchange, or listed, or approved for listing upon notice of issuance on, an automated quotation system sponsored by a registered national securities association. For any transaction involving a penny stock, unless exempt, Rule 15g-9 of the Securities Exchange Act of 1934, as amended, or the Exchange Act, requires:
| • | that a broker or dealer approve a person’s account for transactions in penny stocks; and |
| • | the broker or dealer receive from the investor a written agreement to the transaction setting forth the identity and quantity of the penny stock to be purchased. |
In order to approve a person’s account for transactions in penny stocks, the broker or dealer must:
| • | obtain from that person information concerning the person’s financial situation, investment experience and investment objectives; and |
| • | make a reasonable determination that the transactions in penny stocks are suitable for that person and the person has sufficient knowledge and experience in financial matters to be capable of evaluating the risks of transactions in penny stocks. |
The broker or dealer must also deliver, prior to any transaction in a penny stock, a written statement prescribed by the SEC relating to the penny stock market, which, in highlight form:
| • | sets forth the basis on which the broker or dealer made the suitability determination regarding the investor; and |
| • | attests that the broker or dealer received a signed, written agreement from the investor prior to the transaction. |
Disclosure also should be made about the risks of investing in penny stocks in both public offerings and in secondary trading, about the commissions payable to both the broker-dealer and the registered representative, current quotations for the securities and the rights and remedies made available to an investor in cases of fraud in penny stock transactions. Finally, monthly statements should be sent disclosing recent price information for the penny stock held in the account and information on the limited market in penny stocks. Generally, brokers may be less willing to execute transactions in securities subject to the “penny stock” rules. This may make it more difficult for investors to dispose of our common stock and cause a decline in the market value of our common stock.
There is no guarantee that our shares will be listed on AMEX.
We have received conditional approval for the listing of our common stock on AMEX. Prior to the closing of this offering, and subject to the reverse stock split and final approval of AMEX, we believe that we will satisfy the listing requirements and expect that our common stock will be listed on AMEX. Such listing, however, is not guaranteed. If the application is not approved, the shares of our common stock will continue to be traded on the OTC Bulletin Board and the TSX Venture Exchange. Even if such listing is approved, we cannot assure you any broker will be interested in trading shares of our common stock. Further, if we do not meet AMEX continued listing requirements, our common stock could be delisted. Therefore, it may be difficult to sell your shares of
22
Table of Contents
Index to Financial Statements
common stock if you desire or need to sell them. Our underwriters are not obligated to make a market in our securities, and even after making a market, can discontinue market making at any time without notice. Neither we nor the underwriters can provide any assurance that an active and liquid trading market in our securities will develop or, if developed, that the market will continue.
If we fail to remain current in our reporting requirements, we could be removed from the OTC Bulletin Board and/or the TSX Venture Exchange which would limit the ability of broker-dealers to sell our securities and the ability of stockholders to sell their securities in the secondary market.
If the AMEX listing application is not approved, the shares of our common stock will continue to be traded on the OTC Bulletin Board and the TSX Venture Exchange. Companies trading on the OTC Bulletin Board, such as us, must be reporting issuers and must be current in their reports under under the Exchange Act, in order to maintain price quotation privileges on the OTC Bulletin Board. We are also listed on the TSX Venture Exchange. In order to remain listed on the TSX Venture Exchange, we must remain a reporting issuer in good standing in each jurisdiction in which we are a reporting issuer. We are a reporting issuer in each of British Columbia, Alberta and Ontario and have continuous disclosure obligations under securities laws and regulations in those jurisdictions (arising primarily under National Instrument 51-102—Continuous Disclosure Obligations). If we fail to remain current on our reporting requirements, we could be removed from the OTC Bulletin Board and/or the TSX Venture Exchange. As a result, the market liquidity for our securities could be severely adversely affected by limiting the ability of broker-dealers to sell our securities and the ability of stockholders to sell their securities in the secondary market.
The liquidity of our common stock and market capitalization could be adversely affected by the reverse stock split.
Our stockholders have approved the reverse stock split so that we can meet the minimum share price requirement of AMEX. If consummated by our Board, the reverse stock split may be viewed negatively by the market and, consequently, can lead to a decrease in our price per share and overall market capitalization. If the per share market price does not increase proportionately as a result of the reverse split, then our value as measured by our market capitalization will be reduced, perhaps significantly.
23
Table of Contents
Index to Financial Statements
CAUTIONARY NOTE TO UNITED STATES INVESTORS
In addition to the requirements of the SEC, we are subject to the Canadian requirements in respect of reserve and resource estimates included in this prospectus provided for in National Instrument 51-101—Standards of Disclosure for Oil and Gas Activities, or the NI 51-101. As of the date of this prospectus, we do not have any reserves, including proved reserves, as defined under NI 51-101. NI 51-101 is a rule developed by the Canadian Securities Administrators which establishes standards for all public disclosure an issuer makes of scientific and technical information concerning oil and natural gas activities.
Canadian standards, including NI 51-101, differ significantly from the requirements of the SEC, and any reserve and resource information reported by us in compliance with Canadian standards, whether contained in this prospectus or included in our other securities law filings, may not be comparable to similar information disclosed by U.S. companies. In particular, the term “resource” does not equate to the term “reserves.” New SEC rules went into effect for fiscal years ending on or after December 31, 2009. These new rules are effective for fiscal years ending on or after December 31, 2009, and require SEC reporting companies to prepare their reserves estimates using revised reserve definitions and revised pricing based on 12-month unweighted first-day-of-the-month average pricing. The previous SEC rules required that reserve estimates be calculated using year-end pricing. Another impact of the new SEC rules is a general requirement that, subject to limited exceptions, proved undeveloped reserves may only be booked if they relate to wells scheduled to be drilled within five years of the date of booking. The SEC’s previous disclosure standards normally did not permit the inclusion of information concerning “probable reserves,” “possible reserves” or “resources” or other descriptions of the amount of oil and natural gas deposits that do not constitute “proved reserves” by U.S. standards in documents filed with the SEC. The new SEC disclosure standards permit companies to disclose their “probable” and “possible” reserves on a voluntary basis. U.S. investors should also understand that “resources” have a great amount of uncertainty as to their existence and great uncertainty as to their economic and legal feasibility. It cannot be assumed that all or any part of a “resource” will ever be upgraded to a higher category. Investors are cautioned not to assume that all or any part of a “resource” exists or is economically or legally recoverable. The Canadian standards for identification of “proved reserves” are also not the same as those of the SEC, and proved reserves that may be reported in the future by us in compliance with Canadian standards may not qualify as “proved reserves” under SEC standards. Accordingly, any information concerning oil and natural gas reserves and resources set forth herein that has been prepared in compliance with Canadian standards may not be comparable with information made public by companies that report in accordance with SEC requirements.
24
Table of Contents
Index to Financial Statements
CAUTIONARY NOTE REGARDING FORWARD-LOOKING STATEMENTS
This prospectus includes a number of forward-looking statements that reflect the current views of our management with respect to future events and financial performance. You can identify these statements by forward-looking words such as “may,” “will,” “expect,” “anticipate,” “believe,” “estimate” and “continue” or similar words. All such statements, other than statements of historical fact, are forward-looking statements within the meaning of Section 27A of the Securities Act of 1933, as amended, or the Securities Act, and Section 21B of the Exchange Act. Those statements include statements regarding our and members of our management team’s intent, belief or current expectations as well as the assumptions on which such statements are based. Prospective investors are cautioned that any such forward-looking statements are not guarantees of future performance and involve risks and uncertainties, and that actual results may differ materially from those contemplated by such forward-looking statements.
Readers are urged to carefully review and consider the various disclosures made by us in this prospectus and in our other reports we filed with the SEC. This prospectus should be read in conjunction with the sections herein entitled “Management’s Discussion and Analysis of Financial Condition and Results of Operations” and our historical consolidated financial statements and notes related thereto. Important factors currently known to our management could cause actual results to differ materially from those in forward-looking statements. We undertake no obligation to update or revise forward-looking statements to reflect changed assumptions, the occurrence of unanticipated events or changes in the future operating results over time. We believe that these assumptions are based upon reasonable data derived from and known about our business and operations. No assurances are made that actual results of operations or the results of our future activities will not differ materially from these assumptions. Factors that could cause differences include, but are not limited to, the following:
| • | history of losses; |
| • | uncertainty of drilling results; |
| • | termination of agreements with our partners; |
| • | our relationship with our partners; |
| • | inability to acquire additional leasehold interests or other oil and natural gas properties; |
| • | inability to manage growth in our business; |
| • | inability to control properties we do not operate; |
| • | inability to protect against certain liabilities associated with our properties; |
| • | lack of diversification; |
| • | substantial capital requirements and limited access to additional capital; |
| • | competition in the oil and natural gas industry; |
| • | global financial conditions; |
| • | oil and natural gas realized prices; |
| • | seasonal weather conditions; |
| • | marketing and distribution of oil and natural gas; |
| • | the influence of our significant stockholders; |
| • | government regulation of the oil and natural gas industry; |
| • | potential regulation affecting hydraulic fracturing; |
| • | environmental regulations, including climate change regulations; |
| • | uninsured or underinsured risks; |
25
Table of Contents
Index to Financial Statements
| • | aboriginal claims relating to our Canadian properties; |
| • | defects in title to our oil and natural gas interests; |
| • | material weaknesses in our internal accounting controls; and |
| • | foreign currency exchange risks. |
Furthermore, the forward-looking statements contained in this prospectus are made as of the date hereof, and we undertake no obligation, except as required by applicable securities legislation, to update publicly or to revise any of the included forward-looking statements, whether as a result of new information, future events or otherwise. The forward-looking statements contained herein are expressly qualified by this cautionary note.
26
Table of Contents
Index to Financial Statements
The estimated net proceeds to be received by us from this offering are expected to be approximately $44 million after deducting underwriting discounts and commissions and estimated offering expenses. We intend to use the net proceeds from this offering to fund our drilling and development expenditures, leasehold acquisitions, including the Williston Purchase, and general corporate purposes, including working capital.
27
Table of Contents
Index to Financial Statements
The following table presents a summary of our cash and cash equivalents and capitalization as of July 31, 2010:
| • | on an actual basis; |
| • | on a pro forma basis giving effect to (i) issuance of 204,419 shares of common stock (after giving effect to the reverse stock split) in connection with a private placement completed on August 6, 2010, or the August Private Placement, (ii) the reverse stock split, (iii) the amendment to the articles of incorporation reducing the number of authorized shares to 70,000,000 and (iv) the payment of approximately $2.2 million in cash and the issuance of up to 433,500 shares of common stock (after giving effect to the reverse stock split) in connection with the Williston Purchase; and |
| • | on a pro forma as adjusted basis, giving further effect to the sale of 9,000,000 shares of common stock in this offering at an assumed public offering price of $5.40 per share (the last reported sale price of our common stock on October 22, 2010 after giving effect to the reverse stock split), after deducting underwriting discounts and commissions and estimated offering expenses, and the application of the net proceeds of this offering as described in “Use of Proceeds.” |
You should read the following table in conjunction with “Management’s Discussion and Analysis of Financial Condition and Results of Operation” and our historical consolidated financial statements and the related notes thereto included in this prospectus.
| As of July 31, 2010 | ||||||||||||
| (unaudited) | ||||||||||||
| Actual | Pro Forma | Pro Forma As Adjusted |
||||||||||
| Cash and cash equivalents |
$ | 2,050,357 | $ | 718,857 | $ | 44,718,857 | ||||||
| Stockholders’ equity |
||||||||||||
| Common stock ((i) Actual: 150,000,000 shares authorized, par value $0.00001; 99,011,648 shares issued; (ii) Pro forma: 70,000,000 shares authorized, par value $0.00001; 10,539,084 shares issued; (iii) Pro forma as adjusted: 70,000,000 shares authorized, par value $0.00001; 19,539,084 shares issued) |
$ | 990 | $ | 105 | $ | 195 | ||||||
| Additional paid-in capital |
95,370,116 | 98,547,901 | 142,547,811 | |||||||||
| Deficit |
(64,469,788 | ) | (64,469,788) | (64,469,788 | ) | |||||||
| Total stockholders’ equity |
$ | 30,901,318 | $ | 34,078,218 | $ | 78,078,218 | ||||||
| Total capitalization |
$ | 32,445,512 | $ | 35,632,412 | $ | 79,632,412 | ||||||
28
Table of Contents
Index to Financial Statements
As of July 31, 2010, we had a net tangible book value of $30,901,318, or $3.12 per share (after giving effect to the reverse stock split). Net tangible book value represents our total tangible assets, less all liabilities, divided by the number of shares of our outstanding common stock. Without taking into account any changes in such net tangible book value after July 31, 2010, other than to give effect to our sale of 9,000,000 shares of common stock offered hereby (based on an assumed offering price of $5.40, the last reported sale price of our common stock on October 22, 2010 after giving effect to the reverse stock split), the pro forma net tangible book value per share at July 31, 2010 would have been $4.04. This amount represents an immediate increase in net tangible book value of $0.92 per share to our current stockholders and an immediate decrease in net tangible book value of $1.36 per share to new investors purchasing shares in this offering, as illustrated in the following table:
| Assumed offering price per share |
$ | 5.40 | ||||||
| Net tangible book value per share as of July 31, 2010 |
$ | 3.12 | ||||||
| Increase per share attributable to this offering |
0.92 | |||||||
| As adjusted net tangible book value per share after this offering |
4.04 | |||||||
| Net tangible book value dilution per share to new investors in this offering |
$ | 1.36 | ||||||
A $1.00 increase (decrease) in the assumed offering price of $5.40 per share would increase (decrease) our as adjusted pro forma net tangible book value by $8.4 million, the as adjusted pro forma net tangible book value per share after the offering by $0.45 per share and the dilution per share to the new investors purchasing our shares in this offering by $(0.45) per share, assuming that the number of shares offered by us, as set forth on the cover page of this prospectus, remains the same and after deducting the estimated underwriting discounts and commissions and estimated offering expenses payable by us.
If the underwriters’ over-allotment option is exercised in full, the net tangible book value per share after giving effect to the offering would be $4.10 and the dilution in net tangible book value per share to new investors would be $1.30.
The following table summarizes, as of July 31, 2010, the difference between the number of shares purchased from us, the total cash consideration paid and the average cash price per share paid by our existing stockholders and to be paid by new investors purchasing shares in this offering, before deducting underwriting discounts and commissions and estimated offering expenses:
| Shares Purchased | Total Consideration | Average Price per Share |
||||||||||||||||||
| Number | Percent | Amount | Percent | |||||||||||||||||
| Existing stockholders |
9,901,165 | 52.4 | % | $ | 95,371,106 | 66.2 | % | $ | 9.63 | |||||||||||
| New investors |
9,000,000 | 47.6 | 48,600,000 | 33.8 | $ | 5.40 | ||||||||||||||
| Total |
18,901,165 | 100.0 | % | $ | 143,971,106 | 100.0 | % | |||||||||||||
A $1.00 increase (decrease) in the assumed offering price of $5.40 per share would increase (decrease) total consideration by new investors by $9.0 million, assuming that the number of shares offered by us, as set forth on the cover page of this prospectus, remains the same and after deducting the estimated underwriting discounts and commissions and estimated offering expenses payable by us.
29
Table of Contents
Index to Financial Statements
MARKET FOR COMMON STOCK AND RELATED STOCKHOLDER MATTERS
Market Information
Our common stock is currently quoted on the OTC Bulletin Board under the symbol “TPLM” and the TSX Venture Exchange under the symbol “TPE.” In order to meet the requirements of the TSX Venture Exchange with respect to the reverse stock split, our common stock will be quoted under a new symbol after the reverse stock split.
For the periods indicated, the following table sets forth the high and low bid prices per share of common stock on the OTC Bulletin Board, both on an actual basis and after giving effect to the reverse stock split. Our fiscal year-end is January 31. The periods described below as Fiscal Year 2009, 2010 and 2011 are for the fiscal years ended January 31, 2009, 2010 and 2011, respectively. These prices represent inter-dealer quotations without retail markup, markdown or commission and may not necessarily represent actual transactions.
| TPLM – Fiscal Year 2009 | ||||||||||||||||
| Actual Historical | Giving Effect to the Reverse Stock Split |
|||||||||||||||
| High | Low | High | Low | |||||||||||||
| February 1, 2008 to April 30, 2008 |
$ | 1.63 | $ | 0.72 | $ | 16.30 | $ | 7.20 | ||||||||
| May 1, 2008 to July 31, 2008 |
$ | 2.40 | $ | 0.85 | $ | 24.00 | $ | 8.50 | ||||||||
| August 1, 2008 to October 31, 2008 |
$ | 1.08 | $ | 0.09 | $ | 10.80 | $ | 0.90 | ||||||||
| November 1, 2008 to January 31, 2009 |
$ | 0.35 | $ | 0.15 | $ | 3.50 | $ | 1.50 | ||||||||
| TPLM – Fiscal Year 2010 | ||||||||||||||||
| Actual Historical | Giving Effect to
the Reverse Stock Split |
|||||||||||||||
| High | Low | High | Low | |||||||||||||
| February 1, 2009 to April 30, 2009 |
$ | 0.25 | $ | 0.11 | $ | 2.50 | $ | 1.10 | ||||||||
| May 1, 2009 to July 31, 2009 |
$ | 0.21 | $ | 0.15 | $ | 2.10 | $ | 1.50 | ||||||||
| August 1, 2009 to October 31, 2009 |
$ | 0.18 | $ | 0.07 | $ | 1.80 | $ | 0.70 | ||||||||
| November 1, 2009 to January 31, 2010 |
$ | 0.40 | $ | 0.08 | $ | 4.00 | $ | 0.80 | ||||||||
| TPLM – Fiscal Year 2011 | ||||||||||||||||
| Actual Historical | Giving Effect to
the Reverse Stock Split |
|||||||||||||||
| High | Low | High | Low | |||||||||||||
| February 1, 2010 to April 30, 2010 |
$ | 0.92 | $ | 0.09 | $ | 9.20 | $ | 0.90 | ||||||||
| May 1, 2010 to July 31, 2010 |
$ | 0.80 | $ | 0.40 | $ | 8.00 | $ | 4.00 | ||||||||
| August 1, 2010 to October 22, 2010 |
$ | 0.60 | $ | 0.45 | $ | 6.00 | $ | 4.50 | ||||||||
On October 22, 2010, after giving effect to the reverse stock split, the last reported sale price of our common stock on the OTC Bulletin Board was $5.40 per share, and we had 10,105,584 shares of common stock outstanding.
Holders of Record
As of October 22, 2010, there were approximately 43 holders of record of shares of our common stock.
30
Table of Contents
Index to Financial Statements
Securities Authorized For Issuance Under Equity Compensation Plans
The following table sets forth certain information about our common stock that may be issued upon the exercise of options under our equity compensation plans as of January 31, 2010, after giving effect to the reverse stock split.
| Plan Category |
Number of Shares to be Issued Upon Exercise of Outstanding Options, Warrants and Rights |
Weighted- Average Exercise Price of Outstanding Options, Warrants and Rights |
Number of
Shares Remaining Available for Future Issuance Under Equity Compensation Plans (Excluding Shares Reflected in the First Column) |
|||||||||
| Equity compensation plans approved by stockholders(1) |
570,000 | $ | 5.20 | 129,260 | ||||||||
| Equity compensation plans not approved by stockholders |
— | — | — | |||||||||
| Total |
570,000 | $ | 5.20 | 129,260 | ||||||||
| (1) | Effective August 5, 2005, we approved the 2005 Incentive Stock Plan, or the 2005 Plan, to issue up to 2,000,000 shares of common stock. Effective August 17, 2007, we approved the 2007 Incentive Stock Plan, or the 2007 Plan, to issue up to 2,000,000 shares of common stock. The 2005 Plan and 2007 Plan allow for the granting of stock options at a price of not less than fair value of the stock and for a term not to exceed five years. Since January 31, 2009, there have been no outstanding stock options pursuant to the 2005 Plan and 2007 Plan. |
Effective January 28, 2009, our Board approved the Stock Option Plan, or the Rolling Plan, whereby the number of authorized but unissued shares of our common stock that may be issued upon the exercise of stock options granted under the Rolling Plan at any time, plus the number of shares of our common stock reserved for issuance under the outstanding 2005 Plan and 2007 Plan, shall not exceed 10% of the issued and outstanding shares of our common stock on a non-diluted basis at any time, and such aggregate number of shares of our common stock shall automatically increase or decrease as the number of issued and outstanding shares of common stock change. Pursuant to the Rolling Plan, stock options become exercisable as to one-third on each of the first, second and third anniversaries of the date of the grant. The Rolling Plan also allows for the granting of stock options at a price of not less than fair value of the common shares and for a term not to exceed ten years.
31
Table of Contents
Index to Financial Statements
We have not and do not anticipate paying any cash dividends to stockholders in the foreseeable future as we intend to use cash flow generated by operations to develop our business. Any future determination to pay cash dividends will be at the discretion of our Board and will be dependent upon our financial condition, results of operations, capital requirements and such other factors as our Board deems relevant.
32
Table of Contents
Index to Financial Statements
SELECTED HISTORICAL FINANCIAL DATA
The following table summarizes the historical consolidated financial data as of the dates and for the periods as indicated. The consolidated income statement and other consolidated financial data for each of the fiscal years in the three years ended January 31, 2010, and the balance sheet data as of each of such periods, have been derived from our consolidated financial statements, which have been audited by the independent registered public accounting firm. The consolidated income statement and other consolidated financial data for the fiscal six months ended July 31, 2009 and July 31, 2010 and the consolidated balance sheet data as of July 31, 2009 and July 31, 2010 have been derived from our unaudited interim consolidated financial statements included elsewhere in this prospectus. The unaudited interim consolidated financial statements have been prepared on a basis consistent with the audited consolidated financial statements and, in the opinion of our management, include all adjustments (including normal recurring accruals) necessary for a fair presentation of such data. Our results for the interim period are not necessarily indicative of results for a full year. Our historical consolidated financial data should be read in conjunction with our historical consolidated financial statements and the accompanying notes and “Management’s Discussion and Analysis of Financial Condition and Results of Operations” included elsewhere in this prospectus.
| As of January 31, | As of July 31, | |||||||||||||||||||
| 2008 | 2009 | 2010 | 2009 | 2010 | ||||||||||||||||
| (unaudited) | ||||||||||||||||||||
| INCOME STATEMENT |
||||||||||||||||||||
| Revenue, net of royalties |
$ | 586,804 | $ | 386,892 | $ | 131,245 | $ | 63,087 | $ | 41,722 | ||||||||||
| Operating Expenses |
||||||||||||||||||||
| Oil and gas production |
$ | 304,537 | $ | 125,777 | $ | 95,852 | $ | 52,576 | $ | 13,495 | ||||||||||
| Depletion and accretion |
441,881 | 200,050 | 188,788 | 91,477 | 131,795 | |||||||||||||||
| Depreciation—property and equipment |
40,429 | 39,448 | 26,198 | 11,674 | 13,864 | |||||||||||||||
| General and administrative |
5,800,116 | 4,045,906 | 3,987,012 | 1,675,148 | 1,655,125 | |||||||||||||||
| Foreign exchange (gain) loss |
317,656 | 2,682,873 | (753,950 | ) | (707,654 | ) | (30,141 | ) | ||||||||||||
| Gain on sale of assets |
— | (126,314 | ) | (1,266,294 | ) | (124,621 | ) | (976,900 | ) | |||||||||||
| Ceiling test write-down on oil and natural gas properties |
$ | 19,598,916 | $ | 8,308,229 | $ | — | $ | — | $ | — | ||||||||||
| Total Operating Expenses |
$ | 26,503,535 | $ | 15,275,969 | $ | 2,277,606 | $ | 998,600 | $ | 807,238 | ||||||||||
| Total Other Income (Expense) |
$ | (3,684,016 | ) | $ | 1,118,592 | $ | 6,260 | $ | 6,213 | $ | 373 | |||||||||
| Net Income (Loss) for the Period |
$ | (29,600,747 | ) | $ | (13,770,485 | ) | $ | (2,140,101 | ) | $ | (929,300 | ) | $ | (765,516 | ) | |||||
| STATEMENT OF CASH FLOWS |
||||||||||||||||||||
| Net Cash Used in Operating Activities |
$ | (4,246,258 | ) | $ | (3,898,095 | ) | $ | (2,099,940 | ) | $ | (890,162 | ) | $ | (1,640,608 | ) | |||||
| Net Cash Used in Investing Activities |
$ | (22,279,141 | ) | $ | (1,190,231 | ) | $ | (2,192,365 | ) | $ | (2,712,803 | ) | $ | (9,898,918 | ) | |||||
| Net Cash Provided by Financing Activities |
$ | 25,308,006 | $ | 12,002,541 | $ | — | $ | — | $ | 8,699,426 | ||||||||||
| BALANCE SHEET (at period end): |
||||||||||||||||||||
| Total Assets |
$ | 32,579,190 | $ | 26,770,450 | $ | 24,357,692 | $ | 24,349,884 | $ | 32,445,512 | ||||||||||
| Total Liabilities |
$ | 22,520,504 | $ | 2,941,480 | $ | 1,874,462 | $ | 1,179,751 | $ | 1,544,194 | ||||||||||
| Total Stockholders’ Equity |
$ | 10,058,686 | $ | 23,828,970 | $ | 22,483,230 | $ | 23,170,133 | $ | 30,901,318 | ||||||||||
33
Table of Contents
Index to Financial Statements
MANAGEMENT’S DISCUSSION AND ANALYSIS OF FINANCIAL CONDITION
AND RESULTS OF OPERATIONS
This Management’s Discussion and Analysis of Financial Condition and Results of Operations includes a number of forward-looking statements that reflect our management’s current views with respect to future events and financial performance. You can identify these statements by forward-looking words such as “may,” “will,” “expect,” “anticipate,” “believe,” “estimate” and “continue” or similar words. Those statements include statements regarding the intent, belief or current expectations of us and members of our management team as well as the assumptions on which such statements are based. Prospective investors are cautioned that any such forward-looking statements are not guarantees of future performance and involve risk and uncertainties, and that actual results may differ materially from those contemplated by such forward-looking statements.
Readers are urged to carefully review and consider the various disclosures made by us in this prospectus and in our other filings with the SEC. The following Management’s Discussion and Analysis of Financial Condition and Results of Operations should be read in conjunction with our consolidated financial statements and notes related thereto included in this prospectus. Important factors currently known to management could cause actual results to differ materially from those in forward-looking statements. We undertake no obligation to update or revise forward-looking statements to reflect changed assumptions, the occurrence of unanticipated events or changes in the future operating results over time. We believe that our assumptions are based upon reasonable data derived from and known about our business and operations. No assurances are made that actual results of operations or the results of our future activities will not differ materially from our assumptions. Factors that could cause differences include, but are not limited to, expected market demand for oil and natural gas, fluctuations in pricing for material and competition.
Overview
We are an oil and natural gas exploration and development company currently focused on the acquisition and development of unconventional shale oil resources. In late 2009, we adopted a new investment strategy shifting our area of focus from the Maritimes Basin in the Province of Nova Scotia to the Bakken Shale and Three Forks formations in the Williston Basin of North Dakota and Montana. In furtherance of our new strategy, to date, we have acquired, or committed to acquire, approximately 13,000 net acres primarily in McKenzie and Williams Counties of North Dakota. Having identified an area of focus in the Bakken Shale that we believe will generate attractive returns on invested capital, we are continuing to explore further opportunities in the region with a goal of reaching 30,000 net acres by the end of 2011.
In the Maritimes Basin, we hold over 400,000 net acres with numerous conventional and unconventional prospective reservoirs, including the Windsor and Horton Shales. As a result of the processing and interpretation of our proprietary 2D seismic data, we have identified a conventional exploration opportunity that we believe could hold significant natural gas reserves. We are currently marketing the prospect to industry partners as a farm-out opportunity and propose to enter into an agreement whereby we would maintain a working interest position and potential partners would agree to cover 100% of the capital costs of an initial exploration well.
Plan of Operations
Williston Basin
We have operated and non-operated leasehold positions in the Williston Basin. The operations of our non-operated leasehold positions are conducted primarily through agreements with Slawson and Kodiak. Both companies are experienced operators in the development of the Bakken Shale and Three Forks formations. As of October 22, 2010, we have acquired, or committed to acquire, an aggregate of approximately 13,000 net acres in the Williston Basin in North Dakota. We are seeking to acquire new operated and non-operated acreage within these formations with additional experienced operators. In 2011, we also plan to drill our first operated well on the acreage that we expect to acquire as part of the Williston Purchase. In addition, we have successfully recruited a new land staff and brokerage and title team, which in the past month has successfully acquired over 1,200 net acres, including approximately 700 net acres in the same township as the Williston Purchase.
34
Table of Contents
Index to Financial Statements
The Slawson Agreement is confined to an agreed upon AMI within the Rough Rider area of McKenzie and Williams Counties in North Dakota. We have acquired approximately 6,000 net acres to date under the Slawson Agreement and have identified numerous drilling locations. We will spud our first well in October 2010 and plan to continue to drill additional wells through the end of and 2011. Under the terms of the Slawson Agreement, we pay 33% of the gross well costs and between a 20% and 60% premium of our pro rata share of leasehold acquisition costs to earn a 30% working interest in all wells drilled within the AMI through January 15, 2012. We believe the terms of the Slawson Agreement are consistent with industry practice and will result in net costs to us that are substantially lower than we could achieve during the early phase of our development.
In May 2010, we entered into an agreement with Kodiak pursuant to which we have the opportunity to acquire approximately 2,600 net acres in the Grizzly Project. Under the terms of the agreement, we agreed to pay $3.2 million to Kodiak in the form of future drilling carry for a 30% working interest in the Grizzly Project area. After the $3.2 million has been expended, we will have earned our 2,600 net acres, with all future wells to be drilled according to our working interest position. As described below, we have drilled three gross wells in the Grizzly Project, two of which are awaiting completion and one of which has been production tested and is being prepared for production. We anticipate drilling one additional well by fiscal year-end.
Using industry-accepted well-spacing parameters and a combination of short and long laterals, we believe that there could be over 100 unrisked drilling locations for the Bakken Shale and Three Forks formations on our acreage in the Williston Basin. Based on current industry expectations, we believe we can drill up to eight 9,500 foot lateral wells on 1,280 acre spacing units within our acreage. Consistent with leading field operators, we plan to perform multi-stage fracs with 25 to 30 stages on each lateral well. We also plan to drill shorter laterals on smaller units as dictated by our leasehold position.
In May 2010, we announced our plans to participate in the Roedeske Federal #12-21H well in McKenzie County with an approximate 15% working interest. The 9,000 foot lateral well was drilled on a 1,280 acre spacing unit and is awaiting completion with a 22-stage frac job. The well is operated by XTO Energy Inc.
In June 2010, we commenced a two well drilling program in the Grizzly Project with Kodiak as operator. The first well, the Grizzly #13-6H, is a 4,000 foot lateral re-entry of an existing wellbore. The estimated gross costs are $3.2 million and we have an approximate 26% working interest in this well. We anticipate that this well will be completed in late October 2010. The second well, the Grizzly #1-27H, is a 9,000 foot lateral well was being drilled on a 1,280 acre spacing unit. This well experienced mechanical difficulties during completion resulting in only 10 of 24 initially planned stages being completed, reducing the estimated cost of the well. The well produced 507 Boe during its initial 24 hour test and is currently being prepared for production. The gross estimated costs are $5.7 million and we have an approximate 26% working interest in this well.
We recently announced that Slawson will spud the first well of its joint venture with us on approximately October 30, 2010, the Bonanza #1-21-16H, located in the Rough Rider area in McKenzie County. We currently anticipate that Slawson will drill an additional nine wells in the Rough Rider area during the remainder of 2010 and 2011.
On October 5, 2010, we entered into a purchase and sale agreement with Williston Exploration LLC to acquire approximately 1,732 net acres in Williams County, North Dakota. These undeveloped acres are in contiguous blocks in three separate 1,280 acre drilling units and will provide our first operated drilling locations. The addition of this acreage will give us an opportunity to operate on a large portion of the acreage and we plan to drill up to two wells that we will operate by the end of 2011. The aggregate purchase price consists of up to approximately $2.2 million in cash and up to 433,500 shares of our common stock (after giving effect to the reverse stock split). We expect to close on a portion of the acres in December 2010 and on the remainder in February 2011.
On October 22, we entered into the Oppenheimer Agreement with OGR. Under the Oppenheimer Agreement, OGR has made a $25 million capital commitment to co-invest with us in our future acquisition and development of assets in the Williston Basin. $10 million of OGR’s initial capital, which OGR has the right to increase up to $19 million, is allocated for leasehold acquisition with the remainder available for
35
Table of Contents
Index to Financial Statements
well development. Further, OGR has the right to participate in up to 25% of our future activity in the Williston Basin. OGR will pay its share of leasehold costs in all leases in which it participates, plus a premium to us equal to an additional percentage of lease acquisition costs which is designed to remunerate us for our services in sourcing and managing the acreage activity in the Williston Basin. The acreage premium varies depending upon the level of lease acquisition costs. OGR will also bear 25% of all of our brokerage costs in the region. In addition, OGR will pay its proportional share of all drilling and completion costs, plus a 10% premium thereof to us for our services associated with well development. We will also earn an annual management fee as general and administrative expense reimbursement. Our current leasehold position, including the Grizzly Project, and any future leasehold acquisition pursuant to the Slawson Agreement, is excluded from the Oppenheimer Agreement.
Beginning in the fourth quarter of 2010, we believe we will participate in the drilling of up to 20 gross (5.3 net) wells by the end of 2011. We anticipate participating in two gross (1.25 net) wells in the acreage being acquired from Williston Exploration LLC, 10 gross (2.0 net) wells on our Slawson AMI, two to four gross (0.7 to 1.40 net) wells in the Grizzly Project and up to four gross (0.6 net) wells in our other non-operated areas. With an average drilling and completion cost of $7.0 million per well, we have budgeted a range of anticipated drilling capital costs of $30 to $40 million over this period.
Maritimes Basin
We have an 87% working interest in approximately 474,625 gross acres (approximately 412,924 net acres) in the Windsor Sub-Basin of the Maritimes Basin located in the Windsor Block. In October 2009, we completed an approximately 30-square kilometer 2D seismic shoot on the Windsor Block and completed processing and interpreting the data in the fiscal quarter ending January 31, 2010. We believe that this seismic program, combined with the completion operations on three previously drilled vertical exploration wells, satisfied the first-year requirements of our 10-year production lease. See “Business—Operations and Oil and Natural Gas Properties—Maritimes Basin” for a description of the terms of the lease. We have completed our interpretation of the seismic data on the Windsor Block and we are currently seeking partners to participate in the drilling of the test well and to participate in a joint venture to further evaluate the potential of the Windsor Block.
Non-Core Producing Properties
Our producing well in the Alberta Deep Basin of Canada was sold in May 2010 along with the associated undeveloped acreage for $977,000 in cash. We also have production from three low working interest shale natural gas wells in the Barnett Shale trend of the Fort Worth Basin of Texas, although we consider the production volumes to be immaterial.
Non-Core Undeveloped Properties
We have 4,175 non-operated net acres in the Rocky Mountains and 2,640 net acres in the Alberta Deep Basin of Canada. In fiscal 2010, there was no exploration activity on these undeveloped land positions and there continues to be no exploration activity planned for these projects in fiscal 2011.
Results of Operation
Three and Six Months Ended July 31, 2010 Compared to the Three and Six Months Ended July 31, 2009
Daily Sales Volumes, Working Interest Before Royalties
| Three months ended July 31, 2010 |
Three months ended July 31, 2009 |
Six months ended July 31, 2010 |
Six months ended July 31, 2009 |
|||||||||||||
| Barnett Shale in Texas, USA (Mcfpd) |
67 | 56 | 57 | 56 | ||||||||||||
| Deep Basin in Alberta, Canada (Mcfpd) |
— | 62 | 6 | 66 | ||||||||||||
| Total Company (Mcfpd) |
67 | 118 | 63 | 122 | ||||||||||||
| Total Company (Boepd*) |
11 | 20 | 11 | 20 | ||||||||||||
36
Table of Contents
Index to Financial Statements
| * | Mcf converted into Boe on a basis of 6:1. Boe’s may be misleading, particularly if used in isolation. A Boe conversion ratio of 1 bbl: 6 Mcf is based on an energy equivalency conversion method primarily applicable at the burner tip and does not represent a value equivalency at the wellhead. |
Net Operating Results
| Three months ended July 31, 2010 |
Three months ended July 31, 2009 |
Six months ended July 31, 2010 |
Six months ended July 31, 2009 |
|||||||||||||
| Volumes (Mcf) |
6,159 | 10,825 | 11,375 | 22,140 | ||||||||||||
| Price ($/Mcf) |
$ | 3.60 | $ | 3.19 | $ | 5.39 | $ | 3.43 | ||||||||
| Revenue |
$ | 22,169 | $ | 34,584 | $ | 61,362 | $ | 75,984 | ||||||||
| Royalties |
$ |
13,366 |
|
$ | 5,401 | $ | 19,640 | $ | 12,897 | |||||||
| Revenue, net of royalties |
$ | 8,803 | $ | 29,183 | $ | 41,722 | $ | 63,087 | ||||||||
| Production expenses |
$ | 6,288 | $ | 31,875 | $ | 13,495 | $ | 52,576 | ||||||||
| Net |
$ | 2,515 | $ | (2,692 | ) | $ | 28,227 | $ | 10,511 | |||||||
For the three and six month periods ended July 31, 2010, we realized $22,169 and $61,362, respectively, in revenue from sales of natural gas and natural gas liquids, as compared to $34,584 and $75,984 in the same periods of the prior year. Revenue decreased mainly due to the sale of the Wapiti property effective April 1, 2010. Royalties as a percent of revenue were 60% and 32% for the three and six month periods ended July 31, 2010, respectively, compared with 16% and 17% in the same periods of the prior year. Royalties increased due to natural gas cost allowance adjustments for the previous years. Production expenses related to this revenue were $6.13/Boe and $7.12/Boe for the three and six month periods ended July 31, 2010, respectively, compared to $17.67/Boe and $14.25/Boe in the same periods of the prior year. The decrease in the production expense rate in the three and six month period ended July 31, 2010 was mainly due to the lower maintenance costs of wells and positive adjustments to miscellaneous operating cost from our partner operated wells.
Depletion, Depreciation and Accretion
| Three months ended July 31, 2010 |
Three months ended July 31, 2009 |
Six months ended July 31, 2010 |
Six months ended July 31, 2009 |
|||||||||||||
| Depletion—oil and natural gas properties |
$ | — | $ | 7,854 | $ | — | $ | 30,345 | ||||||||
| Accretion |
|
67,316 |
|
42,408 | 131,795 | 61,132 | ||||||||||
| Depletion and accretion |
$ | 67,316 | $ | 50,262 | $ | 131,795 | $ | 91,477 | ||||||||
| Depreciation—property and equipment |
6,791 | 7,335 | 13,864 | 11,674 | ||||||||||||
| Total |
$ | 74,107 | $ | 57,597 | $ | 145,659 | $ | 103,151 | ||||||||
Unproven property costs of $27,189,767 for the fiscal six months ended July 31, 2010 were excluded from costs subject to depletion at July 31, 2010.
General and Administrative
| Three months ended July 31, 2010 |
Three months ended July 31, 2009 |
Six months ended July 31, 2010 |
Six months ended July 31, 2009 |
|||||||||||||
| Salaries, benefits and consulting fees |
$ | 271,134 | $ | 462,076 | $ | 552,375 | $ | 764,983 | ||||||||
| Office costs |
|
154,642 |
|
142,278 | 308,574 | 303,127 | ||||||||||
| Professional fees |
127,640 | 42,910 | 192,491 | 183,848 | ||||||||||||
| Public company costs |
66,698 | 92,962 | 118,002 | 185,055 | ||||||||||||
| Operating overhead recoveries |
|
65 |
|
(20,469 | ) | (122 | ) | (32,328 | ) | |||||||
| Total general and administrative |
$ | 620,179 | $ | 719,757 | $ | 1,171,320 | $ | 1,404,685 | ||||||||
37
Table of Contents
Index to Financial Statements
General and administrative expenses have decreased in the three and six month periods ended July 31, 2010 compared to the same periods of the prior year primarily due to reduced professional fees and public company costs, as follows:
| • | Salaries, benefits and consulting fees decreased by $190,942 and $212,608 in the three and six month periods, respectively, mainly due to reduced staff and consultants. |
| • | Public company costs decreased by $26,264 and $67,053 in the three and six month periods, respectively, mainly due to reduced investor relation costs, including reduced investor relations consultants. Public company costs consist mainly of fees for investor relations and also include directors’ fees, press releases and SEC filing costs, printing costs and transfer agent fees. |
Oil and Natural Gas Properties
The table below reflects our capitalized costs related to our oil and natural gas properties as specified:
| Net Book Value January 31, 2010 |
Additions | Depletion and Impairment |
Dispositions | Gain | Net Book Value July 31, 2009 |
|||||||||||||||||||
| Unproven |
||||||||||||||||||||||||
| Windsor Block Maritimes Shale—Nova Scotia, Canada |
$ | 18,783,375 | $ | 78,233 | $ | — | $ | — | $ | — | $ | 18,861,608 | ||||||||||||
| Williston Basin—North Dakota |
— | 8,328,159 | — | — | — | 8,328,159 | ||||||||||||||||||
| Western Canadian Shale—Alberta and B.C., Canada |
— | — | — | (976,900 | ) | 976,900 | — | |||||||||||||||||
| Proved |
||||||||||||||||||||||||
| Williston Basin—North Dakota |
— | 805,251 | — | — | — | 805,251 | ||||||||||||||||||
| Total Proved and Unproven |
$ | 18,783,375 | $ | 9,211,643 | $ | — | $ | (976,900 | ) | $ | 976,900 | $ | 27,995,018 | |||||||||||
During the six month period ended July 31, 2010, we focused on land acquisitions and drilling programs in the Williston Basin and spent approximately $9.1 million primarily for:
| • | acquiring approximately 10,000 net acres for a cost of approximately $7.4 million; |
| • | drilling the Grizzly 13-6H-T147N-R104W horizontal well for a net cost of approximately $0.3 million; |
| • | drilling the Grizzly 1-27H-T148N-R105W horizontal well for a net cost of approximately $0.6 million; and |
| • | acquiring the Grizzly 4-11-T147N-R104W oil well for approximately $0.8 million. |
Net Cash Oil and Natural Gas Additions
| Six months Ended July 31, 2010 |
Six months Ended July 31, 2009 |
|||||||
| Net additions, per above table |
$ | 9,211,643 | $ | 1,232,064 | ||||
| Non-cash ARO additions |
(14,773 | ) | (144,750 | ) | ||||
| Non-cash ARO dispositions |
29,394 | — | ||||||
| Changes in investing working capital |
1,649,554 | 1,057,464 | ||||||
| Net oil and natural gas additions, per Statement of Cash Flows |
$ | 10,875,818 | $ | 2,144,778 | ||||
38
Table of Contents
Index to Financial Statements
Year Ended January 31, 2010 Compared to the Year Ended January 31, 2009
Daily Sales Volumes, Working Interest Before Royalties
| Year
ended January 31, 2010 |
Year
ended January 31, 2009 |
|||||||
| Barnett Shale in Texas, USA (Mcfpd) |
50 | 65 | ||||||
| Deep Basin in Alberta, Canada (Mcfpd) |
61 | 99 | ||||||
| Total Company (Mcfpd) |
111 | 164 | ||||||
| Total Company (Boepd*) |
19 | 27 | ||||||
| * | Mcf converted into Boe on a basis of 6:1. Boe’s may be misleading, particularly if used in isolation. A Boe conversion ratio of 1 bbl:6 Mcf is based on an energy equivalency conversion method primarily applicable at the burner tip and does not represent a value equivalency at the wellhead. |
Net Operating Results
| Year
ended January 31, 2010 |
Year
ended January 31, 2009 |
|||||||
| Volumes (Mcf) |
40,744 | 59,854 | ||||||
| Price ($/Mcf) |
$ | 3.75 | $ | 7.97 | ||||
| Revenue |
$ | 152,938 | $ | 476,996 | ||||
| Royalties |
$ | 21,693 | $ | 90,104 | ||||
| Revenue, net of royalties |
$ | 131,245 | $ | 386,892 | ||||
| Production expenses |
$ | 95,852 | $ | 125,777 | ||||
| Net |
$ | 35,393 | $ | 261,115 | ||||
For the year ended January 31, 2010, we realized $152,938 in revenue from sales of natural gas and natural gas liquids, as compared to $476,996 in the prior year. Revenue decreased mainly due to reduced natural gas prices, and to a lesser effect, due to reduced production volumes. Royalties as a percentage of revenue were 14% for the year ended January 31, 2010 as compared to 19% in the prior year. The decrease in royalty rates was due to the sliding scale of royalty rates as natural gas prices decrease. Production expenses related to this revenue were $14.12/Boe for the year ended January 31, 2010 compared to $12.61/Boe in the prior year; the increase in the production expenses rate was mainly the effect of fixed production costs being spread over reduced production volumes.
Depletion, Depreciation and Accretion
| Year
ended January 31, 2010 |
Year
ended January 31, 2009 |
|||||||
| Depletion—oil and natural gas properties |
$ | 38,781 | $ | 92,747 | ||||
| Accretion |
150,007 | 107,303 | ||||||
| Depletion and accretion |
$ | 188,788 | $ | 200,050 | ||||
| Depreciation—property and equipment |
26,198 | 39,448 | ||||||
| Total |
$ | 214,986 | $ | 239,498 | ||||
| Depletion per Boe |
$ | 5.71 | $ | 9.30 | ||||
39
Table of Contents
Index to Financial Statements
Unproven property costs for the year ended January 31, 2010 of $18,783,375, as compared to $16,869,995 for the year ended January 31, 2009, were excluded from costs subject to depletion at January 31, 2010. Depletion expense related to oil and natural gas properties decreased in the year ended January 31, 2010 compared to the prior year mainly as a result of the ceiling test write-downs on proved properties in the previous year which decreased the depletion base.
General and Administrative
| Year
ended January 31, 2010 |
Year
ended January 31, 2009 |
|||||||
| Salaries, benefits and consulting fees |
$ | 1,844,226 | $ | 1,728,907 | ||||
| Office costs |
844,605 | 892,270 | ||||||
| Professional fees |
245,235 | 449,236 | ||||||
| Public company costs |
303,809 | 558,020 | ||||||
| Operating overhead recoveries |
(45,224 | ) | (180,709 | ) | ||||
| Stock-based compensation |
794,361 | 598,182 | ||||||
| Total general and administrative |
$ | 3,987,012 | $ | 4,045,906 | ||||
General and administrative expenses decreased $58,894 in the year ended January 31, 2010 compared to the prior year primarily due to management implementing cost reductions in the current year.
| • | Salaries, benefits and consulting fees increased by $115,319 in the year ended January 31, 2010 compared to the prior year partially due to severance payments to our officers in late 2009 of approximately $465,000 as part of our new strategic direction that was announced December 1, 2009, offset in part by a $296,000 decrease in salaries during the year due to reduced staff and no staff bonuses in the year ended January 31, 2010. |
| • | Office costs decreased by $47,665 compared to the prior year partially due to reduced travel, software, insurance and telephone costs offset in part by a lease termination payment of approximately $265,000, paid to buy out the remaining 3.5 year term of our Canadian office. |
| • | Professional fees decreased by $204,001 mainly due to reduced audit and accounting fees, which were higher in the prior year due to fees for the restatements of our 10-K and 10-Q filings with the SEC, and due to a fee paid in the prior year to market our Fayetteville acreage for sale. |
| • | Public company costs decreased by $254,211 in the year ended January 31, 2010 compared to the prior year mainly due to reduced investor relations costs related to management implementing cost reductions, including reduced personnel costs and the elimination of costs associated with external investor relations consultants. Public company costs consist mainly of fees for investor relations and also include directors’ fees, press releases and SEC and TSX Venture Exchange filing costs, printing costs and transfer agent fees. |
| • | Stock-based compensation increased by $196,179 mainly due to the granting of stock options in January 2009. |
Accretion of Discounts on Convertible Debentures
| Agreement Date |
Year
ended January 31, 2010 |
Year
ended January 31, 2009 |
||||||
| December 8, 2005 |
$ | — | $ | 815,337 | ||||
| December 28, 2005 |
— | 2,107,572 | ||||||
| Total accretion of discounts |
$ | — | $ | 2,922,909 | ||||
40
Table of Contents
Index to Financial Statements
The accretion of discounts was fully recognized in the year ended January 31, 2009 since our December 8, 2005 debentures were fully converted and repaid on June 5, 2008 and our December 28, 2005 debentures were settled on December 18, 2008.
Interest Expense
| Agreement Date |
Year
ended January 31, 2010 |
Year
ended January 31, 2009 |
||||||
| December 8, 2005 |
$ | — | $ | 91,360 | ||||
| December 28, 2005 |
— | 661,644 | ||||||
| Total interest expense |
$ | — | $ | 753,004 | ||||
There was no interest expense in the year ended January 31, 2010 since our December 8, 2005 debentures were fully converted and repaid on June 5, 2008 and the December 28, 2005 debentures were settled on December 18, 2008, as described below under “—Gain on Debt Extinguishment.”
Gain on Debt Extinguishment
On December 8, 2005, we issued $15,000,000 principal face amount of convertible debentures that were convertible at the lower of (i) $5.00 or (ii) 90% of the average of the three lowest daily volume weighted average prices of our common stock of the 10 trading days immediately preceding the date of conversion. Through June 2008, $11,000,000 of the debentures were converted into shares of our common stock. On June 5, 2008, we repaid the $4,000,000 in remaining debt, which was subject to a 20% early redemption fee of $800,000. A loss of $160,662 was recorded on this debt extinguishment.
On December 28, 2005, we issued $10,000,000 principal face amount of convertible debentures that were convertible at the option of the holder at $4.00 per share. In December 2008, the debentures were settled by (i) reducing the conversion price to $1.40 per share and $3,500,000 of the debentures were converted into 2,500,000 shares of our common stock and (ii) the convertible debenture holders accepted cash of $6,500,000 to settle the remaining debt plus $2,204,792 in accrued interest. A gain of $4,083,375 was recorded on this debt extinguishment.
Oil and Natural Gas Properties
| Net Book Value January 31, 2009 |
Additions | Depletion | Dispositions | Gain (Loss) | Net Book Value January 31, 2010 |
|||||||||||||||||||
| Unproven |
||||||||||||||||||||||||
| Windsor Block Maritimes Shale—Nova Scotia, Canada |
$ | 16,818,586 | $ | 1,964,789 | $ | — | $ | — | $ | — | $ | 18,783,375 | ||||||||||||
| Western Canadian Shale—Alberta and B.C., Canada |
51,409 | 171,508 | — | — | (222,917 | ) | — | |||||||||||||||||
| Fayetteville and Rocky Mountains |
— | 4,500 | — | (1,117,860 | ) | 1,113,360 | — | |||||||||||||||||
| Proved |
||||||||||||||||||||||||
| Canada |
72,869 | 2,207 | (24,327 | ) | (426,600 | ) | 375,851 | — | ||||||||||||||||
| U.S.A. |
— | 14,454 | (14,454 | ) | — | — | — | |||||||||||||||||
| Net |
$ | 16,942,864 | $ | 2,157,458 | $ | (38,781 | ) | $ | (1,544,460 | ) | $ | 1,266,294 | $ | 18,783,375 | ||||||||||
41
Table of Contents
Index to Financial Statements
During the year ended January 31, 2010, we focused on the Windsor Block and spent $1,964,789 primarily for:
| • | completing the second phase of the Windsor Block exploration program consisting of testing the N-14-A well (approximately $164,000), completion operations on the O-61-C well (approximately $208,400) and completion operations on the E-38-A well (approximately $208,500); |
| • | retesting the Kennetcook #1 and #2 wells (approximately $250,000) and increasing the related non-cash asset retirement costs (approximately $213,000); |
| • | acquiring a 30% working interest from Contact Exploration, Inc., or Contact, in the Windsor Block for approximately $245,000 in cash and the assumption of future estimated non-cash asset retirement costs of $144,750. We also agreed to provide Contact with a 5.75% non-convertible gross overriding royalty interest on our resulting 87% working interest; and |
| • | acquiring 2D seismic data (approximately $476,300). |
During the year ended January 31, 2010, we sold our:
| • | 25% working interest in 4,327 non-operated net acres in the U.S. Rocky Mountains for gross proceeds of $83,325 in June 2009; |
| • | 50% working interest in 5,900 non-operated net acres in the Fayetteville Shale and all the related seismic data for net cash proceeds of $744,408 in September 2009. Furthermore, a $50,000 drilling deposit was refunded related to the Fayetteville Shale properties; |
| • | 50% working interest in the remaining 3,880 non-operated net acres in the Fayetteville Shale for net cash proceeds of $240,127 in November 2009; and |
| • | 18% working interest in one well and 12% working interest in 896 gross acres of undeveloped land in Alberta for cash proceeds of $426,600. |
Net Cash Oil and Natural Gas Additions
| Year ended January 31, 2010 |
Year ended January 31, 2009 |
|||||||
| Net additions, per above table |
$ | 2,157,458 | $ | 4,448,883 | ||||
| Non-cash ARO net additions |
(326,600 | ) | (360,544 | ) | ||||
| Changes in investing working capital |
1,202,396 | 1,976,950 | ||||||
| Net oil and natural gas additions, per Statement of Cash Flows |
$ | 3,033,254 | $ | 6,065,289 | ||||
Liquidity and Capital Resources
As of January 31, 2010, we had working capital of $4,841,074, resulting from cash and cash equivalents of $4,878,601, prepaid expenses of $342,635 and other receivables of $313,785, offset by payables and accrued liabilities of $693,947. For the year ended January 31, 2010, we had a net cash outflow from operating activities before changes in working capital of $3,187,203, mainly related to $3,192,651 of cash general and administrative expenses, which were equal to general and administrative expenses net of non-cash stock based compensation expense.
As of July 31, 2010, we had working capital of $4,178,557, resulting primarily from cash and cash equivalents of $2,050,357, prepaid expenses of $461,464 and other receivables of $1,913,241 offset by payables and accrued liabilities of $246,505. For the six month period ended July 31, 2010, we had net cash outflow from operating activities before changes in working capital of $1,125,693, mainly related to $1,171,320 of cash
42
Table of Contents
Index to Financial Statements
general and administrative expenses. For the six month period ended July 31, 2010, we had net cash inflow from financing activities of $8,699,426 from the issuance of 27,993,939 common shares for net proceeds of $8,464,469 and $234,957 of proceeds from 791,666 stock options that were exercised. For the six month period ended July 31, 2010, we had net cash outflow from investing activities of $10,875,818 which includes (i) $7,422,387 for the acquisition of approximately 10,000 net acres in the Williston Basin, (ii) $896,250 for the costs of drilling 2.0 gross (0.5 net) wells and (iii) $0.8 million for the acquisition of the Grizzly #4-11 oil well. Net cash outflows for Nova Scotia were $107,627. Changes to investing working capital accounted for $1,649,554, primarily due to cash calls paid in the connection with the drilling of our two wells in the Grizzly Project. During the six month period ended July 31, 2010, we received proceeds from the sale of the Wapiti property of $976,900.
In our projects with Slawson and Kodiak, we continue to seek additional undeveloped acreage, joint venture partners and farm-in opportunities. The drilling and completion program in the Williston Basin project commenced in the summer of 2010 and completion of the wells is anticipated to be finalized in the fourth quarter of fiscal 2011. We anticipate participating in the drilling of 6.0 gross (1.0 net) wells in total for the fiscal year 2011. Without giving effect to the proceeds of this offering, capital expenditures for the balance of fiscal year 2011 are projected at approximately $2 million for the acquisition of undeveloped lands and approximately $3 million for the drilling and completion programs.
On October 5, 2010, we entered into a purchase and sale agreement with Williston Exploration LLC to acquire approximately 1,732 net acres in Williams County, North Dakota. These undeveloped acres are in contiguous blocks in three separate 1,280 acre drilling units and will provide our first operated drilling locations. The addition of this acreage will give us an opportunity to operate on a large portion of the acreage and we plan to drill up to two wells that we will operate by the end of 2011. The aggregate purchase price consists of up to approximately $2.2 million in cash and up to 433,500 shares of our common stock (after giving effect to the reverse stock split). We expect to close on a portion of the acres in December 2010 and on the remainder in February 2011.
On October 22, we entered into the Oppenheimer Agreement with OGR. Under the Oppenheimer Agreement, OGR has made a $25 million capital commitment to co-invest with us in our future acquisition and development of assets in the Williston Basin. $10 million of OGR’s initial capital, which OGR has the right to increase up to $19 million, is allocated for leasehold acquisition with the remainder available for well development. Further, OGR has the right to participate in up to 25% of our future activity in the Williston Basin. OGR will pay its share of leasehold costs in all leases in which it participates, plus a premium to us equal to an additional percentage of lease acquisition costs which is designed to remunerate us for our services in sourcing and managing the acreage activity in the Williston Basin. The acreage premium varies depending upon the level of lease acquisition costs. OGR will also bear 25% of all of our brokerage costs in the region. In addition, OGR will pay its proportional share of all drilling and completion costs, plus a 10% premium thereof to us for our services associated with well development. We will also earn an annual management fee as general and administrative expense reimbursement. Our current leasehold position, including the Grizzly Project, and any future leasehold acquisition pursuant to the Slawson Agreement, is excluded from the Oppenheimer Agreement.
On April 15, 2009, we entered into a 10-year production lease for approximately 474,625 gross acres (approximately 412,924 net acres) of land. In April 2011, a technical report is due and the Nova Scotia government may request the surrender of certain lands they deem not adequately evaluated. During the first five years of the lease, we agreed to continue to evaluate the Windsor Block by drilling seven wells, completing three exploration wells previously drilled and acquiring seismic data at a total gross estimate cost of Cdn $12.7 million (U.S. $11.7 million). At the end of the fifth year of the lease, areas of the land block not adequately drilled or otherwise evaluated may be subject to surrender. Since April 15, 2009, we have completed three exploration wells and acquired the seismic data towards the production lease commitments. There is a risk that our joint venture partner in the Windsor Block will not be able to pay for their portion (13%) of the well costs, which could also slow down or stop exploration on the Windsor Block. We will have to raise additional funds or secure
43
Table of Contents
Index to Financial Statements
a new joint operating partner in the Windsor Block to complete the exploration and development phase of our programs and, while we have been successful in doing so in the past, we cannot assure you that we will be able to do so in the future. There is a risk that we may not obtain the necessary additional funds or new joint venture partner to continue operations and to determine the existence, discovery and successful exploitation of economically recoverable reserves and the attainment of profitable operations on our Windsor Block. If we do not obtain additional funds or secure a new joint operator, we may be required to surrender the lease.
We are currently soliciting interest from industry parties to participate in the drilling of a test well to evaluate the newly identified seismic structure and participate in a joint venture to further evaluate the potential on the Windsor Block. There is a risk we may not secure a new joint operating partner in the Windsor Block, which would slow down or stop exploration on the Windsor Block. There is no significant capital expenditures planned for the Windsor Block in fiscal 2011.
Critical Accounting Policies
Use of Estimates
The preparation of financial statements in conformity with GAAP requires us to make estimates and assumptions that affect the reported amounts of assets and liabilities and disclosure of contingent assets and liabilities at the date of the financial statements and the reported amounts of revenues and expenses during the reporting period. Actual results could differ from those estimates. We base our estimates and assumptions on current facts, historical experience and various other factors that we believe to be reasonable under the circumstances, the results of which form the basis for making judgments about the carrying values of assets and liabilities and the accrual of costs and expenses that are not readily apparent from other sources. The actual results experienced by us may differ materially and adversely from our estimates. To the extent there are material differences between the estimates and the actual results, future results of operations will be affected.
Investment in Oil and Natural Gas Properties
We utilize the full cost method to account for our investment in oil and natural gas properties. Accordingly, all costs associated with acquisition and exploration of oil and natural gas reserves, including such costs as leasehold acquisition costs, interest costs relating to unproven properties, geological expenditures and direct internal costs are capitalized into the full cost pools. We have two full costs pools (Canada and U.S.). The full costs pools capitalized costs, including estimated future costs to develop the reserves and estimated abandonment costs, net of salvage, are depleted on the units-of-production method using estimates of proved reserves. Investments in unproven properties and major development projects including capitalized interest, if any, are not amortized until proved reserves associated with the projects can be determined or, if the future exploration of unproven properties is determined uneconomical, the amounts of such properties are added to the capitalized cost to be amortized. The capitalized costs included in the full cost pool are subject to a ceiling test.
Asset Retirement Obligations
We recognize a liability for future retirement obligations associated with our oil and natural gas properties. The estimated fair value of the asset retirement obligations is based on the current estimated cost escalated at an inflation rate and discounted at a credit adjusted risk-free rate. This liability is capitalized as part of the cost of the related asset and amortized over its useful life. The liability accretes until we settle the obligation. The costs are estimated by management based on its knowledge of industry practices, current laws and past experiences. The costs could increase significantly from management’s current estimate.
Stock-Based Compensation
We record compensation expense in our consolidated financial statements for stock options granted to employees, consultants and directors using the fair value method. Fair values are determined using the Black Scholes option pricing model, which is sensitive to the estimate of our stock price volatility and the options expected life. Compensation costs are recognized over the vesting period.
44
Table of Contents
Index to Financial Statements
Recently Adopted Accounting Pronouncements
The Financial Accounting Standards Board, or the FASB, implemented new standards in December 2007 with respect to accounting for business combinations. These new standards require an acquirer to be identified for all business combinations and applies the same method of accounting for business combinations—the acquisition method—to all transactions. In addition, transaction costs associated with acquisitions are required to be expensed. The revised statement was effective to business combinations after February 1, 2009. No business combinations were completed by us in fiscal year 2010 and as such there was no impact that arose from adopting the new business combination standard.
In December 2007, the FASB issued new accounting standards with respect to non-controlling interests in consolidated financial statements. These new standards require us to report non-controlling interests in subsidiaries as equity in our consolidated financial statements; and all transactions between equity and non-controlling interests as equity. These new standards were effective for us commencing on February 1, 2009. The adoption of these standards did not significantly affect our consolidated financial statements.
In March 2008, the FASB issued new accounting standards with respect to disclosures about derivative instruments and hedging activities, which require disclosures about how and why an entity uses derivative instruments, how derivative instruments and related hedged items are accounted for, and how derivative instruments and related hedged items affect an entity’s financial position, financial performance and cash flows. These new standards were effective on February 1, 2009. There were no significant impacts on the disclosures in our financial statements resulting from adopting these standards.
In May 2009, the FASB issued new accounting standards with respect to subsequent events, which were intended to establish general standards of accounting for and disclosure of events that occur after the balance sheet date but before financial statements are issued or are available to be issued. In particular, these standards set forth the period after the balance sheet date during which management of a reporting entity should evaluate events or transactions that may occur for potential recognition or disclosure in the financial statements; the circumstances under which an entity should recognize events or transactions occurring after the balance sheet date in its financial statements; and the disclosures that an entity should make about events or transactions that occurred after the balance sheet date. These standards are effective for interim and annual periods ending after June 15, 2009. The adoption of this standard did not significantly impact the disclosures in our financial statements.
The SEC adopted major revisions to its required oil and natural gas reporting disclosures which became effective as of December 31, 2009. Among other things, the amendments provide for the use of the 12-month average price, calculated as the unweighted arithmetic average of the first-day-of-the-month price for each month within the 12-month period prior to the end of the reporting period for purposes of both the disclosure and full-cost accounting rules. These amendments did not have a significant impact on our financial statements.
45
Table of Contents
Index to Financial Statements
Overview
We are an oil and natural gas exploration and development company currently focused on the acquisition and development of unconventional shale oil resources. In late 2009, we adopted a new investment strategy shifting our area of focus from the Maritimes Basin in the Province of Nova Scotia to the Bakken Shale and Three Forks formations in the Williston Basin of North Dakota and Montana. In furtherance of our new strategy, to date, we have acquired, or committed to acquire, approximately 13,000 net acres primarily in McKenzie and Williams Counties of North Dakota. Having identified an area of focus in the Bakken Shale that we believe will generate attractive returns on invested capital, we are continuing to explore further opportunities in the region with a goal of reaching 30,000 net acres by the end of 2011.
In the Maritimes Basin, we hold over 400,000 net acres with numerous conventional and unconventional objectives, including the Windsor and Horton Shales. As a result of the processing and interpretation of our proprietary 2D seismic data, we have identified a conventional exploration opportunity that we believe could hold significant natural gas reserves. We are currently marketing the prospect to industry partners as a farm-out opportunity and propose to enter into an agreement whereby we would maintain a working interest position and potential partners would agree to cover 100% of the capital costs of an initial exploration well.
Our Strategy
Our goal is to increase stockholder value by increasing our Williston Basin leasehold position and converting such leasehold position into proven reserves, production and cash flow at attractive returns on invested capital. We are seeking to achieve this goal through the following strategies:
| • | Focus on the Williston Basin. We believe the Bakken Shale and Three Forks formations in the Williston Basin represent one of the largest oil deposits in North America. A report issued by the USGS in April 2008 classified these formations as the largest continuous oil accumulation ever assessed by it in the contiguous United States. We expect to continue to aggressively pursue additional leasehold positions where our geologic model suggests the Bakken Shale and/or the Three Forks formations are believed to be prospective. We believe horizontal wells drilled on our acreage will generate attractive returns on invested capital given our outlook for the price of oil and the finding and development costs associated with converting the acreage from resource potential to proven and producing reserves. |
| • | Continue to pursue leasehold acquisitions at attractive costs. We believe significant additional acreage in the Williston Basin, prospective for the Bakken Shale and Three Forks formations, is and will be available for acquisition allowing us to reach our goal of 30,000 net acres by the end of 2011. We believe many of the active operators in the area have assembled sizeable leasehold positions and have shifted from a leasehold acquisition strategy to a development strategy, reducing the competition for additional leasehold acreage. We plan to explore various techniques to add acreage, including participating in state and federal lease sales, pursuing leasehold acquisitions, farm-in agreements with existing operators and farm-in opportunities on lease positions that are about to expire. We believe many operators will choose to farm-out lease positions rather than allow leases to expire, giving us an opportunity to add significant leasehold at attractive costs. |
| • | Maintain a balanced mix of operated and non-operated leasehold positions. Through our non-operated positions with Slawson and Kodiak, we plan to leverage our currently low overhead while broadening our operating experience by teaming with two of the most active and knowledgeable operators in the Williston Basin. We believe that Slawson’s and Kodiak’s long histories in the Williston Basin will also provide significant opportunities to expand our collective acreage position. We believe that the operations of Slawson and Kodiak will have lower costs resulting in higher returns |
46
Table of Contents
Index to Financial Statements
| than we can achieve on a stand-alone basis during the early phase of our development. With the majority of primary term leases extending three to five years from inception, we expect to build our operational capabilities and develop our operated acreage position prior to lease expiration. |
| • | Capture upside value in Nova Scotia. We hold approximately 412,924 net acres in the province of Nova Scotia in Canada that we believe contains multiple conventional and unconventional targets. Increased industry activity in the Maritimes Basin, along with other factors, such as combined with more restrictive permitting procedures in the Gulf of Mexico, has increased industry interest in this area. Recently, Southwestern Energy Company, a mid-cap independent exploration company, leased a large undeveloped acreage position in the province of New Brunswick and committed to spend $47 million on the development of such acreage. Additionally, Apache Corporation recently spudded the B-41 Green Road and the G-59 Will deMille wells pursuant to its December 2009 farm-out agreement with Corridor Resources Inc. We are currently seeking a farm-out arrangement whereby a partner will fund 100% of the cost of the first well drilled on our acreage. |
| • | Maintain conservative leverage position to enhance financial flexibility. Acquisitions and farm-in opportunities will require us to move rapidly in many instances. As such, we expect to maintain excess cash balances and a conservative leverage position while we focus on leasehold acquisitions. Between now and the end of 2011, we expect to primarily use equity capital to fund our leasehold expansion and only add leverage where cash flow and reserve growth allow. |
Our Competitive Strengths
We have the following competitive strengths that we believe will help us to successfully execute our business strategies:
| • | We benefit from the increasing activity in the Bakken Shale and Three Forks formations acreage. Activity levels in the Williston Basin continue to increase with a drilling rig count of 134 at October 15, 2010 versus 65 at January 1, 2010. We benefit from the increasing number of wells drilled and the corresponding data available from public sources and the North Dakota Industrial Commission. This activity and data has begun to define the geographic extent of the Bakken Shale and Three Forks formations which we believe reduces the amount of risk we face on future leasehold acquisitions and development operations. In addition, the leading operators in the Williston Basin have developed drilling and completion technologies that have significantly reduced production risk, decreased per unit drilling and completion costs and enhanced returns. |
| • | Relatively small size allows us to make meaningful acquisitions. Our relatively small size provides us with the opportunity to acquire smaller acreage blocks that may be less attractive to larger operators inside and outside of the Williston Basin. These smaller blocks in aggregate will have a meaningful impact on our overall acreage position and should allow us to meet our goal of 30,000 net acres by year-end 2011. |
| • | Experienced management team with proven acquisition and operating capabilities. Peter Hill, our Chief Executive Officer, has over 37 years of oil and natural gas experience, including over 20 years with British Petroleum in a variety of roles including Chief Geologist, Chief of Staff for BP Exploration, President of BP Venezuela and Regional Director for Central and South America. He currently serves as the non-executive Chairman for Toreador Resources Corporation, a public company currently developing an oil shale prospect in the Paris Basin in France. He is complemented by Jonathan Samuels, our Chief Financial Officer, who spent over five years as a member of an energy focused investment management firm. |
| • | We have no outstanding indebtedness and following the offering we will have $44.7 million in as adjusted cash. We expect to have approximately $44.7 million in cash after we close this offering. We |
47
Table of Contents
Index to Financial Statements
| will use this cash to meet our drilling commitments in 2010 and 2011 and pursue additional leasehold acquisitions, including under our recent agreement with Williston Exploration LLC. See “—Recent Developments.” |
Recent Developments
On October 5, 2010, we entered into a purchase and sale agreement with Williston Exploration LLC to acquire approximately 1,732 net acres in Williams County, North Dakota. These undeveloped acres are in contiguous blocks in three separate 1,280 acre drilling units and will provide our first operated drilling locations. The addition of this acreage will give us an opportunity to operate on a large portion of the acreage and we plan to drill a well that we will operate by the end of 2011. The aggregate purchase price consists of up to approximately $2.2 million in cash and up to 433,500 shares of our common stock (after giving effect to the reverse stock split). We expect to close on a portion of the acres in December 2010 and on the remainder in February 2011.
On October 22, we entered into the Oppenheimer Agreement OGR. Under the Oppenheimer Agreement, OGR has made a $25 million capital commitment to co-invest with us in our future acquisition and development of assets in the Williston Basin. $10 million of OGR’s initial capital, which OGR has the right to increase up to $19 million, is allocated for leasehold acquisition with the remainder available for well development. Further, OGR has the right to participate in up to 25% of our future activity in the Williston Basin. OGR will pay its share of leasehold costs in all leases in which it participates, plus a premium to us equal to an additional percentage of lease acquisition costs which is designed to remunerate us for our services in sourcing and managing the acreage activity in the Williston Basin. The acreage premium varies from 20% to 60% depending upon the level of lease acquisition costs. OGR will also bear 25% of all of our brokerage costs in the region. In addition, OGR will pay its proportional share of all drilling and completion costs, plus a 10% premium thereof to us for our services associated with well development. We will also earn an annual management fee as general and administrative expense reimbursement. Our current leasehold position, including the Grizzly Project, and any future leasehold acquisition pursuant to the Slawson Agreement, is excluded from the Oppenheimer Agreement. The Oppenheimer Agreement remains in effect until the third anniversary of its effective date unless OGR achieves certain acquisition thresholds before that date and elects to extend the term of the agreement, or fails to achieve certain thresholds and we elect to terminate the agreement. Also, OGR may terminate the agreement if our net worth falls below a certain level or OGR determines that changes in our executive management team or adverse changes in our financial prospects are not satisfactory.
Beginning in the fourth quarter of 2010, we believe we will participate in the drilling of up to 20 gross (5.3 net) wells by the end of 2011. We anticipate participating in two gross (1.25 net) wells in the acreage being acquired from Williston Exploration LLC, 10 gross (2.0 net) wells on our Slawson AMI, two to four gross (0.7 to 1.40 net) wells in the Grizzly Project and up to four gross (0.6 net) wells in our other non-operated areas. With an average drilling and completion cost of $7.0 million per well, we have budgeted a range of anticipated drilling capital costs of $30 to $40 million over this period.
Operations and Oil and Natural Gas Properties
Williston Basin
We have operated and non-operated leasehold positions in the Williston Basin. The operations of our non-operated leasehold positions are primarily conducted through agreements with Slawson and Kodiak. Both companies are experienced operators in the development of the Bakken Shale and Three Forks formations. As of October 22, 2010, we have acquired, or committed to acquire, an aggregate of approximately 13,000 net acres in the Williston Basin in North Dakota. We are seeking to acquire new operated and non-operated acreage within these formations with additional experienced operators. In 2011, we also plan to drill our first operating well on the acreage that we expect to acquire as part of the Williston Purchase. See “—Recent Developments.” In
48
Table of Contents
Index to Financial Statements
addition, we have successfully recruited a new land staff and brokerage and title team, which in the past month has successfully acquired over 1,200 net acres, including approximately 700 net acres in the same township as the Williston Purchase.
The Slawson Agreement is confined to an agreed upon AMI within the Rough Rider area of McKenzie and Williams Counties in North Dakota. We have acquired approximately 6,000 net acres to date under the Slawson Agreement and have identified numerous drilling locations. We will spud our first well in October 2010 and plan to continue to drill additional wells through the end of 2011. Under the terms of the Slawson Agreement, we pay 33% of the gross well costs and between a 20% and 60% premium of our pro rata share of leasehold acquisition costs to earn a 30% working interest in all wells drilled within the AMI through January 15, 2012. We believe the terms of the Slawson Agreement are consistent with industry practice and will result in net costs to us that are substantially lower than we could achieve during the early phase of our development.
In May 2010, we entered into an agreement with Kodiak pursuant to which we have the opportunity to acquire approximately 2,600 net acres in the Grizzly Project. Under the terms of the agreement, we agreed to pay approximately $3.2 million to Kodiak in the form of future drilling carry for a 30% working interest in the Grizzly Project area. After the $3.2 million has been expended, we will have earned our 2,600 net acres, with all future wells to be drilled according to our working interest position. After the $3.2 million has been expended, we will have earned over 2,600 net acres, with all future wells to be drilled according to our working interest position. As described below, we have drilled three gross wells in the Grizzly Project, two of which are awaiting completion and one of which has been production tested and is being prepared for production. We anticipate drilling an additional well by fiscal year-end.
Using industry accepted well-spacing parameters and a combination of short and long laterals, we believe that there could be over 100 unrisked drilling locations for the Bakken Shale and Three Forks formations on our acreage in the Williston Basin. Based on current industry expectations, we believe we can drill up to eight 9,500 foot lateral wells on 1,280 acre spacing units within our acreage. Consistent with leading field operators, we plan to perform multi-stage fracs with 25 to 30 stages on each lateral well. We also plan to drill shorter laterals on smaller units as dictated by our leasehold position.
In May 2010, we announced our plans to participate in the Roedeske Federal #12-21H well in McKenzie County with an approximate 15% working interest. The 9,000 foot lateral well was drilled on a 1,280 acre spacing unit and is awaiting completion with a 22-stage frac job. The well is operated by XTO Energy Inc.
In June 2010, we commenced a two well drilling program in the Grizzly Project with Kodiak as operator. The first well, the Grizzly #13-6H, is a 4,000 foot lateral re-entry of an existing wellbore. The estimated gross costs are $3.2 million and we have an approximate 26% working interest in this well. We anticipate that this well will be completed in late October 2010. The second well, the Grizzly #1-27H-R, is a long 9,000 foot lateral well that is being drilled on a 1,280 acre spacing unit. This well experienced mechanical difficulties during completion resulting in only 10 of 24 initially planned stages being completed, reducing the estimated cost of the well. The well produced 507 Boe during its initial 24 hour test and is currently being prepared for production. The gross estimated costs are $5.7 million and we have an approximate 26% working interest in this well.
We recently announced that Slawson will spud the first well of its joint venture with us on approximately October 30, 2010, the Bonanza #1-21-16H, located in the Rough Rider area in McKenzie County. We currently anticipate that Slawson will drill an additional nine wells in the Rough Rider area during the remainder of 2010 and 2011.
Maritimes Basin
We have an 87% working interest in approximately 474,625 gross acres (approximately 412,924 net acres) in the Windsor Sub-Basin of the Maritimes Basin. In October 2009, we completed an approximately 30-square kilometer 2D seismic shoot on the Windsor Block and completed processing and interpreting the data in the
49
Table of Contents
Index to Financial Statements
fiscal quarter ending January 31, 2010. We believe that this seismic program, combined with the completion operations on three previously drilled vertical exploration wells, satisfied the first-year requirements of our 10-year production lease. We have completed our interpretation of the seismic data on the Windsor Block and we are currently seeking partners to participate in the drilling of the test well and to participate in a joint venture to further evaluate the potential of the Windsor Block.
Under the terms of the Windsor Block 10-year production lease:
| • | The production lease grants rights to approximately 474,625 gross acres (approximately 412,924 net acres). |
| • | We hold rights to conventional oil and natural gas within the lease, which includes shale natural gas, in the Windsor and Horton Shales, excluding natural gas from coal. We believe coals are not prospective within the Windsor Block. |
| • | To retain rights to this land block, we have agreed to continue to evaluate the lands during the first five years of the lease by drilling seven wells, completing three exploration wells previously drilled, and acquiring seismic data, which cost approximately Cdn $12.7 million gross (approximately U.S. $11.9 million). These wells are to be distributed across the land block to fully evaluate conventional and shale resources. In addition to annual progress reporting to maintain the lease in good standing, on the second anniversary of the lease, we are obliged to provide a detailed report to the Nova Scotia government to assess our evaluation activities to maintain certain lands. After the fifth anniversary, leased areas not adequately drilled or otherwise evaluated may be subject to surrender. |
| • | During the first year of the lease, we agreed to complete three exploration wells that were drilled in the prior year and acquire seismic data, which cost approximately Cdn $2 million gross (approximately U.S. $1.9 million). An approximately Cdn $200,000 (approximately U.S. $189,000) gross refundable deposit was posted related to the first year commitment; should the work not be competed, a portion or all of the deposit could be forfeited. |
| • | As of October 22, 2010, royalty rates are set at 10% in Nova Scotia. |
| • | Tenure on some or all of the lands is eligible for renewal after the first 10 years, based on the establishment of commercial production and/or the satisfaction of certain drilling and evaluation criteria. |
From May 2007 to June 2008, we executed the first phase of the Windsor Block exploration program consisting of a 2D and 3D seismic program, geological studies, and drilling and completing two vertical test wells (Kennetcook #1 and Kennetcook #2). From July 2008 to September 2009, we executed the second phase of the Windsor Block shale natural gas exploration program, which consisted of drilling three vertical exploration wells (N-14-A, O-61-C and E-38-A) and undertaking completion operations on all three of these wells.
In June 2009, we acquired an additional 30% working interest in the Windsor Block from Contact in exchange for a 5.75% non-convertible gross overriding royalty interest, a cash payment of Cdn $270,000 (approximately U.S. $263,183) and our assumption of the liabilities related to the former working interest from Contact. This acquisition increased our working interest to its current 87% level.
In October 2009, we acquired 30 kilometers of 2D seismic data on the Windsor Block and completed processing and interpreting the data in the fiscal quarter ending January 31, 2010. We believe that this seismic program, combined with the three completion operations on previously drilled vertical exploration wells, satisfied the first-year requirements of our 10-year production lease.
The seismic program was designed to delineate the western end of the Windsor Basin where we believed the Windsor and Horton Shales to be prospective and that uplift, faulting and thrusting were likely to create conventional structures. We believe the seismic program showed a large, deep seated, conventional four-way
50
Table of Contents
Index to Financial Statements
closure with a large fault-controlled structural feature. The structures appear to be late Carboniferous in age, with later fault inversion, and precede the Permian gas generation following burial and over-thrusting. The setting is almost identical to the McCully Field in the Elgin Basin, New Brunswick and suggests a similar structural evolution. We believe the elevated structure is a natural conduit for migrating natural gas from the basin center, and with significant faulting natural fracturing may help rock porosity and permeability.
We continue to seek a partner for the drilling of an onshore well in the development of the Windsor Block. In moving forward with the Windsor Block, we intend to consider a range of options pursuant to our existing production lease.
Non-Core Properties
In fiscal 2010, there was no exploration activity on our non-producing and undeveloped land positions and we continue to plan not to participate in any exploration activity for these projects in fiscal 2011. We have recently divested most of our non-core properties. During fiscal 2010, we sold:
| • | our 25% working interest in 4,327 non-operated net acres in the Rocky Mountains for gross proceeds of $83,325 in June 2009; |
| • | our 50% working interest in 5,900 non-operated net acres in the Fayetteville Shale and all the related seismic data for gross cash proceeds of $767,000 in September 2009 and our remaining 3,880 non-operated net acres of the Fayetteville Shale acreage for gross cash proceeds of $247,000 in November 2009. Costs related to these sales were approximately $30,000; and |
| • | one of the producing wells and our 12% working interest in 154 non-operated net undeveloped acres in the Alberta Deep Basin for $426,600 in January 2010. |
In May 2010, we announced that we closed the sale of an existing wellbore and associated acreage in Alberta for approximately $977,000.
Our remaining non-core producing properties include 4,427 non-operated acres in the Rocky Mountains and 3,024 net acres in the Alberta Deep Basin of Canada.
Information Regarding Oil and Natural Gas Producing Activities
Net Reserves of Oil, Natural Gas Liquids and Natural Gas at Fiscal Year-End 2010
At January 31, 2010, our proved reserve estimates and future discounted cash flow at 10% was valued at an inconsequential amount. We did not obtain a reserve report at January 31, 2010 as the reserves were not material. Our 12-month production for the year ended January 31, 2010 for these wells was:
| Alberta Deep Basin, Canada |
Texas Barnett Shale, U.S.A. |
Total | ||||||||||
| Fiscal 2010 Working Interest Production (Mcfe) |
22 | 18 | 40 | |||||||||
Competitors
In the Williston Basin, we compete with a number of larger public and private companies such as Continental Resources, Inc., Brigham Exploration Company, Enerplus Resources Fund, Kodiak, Oasis Petroleum Inc., Newfield Exploration Co., XTO Energy, Inc. (now part of ExxonMobil) and Whiting Petroleum Corporation. All of these companies have significantly more personnel and experience in the Williston Basin and greater access to capital than we do.
51
Table of Contents
Index to Financial Statements
In the Maritimes Basin, there are several specialized competitors who have been pursuing their respective strategies for a number of years. These companies include Contact, Stealth Ventures Ltd., Corridor Resources Inc., Apache Corporation and Southwestern Energy Company. These companies have gained technical expertise in the area as they have continued to advance their respective exploration programs.
Governmental Regulation
Our business is affected by numerous laws and regulations, including energy, environmental, conservation, tax and other laws and regulations relating to the oil and natural gas industry. We have developed internal procedures and policies to ensure that our operations are conducted in full and substantial environmental regulatory compliance.
Failure to comply with any laws and regulations may result in the assessment of administrative, civil and/or criminal penalties, the imposition of injunctive relief or both. Moreover, changes in any of these laws and regulations could have a material adverse effect on business. In view of the many uncertainties with respect to current and future laws and regulations, including their applicability to us, we cannot predict the overall effect of such laws and regulations on our future operations.
We believe that our operations comply in all material respects with applicable laws and regulations and that the existence and enforcement of such laws and regulations have no more restrictive an effect on our operations than on other similar companies in the oil and natural gas industry. Our future expenditures to comply with environmental requirements have been estimated in the consolidated financial statements included in this prospectus, under the caption of asset retirement obligations.
Pricing and Marketing of Natural Gas
In Canada, the price of natural gas sold in interprovincial and international trade is determined by negotiations between buyers and sellers. Natural gas exported from Canada is subject to regulation by the National Energy Board of Canada. Exporters are free to negotiate prices and other terms with purchasers, provided that the export contracts continue to meet certain criteria prescribed by the National Energy Board of Canada. Natural gas (other than propane, butanes and ethane) exports for a term of less than two years or for a term of two to 20 years (in quantities of not more than 30,000 m3/day) must be made pursuant to an order of the National Energy Board, or the NEB. Natural gas may be exported for a term of no more than one year in respect to propane and butane, and no more than two years in respect to ethane, with all exports requiring an NEB order. Any natural gas export to be made pursuant to a contract of longer duration (to a maximum of 25 years) or a larger quantity requires an exporter to obtain an export license from the NEB and the issue of such a license requires the approval of the Lieutenant Governor in Council. The export of natural gas pursuant to an order or license shall be subject to the terms and conditions included by the National Energy Board of Canada in such order or license.
Also in Canada, the government of Alberta regulates the volume of natural gas that may be removed from the province for consumption elsewhere based on such factors as reserve availability, transportation arrangements and market considerations. Natural gas may not be removed from the Province of Alberta without a permit from the Energy Resources Conservation Board of the Province of Alberta. The Energy Resources Conservation Board of the Province of Alberta may grant a permit for the removal of less than three billion cubic meters of natural gas for a term not exceeding two years with the approval of the Minister of Energy. All other permits for the removal of natural gas to be granted by the Energy Resources Conservation Board of the Province of Alberta require the approval of the Lieutenant Governor in Council. The removal of natural gas from the Province of Alberta shall be subject to the terms and conditions included by the Energy Resources Conservation Board of the Province of Alberta in the permit granted for such removal.
In the U.S., historically, the sale of natural gas in interstate commerce has been regulated pursuant to the Natural Gas Act of 1938, or the NGA, the Natural Gas Policy Act of 1978, or the NGPA, and regulations
52
Table of Contents
Index to Financial Statements
promulgated thereunder by the Federal Energy Regulatory Commission, or the FERC. In 1989, Congress enacted the Natural Gas Wellhead Decontrol Act, or the Decontrol Act. The Decontrol Act removed all NGA and NGPA price and non-price controls affecting wellhead sales of natural gas effective January 1, 1993 and sales by producers of natural gas are uncontrolled and can be made at market prices. The natural gas industry historically has been heavily regulated and from time to time proposals are introduced by Congress and the FERC and judicial decisions are rendered that impact the conduct of business in the natural gas industry. We cannot assure you that the less stringent regulatory approach recently pursued by the FERC and Congress will continue.
Pricing and Marketing of Oil
In Canada, producers of oil negotiate sales contracts directly with oil purchasers, with the result that the market determines the price of oil. The price depends in part on oil quality, prices of competing fuels, distance to market, the value of refined products and the supply/demand balance. Oil exports may be made pursuant to export contracts with terms not exceeding two years in the case of heavy crude and not exceeding one year in the case of oil other than heavy crude, provided that an order approving any such export has been obtained from the National Energy Board of Canada. Any oil export to be made pursuant to a contract of longer duration (to a maximum of 25 years) requires an exporter to obtain an export license from the National Energy Board of Canada and the issue of such a license requires a public hearing and obtaining the approval of the Lieutenant Governor in Council. The export of oil pursuant to an order or license shall be subject to the terms and conditions included by the National Energy Board of Canada in such order or license.
In the U.S., sales of crude oil, condensate and natural gas liquids are not regulated and are made at negotiated prices. Effective January 1, 1995, the FERC implemented regulations establishing an indexing system for transportation rates for oil that allowed for an increase in the cost of transporting oil to the purchaser.
Royalties and Incentives
The royalty regime is a significant factor in the profitability of oil, natural gas and natural gas liquids production. In the U.S., all royalties are determined by negotiations between the mineral owner and the lessee.
In Canada, royalties payable on production from non-Crown lands (i.e. non-government lands) are determined by negotiations between the mineral owner and the lessee. However, crown royalties (i.e. government land royalties) are determined by government regulation and are generally calculated as a percentage of the value of the gross production, and the rate of royalties payable generally depends in part on prescribed reference prices, well productivity, geographical location, field discovery date and the type or quality of the petroleum product produced. In addition to federal regulation, each province has legislation and regulations that govern land tenure, royalties, production rates, environmental protection and other matters. From time to time the governments of Canada, Alberta and Nova Scotia have established incentive programs which have included royalty rate reductions, royalty holidays and tax credits for the purpose of encouraging oil and natural gas exploration or enhanced planning projects.
Nova Scotia
In the Province of Nova Scotia, the royalty rate for onshore oil and natural gas production has been set at a flat rate of 10% of the petroleum that is produced in each month based on the fair market value of the petroleum at the wellhead. In determining the royalty to be paid on any petroleum other than oil, there is deducted an allowance for the cost of processing or separation as determined in any particular case by the Minister of Energy. Notwithstanding the foregoing, no royalty shall be due with respect to any oil or natural gas that is produced pursuant to the first production lease that is granted with respect to lands subject to an exploration agreement, for a period of two years from the date of commencement of such lease.
53
Table of Contents
Index to Financial Statements
Land Tenure
In Canada, oil and natural gas deposits located in Nova Scotia are owned by that provincial government and oil and natural gas deposits located in the western provinces of Canada are predominantly owned by the respective provincial governments. Provincial governments grant rights to explore for and produce oil and natural gas pursuant to leases, licenses and permits for varying terms and on conditions set forth in provincial legislation including specific work commitments or obligations to make rental, royalty or other payments. Where oil and natural gas deposits are privately owned, such as in the U.S., rights to explore for and produce such oil and natural gas are granted by lease on such terms and conditions as may be negotiated.
The North American Free Trade Agreement
On January 1, 1994, the North American Free Trade Agreement, or NAFTA, became effective among the governments of Canada, the U.S. and Mexico. NAFTA carries forward most of the material energy terms contained in the Canada—U.S. Free Trade Agreement. In the context of energy resources, Canada continues to remain free to determine whether exports to the United States or Mexico will be allowed provided that any export restrictions do not: (i) reduce the proportion of energy resource exported relative to domestic use (based upon the proportion prevailing in the most recent 36-month period), (ii) impose an export price higher than the domestic price and (iii) disrupt normal channels of supply. All three countries are prohibited from imposing minimum export or import price requirements.
NAFTA contemplates the reduction of Mexican restrictive trade practices in the energy sector and prohibits discriminatory border restrictions and export taxes. NAFTA also contemplates clearer disciplines on regulators to ensure fair implementation of any regulatory changes and to minimize disruption of contractual arrangements, which is important for Canadian natural gas exports.
Environmental
United States
Like the oil and natural gas industry in general, our properties are subject to extensive and changing federal, state and local laws and regulations designed to protect and preserve our natural resources and the environment. The recent trend in environmental legislation and regulation is generally toward stricter standards, and this trend is likely to continue. These laws and regulations often require a permit or other authorization before construction or drilling commences and for certain other activities; limit or prohibit access, seismic acquisition, construction, drilling and other activities on certain lands lying within wilderness and other protected areas; impose substantial liabilities for pollution resulting from our operations; and require the reclamation of certain lands.
The permits required for many of our operations are subject to revocation, modification and renewal by issuing authorities. Governmental authorities have the power to enforce compliance with their regulations, and violations are subject to fines, injunctions or both. In the opinion of our management, we are in substantial compliance with current applicable environmental laws and regulations, and we have no material commitments for capital expenditures to comply with existing environmental requirements. Nevertheless, changes in existing environmental laws and regulations or in interpretations thereof could have a significant impact on us, as well as the oil and natural gas industry in general. The Comprehensive Environmental Response, Compensation and Liability Act, or the CERCLA, and comparable state statutes impose strict and joint and several liabilities on owners and operators of certain sites and on persons who disposed of or arranged for the disposal of “hazardous substances” found at such sites. It is not uncommon for the neighboring landowners and other third parties to file claims for personal injury and property damage allegedly caused by the hazardous substances released into the environment. The Resource Conservation and Recovery Act, or the RCRA, and comparable state statutes govern the disposal of “solid waste” and “hazardous waste” and authorize imposition of substantial fines and penalties for noncompliance. Although CERCLA currently excludes petroleum from its definition of “hazardous substance,” state laws affecting our operations impose clean-up liability relating to petroleum and petroleum
54
Table of Contents
Index to Financial Statements
related products. In addition, although RCRA classifies certain oil field wastes as “non-hazardous,” such exploration and production wastes could be reclassified as hazardous wastes, thereby making such wastes subject to more stringent handling and disposal requirements.
Federal regulations require certain owners or operators of facilities that store or otherwise handle oil, such as us, to prepare and implement spill prevention, control countermeasure and response plans relating to the possible discharge of oil into surface waters. The Oil Pollution Act of 1990, or the OPA, contains numerous requirements relating to the prevention of and response to oil spills into waters of the United States. For onshore and offshore facilities that may affect waters of the United States, the OPA requires an operator to demonstrate financial responsibility. Regulations are currently being developed under federal and state laws concerning oil pollution prevention and other matters that may impose additional regulatory burdens on us. In addition, the Clean Water Act and analogous state laws require permits to be obtained to authorize discharge into surface waters or to construct facilities in wetland areas. The Clean Air Act of 1970 and its subsequent amendments in 1990 and 1997 also impose permit requirements and necessitate certain restrictions on point source emissions of volatile organic carbons (nitrogen oxides and sulfur dioxide) and particulates with respect to certain of our operations. We are required to maintain such permits or meet general permit requirements. The EPA and designated state agencies have in place regulations concerning discharges of storm water runoff and stationary sources of air emissions. These programs require covered facilities to obtain individual permits, participate in a group or seek coverage under an EPA general permit. Most agencies recognize the unique qualities of oil and natural gas exploration and production operations. A number of agencies including but not limited to the EPA, the Bureau of Land Management, the Texas Commission of Environmental Quality, the Louisiana Department of Natural Resources, the North Dakota Industrial Commission, the Oklahoma Conservation Commission, the Wyoming Oil and Gas Conservation Commission, the Montana Board of Oil and Gas Conservation and similar commissions within these states and of other states in which we do business have adopted regulatory guidance in consideration of the operational limitations on these types of facilities and their potential to emit pollutants. We believe that we will be able to obtain, or be included under, such permits, where necessary, and to make minor modifications to existing facilities and operations that would not have a material effect on us.
The EPA amended the UIC provisions of the SDWA to exclude hydraulic fracturing from the definition of “underground injection.” However, the U.S. Senate and House of Representatives are currently considering the FRAC Act, which will amend the SDWA to repeal this exemption. If enacted, the FRAC Act would amend the definition of “underground injection” in the SDWA to encompass hydraulic fracturing activities, which could require hydraulic fracturing operations to meet permitting and financial assurance requirements, adhere to certain construction specifications, fulfill monitoring, reporting, and recordkeeping obligations, and meet plugging and abandonment requirements. The FRAC Act also proposes to require the reporting and public disclosure of chemicals used in the fracturing process, which could make it easier for third parties opposing the hydraulic fracturing process to initiate legal proceedings based on allegations that specific chemicals used in the fracturing process could adversely affect groundwater.
On December 15, 2009, the EPA published its findings that emissions of carbon dioxide, methane and other greenhouse gases present an endangerment to human health and the environment because emissions of such gases are, according to the EPA, contributing to the warming of the earth’s atmosphere and other climatic changes. These findings by the EPA allowed the agency to proceed with the adoption and implementation of regulations that would restrict emissions of greenhouse gases under existing provisions of the federal Clean Air Act. Consequently, the EPA proposed two sets of regulations that would require a reduction in emissions of greenhouse gases from motor vehicles and, also, could trigger permit review for greenhouse gas emissions from certain stationary sources. In addition, on October 30, 2009, the EPA published a final rule requiring the reporting of greenhouse gas emissions from specified large greenhouse gas emission sources in the United States beginning in 2011 for emissions occurring in 2010.
Also, on June 26, 2009, the U.S. House of Representatives passed the American Clean Energy and Security Act of 2009, or ACESA, which would establish an economy-wide cap-and-trade program to reduce United States
55
Table of Contents
Index to Financial Statements
emissions of greenhouse gases including carbon dioxide and methane that may contribute to the warming of the Earth’s atmosphere and other climatic changes. If it becomes law, ACESA would require a 17% reduction in greenhouse gas emissions from 2005 levels by 2020 and just over an 80% reduction of such emissions by 2050. Under this legislation, the EPA would issue a capped and steadily declining number of tradable emissions allowances to certain major sources of greenhouse gas emissions so that such sources could continue to emit greenhouse gases into the atmosphere. These allowances would be expected to escalate significantly in cost over time. The net effect of ACESA will be to impose increasing costs on the combustion of carbon-based fuels such as oil, refined petroleum products and natural gas. The U.S. Senate has begun work on its own legislation for restricting domestic greenhouse gas emissions and President Obama has indicated his support of legislation to reduce greenhouse gas emissions through an emission allowance system.
Canada
The oil and natural gas industry is governed by environmental regulation under Canadian federal and provincial laws, rules and regulations, which restrict and prohibit the release or emission and regulate the storage and transportation of various substances produced or utilized in association with oil and natural gas industry operations. In addition, applicable environmental laws require that well and facility sites be abandoned and reclaimed, to the satisfaction of provincial authorities, in order to remediate these sites to near natural conditions. Also, environmental laws may impose upon “responsible persons” remediation obligations on property designated as a contaminated site. Responsible persons include persons responsible for the substance causing the contamination, persons who caused the release of the substance and any present or past owner, tenant or other person in possession of the site. Compliance with such legislation can require significant expenditures. A breach of environmental laws may result in the imposition of fines and penalties and suspension of production, in addition to the costs of abandonment and reclamation.
In Nova Scotia, environmental laws are consolidated in the Nova Scotia Environment Act. Under this Act, environmental standards and requirements applicable to compliance, cleanup and reporting are contained and administered by the Nova Scotia Department of Environment.
In December 2002, the Government of Canada ratified the Kyoto Protocol, or the Protocol. The Protocol calls for Canada to reduce its emissions of GHGs to 6% below 1990 “business as usual” levels between 2008 and 2012. It remains uncertain whether the Kyoto target of 6% below 1990 GHG emission levels will be enforced in Canada. On April 26, 2007, the Canadian government released “Turning the Corner: An Action Plan to Reduce Greenhouse Gases and Air Pollution,” or the Action Plan, which set forth a plan for regulations to address both GHG and air pollution. On March 10, 2008, the Canadian government released an update to the Action Plan, “Turning the Corner: Regulatory Framework for Industrial Greenhouse Gas Emissions,” or the Updated Action Plan. Regulations for the implementation of the Updated Action Plan were originally intended to be in force by January 1, 2010. To date, no such regulations have been proposed. Further, representatives of the Canadian government have recently indicated that the proposals contained in the Updated Action Plan will be modified to ensure consistency with the direction ultimately taken by the United States with respect to GHG emissions regulation. Since it is presently unclear what approach will be adopted by the United States, the provisions of the Updated Action Plan, described below are expected to be significantly modified.
The proposed compliance mechanisms under the Updated Action Plan include an emissions credit trading system for GHGs and certain industrial air pollutants, and several options for companies to choose among to meet GHG emission intensity reduction targets and encourage the development of new emission reduction technologies, including the option of making payments into a technology fund, an emissions and offset trading system, limited credits for emission reductions created between 1992 and 2006, and international emission credits under the clean development mechanism under the Kyoto Protocol for up to 10% of each company’s regulatory obligation.
56
Table of Contents
Index to Financial Statements
Environmental legislation in the Province of Alberta involving oil and natural gas operations has been consolidated into the Environmental Protection and Enhancement Act (Alberta), the Water Act (Alberta) and the Oil and Gas Conservation Act (Alberta). These statutes impose environmental standards, require compliance, reporting and monitoring obligations and impose penalties. In addition, GHG emission reduction requirements are set out in the Climate Change and Emissions Management Act (Alberta) and came into effect on July 1, 2007. Under this legislation, Alberta facilities emitting more than 100,000 tonnes of GHGs a year must reduce their emissions intensity by 12% from their respective baseline emissions. Companies have four options to choose from in order to meet the reduction requirements outlined in this legislation, including: (i) making improvements to operations that result in reductions; (ii) purchasing emission credits from other sectors or facilities that have reduced their emissions below the required emission intensity reduction levels; (iii) purchasing off-set credits from other sectors or facilities that have emissions below the 100,000 tonne threshold and are voluntarily reducing their emissions in Alberta; or (iv) contributing to the Climate Change and Emissions Management Fund. Companies can choose one of these options or a combination thereof to meet their Alberta emissions reduction requirements.
Climate Change
Climate change has emerged as an important topic in public policy debate regarding our environment. It is a complex issue, with some scientific research suggesting that rising global temperatures are the result of an increase in GHGs, which may ultimately pose a risk to society and the environment. Products produced by the oil and natural gas exploration and production industry are a source of certain GHGs, namely carbon dioxide and methane, and future restrictions on the combustion of fossil fuels or the venting of natural gas could have a significant impact on our future operations.
Employees
As of October 22, 2010, we had eight full time employees. We consider our relations with our employees to be good.
Properties
We maintain our principal office at 1625 Broadway, Suite 780, Denver, Colorado 80202. Our telephone number at that office is (303) 260-7125 and our facsimile number is (303) 260-5080. Our current office space consists of approximately 2,370 square feet. The lease runs until September 2013 at a cost of $4,816 per month.
Legal Proceedings
From time to time, we may become involved in various lawsuits and legal proceedings which arise in the ordinary course of business. However, litigation is subject to inherent uncertainties, and an adverse result in these or other matters may arise from time to time that may harm our business. We are currently not aware of any such legal proceedings or claims that we believe will have, individually or in the aggregate, a material adverse affect on our business, financial condition or results of operations.
57
Table of Contents
Index to Financial Statements
Directors and Executive Officers
The following table sets forth information about our executive officers and directors as of July 31, 2010:
| Name |
Age | Position | ||
| F. Gardner Parker |
67 | Chairman of the Board | ||
| Dr. Peter Hill |
62 | Chief Executive Officer and Director | ||
| Jonathan Samuels |
31 | Chief Financial Officer, Corporate Secretary and Director | ||
| Stephen A. Holditch |
62 | Director | ||
| Randal Matkaluk |
50 | Director |
F. Gardner Parker has been a director and Chairman of the Board since November 2009. From 1970 to 1984, Mr. Parker worked at Ernst & Ernst (now Ernst & Young LLP), an accounting firm, and was a partner at that firm from 1978 to 1984. Mr. Parker served as Managing Outside Trust Manager with Camden Property Trust, a real estate investment trust, from 1998 to 2005 and still serves as a Trust Manager of Camden Property Trust. He has also served as a director of Carrizo Oil & Gas, Inc. since 2000. Mr. Parker also serves on the boards of Hercules Offshore, Inc., Gas Resources Inc. and Sharpes Compliance Corp. He is a graduate of the University of Texas and is a CPA in Texas. Mr. Parker is board certified by the National Association of Corporate Directors. Mr. Parker previously served as a director of Blue Dolphin Energy Company from 2004 to 2007. Mr. Parker’s qualifications to sit on the Board include significant public company governance and audit experience.
Dr. Peter Hill has been a director and our Chief Executive Officer since November 2009. Dr. Hill has over 37 years of experience in the international oil and natural gas industry. He commenced his career in 1972 and spent 22 years in senior positions at British Petroleum including Chief Geologist, Chief of Staff for BP Exploration, President of BP Venezuela and Regional Director for Central and South America. Dr. Hill then worked as Vice President of Exploration at Ranger Oil Ltd. in England (1994-95), Managing Director Exploration and Production at Deminex GMBH Oil in Germany (1995-97), Technical Director/Chief Operating Officer at Hardy Oil & Gas plc (1998-2000), President and Chief Executive Officer at Harvest Natural Resources, Inc. (2000-2005), Director/Chairman at Austral Pacific Energy Ltd. (2006-2008), independent advisor to Palo Alto Investors (January 2008 to December 2009) and Non-Executive Chairman at Toreador Resources Corporation (January 2009 to present). Dr. Hill has a B.Sc. (Honors) in Geology and a Ph.D. Dr. Hill’s qualifications to sit on the Board include significant public company governance experience, significant experience as an exploration geologist and over 20 years of general management experience.
Jonathan Samuels has been a director, and our Chief Financial Officer and Corporate Secretary since December 2009. Prior to joining us, Mr. Samuels was an investment professional responsible for research and investment sourcing in the energy sector at Palo Alto Investors, a hedge fund founded in 1989. Mr. Samuels worked for five years at California-based Palo Alto Investors. Mr. Samuels received his B.A. from the University of California and his MBA from the Wharton School. He also has a Certified Financial Analyst designation. Mr. Samuels’s qualifications to sit on the Board include significant capital markets experience and significant experience investing in public companies.
Stephen A. Holditch has been a director since February 2006. Since January 2004, Mr. Holditch has been the Head of the Department of Petroleum Engineering at Texas A&M University. Since 1976 through the present, Mr. Holditch has been a faculty member at Texas A&M University, as an Assistant Professor, Associate Professor, Professor and Professor Emeritus. Since its founding in 1977 until 1997, when it was acquired by Schlumberger Technology Corporation, Mr. Holditch was the Founder and President of S.A. Holditch & Associates, Inc., a petroleum technology consulting firm providing analysis of low permeability natural gas reservoirs and designing hydraulic fracture treatments. Mr. Holditch is a registered Professional Engineer in
58
Table of Contents
Index to Financial Statements
Texas, has received numerous honors, awards and recognitions and has authored or co-authored over 100 publications on the oil and natural gas industry. Mr. Holditch received his B.S., M.S. and Ph.D. in Petroleum Engineering from Texas A&M University in 1969, 1970 and 1976, respectively. Mr. Holditch’s qualifications to sit on the Board include significant experience with completions, well operations and fracture technology.
Randal Matkaluk has been a director since August 2007. From November 2008 to February 2010, Mr. Matkaluk was the Chief Financial Officer and Corporate Secretary of Vigilant Exploration Inc., a private oil and natural gas exploration company. From March 2006 to October 2008, Mr. Matkaluk was an independent businessman. Mr. Matkaluk has been a director and officer of Virtutone Networks Inc. (formerly Sawhill Capital Ltd.) since October 2005. Between January 2003 and February 2006, Mr. Matkaluk was the co-founder and Chief Financial Officer of Relentless Energy Corporation, a private oil and natural gas exploration company. Between June 2001 and December 2002, Mr. Matkaluk was the Chief Financial Officer of Antrim Energy Inc., a public international oil and natural gas exploration company listed on the TSX Venture Exchange. Mr. Matkaluk has also worked for Gopher Oil and Gas Company and Cube Energy Corp. Mr. Matkaluk has been a Chartered Accountant since 1983. Mr. Matkaluk received his Bachelor’s Degree in Commerce in 1980 from the University of Calgary. Mr. Matkaluk’s qualifications to sit on the Board include significant public company governance and audit experience.
Composition of the Board
Our Board currently consists of five members, including our Chief Executive Officer and Chief Financial Officer. We have three directors that qualify as independent directors under the Canadian securities laws, the corporate governance standards of AMEX and the independence requirements of Rule 10A-3 of the Exchange Act.
Board Leadership Structure
Our Board understands that there is no single, generally accepted approach to providing board leadership and that given the dynamic and competitive environment in which we operate, the right board leadership structure may vary as circumstances warrant. To this end, our Board has no policy mandating the combination or separation of the roles of Chairman and Chief Executive Officer and believes the matter should be discussed and considered from time to time as circumstances change. Upon the completion of this offering, we will have a separate Chairman and Chief Executive Officer. This leadership structure is appropriate for us at this time as it permits our Chief Executive Officer to focus on management of our day-to-day operations, while allowing our Chairman to lead our Board in its fundamental role of providing advice to and independent oversight of management.
Board Oversight of Risk Management
Our full Board oversees our risk management process. Our Board oversees a company-wide approach to risk management, carried out by our management. Our full Board determines the appropriate risk for us generally, assesses the specific risks faced by our company and reviews the steps taken by management to manage those risks.
While the full Board maintains the ultimate oversight responsibility for the risk management process, its committees oversee risk in certain specified areas. In particular, our compensation committee is responsible for overseeing the management of risks relating to our executive compensation plans and arrangements and the incentives created by the compensation awards it administers. Our audit committee oversees management of enterprise risks as well as financial risks and effective upon the consummation of this offering will also be responsible for overseeing potential conflicts of interests. Pursuant to the Board’s instruction, management regularly reports on applicable risks to the relevant committee or the full Board, as appropriate, with additional review or reporting on risks conducted as needed or as requested by the Board and its committees.
59
Table of Contents
Index to Financial Statements
Board Committees
The Board currently has a standing audit committee, compensation committee and nominating and corporate governance committee. Members serve on these committees until their respective resignations or until otherwise determined by our Board. Our Board may from time to time establish other committees.
Audit Committee
The audit committee is currently comprised of three directors, Messrs. Randal Matkaluk, F. Gardner Parker and Stephen Holditch, with Mr. Matkaluk elected as Chairman of the committee. Our Board has determined that all members of the audit committee satisfy the requirements to serve as “independent” directors, as those requirements have been defined by Rule 10A-3 of the Exchange Act and AMEX. The Board has determined that Mr. Matkaluk, who is a Chartered Accountant having over 25 years of financial experience, qualifies as an “audit committee financial expert.” Mr. Matkaluk is independent of management based on the independence requirements set forth in the Financial Industry Regulatory Authority’s definition of “independent director.”
The audit committee is appointed by our Board to assist the Board in overseeing (1) the quality and integrity of our financial statements; (2) the independent auditor’s qualifications and independence; (3) the performance of our independent auditor; and (4) our compliance with legal and regulatory requirements. The authority and responsibilities of the audit committee are set forth in a written audit committee charter adopted by the Board. The charter grants to the audit committee, sole responsibility for the appointment, compensation and evaluation of our independent auditor, as well as establishing the terms of such engagements. The audit committee has the authority to retain the services of independent legal, accounting or other advisors as the audit committee deems necessary, with appropriate funding available from us, as determined by the audit committee, for such services. The audit committee reviews and reassesses the charter annually and recommends any changes to the Board for approval.
Compensation Committee
Our compensation committee is currently comprised of three directors, Messrs. Randal Matkaluk, F. Gardner Parker and Stephen Holditch, with Mr. Matkaluk elected as Chairman of the committee. Our Board has determined that all of the members of the compensation committee are “non-employee” directors as defined in Rule 16b-3(b)(3) under the Exchange Act, and “outside” directors within the meaning of Section 162(m)(4)(c)(i) of the Internal Revenue Code.
Our compensation committee has responsibility for assisting the Board in, among other things, evaluating and making recommendations regarding the compensation of our executive officers and directors, assuring that the executive officers are compensated effectively in a manner consistent with our stated compensation strategy, periodically evaluating the terms and administration of our incentive plans and benefit programs and monitoring of compliance with the legal prohibition on loans to our directors and executive officers.
Nominating and Corporate Governance Committee
The nominating and corporate governance committee is currently comprised of three directors, Messrs. Randal Matkaluk, F. Gardner Parker and Stephen Holditch, with Mr. Matkaluk elected as Chairman of the committee. Our Board has determined that all members of the nominating and corporate governance committee satisfy the requirements to serve as “independent” directors, as those requirements have been defined by Rule 10A-3 of the Exchange Act and AMEX.
The nominating and corporate governance committee will be responsible for identifying, screening and recommending candidates to the Board for Board membership; advising the Board with respect to the corporate governance principles applicable to us; and overseeing the evaluation of the board and management.
60
Table of Contents
Index to Financial Statements
Qualifications for consideration as a director nominee may vary according to the particular areas of expertise being sought as a complement to the existing composition of the Board. However, at a minimum, candidates for director must possess:
| • | high personal and professional ethics and integrity; |
| • | the ability to exercise sound judgment; |
| • | the ability to make independent analytical inquiries; |
| • | a willingness and ability to devote adequate time and resources to diligently perform Board and committee duties; and |
| • | the appropriate and relevant business experience and acumen. |
In addition to these minimum qualifications, the nominating and corporate governance committee will also take into account when considering whether to nominate a potential director candidate the following factors:
| • | whether the person possesses specific industry expertise and familiarity with general issues affecting our business; |
| • | whether the person’s nomination and election would enable the Board to have a member that qualifies as an “audit committee financial expert” as such term is defined by the SEC in Item 401 of Regulation S-K; |
| • | whether the person would qualify as an “independent” director under the listing standards of the various stock markets and exchanges; |
| • | the importance of continuity of the existing composition of the Board to provide long-term stability and experienced oversight; and |
| • | the importance of diversified Board membership, in terms of both the individuals involved and their various experiences and areas of expertise. |
The nominating and corporate governance committee will also consider director candidates recommended by stockholders provided such recommendations are submitted in accordance with the procedures set forth below. In order to provide for an orderly and informed review and selection process for director candidates, the Board has determined that stockholders who wish to recommend director candidates for consideration by the Board must comply with the following:
| • | the recommendation must be made in writing to our Corporate Secretary; |
| • | the recommendation must include the candidate’s name, home and business contact information, detailed biographical data and qualifications, information regarding any relationships between us and the candidate within the last three years and evidence of the recommending person’s ownership of our common stock; |
| • | the recommendation shall also contain a statement from the recommending stockholder in support of the candidate; professional references, particularly within the context of those relevant to board membership, including issues of character, judgment, diversity, age, independence, expertise, corporate experience, length of service, other commitments and the like; and |
| • | a statement from the stockholder nominee indicating that such nominee wants to serve on the Board and could be considered “independent” under the listing standards of the various stock markets and exchanges and the SEC, as in effect at that time. |
All candidates submitted by stockholders will be evaluated by the Board according to the criteria discussed above and in the same manner as all other director candidates.
61
Table of Contents
Index to Financial Statements
Code of Ethics
We have adopted a code of business conduct and ethics (within the meaning of Item 406(b) of Regulation S-K) that applies to our directors, officers and employees. The code of business conduct and ethics is designed to deter wrongdoing and to promote honest and ethical conduct and full, fair, accurate, timely and understandable disclosure in our SEC reports and other public communications. The code of business conduct and ethics promotes compliance with applicable governmental laws, rules and regulations. The code of business conduct and ethics is posted to our website.
Compensation Committee Interlocks and Insider Participation
None of our officers or employees are members of the compensation committee. None of our executive officers serve on the board of directors or compensation committee of a company that has an executive officer that serves on our Board or compensation committee. No member of our Board is an executive officer of a company in which one of our executive officers serves as a member of the board of directors or compensation committee of that company.
Director Compensation
The following table summarizes the compensation awarded during the fiscal year ended January 31, 2010 to our directors who are not named executive officers in the summary compensation table under “Executive Compensation”:
| Name |
Fees Earned or Paid in Cash |
Stock Awards |
Option Awards (b) |
Total | ||||||||||||
| Stephen A. Holditch |
$ | 40,000 | $ | — | $ | 37,698 | $ | 77,698 | ||||||||
| David L. Bradshaw(a) |
$ | 33,333 | $ | — | $ | 103,900 | $ | 137,233 | ||||||||
| Randal Matkaluk |
$ | 40,000 | $ | — | $ | 119,406 | $ | 159,406 | ||||||||
| F. Gardner Parker |
$ | 12,500 | $ | — | $ | 1,819 | $ | 14,319 | ||||||||
| (a) | Mr. Bradshaw resigned from the Board on November 30, 2009. |
| (b) | This column represents the grant date fair value of stock options under FASB ASC Topic 718 granted to each of the directors who are not named executive officers during the fiscal years ending January 31, 2010. For additional information on the valuation assumptions with respect to the grants during the fiscal year ending January 31, 2010, refer to Note 11 of our audited consolidated financial statements for the fiscal year ending January 31, 2010 included in this prospectus. |
Director compensation for the fiscal year ended January 31, 2011 will be $50,000 annually for Randal Matkaluk and Stephen Holditch and $75,000 annually for F. Gardner Parker.
62
Table of Contents
Index to Financial Statements
Summary Compensation Table
The following tables set forth certain information regarding our principal executive officer and each of our most highly-compensated executive officers whose total annual salary and bonus for the fiscal years ending January 31, 2010 and 2009 exceeded $100,000:
| Name & Principal Position |
Year | Salary ($) | Bonus ($) | Option Awards ($)(g) |
All Other Compen- sation ($) |
Total ($) | ||||||||||||||||||
| Dr. Peter Hill(a), |
2010 | $ | 41,667 | $ | — | $ | 5,660 | $ | — | $ | 47,327 | |||||||||||||
| CEO, Principal Executive Officer |
||||||||||||||||||||||||
| Jonathan Samuels(b), |
2010 | $ | 25,000 | $ | — | $ | 3,841 | $ | — | $ | 28,841 | |||||||||||||
| CFO, Principal Financial Officer |
||||||||||||||||||||||||
| Mark Gustafson(c), |
2010 | $ | 186,820 | $ | — | $ | 138,600 | $ | 233,525 | $ | 558,945 | |||||||||||||
| Former CEO, Principal Executive Officer |
2009 | $ | 201,000 | $ | 29,000 | $ | 47,481 | $ | 835 | $ | 278,316 | |||||||||||||
| Howard Anderson(d), |
2010 | $ | 80,180 | $ | 131,552 | $ | 382,984 | |||||||||||||||||
| Former President and COO |
2009 | $ | 156,000 | $ | — | $ | 93,798 | $ | 2,326 | $ | 252,124 | |||||||||||||
| Shaun Toker(e), |
2010 | $ | 122,601 | $ | 23,353 | $ | 88,522 | $ | 93,410 | $ | 327,886 | |||||||||||||
| Former CFO, Principal Financial Officer |
2009 | $ | 122,000 | $ | 39,000 | $ | 57,545 | $ | 5,533 | $ | 224,078 | |||||||||||||
| Ron Hietala(f), |
2009 | $ | 48,000 | $ | 16,000 | $ | — | $ | 197 | $ | 64,197 | |||||||||||||
| Former President of Elmworth Energy Corporation and Triangle USA Petroleum Corporation |
||||||||||||||||||||||||
| (a) | Effective November 30, 2009, we agreed to pay a salary of $250,000 per year to Dr. Hill. For a description of Dr. Hill’s option awards, see “—Outstanding Equity Awards at Fiscal Year-End Table.” |
| (b) | Effective December 16, 2009, we agreed to pay a salary of $200,000 per year to Mr. Samuels. For a description of Mr. Samuels’ option awards, see “—Outstanding Equity Awards at Fiscal Year-End Table.” |
| (c) | On November 1, 2006, we agreed to pay a salary of Cdn $24,000 per month to Mr. Gustafson. Effective March 17, 2008, we agreed to pay a salary of Cdn $20,000 per month to Mr. Gustafson. Mr. Gustafson resigned effective November 30, 2009 and we agreed to pay a severance of Cdn $250,000, which is included as “All Other Compensation,” and fully vested his 500,000 stock options granted January 28, 2009 and extended the expiration date of such options from 10 days after resignation to one year. |
| (d) | Effective February 1, 2008, we agreed to pay a salary of Cdn $15,000 per month to Mr. Anderson. On July 1, 2008, we agreed to pay a salary of Cdn $16,667 per month to Mr. Anderson. Mr. Anderson resigned effective January 5, 2010 and we agreed to pay a severance of Cdn $133,333, which is included as “All Other Compensation.” |
| (e) | Effective September 1, 2007, we agreed to pay an annual salary of Cdn $120,000 to Mr. Toker until December 31, 2007. Effective January 1, 2008, we agreed to pay an annual salary of Cdn $150,000 to Mr. Toker. Mr. Toker resigned from his officer positions effective December 23, 2009 and we agreed to pay a severance of Cdn $100,000, which is included as “All Other Compensation.” |
| (f) | Mr. Hietala is a former director and former President of Elmworth Energy Corporation and Triangle USA Petroleum Corporation, our two operating subsidiaries. On June 23, 2005, we entered into a management consulting agreement with RWH Management Services Ltd. (RWH Management Serves Ltd. is owned by Mr. Hietala). Under the terms of the agreement, we agreed to pay $20,000 per month for an initial term of two years. The agreement was extended to December 31, 2007. Effective March 17, 2008, we agreed to pay a salary of Cdn $16,667 per month to Mr. Hietala. Mr. Hietala resigned effective June 30, 2008. |
63
Table of Contents
Index to Financial Statements
| (g) | This column represents the grant date fair value of stock options under FASB ASC Topic 718 granted to each of the named executive officers in fiscal years ending January 31, 2010 and 2009. For additional information on the valuation assumptions with respect to the grants during the fiscal years ending January 31, 2010 and 2009, refer to Note 11 of our audited consolidated financial statements for the fiscal year ending January 31, 2010 included in this prospectus. |
Employment Agreements with Executive Officers
Both Dr. Hill and Mr. Samuels have entered into employment agreements with us effective January 29, 2010. The agreements provide for a two year term for Dr. Hill and a one year term for Mr. Samuels with an automatic renewal for an additional year unless either party provides written notice of non-renewal.
Peter Hill
The agreement with Dr. Hill provides for an annual salary of not less than $250,000. In addition, Dr. Hill is eligible to receive an annual bonus of up to 200% of base salary based upon performance, or the Hill STI Award, as determined by the compensation committee of the Board, and a one-time award of 200% of base salary paid in unrestricted stock, based on achievement of certain short-term goals set forth in the agreement. These goals include, among others, the completion of a capital raise sufficient for the development of core assets in 2010. Dr. Hill was also granted an initial stock award of 2,000,000 shares. Additionally, he is entitled to participate in any and all benefit plans, from time to time, in effect for executives, along with vacation, sick and holiday pay in accordance with our policies established and in effect from time to time. In the event that Dr. Hill’s employment is terminated by us without cause (as defined in the employment agreement) or by the employee for good reason, Dr. Hill is entitled to the continuation of payment of annual salary for an 18-month period, any unpaid Hill STI Award, the target Hill STI Award for the year in which termination occurs (pro rated for the period worked prior to the termination), benefits for an 18-month period and the immediate vesting of all shares of common stock previously awarded. In the event that Dr. Hill’s employment is terminated by us without cause or Dr. Hill resigns with or without good reason within one year of a Change of Control (as defined in the employment agreement), he is entitled to a lump sum cash payment of two and one-half times annual salary, any unpaid Hill STI Award, the target Hill STI Award for the year in which termination occurs (pro rated for the period worked prior to the termination), benefits for a 30-month period and the immediate vesting of all shares of common stock previously awarded.
Jonathan Samuels
The agreement with Mr. Samuels provides for an annual salary of not less than $200,000. In addition, Mr. Samuels is eligible to receive an annual bonus of up to 200% of base salary based upon performance, or the Samuels STI Award, as determined by the compensation committee of the Board, and a one-time award of 200% of base salary paid in unrestricted stock, based on achievement of certain short-term goals set forth in the agreement. These goals include, among others, the completion of a capital raise sufficient for the development of core assets in 2010. Mr. Samuels was also granted an initial stock award of 1,550,000 shares. Additionally, he is entitled to participate in any and all benefit plans, from time to time, in effect for executives, along with vacation, sick and holiday pay in accordance with our policies established and in effect from time to time. In the event that Mr. Samuels’ employment is terminated by us without cause (as defined in the employment agreement) or by the employee for good reason, Mr. Samuels is entitled to the continuation of payment of annual salary for a 12-month period, any unpaid Samuels STI Award, the target Samuels STI Award for the year in which termination occurs (pro rated for the period worked prior to the termination), benefits for a 12-month period and the immediate vesting of all shares of common stock previously awarded. In the event that Mr. Samuels’ employment is terminated by us without cause or Mr. Samuels resigns with or without good reason within one year of a Change of Control (as defined in the employment agreement), he is entitled to a lump sum cash payment of two times annual salary, any unpaid Samuels STI Award, the target Samuels STI Award for the year in which termination occurs (pro rated for the period worked prior to the termination), benefits for a 24-month period and the immediate vesting of all shares of common stock previously awarded.
64
Table of Contents
Index to Financial Statements
Potential Payments Upon Change of Control
The following table sets forth the estimated potential payments and other benefits each of our named executive officers would have received in the event of a termination without cause or a resignation by the executive within one year of a Change of Control (as defined in the employment agreements). We have assumed that the event triggering the payment occurred on April 30, 2010. The table does not include Accrued Obligations (as defined in the employment agreements) at the time of the triggering event. All calculations assume a stock value of $7.70 per share, which was the closing price of our common stock on the OTC Bulletin Board on April 30, 2010, after giving effect to the reverse stock split.
| Name |
Multiple of Base Salary |
Pro-rata Short Term Incentive Award |
Stock Options (Vesting Accelerated) (a) |
Benefits | Total | |||||||||||||||
| Peter Hill |
$ | 625,000 | $ | 250,000 | $ | 903,000 | $ | 19,000 | $ | 1,797,000 | ||||||||||
| Jonathan Samuels |
400,000 | 200,000 | 612,750 | 9,500 | 1,222,250 | |||||||||||||||
| (a) | Amounts represent the spread between the exercise price and the closing price of our common stock on April 30, 2010 of options that would vest on an accelerated basis if a Change of Control (as defined in the employment agreements) or other triggering event occurred on that day. |
Termination Agreements
Mark Gustafson
On November 30, 2009, Mr. Gustafson signed a separation agreement with us and resigned as our Chief Executive Officer and from our Board. Mr. Gustafson also resigned as an officer and director of all of our subsidiaries. Mr. Gustafson was paid Cdn $250,000, which represented severance payments and all accrued but unused vacation and sick/personal time. The options granted to Mr. Gustafson under the 2005 stock option plan were cancelled and the options granted to Mr. Gustafson during calendar year 2009 immediately vested and became exercisable by him for a period of one year.
J. Howard Anderson
On December 23, 2009, Mr. Anderson signed a termination agreement with us and resigned as our President, Chief Operating Officer and Vice President of Engineering, effective January 4, 2010. Mr. Anderson also resigned as an officer of all of our subsidiaries. Mr. Anderson was paid severance in the amount of Cdn $133,333.34. Mr. Anderson agreed to provide us with transition consulting services through March 31, 2010, for which he received 100,000 shares of the our common stock. Mr. Anderson was entitled to retain 100,000 previously issued stock options, but he agreed to forfeit all other stock options.
Shaun Toker
On December 23, 2009, Mr. Toker signed a termination agreement with us and resigned as our Chief Financial Officer and Corporate Secretary. Mr. Toker also resigned as an officer of all of our subsidiaries. Mr. Toker was paid severance in the amount of Cdn $100,000. Mr. Toker forfeited 300,000 stock options. Mr. Toker continued to be employed by us as a Senior Financial Advisor through April 30, 2010. As a part of Mr. Toker’s compensation, he received 200,000 shares of our common stock.
65
Table of Contents
Index to Financial Statements
Outstanding Equity Awards at Fiscal Year-End Table
The following table sets forth information for the named executive officers regarding the number of shares of common stock subject to both exercisable and unexercisable stock options, after giving effect to the reverse stock split, as well as the exercise prices and expiration dates thereof, as of January 31, 2010.
| Option Awards |
||||||||||||||||
| Name |
Number of Securities Underlying Unexercised Options Exercisable |
Number of Securities Underlying Unexercised Options Unexercisable |
Option Exercise Price |
Option Expiration Date |
||||||||||||
| Peter Hill(a) |
— | 140,000 | $ | 1.25 | 11/30/14 | |||||||||||
| Jonathan Samuels(b) |
— | 95,000 | 1.25 | 11/30/14 | ||||||||||||
| (a) | Dr. Hill’s options vest ratably over a three-year period beginning on the first anniversary of the grant date, which was November 30, 2009. |
| (b) | Mr. Samuels’ options vest ratably over a three-year period beginning on the first anniversary of the grant date, which was November 30, 2009. |
66
Table of Contents
Index to Financial Statements
The following table sets forth certain information with respect to the beneficial ownership of our common stock, after giving effect to the reverse stock split, of: (1) each person or entity who owns of record or beneficially 5% or more of any class of our voting securities; (2) each of our named executive officers and directors; and (3) all of our directors and named executive officers as a group. The percentage of beneficial ownership of our common stock prior to this offering is based upon 10,539,084 shares issued and outstanding on October 22, 2010 (after giving effect to the reverse stock split), not reflecting the completion of this offering.
Beneficial ownership is determined in accordance with the rules of SEC. Under SEC rules, a person is deemed to be a “beneficial owner” of a security if that person has or shares voting power or investment power, which includes the power to dispose of or to direct the disposition of such security. A person is also deemed to be a beneficial owner of any securities of which that person has a right to acquire beneficial ownership within 60 days. Securities that can be so acquired are deemed to be outstanding for purposes of computing such person’s ownership percentage, but not for purposes of computing any other person’s percentage. Under these rules, more than one person may be deemed to be a beneficial owner of the same securities and a person may be deemed to be a beneficial owner of securities as to which such person has no economic interest.
Except as otherwise indicated in the footnotes below, each of the beneficial owners has, to our knowledge, sole voting and investment power with respect to the indicated shares of common stock. Unless otherwise noted, the address of each beneficial owner is 1625 Broadway, Suite 780, Denver, Colorado 80202.
| Shares Beneficially Owned Prior to the Offering |
Shares Beneficially Owned After the Offering |
|||||||||||||||
| Name and Address of Beneficial Owner |
Number of Shares (Actual) |
Number of Shares (Giving Effect to the Reverse Stock Split) |
Percentage | Percentage | ||||||||||||
| Dr. Peter Hill |
466,667 | (1) | 46,667 | * | * | |||||||||||
| Jonathan Samuels |
316,667 | (2) | 31,667 | * | * | |||||||||||
| F. Gardner Parker |
150,000 | (3) | 15,000 | * | * | |||||||||||
| Randal Matkaluk |
150,000 | 15,000 | * | * | ||||||||||||
| Stephen A. Holditch |
138,000 | 13,860 | * | * | ||||||||||||
| All executive officers and directors as a group (5 persons) |
1,221,933 | (4) | 122,193 | 1.16 | % | * | ||||||||||
| Palo Alto Investors, LLC 470 University Avenue Palo Alto, California 94301 |
14,751,350 | (5) | 1,475,135 | 14.00 | % | 7.55 | % | |||||||||
| Sprott Asset Management 200 Bay Street, Suite 2700 Box 27 Toronto, Ontario M5J 2J1 |
5,577,700 | (6) | 557,770 | 5.29 | % | 2.85 | % | |||||||||
| Cambrian Capital L.P. 45 Coolidge Point Manchester, Massachusetts 01944 |
19,393,939 | (7) | 1,939,394 | 18.40 | % | 9.93 | % | |||||||||
| * | Less than 1%. |
| (1) | All 466,667 shares of common stock are underlying options that are currently exercisable or exercisable within 60 days. |
| (2) | All 316,667 shares of common stock are underlying options that are currently exercisable or exercisable within 60 days. |
| (3) | All 150,000 shares of common stock are underlying options that are currently exercisable or exercisable within 60 days. |
67
Table of Contents
Index to Financial Statements
| (4) | Includes 933,334 shares of common stock underlying options that are currently exercisable or exercisable within 60 days. |
| (5) | As reported pursuant to a Schedule 13G/A filed with the SEC on June 9, 2010. Palo Alto Investors, LLC is a registered investment adviser and general partner of Palo Alto Global Energy Liquidating Fund, L.P., who in the aggregate, owns 4,995,446 shares of our common stock. Palo Alto Investors, Inc. is the manager of Palo Alto Investors, LLC. William L. Edwards is the controlling shareholder and President of Palo Alto Investors, Inc. Each of Mr. Edwards, Palo Alto Investors, Inc. and Palo Alto Investors, LLC disclaims beneficial ownership of the common stock except to the extent of that person’s pecuniary interest therein and each disclaims that it is, the beneficial owner, as defined in Rule 13d-3 under the Exchange Act, of any of the common stock. |
| (6) | As reported pursuant to a Schedule 13G/A filed with the SEC on July 8, 2010. Kirstin McTaggart, the Chief Compliance Officer of Sprott Asset Management, has voting and dispositive power over the shares held by Sprott Asset Management. Ms. McTaggart disclaims beneficial ownership of the common stock. |
| (7) | As reported pursuant to a Schedule 13G filed with the SEC on March 22, 2010. Cambrian Capital L.P. serves as the investment manager to CamCap Energy Offshore Master Fund, L.P., which owns 12,121,212 shares of our common stock, and CamCap Resources Offshore Master Fund, L.P., which owns 7,272,727 shares of our common stock. CamCap Resources Partners, LLC serves as general partner of CamCap Resources Offshore Master Fund, L.P. CamCap Energy Partners, LLC serves as general partner of CamCap Energy Offshore Master Fund, L.P. Cambrian Capital, LLC is the general partner of Cambrian Capital L.P. Ernst von Metzsch and Roland von Metzsch are the managers of each of Cambrian Capital, LLC, CamCap Resources Partners, LLC and CamCap Energy Partners, LLC, and in such capacities may be deemed to have voting and investment control over the shares for such entities. Each of the reporting persons disclaims beneficial ownership of all shares except to the extent of its pecuniary interest therein. |
68
Table of Contents
Index to Financial Statements
CERTAIN RELATIONSHIPS AND RELATED PARTY TRANSACTIONS
There have been no transactions, or proposed transactions, which have materially affected or will materially affect us in which any director, executive officer or beneficial holder of more than 5% of the outstanding common stock, or any of their respective relatives, spouses, associates or affiliates, has had or will have any direct or material indirect interest. Related party transactions are subject to review and oversight by our audit committee.
69
Table of Contents
Index to Financial Statements
The following summary of our capital stock is subject in all respects to the applicable provisions of the Nevada General Corporation Law, or the NGCL, our articles of incorporation, as amended, or our “articles of incorporation” and bylaws, as amended and restated, or our “bylaws,” which will go into effect simultaneously with the reverse stock split.
General
After the amendment to the articles of incorporation reducing the number of authorized shares of common stock, we will be authorized to issue up to 70,000,000 shares of common stock, with a par value of $0.00001. As of the date of this prospectus, there are 10,539,084 shares of our common stock outstanding, after giving effect to the reverse stock split. We are not authorized to issue any shares of preferred stock.
Common Stock
Voting Rights
Holders of our common stock are entitled to one vote per share on all matters to be voted upon by the stockholders. The affirmative vote of a plurality of the votes cast at the meeting of the stockholders at which there is a quorum by the holders of shares of our common stock entitled to vote in the election are required to elect each director. Other matters to be voted on by our stockholders must be approved by the affirmative vote of a majority of the shares represented at the meeting at which there is a quorum and entitled to vote on such matter (which shares voting affirmatively also constitute at least a majority of the required quorum), unless the vote of a greater number or voting by classes is required by applicable law, our articles of incorporation or our bylaws. On any matter other than the election of directors, any stockholder may vote part of the shares in favor of or in opposition to the proposal and refrain from voting the remaining shares. However, if the stockholder fails to specify the number of shares which the stockholder is voting, it will be conclusively presumed that the stockholder’s vote is with respect to all shares that the stockholder is entitled to vote. Holders of our common stock will not have the right to cumulate votes in elections of directors.
Liquidation Rights
Upon our liquidation, dissolution and winding up, the holders of our common stock are entitled to share ratably in our assets which are legally available for distribution after payment of all debts and other liabilities.
Dividend Rights
Holders of our common stock are entitled to receive ratably such dividends, if any, as may be declared by the Board.
Preemptive Rights
The common stock has no preemptive or conversion rights or other subscription rights. In connection with the August Private Placements, we have entered into subscription and registration rights agreements that give certain accredited investors an option to purchase shares of our common stock in connection with and on the same terms as any registered public offering in a pro rata proportion to such accredited investor’s fully diluted shares of common stock. Such accredited investors may be able to participate in this offering to the extent of such option.
No Redemption Rights, Conversion Rights or Sinking Fund
There are no redemption, conversion or sinking fund provisions applicable to the common stock.
70
Table of Contents
Index to Financial Statements
Registration Rights
In connection with the August Private Placement, we entered into subscription and registration rights agreements with certain accredited investors. Under the subscription and registration rights agreements, subject to certain restrictions and limitations, we agreed to permit the accredited investors to include their shares purchased in the private placement in any registration statement we file with the SEC to register common stock for our account or for the account of any other stockholder (other than on Forms S-4 or S-8) within 6 months of the closing of the private placement. Such restrictions and limitations include the right of the underwriters of a public offering to limit the number of shares included in the registration statement.
Stockholder Action; Special Meetings
Our bylaws provide that stockholders’ action can only be taken at an annual or special meeting of stockholders except that stockholder action by written consent can be taken if the consent is signed by the holders of outstanding shares having not less than the minimum number of votes that would be necessary to authorize or take such action at a meeting at which all shares entitled to vote thereon were present and voted. Our bylaws provide that, except as otherwise required by law or our articles of incorporation, special meetings of the stockholders may be called at any time by our president or by a majority of the Board.
Number of Directors; Removal; Vacancies
Our bylaws currently specify that the number of directors shall be at least one and no more than 13 persons, unless otherwise determined by a vote of the majority of the Board. Our Board currently consists of five persons.
Pursuant to our bylaws and the Nevada Revised Statutes, or the NRS, each director serves until the next annual meeting and until his or her successor has been elected and qualified or his or her removal or resignation, and directors may be removed from office by the vote of stockholders representing not less than two-thirds of the voting power of the issued and outstanding stock entitled to vote.
Our bylaws further provide that vacancies resulting from newly created directorships in our Board may be filled by a majority of our Board, even if less than a quorum is present, or by a sole remaining director. Any director so chosen will hold office until his or her successor has been elected at an annual or special meeting of stockholders and has been qualified, or his or her removal or resignation.
Anti-Takeover Effects of Certain Provisions of Nevada Law
We are subject to the anti-takeover law of the NRS, commonly known as the Business Combinations Act. This law provides that specified persons who, together with affiliates and associates, own, or within three years did own, 10% or more of the outstanding voting stock of a corporation cannot engage in specified business combinations with the corporation for a period of three years after the date on which the person became an interested stockholder. The law defines the term “business combination” to encompass a wide variety of transactions with or caused by an interested stockholder, including mergers, asset sales and other transactions in which the interested stockholder receives or could receive a benefit on other than a pro rata basis with other stockholders. This provision has an anti-takeover effect for transactions not approved in advance by our Board, including discouraging takeover attempts that might result in a premium over the market price for the shares of our common stock.
We have opted out of the Acquisition of Controlling Interest Statutory Provisions of the NRS.
Amendment of Bylaws
Our bylaws may be amended by (i) a majority of all the stock issued and outstanding and entitled to vote at an annual or special meeting of stockholders or (ii) a majority of the Board.
71
Table of Contents
Index to Financial Statements
Transfer Agent and Registrar
The transfer agent and registrar for the common stock in the United States is Continental Stock Transfer & Trust Company, 17 Battery Place, New York, New York 10004 and in Canada is Olympia Trust Company, 2300, 125—9 Avenue SE Calgary, Alberta T2G0P6.
Listing
We have received conditional approval to list our common stock on AMEX under the symbol “TPLM.” Such listing is conditioned upon completion of the reverse stock split. Our common stock is currently quoted on the OTC Bulletin Board under the symbol “TPLM” and the TSX Venture Exchange under the symbol “TPE.” In order to meet the requirements of the TSX Venture Exchange with respect to the reverse stock split, our common stock will be quoted under a new symbol after the reverse stock split.
72
Table of Contents
Index to Financial Statements
We are offering the shares of common stock described in this prospectus through the underwriters named below. Johnson Rice & Company L.L.C. is acting as sole book-running manager of the offering and as representative of the underwriters named below. Subject to the terms and conditions of the underwriting agreement between us and the representative, we have agreed to sell to the underwriters, and each underwriter has severally agreed to purchase, at the public offering price less the underwriting discounts and commissions set forth on the cover page of this prospectus, the number of shares of common stock listed next to its name in the following table:
| Underwriters |
Number of Shares |
|||
| Johnson Rice & Company L.L.C. |
||||
| Canaccord Genuity Inc. |
||||
| Rodman & Renshaw, LLC |
||||
| Total |
9,000,000 | |||
The underwriting agreement provides that the underwriters’ obligation to purchase our common stock is subject to approval of legal matters by counsel and the satisfaction of the conditions contained in the underwriting agreement. The conditions contained in the underwriting agreement include the conditions that the representations and warranties made by us to the underwriters are true, that there has been no material adverse change to our condition or in the financial markets and that we deliver to the underwriters customary closing documents. The underwriters are obligated to purchase all of the shares of common stock (other than those covered by the over-allotment option described below) if they purchase any of the shares of common stock.
Option to Purchase Additional Common Shares
We have granted to the underwriters an option, exercisable for 30 days from the date of this prospectus, to purchase up to 1,350,000 additional shares of common stock at the public offering price per share less the underwriting discount shown on the cover page of this prospectus. The underwriters may exercise this option solely to cover over-allotments, if any, made in connection with this offering.
Underwriting Discount and Expenses
The underwriters propose to offer the common stock to the public at the public offering price set forth on the cover of this prospectus. The underwriters may offer the common stock to securities dealers at the price to the public less a concession not in excess of $ per ordinary share. After the common stock is released for sale to the public, the underwriters may vary the offering price and other selling terms from time to time.
The following table summarizes the compensation to be paid to the underwriters by us:
| Total | ||||||
| Per share | Without over-allotment |
With over-allotment | ||||
| Public offering price |
$ | $ | $ | |||
| Underwriting discounts and commissions to be paid by us |
$ | $ | $ | |||
| Proceeds, before expenses, to us |
$ | $ | $ | |||
We estimate our expenses associated with the offering, excluding underwriting discounts and commissions, will be approximately $ .
Indemnification
We have agreed to indemnify the underwriters against certain liabilities, including liabilities under the U.S. federal securities laws, or to contribute to payments that may be required to be made in respect of these liabilities.
73
Table of Contents
Index to Financial Statements
Lock-Up Agreements
We and our officers and directors have agreed that, for a period of 120 days from the date of this prospectus, we and they will not, without the prior written consent of Johnson Rice & Company L.L.C., directly or indirectly, offer, pledge, sell, contract to sell, sell any option or contract to purchase, purchase any option or contract to sell, grant any option, right or warrant to purchase, or otherwise transfer or dispose of any common stock or any securities convertible into or exercisable or exchangeable for common stock, or file any registration statement under the Securities Act with respect to any of the foregoing or enter into any swap or any other agreement or transaction that transfers, in whole or in part, directly or indirectly, the economic consequence of ownership of the common stock, except for the sale to the underwriters in this offering, the issuance by us of any securities or options to purchase common stock under existing, amended or new employee benefit plans maintained by us, the filing of or amendment to any registration statement related to the foregoing, the filing by us of a registration statement to register the resale of shares issued in the August Private Placement and shares issued in accordance with the agreement entered into in connection with the Williston Purchase, the issuance by us of securities in exchange for or upon conversion of our outstanding securities described herein or certain transfers in the case of officers or directors in the form of bona fide gifts, intra family transfers and transfers related to estate planning matters. Notwithstanding the foregoing, if (1) during the last 17 days of such 120-day restricted period we issue an earnings release or (2) prior to the expiration of such 120-day restricted period we announce that we will release earnings results during the 16-day period beginning on the last day of the 120-day restricted period, the foregoing restrictions shall continue to apply until the expiration of the 18-day period beginning on the issuance of the earnings release; provided, however, that this sentence will not apply if, as of the expiration of the restricted period, our common stock is an “actively-traded security” as defined in Regulation M. Johnson Rice & Company L.L.C. has advised us that it does not have any present intent to release the lock-up agreements prior to the expiration of the applicable restricted period.
Price Stabilization, Short Positions and Penalty Bids; Passive Market Making
The underwriters may engage in over-allotment, stabilizing transactions, syndicate covering transactions, penalty bids and passive market making in accordance with Regulation M under the Exchange Act. Over-allotment involves syndicate sales in excess of the offering size, which creates a syndicate short position. Covered short sales are sales made in an amount not greater than the number of shares available for purchase by the underwriters under its over-allotment option. The underwriters may close out a covered short sale by exercising its over-allotment option or purchasing shares in the open market. Naked short sales are sales made in an amount in excess of the number of shares available under the over-allotment option. The underwriters must close out any naked short sale by purchasing shares in the open market. Stabilizing transactions permit bids to purchase the underlying security so long as the stabilizing bids do not exceed a specified maximum. Syndicate covering transactions involve purchases of shares of common stock in the open market after the distribution has been completed in order to cover syndicate short positions. Penalty bids permit the underwriters to reclaim a selling concession from a syndicate member when the shares of common stock originally sold by such syndicate member is purchased in a syndicate covering transaction to cover syndicate short positions. Penalty bids may have the effect of deterring syndicate members from selling to people who have a history of quickly selling their shares. In passive market making, market makers in our common stock who are underwriters or prospective underwriters may, subject to certain limitations, make bids for or purchases of the common stock until the time, if any, at which a stabilizing bid is made. These stabilizing transactions, syndicate covering transactions and penalty bids may cause the price of our common stock to be higher than it would otherwise be in the absence of these transactions. In connection with this offering, the underwriters may engage in passive market making transactions in the shares of common stock in accordance with Rule 103 of Regulation M under the Exchange Act during the period before the commencement of offers or sales of common stock and extending through the completion of distribution. A passive market maker must display its bids at a price not in excess of the highest independent bid of the security. However, if all independent bids are lowered below the passive market maker’s bid that bid must be lowered when specified purchase limits are exceeded.
74
Table of Contents
Index to Financial Statements
The underwriters are not required to engage in these activities, and may end any of these activities at any time.
Electronic Distribution
This prospectus in electronic format may be made available on the websites maintained by one or more of the underwriters. The underwriters may agree to allocate a number of shares of common stock for sale to their online brokerage account holders. The common stock will be allocated to underwriters that may make Internet distributions on the same basis as other allocations. In addition, common stock may be sold by the underwriters to securities dealers who resell common stock to online brokerage account holders.
Other than this prospectus in electronic format, information contained in any website maintained by an underwriter is not part of this prospectus or registration statement of which the prospectus forms a part, has not been endorsed by us and should not be relied on by investors in deciding whether to purchase common stock. The underwriters are not responsible for information contained in websites that they do not maintain.
Relationship with the Underwriters
From time to time, the underwriters have provided, and may continue to provide, investment banking services to us in the ordinary course of their businesses, and have received, and may continue to receive, compensation for such services.
75
Table of Contents
Index to Financial Statements
The validity of our common stock offered by this prospectus will be passed upon for us by Jones Vargas, Chartered, Las Vegas, Nevada. Certain legal matters will be passed upon for us by Skadden, Arps, Slate, Meagher & Flom LLP, New York, New York. Certain Canadian legal matters will be passed upon by Blake, Cassels & Graydon LLP, Toronto, Ontario, Canada. Certain legal matters with respect to this offering will be passed upon for the underwriters by Porter & Hedges LLP, Houston, Texas. Certain Canadian legal matters will be passed upon for the underwriters by Bennett Jones LLP.
The consolidated financial statements of Triangle Petroleum Corporation as of January 31, 2010 and 2009, and for each of the years in the two-year period ended January 31, 2010, have been included herein and in the registration statement in reliance upon the report of KPMG LLP, independent registered public accounting firm, appearing elsewhere herein, and upon their authority of said firm as experts in accounting and auditing.
WHERE YOU CAN FIND MORE INFORMATION
This prospectus is part of a registration statement we filed with the SEC. This prospectus does not contain all of the information contained in the registration statement and all of the exhibits and schedules thereto. For further information about us, please see the complete registration statement. Please refer to the exhibits to the registration statement for complete copies of certain of the agreements or other documents that are summarized in this prospectus.
We file annual, quarterly and special reports, proxy statements and other information with the SEC under the Exchange Act. You may read and copy the registration statement, including exhibits and schedules filed with it, at the SEC’s public reference facilities at 100 F Street, N.E., Room 1580, Washington, D.C. 20549. You may obtain information on the operation of the public reference room in Washington, D.C. by calling the SEC at 1-800-SEC-0330.
We file information electronically with the SEC. Our SEC filings also are available from the SEC’s Internet site at http://www.sec.gov, which contains reports, proxy and information statements and other information regarding issuers that file electronically.
76
Table of Contents
Index to Financial Statements
TRIANGLE PETROLEUM CORPORATION
F-1
Table of Contents
Index to Financial Statements
Report of Independent Registered Public Accounting Firm
The Board of Directors and Stockholders
Triangle Petroleum Corporation
We have audited the accompanying consolidated balance sheets of Triangle Petroleum Corporation and its subsidiaries as of January 31, 2010 and 2009, and the related consolidated statements of operations, stockholders’ equity, and cash flows for the years then ended. These consolidated financial statements are the responsibility of the Company’s management. Our responsibility is to express an opinion on these consolidated financial statements based on our audits.
We conducted our audits in accordance with the standards of the Public Company Accounting Oversight Board (United States). Those standards require that we plan and perform the audit to obtain reasonable assurance about whether the financial statements are free of material misstatement. An audit includes examining, on a test basis, evidence supporting the amounts and disclosures in the financial statements. An audit also includes assessing the accounting principles used and significant estimates made by management, as well as evaluating the overall financial statement presentation. We believe that our audit provides a reasonable basis for our opinion.
In our opinion the consolidated financial statements referred to above present fairly, in all material respects, the financial position of the Company and its subsidiaries as of January 31, 2010 and 2009, and the results of its operations and its cash flows for the years then ended, in conformity with U.S. generally accepted accounting principles.
/s/ KPMG LLP
Calgary, Canada
April 8, 2010, except for note 14 which is as of October 25, 2010
F-2
Table of Contents
Index to Financial Statements
Triangle Petroleum Corporation
Consolidated Balance Sheets as of January 31, 2010 and 2009
(Expressed in U.S. dollars)
| January 31, 2010 $ |
January 31, 2009 $ |
|||||
| ASSETS |
||||||
| Current Assets |
||||||
| Cash |
4,878,601 | 8,449,471 | ||||
| Prepaid expenses |
342,635 | 339,839 | ||||
| Other receivables |
313,785 | 998,511 | ||||
| Total Current Assets |
5,535,021 | 9,787,821 | ||||
| Property and Equipment (Note 3) |
39,296 | 39,765 | ||||
| Oil and Gas Properties (Note 4) |
18,783,375 | 16,942,864 | ||||
| Total Assets |
24,357,692 | 26,770,450 | ||||
| LIABILITIES AND STOCKHOLDERS’ EQUITY |
||||||
| Current Liabilities |
||||||
| Accounts payable |
574,723 | 2,123,079 | ||||
| Accrued liabilities |
119,224 | 90,539 | ||||
| Total Current Liabilities |
693,947 | 2,213,618 | ||||
| Asset Retirement Obligations (Note 6) |
1,180,515 | 727,862 | ||||
| Total Liabilities |
1,874,462 | 2,941,480 | ||||
| Commitments (Note 12) |
||||||
| Subsequent Events (Note 14) |
||||||
| Stockholders’ Equity |
||||||
| Common Stock (Note 9) |
||||||
| Authorized: 150,000,000 shares, par value $0.00001 |
699 | 699 | ||||
| Additional Paid-In Capital (Note 9) |
81,950,076 | 81,155,715 | ||||
| Warrants (Note 10) |
4,237,100 | 4,237,100 | ||||
| Deficit |
(63,704,645 | ) | (61,564,544 | ) | ||
| Total Stockholders’ Equity |
22,483,230 | 23,828,970 | ||||
| Total Liabilities and Stockholders’ Equity |
24,357,692 | 26,770,450 | ||||
The accompanying notes are an integral part of these consolidated financial statements.
F-3
Table of Contents
Index to Financial Statements
Triangle Petroleum Corporation
Consolidated Statements of Operations
(Expressed in U.S. dollars)
| Year
Ended January 31, 2010 $ |
Year
Ended January 31, 2009 $ |
|||||||
| Revenue, net of royalties |
131,245 | 386,892 | ||||||
| Operating Expenses |
||||||||
| Oil and gas production |
95,852 | 125,777 | ||||||
| Depletion and accretion |
188,788 | 200,050 | ||||||
| Depreciation—property and equipment |
26,198 | 39,448 | ||||||
| General and administrative |
3,987,012 | 4,045,906 | ||||||
| Foreign exchange (gain) loss |
(753,950 | ) | 2,682,873 | |||||
| Gain on sale of assets (Note 4) |
(1,266,294 | ) | (126,314 | ) | ||||
| Ceiling test write-down on oil and gas properties (Note 4) |
— | 8,308,229 | ||||||
| Total Operating Expenses |
2,277,606 | 15,275,969 | ||||||
| Loss from Operations |
(2,146,361 | ) | (14,889,077 | ) | ||||
| Other Income (Expense) |
||||||||
| Accretion of discounts on convertible debentures (note 7) |
— | (2,922,909 | ) | |||||
| Amortization of debt issue costs |
— | (182,637 | ) | |||||
| Interest expense |
— | (753,004 | ) | |||||
| Gain on debt extinguishment (Note 7) |
— | 3,922,713 | ||||||
| Interest and royalty income |
6,260 | 260,840 | ||||||
| Unrealized gain on fair value of derivatives (Note 8) |
— | 793,589 | ||||||
| Total Other Income |
6,260 | 1,118,592 | ||||||
| Loss for the Year |
(2,140,101 | ) | (13,770,485 | ) | ||||
| Loss Per Share—Basic and Diluted |
(0.03 | ) | (0.23 | ) | ||||
| Weighted Average Number of Shares Outstanding—Basic and Diluted |
69,926,043 | 61,113,000 | ||||||
The accompanying notes are an integral part of these consolidated financial statements.
F-4
Table of Contents
Index to Financial Statements
Triangle Petroleum Corporation
Consolidated Statements of Cash Flows for each of the years ended January 31, 2010 and 2009
(Expressed in U.S. dollars)
| Year
Ended January 31, 2010 $ |
Year
Ended January 31, 2009 $ |
|||||||
| Operating Activities |
||||||||
| Loss for the year |
(2,140,101 | ) | (13,770,485 | ) | ||||
| Adjustments to reconcile net loss to net cash provided by (used in) operating activities: |
||||||||
| Accretion of discounts on convertible debentures (Note 7) |
— | 2,922,909 | ||||||
| Amortization of debt issue costs |
— | 182,637 | ||||||
| Depletion and accretion |
188,788 | 200,050 | ||||||
| Depreciation—property and equipment |
26,198 | 39,448 | ||||||
| Ceiling test write-down on oil and gas properties (Note 4) |
— | 8,308,229 | ||||||
| Stock-based compensation (Note 11) |
794,361 | 598,182 | ||||||
| Gain on sale of assets (Note 4) |
(1,266,294 | ) | (126,314 | ) | ||||
| Gain on debt extinguishments (Note 7) |
— | (3,922,713 | ) | |||||
| Unrealized gain on fair value of derivatives (Note 8) |
— | (793,589 | ) | |||||
| Foreign exchange changes |
(766,200 | ) | 3,183,463 | |||||
| Asset retirement costs (Note 6) |
(23,956 | ) | (743,338 | ) | ||||
| Changes in operating assets and liabilities |
||||||||
| Foreign exchange changes |
(8,652 | ) | (70,443 | ) | ||||
| Prepaid expenses |
(22,146 | ) | 129,982 | |||||
| Other receivables |
706,517 | 691,648 | ||||||
| Accounts payable |
364,383 | (134,401 | ) | |||||
| Accrued interest on convertible debentures |
— | (546,302 | ) | |||||
| Accrued liabilities |
47,162 | (47,058 | ) | |||||
| Net Cash Used in Operating Activities |
(2,099,940 | ) | (3,898,095 | ) | ||||
| Investing Activities |
||||||||
| Purchase of property and equipment |
(25,729 | ) | (13,090 | ) | ||||
| Oil and gas property expenditures |
(3,033,254 | ) | (6,065,289 | ) | ||||
| Cash advanced on behalf of partners for oil and gas property expenditures |
(677,842 | ) | 677,842 | |||||
| Proceeds received from sale of oil and gas properties (Note 4) |
1,544,460 | 4,210,306 | ||||||
| Net Cash Used in Investing Activities |
(2,192,365 | ) | (1,190,231 | ) | ||||
| Financing Activities |
||||||||
| Proceeds from issuance of common stock (Note 9) |
— | 25,560,500 | ||||||
| Common stock issuance costs (Note 9) |
— | (2,257,959 | ) | |||||
| Convertible debenture repayment (Note 7) |
— | (11,300,000 | ) | |||||
| Net Cash Provided by Financing Activities |
— | 12,002,541 | ||||||
| Foreign exchange change on cash |
721,435 | (3,046,333 | ) | |||||
| Increase (Decrease) in Cash |
(3,570,870 | ) | 3,867,882 | |||||
| Cash—Beginning of Year |
8,449,471 | 4,581,589 | ||||||
| Cash—End of Year |
4,878,601 | 8,449,471 | ||||||
| Non-cash Investing and Financing Activities |
||||||||
| Common stock issued for conversion of debentures (Note 9) |
— | 2,600,140 | ||||||
| Supplemental Disclosures: |
||||||||
| Interest paid (Note 7) |
— | 1,299,860 | ||||||
The accompanying notes are an integral part of these consolidated financial statements.
F-5
Table of Contents
Index to Financial Statements
Triangle Petroleum Corporation
Consolidated Statement of Stockholders’ Equity for each of the years ended January 31, 2010 and 2009
(Expressed in U.S. dollars)
| Common Stock | Additional Paid-in Capital $ |
Warrants $ |
Deficit $ |
Total $ |
|||||||||||
| Shares # |
Amount $ |
||||||||||||||
| Balance—January 31, 2008 |
46,794,530 | 468 | 57,852,277 | — | (47,794,059 | ) | 10,058,686 | ||||||||
| Issuance of common stock and warrants for cash pursuant to private placement at $1.40 per unit in June 2008 (Notes 9 and 10) |
18,257,500 | 182 | 21,323,218 | 4,237,100 | — | 25,560,500 | |||||||||
| Share issuance costs (Note 9) |
— | — | (2,257,959 | ) | — | (2,257,959 | ) | ||||||||
| Issuance of common stock on conversion of convertible debentures at a weighted average price of $0.53 per share (Note 9) |
4,874,013 | 49 | 2,600,091 | — | — | 2,600,140 | |||||||||
| Fair value of conversion features of convertible debentures converted (Note 9) |
— | — | 1,039,906 | — | — | 1,039,906 | |||||||||
| Stock based compensation (Note 11) |
— | — | 598,182 | — | — | 598,182 | |||||||||
| Net loss for the year |
— | — | — | — | (13,770,485 | ) | (13,770,485 | ) | |||||||
| Balance—January 31, 2009 |
69,926,043 | 699 | 81,155,715 | 4,237,100 | (61,564,544 | ) | 23,828,970 | ||||||||
| Stock based compensation (Note 11) |
— | — | 794,361 | — | — | 794,361 | |||||||||
| Net loss for the year |
— | — | — | — | (2,140,101 | ) | (2,140,101 | ) | |||||||
| Balance—January 31, 2010 |
69,926,043 | 699 | 81,950,076 | 4,237,100 | (63,704,645 | ) | 22,483,230 | ||||||||
The accompanying notes are an integral part of these consolidated financial statements.
F-6
Table of Contents
Index to Financial Statements
Triangle Petroleum Corporation
Notes to the Consolidated Financial Statements
(Expressed in U.S. dollars, except as noted)
Triangle Petroleum Corporation, together with its consolidated subsidiaries (“Triangle” or the “Company”), is an independent oil and gas company focused primarily on the acquisition, exploration and development of resource properties consisting mainly of shale gas reserves. The Company’s primary exploration and development acreage is located in the Horton Bluff formation of the Maritimes Basin in Canada. The Company also has minor producing properties in the Fort Worth Basin and in the Alberta Deep Basin.
| 1. | Nature of Operations |
The Company is primarily engaged in the acquisition, exploration and development of oil and gas resource properties and has a limited number of producing wells that generate cash flows from operations. The Company has not generated significant revenues from operations. The Company expects that significant additional exploration and development activities will be necessary to established proved reserves and to commercialize the oil and gas properties.
The Company believes that it has sufficient funds, including those raised subsequent to year end (note 14), to maintain its interest in the existing properties and to maintain core operating, exploration and development activities through to January 31, 2011. The Company monitors its expenditure budgets and adjusts its expenditure plans to conform to available funding. However, additional funding will be required to complete exploration and development activities. The Company plans to fund future exploration and development activities by offering debt or equity securities, farm-out arrangements or other means.
| 2. | Summary of Significant Accounting Policies |
| a) | Basis of Presentation |
These financial statements and related notes are presented in accordance with accounting principles generally accepted in the United States, and are expressed in U.S. dollars. These consolidated financial statements include the accounts of the Company and its two wholly-owned subsidiaries, Elmworth Energy Corporation, incorporated in the Province of Alberta, Canada, and Triangle USA Petroleum Corporation, incorporated in the State of Colorado, USA. All significant intercompany balances and transactions have been eliminated. The Company’s fiscal year-end is January 31.
The Company’s oil and gas operations are generally conducted jointly with others as such these financial statements reflect the Company’s proportionate share of these operations.
| b) | Use of Estimates |
The preparation of financial statements in conformity with U.S. generally accepted accounting principles requires management to make estimates and assumptions that affect the reported amounts of assets and liabilities and disclosure of contingent assets and liabilities at the date of the financial statements and the reported amounts of revenues and expenses during the reporting period. Actual results could differ from those estimates. The Company regularly evaluates estimates and assumptions related to the recoverability of proved and unproven oil and gas expenditures, asset retirement obligations and stock-based compensation. The Company bases its estimates and assumptions on current facts, historical experience and various other factors that it believes to be reasonable under the circumstances, the results of which form the basis for making judgments about the carrying values of assets and liabilities and the accrual of costs and expenses that are not readily apparent from other sources. The actual results experienced by the Company may differ materially and adversely from the Company’s estimates. To the extent there are material differences between the estimates and the actual results, future results of operations will be affected.
F-7
Table of Contents
Index to Financial Statements
Triangle Petroleum Corporation
Notes to the Consolidated Financial Statements—(Continued)
(Expressed in U.S. dollars, except as noted)
| c) | Foreign Currency Translation |
The Company’s functional currency is the United States dollar. Monetary assets and liabilities denominated in foreign currencies are translated into United States dollars at rates of exchange in effect at the balance sheet date and gains and losses are recorded in earnings. Non-monetary assets, liabilities and items recorded in income arising from transactions denominated in foreign currencies are translated at rates of exchange in effect at the date of the transaction. Foreign currency transactions are primarily undertaken in Canadian dollars. The Company has not, to the date of these financial statements, entered into derivative instruments to offset the impact of foreign currency fluctuations.
| d) | Cash and Cash Equivalents |
The Company considers all highly liquid instruments with maturity of three months or less at the time of acquisition to be cash equivalents.
| e) | Property and Equipment |
Property and equipment consists of computer hardware, geophysical software, furniture and equipment and leasehold improvements, and is recorded at cost. Computer hardware and geophysical software are depreciated on a straight-line basis over their estimated useful lives of three years. Furniture and equipment and leasehold improvements are depreciated on a straight-line basis over their estimated useful lives of five years.
| f) | Oil and Gas Properties |
The Company utilizes the full-cost method of accounting for petroleum and natural gas properties. Under this method, the Company capitalizes all costs associated with acquisition, exploration and development of oil and natural gas reserves, including leasehold acquisition costs, geological and geophysical expenditures, lease rentals on undeveloped properties and costs of drilling productive and non-productive wells into the full cost pool on a country by country basis. When the Company obtains proved oil and gas reserves, capitalized costs, including estimated future costs to develop the proved reserves and estimated abandonment costs, net of salvage, will be depleted on the units-of-production method using estimates of proved reserves.
The Company applies a ceiling test to the capitalized costs in the full cost pool. The ceiling test limits such costs to the estimated present value, using a ten percent discount rate, of the future net revenue from proved reserves, based on current economic and operating conditions. Specifically, the Company computes the ceiling test so that capitalized cost, less accumulated depletion and related deferred income tax, do not exceed an amount (the ceiling) equal to the sum of: (A) the present value of estimated future net revenue computed by applying prices of oil and gas reserves as prescribed by U.S. standards (with consideration of price changes only to the extent provided by contractual arrangements) to estimated future production of proved oil and gas reserves as of the date of the latest balance sheet presented, less estimated future expenditures (based on current cost) to be incurred in developing and producing the proved reserves computed using a discount factor of ten percent and assuming continuation of existing economic conditions; plus (B) the cost of property not subject to depletion; plus (C) the lower of cost or estimated fair value of the unproven properties included in the costs subject to depletion; less (D) income tax effects related to differences between the book and tax basis of the property.
For unproven properties, the Company excludes from capitalized costs subject to depletion, all costs directly associated with the acquisition and evaluation of the unproven property until it is determined whether or not proved reserves can be assigned to the property. Until such a determination is made, the Company assesses the
F-8
Table of Contents
Index to Financial Statements
Triangle Petroleum Corporation
Notes to the Consolidated Financial Statements—(Continued)
(Expressed in U.S. dollars, except as noted)
property to ascertain whether impairment has occurred. In assessing impairment the Company considers factors such as historical experience and other data such as primary lease terms of the property, average holding periods of unproven property, and geographic and geologic data. The Company adds the amount of impairment assessed to the costs that are subject to depletion and the ceiling test.
| g) | Asset Retirement Obligations |
The Company recognizes a liability for future retirement obligations associated with the Company’s oil and gas properties. The estimated fair value of the asset retirement obligation is based on the estimated cost escalated at an inflation rate and discounted at the Company’s credit adjusted risk-free rate. This liability is capitalized as part of the cost of the related asset and amortized over its useful life. The liability accretes until the Company settles the obligation.
| h) | Debt Issue Costs |
The Company recognizes debt issue costs on the balance sheet as deferred charges, and amortizes the balance over the term of the related debt using the effective interest rate method.
| i) | Revenue Recognition |
The Company recognizes oil and gas revenue when production is sold at a fixed or determinable price, persuasive evidence of an arrangement exists, delivery has occurred and title has transferred, and collectability is reasonably assured. Gas-balancing arrangements are accounted for using the sales method.
| j) | Income Taxes |
The Company follows the asset and liability method for recording deferred income taxes. Under this method, deferred taxes are recognized based on temporary differences at the balance sheet date using the enacted tax rates. The Company is required to compute tax asset benefits for net operating losses carried forward. Potential benefits of deferred income tax assets are not recognized in the accounts until realization is more likely than not. As of January 31, 2010 and 2009, the Company did not have any amounts recorded pertaining to uncertain tax positions.
The Company files federal and provincial income tax returns in Canada and federal, state and local income tax returns in the U.S., as applicable. The Company may be subject to a reassessment of federal and provincial income taxes by Canadian tax authorities for a period of three years from the date of the original notice of assessment in respect of any particular taxation year. For Canadian income tax returns, the open tax years range from 2006 to 2010. The U.S. federal statute of limitations for assessment of income tax is closed for the tax years ending on or prior to January 31, 2005. In certain circumstances, the U.S. federal statute of limitations can reach beyond the standard three year period. U.S. state statutes of limitations for income tax assessment vary from state to state. Tax authorities of Canada and U.S. have not audited any of the Company’s, or its subsidiaries’, income tax returns for the open taxation years noted above.
The Company recognizes interest and penalties related to uncertain tax positions in tax expense. During the years ended January 31, 2010 and 2009, there were no charges for interest or penalties.
| k) | Basic and Diluted Net Loss Per Share (“EPS”) |
Basic EPS is computed by dividing net loss available to common stock (numerator) by the weighted average number of shares outstanding (denominator) during the period. Diluted EPS gives effect to all dilutive
F-9
Table of Contents
Index to Financial Statements
Triangle Petroleum Corporation
Notes to the Consolidated Financial Statements—(Continued)
(Expressed in U.S. dollars, except as noted)
instruments outstanding during the period including stock options and warrants, using the treasury stock method, and convertible securities, using the if-converted method. In computing diluted EPS, the average stock price for the period is used in determining the number of shares assumed to be purchased from the exercise of stock options or warrants. Diluted EPS excludes instruments if their effect is anti-dilutive.
| l) | Financial Instruments |
The fair values of financial instruments, which include cash and cash equivalents, other receivables, accounts payable and accrued liabilities approximate their carrying values due to the relatively short time to maturity of these instruments.
| m) | Concentration of Risk |
The Company maintains its cash accounts predominately in one commercial bank located in Calgary, Alberta, Canada. The Company’s cash accounts consist of uninsured and insured business checking accounts and deposits maintained in Canadian and U.S. dollars. Financial instruments that potentially subject the Company to concentrations of credit risk consist primarily of cash in excess of insured amounts. To date, the Company has not incurred a loss relating to this concentration of credit risk.
| n) | Derivative Liabilities |
The Company records derivatives at their fair values on the date that they meet the requirements of a derivative instrument and at each subsequent balance sheet date. Any change in fair value is recorded as non-operating, non-cash income or expense at each reporting date. As at January 31, 2010, the Company has not engaged in any transactions that would be considered derivative instruments or hedging activities.
| o) | Comprehensive Loss |
As at January 31, 2010 and 2009, the Company has no items that would be included in comprehensive loss other than the net loss and, therefore, has not included a statement of comprehensive loss in the financial statements.
| p) | Stock-Based Compensation |
The Company records stock based compensation based on the estimated fair values of all share-based awards made to employees, consultants and directors. All transactions in which goods or services are received for the issuance of equity instruments are accounted for based on the fair value of the consideration received or the fair value or the equity instrument issued, whichever is the more reliable measure.
The fair value of share-based awards is estimated on the date of grant using an option-pricing model and for consultants each period until the award is vested. The Company uses the Black-Scholes option-pricing model to estimate the fair value of stock-based awards. This model is affected by the Company’s stock price as well as assumptions regarding a number of subjective variables. These subjective variables include, but are not limited to the Company’s expected stock price volatility over the term of the awards, and actual and projected employee stock option exercise behaviors. The value of the portion of the award that is ultimately expected to vest is recognized as an expense in the consolidated statement of operations over the requisite service period.
No tax benefits were attributed to stock-based compensation expense because a full valuation allowance was maintained for all net deferred tax assets.
F-10
Table of Contents
Index to Financial Statements
Triangle Petroleum Corporation
Notes to the Consolidated Financial Statements—(Continued)
(Expressed in U.S. dollars, except as noted)
| q) | Recently Adopted Accounting Pronouncements |
U.S. accounting standards setters have implemented new standards in December 2007 with respect to accounting for business combinations. These new standards require an acquirer to be identified for all business combinations and applies the same method of accounting for business combinations—the acquisition method—to all transactions. In addition, transaction costs associated with acquisitions are required to be expensed. The revised statement was effective to business combinations after February 1, 2009. No business combinations were completed in fiscal 2010. There was no impact that arose from adopting the new business combination standard.
In December 2007, new accounting standards were issued with respect to non-controlling interests in consolidated financial statements. These new standards require the Company to report non-controlling interest in subsidiaries as equity in the consolidated financial statements; and all transactions between equity and non controlling interests as equity. These new standards were effective for the Company commencing on February 1, 2009. The adoption of these standards did not affect the Company’s financial statements.
In March 2008, new accounting standards were issued with respect to disclosures about derivative instruments and hedging activities, which require disclosures about how and why an entity uses derivative instruments, how derivative instruments and related hedged items are accounted for, and how derivative instruments and related hedged items affect an entity’s financial position, financial performance and cash flows. These new standards were effective on February 1, 2009. No business combinations were completed in fiscal 2010; therefore, there was no impact that arose from adopting the new business combination standard.
In May 2009, new accounting standards were issued with respect to subsequent events, which are intended to establish general standards of accounting for and disclosure of events that occur after the balance sheet date but before financial statements are issued or are available to be issued. In particular, these standards set forth the period after the balance sheet date during which management of a reporting entity should evaluate events or transactions that may occur for potential recognition or disclosure in the financial statements; the circumstances under which an entity should recognize events or transactions occurring after the balance sheet date in its financial statements; and the disclosures that an entity should make about events or transactions that occurred after the balance sheet date. These standards are effective for interim and annual periods ending after June 15, 2009. The adoption of this standard did not significantly impact the disclosures in the Company’s financial statements.
The Securities and Exchange Commission adopted major revisions to its required oil and gas reporting disclosures which became effective as of December 31, 2009. Among other things, the amendments provide for the use of the 12-month average price, calculated as the unweighted arithmetic average of the first-day-of-the-month price for each month within the 12-month period prior to the end of the reporting period for purposes of both the disclosure and full-cost accounting rules. These amendments did not have a significant impact on the Company’s financial statements.
F-11
Table of Contents
Index to Financial Statements
Triangle Petroleum Corporation
Notes to the Consolidated Financial Statements—(Continued)
(Expressed in U.S. dollars, except as noted)
| 3. | Property and Equipment |
| January 31, 2010 | January 31, 2009 | |||||||||||
| Cost $ |
Accumulated Depreciation $ |
Net Carrying Value $ |
Cost $ |
Accumulated Depreciation $ |
Net Carrying Value $ | |||||||
| Computer hardware |
81,280 | 73,805 | 7,475 | 80,748 | 65,706 | 15,042 | ||||||
| Furniture and equipment |
50,398 | 38,296 | 12,102 | 49,674 | 28,289 | 21,385 | ||||||
| Computer software |
37,010 | 17,291 | 19,719 | 12,537 | 9,199 | 3,338 | ||||||
| Leasehold Improvements |
7,927 | 7,927 | — | 7,927 | 7,927 | — | ||||||
| 176,615 | 137,319 | 39,296 | 150,886 | 111,121 | 39,765 | |||||||
| 4. | Oil and Gas Properties |
All of the Company’s oil and gas properties are located in the United States and Canada. The following table summarizes information regarding the Company’s oil and gas acquisition, exploration and development activities:
| January 31, 2010 | January 31, 2009 | |||||||||||||||||
| Canada $ |
US $ |
Total $ |
Canada $ |
US $ |
Total $ |
|||||||||||||
| Proved Properties: |
||||||||||||||||||
| Opening net costs |
72,869 | — | 72,869 | 324,162 | 89,747 | 413,909 | ||||||||||||
| Additions |
2,207 | 14,454 | 16,661 | 13,984 | 40,450 | 54,434 | ||||||||||||
| Depletion |
(24,327 | ) | (14,454 | ) | (38,781 | ) | (86,825 | ) | (5,922 | ) | (92,747 | ) | ||||||
| Proceeds on dispositions |
(426,600 | ) | (1,117,860 | ) | (1,544,460 | ) | (2,943,510 | ) | (1,266,796 | ) | (4,210,306 | ) | ||||||
| Costs transferred from unproven properties |
222,917 | 4,500 | 227,417 | 3,073,287 | 9,016,207 | 12,089,494 | ||||||||||||
| Ceiling test write-downs |
— | — | — | (308,229 | ) | (8,000,000 | ) | (8,308,229 | ) | |||||||||
| Gain on sale of assets |
152,934 | 1,113,360 | 1,266,294 | — | 126,314 | 126,314 | ||||||||||||
| Closing net proved costs |
— | — | — | 72,869 | — | 72,869 | ||||||||||||
| Closing net unproven costs |
18,783,375 | — | 18,783,375 | 16,869,995 | — | 16,869,995 | ||||||||||||
| Closing Oil and Gas Properties |
18,783,375 | — | 18,783,375 | 16,942,864 | — | 16,942,864 | ||||||||||||
During the year ended January 31, 2010:
Canada:
| • | In January 2010, the Company sold its interests in an Alberta gas well and 896 gross acres of undeveloped land (108 net acres) for gross proceeds of $426,600. The net book value of the Canadian full cost pools subject to depletion at the time of the sale was $273,666. As such, the Company recorded a gain on the sale of assets of $152,934. |
United States:
| • | In June 2009, the Company sold its 25% working interest in 17,307 gross acres (4,327 net acres) of undeveloped land in the Nugget area of Colorado (Rocky Mountains project) for cash of $83,325 and recovered a drilling deposit in the Fayetteville area of Arkansas for cash of $50,000. The net book value of the U.S. properties at the time of sale was $8,704. As such, the Company recorded a gain on sale of assets of $124,621. |
F-12
Table of Contents
Index to Financial Statements
Triangle Petroleum Corporation
Notes to the Consolidated Financial Statements—(Continued)
(Expressed in U.S. dollars, except as noted)
| • | In September 2009, the Company sold its 50% working interest in 11,800 gross acres (5,900 net acres) of undeveloped land in the Fayetteville area of Arkansas and all the related seismic rights for net cash proceeds of $744,408. The acquirer also assumed the non-cash asset retirement obligations pertaining thereto of $39,375. The net book value of the U.S. properties at the time of sale was $171. As such, the Company recorded a gain on sale of assets of $783,612. |
| • | In November 2009, the Company sold its 50% working interest in its remaining 6,760 gross acres (3,880 net acres) of undeveloped land in the Fayetteville area of Arkansas for net cash proceeds of $240,127. The net book value of the U.S. properties at the time of sale was $35,000. As such, the Company recorded a gain on sale of assets of $205,127. |
During the year ended January 31, 2009:
Canada:
| • | At January 31, 2009, the Company’s proved properties in Alberta exceeded the ceiling test limit as described in Note 2(f), which resulted in a $308,229 non-cash ceiling test write-down being recognized. |
| • | In July 2008, the Company received cash of $2,943,510 for a partner’s share of its 30% working interest in exploration costs associated with the Windsor Block of Nova Scotia. |
United States:
| • | In June 2008, the Company sold its interests in a Barnett shale well for gross proceeds of $164,985. The acquirer also assumed the related asset retirement obligation of $7,545. Also in June 2008, the Company sold its 25% working interest in 38,768 gross acres (9,692 net acres) of undeveloped land in the Phat City area of Montana (Rocky Mountains project) for cash of $800,503. The net book value of the U.S. full cost pools subject to depletion at the time of the sales was $962,328. As such, the Company recorded a gain on the sale of assets of $10,705. |
| • | In September 2008, the Company sold 20 of its 10,437 net Fayetteville acres for $13,000. The net book value of the U.S. full cost pools subject to depletion at the time of the sales was $8,013,000. As such, an $8,000,000 non-cash ceiling test write-down was recognized. |
| • | In November 2008, the Company sold 240 of its 10,417 net Fayetteville acres for cash of $288,308. The net book value of the U.S. full cost pools subject to depletion at the time of the sale was $172,699. As a result, the Company recorded a gain on the sale of assets of $115,609. |
F-13
Table of Contents
Index to Financial Statements
Triangle Petroleum Corporation
Notes to the Consolidated Financial Statements—(Continued)
(Expressed in U.S. dollars, except as noted)
Unproven Properties
| Canada | U.S. | Total $ |
||||||||||||||||
| Nova Scotia $ |
New Brunswick $ |
Western Canada Shale $ |
Fayetteville $ |
Rocky Mountains $ |
||||||||||||||
| Opening, January 31, 2008 |
15,441,144 | 21,975 | — | 8,289,901 | 812,020 | 24,565,040 | ||||||||||||
| Additions |
4,320,952 | 107,802 | 51,409 | (104,202 | ) | 18,488 | 4,394,449 | |||||||||||
| Costs transferred to depletion base |
(2,943,510 | ) | (129,777 | ) | — | (8,185,699 | ) | (830,508 | ) | (12,089,494 | ) | |||||||
| Closing, January 31, 2009 |
16,818,586 | — | 51,409 | — | — | 16,869,995 | ||||||||||||
| Additions |
1,964,789 | — | 171,508 | 4,500 | — | 2,140,797 | ||||||||||||
| Costs transferred to depletion base |
— | — | (222,917 | ) | (4,500 | ) | — | (227,417 | ) | |||||||||
| Closing, January 31, 2010 |
18,783,375 | — | — | — | — | 18,783,375 | ||||||||||||
Canada
| • | In Canada, $18,783,375 (2009—$16,869,995) of unproven property costs were excluded from costs subject to depletion which relate to Canadian shale gas exploration costs mainly in the Windsor Block of the Maritimes Basin. The Company anticipates that these costs will be subject to depletion in fiscal 2013, when the Company anticipates having confirmed commerciality of the Windsor Block and pipelines are built and commissioned to market potential gas from the Windsor Block. |
| • | In July 2008, the Company received cash of $2,943,510 for a partner’s share of its 30% working interest in exploration costs associated with the Windsor Block of Nova Scotia. As such, the related costs of the properties disposed of $2,943,510 became subject to amortization in the Canadian full cost pool. |
| • | In December 2008, the Company elected to not drill a test well on the Beech Hill Block thus forfeiting its right to earn on the Block. The carrying value of these unproven property costs of $129,777 was considered impaired and became subject to amortization in the Canadian full cost pool. |
| • | In June 2009, the Company acquired an additional 30% working interest in the Windsor Block of the Maritimes Basin in Nova Scotia from Contact Exploration Inc. (“Contact”) for a cash payment of approximately $245,000. The Company also agreed to provide Contact a 5.75% non-convertible gross overriding royalty interest and assumed the liabilities related to Contact’s former working interest. |
| • | At January 31, 2010, the Western Canada Shale costs of $222,917 were considered impaired and became subject to amortization in the Canadian full cost pool. |
United States
| • | In June 2008, the Company sold its 25% working interest in 9,692 net acres in the Phat City area of Montana (Rocky Mountains project). The net book value of the Rocky Mountains project at the time of the sale was $830,508 which became subject to amortization in the U.S. full cost pool. |
| • | In September 2008, the Company sold 20 of its 10,437 net Fayetteville acres. The related unproven Fayetteville land costs of $8,013,000 became subject to amortization in the U.S. full cost pool. |
| • | In November 2008, the Company sold 240 of its 10,417 net Fayetteville acres for cash of $288,308. The related remaining unproven Fayetteville land costs $172,699 became subject to amortization in the U.S. full cost pool. |
F-14
Table of Contents
Index to Financial Statements
Triangle Petroleum Corporation
Notes to the Consolidated Financial Statements—(Continued)
(Expressed in U.S. dollars, except as noted)
| 5. | Natural gas and oil reserves (unaudited) |
The gas and oil reserve quantities owned by the Company were estimated by the independent petroleum engineering firm of Ryder Scott, Inc. at January 31, 2009. The Company did not obtain a reserve report at January 31, 2010 as the proved reserves are not material. The following table summarizes the changes in the Company’s proved natural gas and oil reserves for the years ended January 31, 2009 and 2010:
| Gas (Mmcf) | Liquids (Bbls) | Total (MMcfe) | |||||||||||||||||||||||||
| Canada | US | Total | Canada | US | Total | Canada | US | Total | |||||||||||||||||||
| Proved reserves, February 1, 2008 |
103 | 7 | 111 | 1,846 | — | 1,846 | 114 | 7 | 122 | ||||||||||||||||||
| Revisions of previous estimates |
(34 | ) | 66 | 32 | (29 | ) | 12 | (17 | ) | (34 | ) | 66 | 32 | ||||||||||||||
| Production |
(27 | ) | (17 | ) | (44 | ) | (639 | ) | (12 | ) | (651 | ) | (31 | ) | (17 | ) | (48 | ) | |||||||||
| Proved reserves, February 1, 2009 |
42 | 56 | 98 | 1,178 | — | 1,178 | 49 | 56 | 105 | ||||||||||||||||||
| Revisions of previous estimates |
(20 | ) | (38 | ) | (58 | ) | — | — | — | (20 | ) | (38 | ) | (58 | ) | ||||||||||||
| Sales of reserves |
(5 | ) | — | (5 | ) | (334 | ) | — | (334 | ) | (7 | ) | — | (7 | ) | ||||||||||||
| Production |
(17 | ) | (18 | ) | (35 | ) | (844 | ) | — | (844 | ) | (22 | ) | (18 | ) | (40 | ) | ||||||||||
| Proved reserves, February 1, 2010 |
— | — | — | — | — | — | — | — | — | ||||||||||||||||||
| Proved developed reserves: |
|||||||||||||||||||||||||||
| Beginning of year |
42 | 56 | 98 | 1,178 | — | 1,178 | 49 | 56 | 105 | ||||||||||||||||||
| End of year |
— | — | — | — | — | — | — | — | — | ||||||||||||||||||
MMcf—Millions of cubic feet Bbls—Barrels
MMcfe—Millions of cubic feet equivalent (1 Bbls = 6 Mcfe = 0.006 MMcfe)
The “Standardized Measure of Discounted Future Net Cash Flows Relating to Proved Natural Gas and Oil Reserves” (standardized measure) is a disclosure required under U.S. GAAP. The standardized measure does not purport to present the fair market value of a company’s proved gas and oil reserves. In addition, there are uncertainties inherent in estimating quantities of proved reserves.
The following table is the standardized measure relating to proved gas and oil reserves at January 31, 2010 and, 2009:
| Year Ended January 31, 2010 | Year Ended January 31, 2009 | |||||||||||||||||
| Canada | US | Total | Canada | US | Total | |||||||||||||
| Future cash inflows |
$ | — | $ | — | $ | — | $ | 257,474 | $ | 331,049 | $ | 588,523 | ||||||
| Future production costs |
— | — | — | 179,509 | 236,863 | 416,372 | ||||||||||||
| Future net cash flows |
— | — | — | 77,965 | 94,186 | 172,151 | ||||||||||||
| 10% annual discount for estimated timing of cash flows |
— | — | — | 4,675 | 11,063 | 15,738 | ||||||||||||
| Standardized measure of discounted future net cash flows |
$ | — | $ | — | $ | — | $ | 73,290 | $ | 83,123 | $ | 156,413 | ||||||
Under the standardized measure at January 31, 2009, future cash inflows were estimated by applying year-end prices, adjusted for known contractual changes, to the estimated future production of year-end proved reserves. Year-end market prices used for the standardized measures above were $5.62 per Mcf for Canadian gas, $5.78 per Mcf for U.S. gas and $30.52 per barrel for liquids in 2009. Future cash inflows were reduced by estimated future production and development costs based on year-end costs to determine pre-tax cash inflows. Future income taxes were computed by applying the year-end statutory rate, after consideration of permanent
F-15
Table of Contents
Index to Financial Statements
Triangle Petroleum Corporation
Notes to the Consolidated Financial Statements—(Continued)
(Expressed in U.S. dollars, except as noted)
differences, to the excess of pre-tax cash inflows over the Company’s tax basis in the associated proved gas and oil properties. Future net cash inflows after income taxes were discounted using a 10% annual discount rate to arrive at the standardized measure.
The Company had three producing wells at the end of 2010 that were not assigned any proved reserves. The following table is an analysis of changes in the standardized measure during the year ended January 31, 2010 and 2009:
| Canada | US | Total | ||||||||||
| Standardized measure, January 31, 2008 |
$ | 329,979 | $ | 16,711 | $ | 346,690 | ||||||
| Sales and transfers of gas and oil produced, net of production costs |
(185,499 | ) | (75,617 | ) | (261,116 | ) | ||||||
| Accretion of discount |
32,998 | 1,671 | 34,669 | |||||||||
| Other |
(104,188 | ) | 140,358 | 36,170 | ||||||||
| Standardized measure, January 31, 2009 |
73,290 | 83,123 | 156,413 | |||||||||
| Sales and transfers of gas and oil produced, net of production costs |
(21,270 | ) | (14,123 | ) | (35,393 | ) | ||||||
| Accretion of discount |
7,329 | 8,312 | 15,641 | |||||||||
| Other |
(59,349 | ) | (77,312 | ) | (136,661 | ) | ||||||
| Standardized measure, January 31, 2010 |
$ | — | $ | — | $ | — | ||||||
| 6. | Asset Retirement Obligations |
A reconciliation of the changes in the asset retirement obligations is as follows:
| January 31, 2010 $ |
January 31, 2009 $ |
|||||
| Balance, beginning of year |
727,862 | 1,003,353 | ||||
| Liabilities incurred |
357,807 | 548,312 | ||||
| Liabilities settled as part of disposition |
(31,205 | ) | (187,768 | ) | ||
| Liabilities settled in cash |
(23,956 | ) | (743,338 | ) | ||
| Accretion |
150,007 | 107,303 | ||||
| Total asset retirement obligations |
1,180,515 | 727,862 |
The asset retirement obligations were estimated based on a discount rate of 15%-30%, an inflation rate of 2.5%-3.3% and settlement from 1 to 24 years. The total cost estimate prior to discounting was approximately $1.5 million at January 31, 2010 (2009—$1.1 million).
| 7. | Convertible Debentures |
| Agreement Date |
December 8, 2005 $ |
December 28, 2005 $ |
Total $ |
||||||
| Balance, January 31, 2008 |
4,778,271 | 6,770,721 | 11,548,992 | ||||||
| Converted |
(2,100,140 | ) | (3,500,000 | ) | (5,600,140 | ) | |||
| Accretion—expensed |
815,052 | 2,107,857 | 2,922,909 | ||||||
| Repaid |
(4,000,000 | ) | (6,500,000 | ) | (10,500,000 | ) | |||
| Accretion—settled on repayment |
506,817 | 1,121,422 | 1,628,239 | ||||||
| Balance, January 31, 2009 and 2010 |
— | — | — | ||||||
| Interest rate |
5 | % | 7.5 | % |
F-16
Table of Contents
Index to Financial Statements
Triangle Petroleum Corporation
Notes to the Consolidated Financial Statements—(Continued)
(Expressed in U.S. dollars, except as noted)
December 8, 2005 Debentures
On June 5, 2008, the Company repaid the remaining unconverted convertible debentures that were issued on December 8, 2005 of $4,000,000 plus an early redemption fee of $800,000 and accrued interest of $1,299,860. The carrying value of the debentures at the time of repayment, including the conversion feature of the debenture that was accounted for as a derivative, was $4,639,338, which is equal to the face value of $4,000,000, less unamortized discounts of $506,817 and deferred financing costs of $283,196, plus the derivative liability of $1,429,351. The Company paid $4,800,000 on settlement ($4,000,000 face value plus a 20% early redemption fee of $800,000); therefore a $160,662 loss was recorded on the extinguishment of the debenture.
December 28, 2005 Debentures
In December 2008, the Company settled the $10,000,000 December 28, 2005 convertible debentures through a reduction in the conversion price from $4.00 per share to $1.40 per share whereby $3,500,000 of the debentures were converted into 2,500,000 common shares, which had a fair value on the date of conversion of $500,000. In addition, the Company also entered into settlement agreements for the remaining debenture of $6,500,000 plus $2,204,792 in accrued interest, whereby the convertible debentures holders agreed to accept $6,500,000 in cash for the final settlement of the debentures and the accrued interest. A gain of $4,083,375 was recorded on this debt extinguishment.
| 8. | Derivative Liabilities |
The Company was required to bifurcate and separately account for the embedded conversion feature contained in the December 8, 2005 convertible debenture as a derivative. The Company was required to record the derivative at the estimated fair value on each balance sheet date with changes in fair values reflected in the statement of operations.
| Fair Value $ |
|||
| January 31, 2008 |
3,262,846 | ||
| Conversion features settled |
(1,039,906 | ) | |
| Change in fair value |
(793,589 | ) | |
| Conversion features settled on repayment |
(1,429,351 | ) | |
| January 31, 2009 and 2010 |
— |
| 9. | Common Stock |
| Shares # |
Common Stock $ |
Additional Paid-In Capital $ | ||||
| January 31, 2008 |
46,794,530 | 468 | 57,852,277 | |||
| Private Placement, net of share issuance costs of $2,257,959 (a) |
18,257,500 | 182 | 19,065,259 | |||
| Conversion of debentures (b) |
4,874,013 | 49 | 3,639,997 | |||
| Stock Based Compensation (Note 11) |
598,182 | |||||
| January 31, 2009 |
69,926,043 | 699 | 81,155,715 | |||
| Stock Based Compensation (Note 11) |
794,361 | |||||
| January 31, 2010 |
69,926,043 | 699 | 81,950,076 |
| a) | On June 3, 2008, 18,257,500 units were issued in a private placement for gross proceeds of $25,560,500. The net proceeds after deducting expenses were $23,302,541. The Company paid the placement agents of |
F-17
Table of Contents
Index to Financial Statements
Triangle Petroleum Corporation
Notes to the Consolidated Financial Statements—(Continued)
(Expressed in U.S. dollars, except as noted)
| the offering a cash fee of 7% of the gross proceeds of the offering. Each unit was priced at $1.40 per unit and consists of one share of common stock (relative fair value of $21,323,400 or $1.168 per share) and one-half share purchase warrant (relative fair value of $4,237,100 or $0.232 per unit—see Note 10). One full warrant can be exercised into one share of common stock for a period of two years at a price of $2.25 per share. Pursuant to the terms of the sale, the Company was required, on a best efforts basis, to file a registration statement with the SEC, and to cause such registration statement to be declared effective by the SEC, within 150 days after closing, to permit the public resale of the shares underlying the warrants. The registration statement was declared effective by the SEC on July 14, 2008. Also, pursuant to the terms of the sale, the Company was required, on a best efforts basis, to list the Company’s shares on the Toronto Stock Exchange (which includes the TSX Venture Exchange) on or before December 31, 2008. The Company’s shares of common stock commenced trading on the TSX Venture Exchange on December 5, 2008. |
| b) | During the year ended January 31, 2009, $2,100,140 convertible debentures that were issued December 8, 2005 were converted into 2,374,013 shares of common stock. The fair value of the conversion feature related to the converted debentures was $1,039,906, which was transferred from the derivative liability to additional paid-in capital upon conversion. Also, during the year ended January 31, 2009, $3,500,000 convertible debentures that were issued December 28, 2005 were converted into 2,500,000 shares of common stock, which had a fair value on the date of conversion of $500,000 and was recorded to additional paid-in capital. |
| 10. | Warrants |
As at January 31, 2010, the Company had 9,128,750 warrants outstanding that can be exercised into 9,128,750 shares of common stock at a price of $2.25 per share, which expire on June 3, 2010. The warrants were granted on June 3, 2008, at which time they had a relative fair value compared to the common stock issued of $4,237,100.
| 11. | Stock Options |
Effective August 5, 2005, the Company approved the 2005 Incentive Stock Plan (the “2005 Plan”) to issue up to 2,000,000 shares of common stock. Effective August 17, 2007, the Company approved the 2007 Incentive Stock Plan (the “2007 Plan”) to issue up to 2,000,000 shares of common stock. Pursuant to the 2005 Plan and 2007 Plan, stock options vest 20% upon granting and 20% every six months, and allowed for the granting of stock options at a price of not less than fair value of the stock and for a term not to exceed five years. As of January 31, 2009, there were no outstanding stock options pursuant to the 2005 Plan and 2007 Plan and, in connection with the TSX Venture Exchange listing in December 2008, the Company agreed it would not issue any more stock options under the 2005 Plan and 2007 Plan.
Effective January 28, 2009, the Company’s Board of Directors approved a Stock Option Plan (the “Rolling Plan”) whereby the number of authorized but unissued Common Shares that may be issued upon the exercise of stock options granted under the Rolling Plan at any time plus the number of Common Shares reserved for issuance under the outstanding 2005 Plan and the 2007 Plan shall not exceed 10% of the issued and outstanding Common Shares on a non-diluted basis at any time, and such aggregate number of Common Shares shall automatically increase or decrease as the number of issued and outstanding common shares change. Pursuant to the Rolling Plan, stock options become exercisable as to one-third on each of the first, second and third anniversaries of the date of the grant, and allow for the granting of stock options at a price of not less than fair value of the common shares and for a term not to exceed ten years. As at January 31, 2010, the Company had 1,292,604 stock options available for granting pursuant to the Rolling Plan.
F-18
Table of Contents
Index to Financial Statements
Triangle Petroleum Corporation
Notes to the Consolidated Financial Statements—(Continued)
(Expressed in U.S. dollars, except as noted)
The weighted average grant date fair value of the 3,050,000 (2009—3,800,000) stock options granted during the year ended January 31, 2010 was $0.10 per share (2009—$0.35 per share). No stock options were exercised during the years ended January 31, 2010 and 2009. During the year ended January 31, 2009, the Company granted, to non-executives/directors, 775,000 stock options under the Rolling Plan (“New Options”) to replace 950,000 forfeited stock options under the 2005 Plan and 2007 Plan (“Old Options”), which was treated as a modification. Under modification rules, the remaining unamortized original grant date fair value of the Old Options at modification date, along with the incremental fair value of the New Options over the Old Options at modification date, is expensed over the New Options vesting period of three years. During the year ended January 31, 2010 and 2009, the Company recorded stock-based compensation related to stock option grants of $794,361 and $598,182, respectively, as general and administrative expense.
A summary of the Company’s stock option activity is as follows:
| Options # |
Weighted Average Exercise Price $ |
Aggregate Intrinsic Value $ |
|||||
| Outstanding, January 31, 2008 |
2,580,000 | 2.54 | |||||
| Granted |
3,800,000 | 0.67 | |||||
| Cancelled |
(950,000 | ) | 2.61 | ||||
| Forfeited |
(445,000 | ) | 2.30 | ||||
| Outstanding, January 31, 2009 |
4,985,000 | 1.14 | — | ||||
| Granted |
3,050,000 | 0.14 | |||||
| Cancelled |
(50,000 | ) | 1.40 | ||||
| Forfeited |
(2,285,000 | ) | 1.35 | ||||
| Outstanding, January 31, 2010 |
5,700,000 | 0.52 | 675,357 | ||||
| Exercisable, January 31, 2010 |
1,836,667 | 1.26 | 50,267 |
A summary of the Company’s stock options outstanding is as follows:
| Exercise price $ |
Options Outstanding # |
Weighted Average Remaining Contractual Life (years) |
Options Exercisable # |
Aggregate Intrinsic Value $ | ||||
| 0.125 |
2,800,000 | 4.83 | — | 675,357 | ||||
| 0.25 (CDN$0.30) |
2,050,000 | 3.27 | 1,016,667 | — | ||||
| 1.40 |
150,000 | 3.42 | 120,000 | — | ||||
| 2.00 |
300,000 | 2.52 | 300,000 | — | ||||
| 3.23 |
400,000 | 0.78 | 400,000 | — | ||||
| Balance, end of year |
5,700,000 | 3.83 | 1,836,667 | 675,357 | ||||
F-19
Table of Contents
Index to Financial Statements
Triangle Petroleum Corporation
Notes to the Consolidated Financial Statements—(Continued)
(Expressed in U.S. dollars, except as noted)
The fair value of each option grant was estimated on the date of the grant using the Black-Scholes option pricing model with the following weighted average assumptions:
| Year Ended January 31, 2010 |
Year Ended January 31, 2009 |
|||||
| Expected dividend yield |
0 | % | 0 | % | ||
| Expected volatility |
130 | % | 104 | % | ||
| Expected life (in years) |
4.0 | 3.5 | ||||
| Risk-free interest rate |
1.60 | % | 1.71 | % |
As at January 31, 2010, there was $468,260 (2009—$1,082,880) of total unrecognized compensation costs related to non-vested share-based compensation arrangements granted under the 2005 Plan, 2007 Plan and Rolling Plan which are expected to be recognized over a weighted-average period of 2.6 years. The total fair value of shares vested during the years ended January 31, 2010 and 2009 was $676,067 and $1,079,397, respectively.
A summary of the status of the Company’s non-vested shares as of January 31, 2010, and changes during the years ended January 31, 2010 and 2009, is presented below:
| Non-vested shares |
Shares # |
Weighted-Average Grant-Date Fair Value $ | |||
| January 31, 2008 |
1,250,000 | 0.93 | |||
| Granted |
3,800,000 | 0.33 | |||
| Vested |
(1,165,000 | ) | 0.93 | ||
| Cancelled |
(290,000 | ) | 0.70 | ||
| Forfeited |
(70,000 | ) | 0.69 | ||
| January 31, 2009 |
3,525,000 | 0.31 | |||
| Granted |
3,050,000 | 0.10 | |||
| Vested |
(1,711,667 | ) | 0.39 | ||
| Cancelled |
(10,000 | ) | 0.78 | ||
| Forfeited |
(990,000 | ) | 0.28 | ||
| January 31, 2010 |
3,863,333 | 0.11 | |||
| 12. | Commitments |
The Company entered into a 10-year production lease for 474,625 gross acres on the Windsor Block in Nova Scotia, Canada on April 15, 2009. During the first five years of the lease, Triangle has agreed to continue to evaluate the Windsor Block by drilling seven wells, completing three wells previously drilled and acquiring seismic, which was estimated to cost Cdn $12.7 million gross (approximately US$11.8 million). At the end of the fifth year of the lease, areas of the block not adequately drilled or otherwise evaluated may be subject to surrender. Furthermore, at the end of the second year of the lease, a technical report is required to be provided to and assessed by the Nova Scotia government to maintain certain lands.
During the first year of the lease, the Company has agreed to perform completion operations on the three wells drilled in the prior year and acquire seismic, which was estimated to cost Cdn $2 million gross (approximately US$1.9 million). The Company posted a Cdn $200,000 (approximately US$189,000) gross
F-20
Table of Contents
Index to Financial Statements
Triangle Petroleum Corporation
Notes to the Consolidated Financial Statements—(Continued)
(Expressed in U.S. dollars, except as noted)
refundable deposit related to the first year commitment; should the Company not perform the work, a portion or all of the deposit could be forfeited. As of January 31, 2010, all three of the required well completions have been performed and the seismic has been acquired, which satisfied the first year lease requirements.
| 13. | Income Taxes |
Income tax expense differs from the amount that would result from applying the U.S federal, state and Canadian income tax rates to the loss before income taxes. The reconciliation of the provision for income taxes to the expected tax provision based on the loss for the year multiplied by the weighted average statutory tax rate of 32.37% (2009—37.52%) is as follows:
| 2010 $ |
2009 $ |
|||||
| Expected income tax benefit |
692,804 | 5,058,194 | ||||
| Stock-based compensation |
(301,857 | ) | (227,309 | ) | ||
| Non-deductible interest and accretion for convertible debentures |
— | (1,396,847 | ) | |||
| Non-taxable gain on change in fair value of derivatives |
— | 301,564 | ||||
| Non-taxable portion of gain on debt extinguishment |
— | 762,355 | ||||
| Change in tax rates |
(557,126 | ) | (680,014 | ) | ||
| Changes in valuation allowance |
1,066,015 | (3,904,783 | ) | |||
| Other |
(899,836 | ) | 86,840 | |||
| Provision for income taxes |
— | — | ||||
The significant components of the Company’s deferred tax assets and liabilities as at January 31, 2010 and 2009 are as follows:
| 2010 $ |
2009 $ |
|||||
| Deferred income tax assets |
||||||
| Resource properties |
2,697,192 | 8,659,221 | ||||
| Net losses carried forward (expire from 2023 to 2029) |
12,769,031 | 7,873,017 | ||||
| Gross deferred income tax assets |
15,466,223 | 16,532,238 | ||||
| Valuation allowance |
(15,466,223 | ) | (16,532,238 | ) | ||
| Net deferred income tax asset |
— | — | ||||
The Company has recognized a valuation allowance for the deferred income tax asset since the Company cannot be assured that it is more likely than not that such benefit will be utilized in future years. The valuation allowance is reviewed quarterly. When circumstances change and which cause a change in management’s judgment about the realizability of deferred income tax assets, the impact of the change on the valuation allowance is generally reflected in earnings.
| 14. | Subsequent Events |
In February 2010, the Company purchased 4,000 net acres in the Williston Basin of North Dakota that is prospective for the Bakken Shale from Slawson Exploration for $2,973,000.
F-21
Table of Contents
Index to Financial Statements
Triangle Petroleum Corporation
Notes to the Consolidated Financial Statements—(Continued)
(Expressed in U.S. dollars, except as noted)
In February 2010, the Company issued 2,100,000 Deferred Stock Units to employees and directors of the Company, which vest one year after issuance. Once the Deferred Stock Units vest on February 2, 2011, they will automatically be exchanged for shares of Triangle Petroleum common stock on a one-for-one basis without any action required by the holder. Also in February 2010, the Company cancelled 850,000 stock options that were granted to directors of the Company under the 2005 Plan and 2007 Plan that had exercise prices ranging from $1.40-$3.23.
In March 2010, the Company sold an aggregate of 27,993,939 shares of common stock to certain accredited investors for aggregate proceeds of $9,238,000 (net proceeds of approximately $8,500,000).
In May 2010, the Company sold the producing well at Wapiti, Alberta including 2,560 gross acres (1,001 net acres) of developed lands and 1,920 gross acres (864 net acres) of undeveloped lands for the sum of $977,000. The sale was effective April 1, 2010.
In May 2010, the Company executed a purchase and sale agreement to acquire 2,600 net acres of oil and gas properties in the Williston Basin, which includes approximately 15 boepd of production and a 30% share of associated surface facilities and assets. Total consideration of $3.2 million, will be paid in the form of future well carry, which is expected to occur in fiscal 2011.
In August 2010, the Company sold an aggregate of 2,044,187 shares of common stock to certain accredited investors for aggregate proceeds of $880,000 (net proceeds of approximately $836,000).
The Company obtained approval at its 2010 annual meeting of stockholders to grant discretionary authority to the Company’s board of directors to effect a reverse stock split. In connection with the reverse stock split, the Company obtained stockholder approval to amend its articles of incorporation to decrease the number of shares of authorized common stock from 150,000,000 to 70,000,000 shares. The Company anticipates effecting the amendment to its articles of incorporation to decrease the number of authorized shares simultaneously with the reverse stock split.
On October 5, 2010, the Company entered into a purchase and sale agreement with Williston Exploration LLC to acquire 1,700 net acres in Williams County, or the Williston Purchase. The aggregate purchase price consists of up to approximately $2.2 million in cash and up to 433,500 shares of our common stock (after giving effect to the reverse stock split). The Company expects to close on a portion of the acres in December 2010 and the remainder in February 2011.
F-22
Table of Contents
Index to Financial Statements
Triangle Petroleum Corporation
Consolidated Balance Sheets as of July 31, 2010 and January 31, 2010
(Expressed in U.S. dollars)
(Unaudited)
| July 31, 2010 $ |
January 31, 2010 $ |
|||||
| ASSETS |
||||||
| Current Assets |
||||||
| Cash and cash equivalents |
2,050,357 | 4,878,601 | ||||
| Prepaid expenses |
461,464 | 342,635 | ||||
| Other receivables |
1,913,241 | 313,785 | ||||
| Total Current Assets |
4,425,062 | 5,535,021 | ||||
| Property and Equipment |
25,432 | 39,296 | ||||
| Oil and Gas Properties (Note 3) |
27,995,018 | 18,783,375 | ||||
| Total Assets |
32,445,512 | 24,357,692 | ||||
| LIABILITIES AND STOCKHOLDERS’ EQUITY |
||||||
| Current Liabilities |
||||||
| Accounts payable |
134,803 | 574,723 | ||||
| Accrued liabilities |
111,702 | 119,224 | ||||
| Total Current Liabilities |
246,505 | 693,947 | ||||
| Asset Retirement Obligations (Note 4) |
1,297,689 | 1,180,515 | ||||
| Total Liabilities |
1,544,194 | 1,874,462 | ||||
| Subsequent Events (Note 8) |
||||||
| Stockholders’ Equity |
||||||
| Common Stock |
||||||
| Authorized: 150,000,000 shares, par value $0.00001 |
990 | 699 | ||||
| Additional Paid-In Capital |
95,370,116 | 81,950,076 | ||||
| Warrants (Note 5) |
— | 4,237,100 | ||||
| Deficit |
(64,469,788 |
) |
(63,704,645 | ) | ||
| Total Stockholders’ Equity |
30,901,318 | 22,483,230 | ||||
| Total Liabilities and Stockholders’ Equity |
32,445,512 | 24,357,692 | ||||
The accompanying notes are an integral part of these consolidated financial statements
F-23
Table of Contents
Index to Financial Statements
Triangle Petroleum Corporation
Consolidated Statements of Operations
(Expressed in U.S. dollars)
(Unaudited)
| Three Months Ended July 31, 2010 $ |
Three Months Ended July 31, 2009 $ |
Six Months Ended July 31, 2010 $ |
Six Months Ended July 31, 2009 $ |
|||||||||||||
| Revenue, net of royalties |
8,803 | 29,183 | 41,722 | |
63,087 |
| ||||||||||
| Operating Expenses |
||||||||||||||||
| Oil and gas production |
6,288 | 31,875 | 13,495 | 52,576 | ||||||||||||
| Depletion and accretion (Notes 3 and 4) |
67,316 | 50,262 | 131,795 | |
91,477 |
| ||||||||||
| Depreciation—property and equipment |
6,791 | 7,335 | 13,864 | |
11,674 |
| ||||||||||
| General and administrative |
620,179 | 719,757 | 1,171,320 | |
1,404,685 |
| ||||||||||
| Stock based compensation (Notes 6 and 7) |
362,264 | 135,543 | 483,805 | |
270,463 |
| ||||||||||
| Gain on sale of assets |
(976,900 | ) | (124,621 | ) | (976,900 | ) | (124,621 | ) | ||||||||
| Foreign exchange loss (gain) |
19,661 | (558,575 | ) | (30,141 | ) | (707,654 | ) | |||||||||
| Total Operating Expenses |
105,599 | 261,576 | 807,238 | 998,600 | ||||||||||||
| Loss from Operations |
(96,796 | ) | (232,393 | ) | 765,516 | (935,513 | ) | |||||||||
| Other Income |
||||||||||||||||
| Interest income |
32 | 41 | 373 | 6,213 | ||||||||||||
| Loss for the Period |
(96,764 | ) | (232,352 | ) | (765,143 | ) | (929,300 | ) | ||||||||
| Loss Per Share—Basic and Diluted |
(0.001 | ) | (0.003 | ) | (0.008 | ) | (0.013 | ) | ||||||||
| Weighted Average Number of Shares Outstanding—Basic and Diluted |
98,812,735 | 69,926,043 | 91,586,096 | 69,926,043 | ||||||||||||
The accompanying notes are an integral part of these consolidated financial statements
F-24
Table of Contents
Index to Financial Statements
Triangle Petroleum Corporation
Consolidated Statements of Cash Flows
(Expressed in U.S. dollars)
(Unaudited)
| Three Months Ended July 31, 2010 $ |
Three Months Ended July 31, 2009 $ |
Six Months Ended July 31, 2010 $ |
Six Months Ended July 31, 2009 $ |
|||||||||||||
| Operating Activities |
||||||||||||||||
| Loss for the period |
(96,764 | ) | (232,352 | ) | (765,143 | ) | (929,300 | ) | ||||||||
| Adjustments to reconcile loss for the period to net cash used in operating activities: |
||||||||||||||||
| Depletion and accretion (Notes 3 and 4) |
67,316 | 50,262 | 131,795 | 91,477 | ||||||||||||
| Depreciation—property and equipment |
6,791 | 7,335 | 13,864 | 11,674 | ||||||||||||
| Stock-based compensation (Notes 6 and 7) |
362,264 | 135,543 | 483,805 | 270,463 | ||||||||||||
| Gain on sale of assets |
(976,900 | ) | (124,621 | ) | (976,900 | ) | (124,621 | ) | ||||||||
| Foreign exchange |
(33,424 | ) | (547,225 | ) | (13,114 | ) | (709,812 | ) | ||||||||
| Asset retirement costs (Note 4) |
— | — | — | (6,509 | ) | |||||||||||
| Changes in operating assets and liabilities |
||||||||||||||||
| Foreign exchange |
(212 | ) | 3,664 | 1,256 | (4,494 | ) | ||||||||||
| Prepaid expenses |
(123,795 | ) | (1,745 | ) | (168,699 | ) | (23,621 | ) | ||||||||
| Other receivables |
(2,505 | ) | 11,992 | 41,967 | 683,244 | |||||||||||
| Accounts payable |
(182,366 | ) | (40,268 | ) | (381,917 | ) | (154,402 | ) | ||||||||
| Accrued liabilities |
7,504 | 4,251 | (7,522 | ) | 5,739 | |||||||||||
| Cash Used in Operating Activities |
(905,243 | ) | (733,164 | ) | (1,640,608 | ) | (890,162 | ) | ||||||||
| Financing Activities |
||||||||||||||||
| Proceeds from issuance of common stock |
— | — | 9,472,957 | — | ||||||||||||
| Share issuance costs |
(12,335 | ) | — | (773,531 | ) | — | ||||||||||
| Cash Provided by (used in) Financing Activities |
(12,335 | ) | — | 8,699,426 | — | |||||||||||
| Investing Activities |
||||||||||||||||
| Purchase of property and equipment |
— | (503 | ) | — | (23,507 | ) | ||||||||||
| Oil and gas property expenditures (Note 3) |
(6,480,146 | ) | (586,952 | ) | (10,875,818 | ) | (2,144,778 | ) | ||||||||
| Cash advances from partners |
— | — | — | (677,843 | ) | |||||||||||
| Proceeds received from the sale of oil and gas properties |
976,900 | 133,325 | 976,900 | 133,325 | ||||||||||||
| Cash Used by Investing Activities |
(5,503,246 | ) | (454,130 | ) | (9,898,918 | ) | (2,712,803 | ) | ||||||||
| Foreign exchange change on cash and cash equivalents |
(43,019 | ) | 547,557 | 11,856 | |
673,524 |
| |||||||||
| Change in Cash and Cash Equivalents |
(6,463,843 | ) | (639,737 | ) | (2,828,244 | ) | (2,929,441 | ) | ||||||||
| Cash and Cash Equivalents—Beginning of Period |
8,514,200 | 6,159,767 | 4,878,601 | 8,449,471 | ||||||||||||
| Cash and Cash Equivalents—End of Period |
2,050,357 | 5,520,030 | 2,050,357 | 5,520,030 | ||||||||||||
| Non-cash Investing and Financing Activities |
||||||||||||||||
| Common stock issued for conversion of debentures |
— | 625,000 | — | 2,100,140 | ||||||||||||
The accompanying notes are an integral part of these consolidated financial statements
F-25
Table of Contents
Index to Financial Statements
Triangle Petroleum Corporation
Consolidated Statements of Stockholders’ Equity
(Expressed in U.S. dollars)
(Unaudited)
| Common Stock | Additional Paid-in Capital $ |
Warrants $ |
Deficit $ |
Total $ |
|||||||||||
| Shares # |
Amount $ |
||||||||||||||
| Balance—January 31, 2010 |
69,926,043 | 699 | 81,950,076 | 4,237,100 | (63,704,645 | ) | 22,483,230 | ||||||||
| Stock options exercised |
791,666 | 8 | 234,949 | — | — | 234,957 | |||||||||
| Common shares issued |
27,993,939 | 280 | 8,464,189 | — | — | 8,464,469 | |||||||||
| Common shares issued pursuant to Termination Agreements at a deemed price of $0.60 per share (Note 6) |
300,000 | 3 | 179,997 | — | — | 180,000 | |||||||||
| Expired warrants |
4,237,100 | (4,237,100 | ) | — | |||||||||||
| Stock based compensation |
— | — | 303,805 | — | — | 303,805 | |||||||||
| Net loss for the period |
— | — | — | — | (765,143 | ) | (765,143 | ) | |||||||
| Balance—July 31, 2010 |
99,011,648 | 990 | 95,370,116 | — | (64,469,788 | ) | 30,901,318 | ||||||||
| Common Stock | Additional Paid-in Capital $ |
Warrants $ |
Deficit $ |
Total $ |
||||||||||
| Shares # |
Amount $ |
|||||||||||||
| Balance—January 31, 2009 |
69,926,043 | 699 | 81,155,715 | 4,237,100 | (61,564,544 | ) | 23,828,970 | |||||||
| Stock based compensation |
— | — | 270,463 | — | — | 270,463 | ||||||||
| Net loss for the period |
— | — | — | — | (929,300 | ) | (929,300 | ) | ||||||
| Balance—July 31, 2009 |
69,926,043 | 699 | 81,426,178 | 4,237,100 | (62,493,844 | ) | 23,170,133 | |||||||
The accompanying notes are an integral part of these consolidated financial statements
F-26
Table of Contents
Index to Financial Statements
Triangle Petroleum Corporation
Notes to the Consolidated Financial Statements
(Expressed in U.S. dollars, except as noted)
(Unaudited)
Triangle Petroleum Corporation, together with its consolidated subsidiaries (“Triangle” or the “Company”), is an independent oil and gas company focused primarily on the acquisition, exploration and development of resource properties. The Company’s primary exploration and development acreage is located in the Williston Basin of North Dakota and the Horton Bluff formation of the Maritimes Basin of Eastern Canada. The Company also has minor producing properties in the Fort Worth Basin.
| 1. | Nature of Operations |
The Company is primarily engaged in the acquisition, exploration and development of oil and gas resource properties and has a limited number of producing wells that generate cash flows from operations. The Company has not generated significant revenues from operations. The Company expects that significant additional exploration and development activities will be necessary to established proved reserves and to commercialize the oil and gas properties.
The Company believes that it has sufficient funds, including those raised in the first quarter of fiscal 2011, to maintain its interest in the existing properties and to maintain core operating, exploration and development activities through to July 31, 2011. The Company monitors its expenditure budgets and adjusts its expenditure plans to conform to available funding. However, additional funding will be required to complete exploration and development activities. The Company plans to fund exploration and development activities through existing cash resources and in the future by offering debt or equity securities, farm-out arrangements or other means.
| 2. | Accounting Policies |
| (a) | Basis of Presentation |
These financial statements and related notes are presented in accordance with accounting principles generally accepted in the United States, and are expressed in U.S. dollars. These consolidated financial statements include the accounts of the Company and its two wholly-owned subsidiaries, Elmworth Energy Corporation, incorporated in the Province of Alberta, Canada, and Triangle USA Petroleum Corporation, incorporated in the State of Colorado, USA. All significant intercompany balances and transactions have been eliminated. The Company’s fiscal year-end is January 31.
In the opinion of management, the accompanying financial statements reflect all adjustments necessary to present fairly our financial position at July 31, 2010 and our operations and cash flows for the three and six month periods ended July 31, 2010 and 2009. In preparing the accompanying financial statements, management has made certain estimates and assumptions that affect reported amounts in the financial statements and disclosures of contingencies. Actual results may differ from those estimates. The results for interim periods are not necessarily indicative of annual results.
Certain disclosures have been condensed or omitted from these financial statements. Accordingly, they should be read in conjunction with the consolidated financial statements and notes thereto for the year ended January 31, 2010.
The Company’s oil and gas operations are generally conducted jointly with others and, as such, these financial statements reflect the Company’s proportionate share of these operations.
F-27
Table of Contents
Index to Financial Statements
Triangle Petroleum Corporation
Notes to the Consolidated Financial Statements—(Continued)
(Expressed in U.S. dollars, except as noted)
(Unaudited)
| 3. | Oil and Gas Properties |
Six months ended July 31, 2010:
| Costs | Accumulated Depletion | Net Carrying Value $ | ||||||||||||||
| Opening $ |
Additions $ |
Closing $ |
Opening $ |
Depletion $ |
Gain $ |
Closing $ |
||||||||||
| Proved Properties |
— | 805,251 | 805,251 | — | — | — | — | 805,251 | ||||||||
| Unproven Properties |
36,660,276 | 8,406,392 | 45,066,668 | 17,876,901 | — | — | 17,876,901 | 27,189,767 | ||||||||
| Total |
36,660,276 | 9,211,643 | 45,871,919 | 17,876,901 | — | — | 17,876,901 | 27,995,018 | ||||||||
For the six month period ended July 31, 2010, the Company’s net cash outflow for oil and gas additions was $10,875,818, including cash additions of $9,226,264 plus $1,649,554 of changes in investing working capital during the first half of fiscal 2011. Net non-cash additions of ($14,621) included ($29,394) of ARO dispositions and $14,773 of ARO additions.
Proved Properties
At January 31, 2010, the carrying value of proved properties was $nil. At July 31, 2010, the carrying value of proved properties was $805,251 comprised of assets in the Williston Basin (North Dakota).
Unproven Properties
All of the Company’s unproven properties are not subject to depletion. The Company’s unproven acquisition and exploration costs were distributed in the following geographic areas:
| July 31, 2010 $ |
January 31, 2010 $ | |||
| Windsor Block of Maritimes Basin (Nova Scotia) |
18,861,608 | 18,783,375 | ||
| Williston Basin (North Dakota) |
8,328,159 | — | ||
| Total unproven acquisition and exploration costs |
27,189,767 | 18,783,375 | ||
The Company has an 87% working interest in 474,625 gross acres (412,924 net acres) in the Windsor Sub-Basin of the Maritimes Basin located in the Province of Nova Scotia, Canada (the “Windsor Block”) and serve as operator. Effective April 15, 2009, the Nova Scotia government issued a 10 year production lease covering the lands. The production lease and work program for the Windsor Block will be due for review in April 2014 with the Province of Nova Scotia. The Company is currently soliciting interest from industry parties to participate in the drilling of a test well to evaluate the newly identified seismic structure and to participate in a joint venture to further evaluate the potential on the Windsor Block.
During the first half of fiscal 2011, the Company acquired approximately 10,000 net acres in the Williston Basin of North Dakota for a cost of $7.4 million and incurred drilling costs of $0.9 million in the Grizzly Project.
F-28
Table of Contents
Index to Financial Statements
Triangle Petroleum Corporation
Notes to the Consolidated Financial Statements—(Continued)
(Expressed in U.S. dollars, except as noted)
(Unaudited)
| 4. | Asset Retirement Obligations |
| Six Months July 31, 2010 $ |
Six Months July 31, 2009 $ |
|||||
| Balance, beginning of period |
1,180,515 | 727,862 | ||||
| Liabilities incurred |
14,773 | 144,750 | ||||
| Liabilities settled as part of disposition |
(29,394 | ) | — | |||
| Liabilities settled in cash |
— | (6,509 | ) | |||
| Accretion |
131,795 | 61,132 | ||||
| Balance, end of period |
1,297,689 | 927,235 | ||||
| 5. | Warrants |
As at January 31, 2010, the Company had 9,128,750 warrants outstanding that can be exercised into 9,128,750 shares of common stock at a price of $2.25 per share. No warrants were exercised and the warrants expired on June 3, 2010.
| 6. | Stock Options |
During the three and six month periods ended July 31, 2010, the Company recorded stock-based compensation expense for the stock options, DSU’s and Termination Agreements of $362,264 and $483,305, respectively (2009—$135,543 and $270,463). In the second quarter of fiscal 2011, the Company issued 300,000 common shares to former employees pursuant to various Termination Agreements at a deemed price of $0.60 share for consideration of $180,000.
A summary of the Company’s stock options outstanding is as follows:
| Options # |
Weighted Average Exercise Price $ |
Aggregate Intrinsic Value $ | |||||
| Outstanding, January 31, 2010 |
5,700,000 | 0.52 | — | ||||
| Exercised |
(791,666 | ) | 0.24 | 203,458 | |||
| Forfeited |
(850,000 | ) | 2.47 | — | |||
| Cancelled |
(658,334 | ) | 0.24 | — | |||
| Outstanding July 31, 2010 |
3,400,000 | 0.15 | 1,197,480 | ||||
| Exercisable, July 31, 2010 |
200,000 | 0.25 | 49,140 | ||||
The weighted average remaining contractual life of stock options outstanding as of July 31, 2010 was 4.2 years.
As at July 31, 2010, there was $265,517 of total unrecognized compensation costs related to non-vested share-based compensation arrangements which are expected to be recognized over a weighted-average period of 27 months.
F-29
Table of Contents
Index to Financial Statements
Triangle Petroleum Corporation
Notes to the Consolidated Financial Statements—(Continued)
(Expressed in U.S. dollars, except as noted)
(Unaudited)
A summary of the status of the Company’s non-vested share options as of July 31, 2010, and changes during the six month period ended July 31, 2010, is presented below:
| Options # |
Weighted Average Grant-Date Fair Value $ |
|||||||
| Non-vested at January 31, 2010 |
3,863,333 | 0.12 | ||||||
| Cancelled |
(30,000 | ) | 0.78 | |||||
| Forfeited |
(550,000 | ) | 0.12 | |||||
| Vested |
(83,333 | ) | 0.21 | |||||
| Non-vested at July 31, 2010 |
3,200,000 | 0.11 | ||||||
| 7. | Deferred Share Units |
Effective February 2, 2010, the Company granted Deferred Share Units (“DSUs”). A DSU vests and will be automatically exchanged on a one-for-one basis for common shares issued from treasury equal to the number of DSUs granted, one year from the date of grant.
| Deferred Share Units # |
Aggregate Intrinsic Value $ |
|||||||
| Outstanding, January 31, 2010 |
— | — | ||||||
| Granted |
2,150,000 | 1,075,000 | ||||||
| Outstanding July 31, 2010 |
2,150,000 | 1,075,000 | ||||||
| Exercisable, July 31, 2010 |
— | — | ||||||
The stock based compensation associated with the DSUs was based on the number of DSUs granted multiplied by the trading price of the common shares on the grant date. The forfeiture rate applied to the DSUs is 10%. The estimated cost of the DSUs is being expensed over the one year vesting period.
As at July 31, 2010, there was $387,131 of total unrecognized compensation costs related to DSUs which are expected to be recognized over a weighted-average period of six months.
| 8. | Subsequent Events |
On August 9, 2010, the Company completed a private placement, whereby 2,044,187 shares of common stock were issued at a price of $0.43 per share for net proceeds of approximately $836,000. Triangle intends to use the funds for general corporate purposes, including acquisition of acreage, funding of drilling commitments and working capital.
The Company obtained approval at its 2010 annual meeting of stockholders to grant discretionary authority to the Company’s board of directors to effect a reverse stock split. In connection with the reverse stock split, the Company obtained stockholder approval to amend its articles of incorporation to decrease the number of shares of authorized common stock from 150,000,000 to 70,000,000 shares. The Company anticipates effecting the amendment to its articles of incorporation to decrease the number of authorized shares simultaneously with the reverse stock split.
F-30
Table of Contents
Index to Financial Statements
Triangle Petroleum Corporation
Notes to the Consolidated Financial Statements—(Continued)
(Expressed in U.S. dollars, except as noted)
(Unaudited)
On October 5, 2010, the Company entered into a purchase and sale agreement with Williston Exploration LLC to acquire 1,700 net acres in Williams County, or the Williston Purchase. The aggregate purchase price consists of up to approximately $2.2 million in cash and up to 433,500 shares of our common stock (after giving effect to the reverse stock split). The Company expects to close on a portion of the acres in December 2010 and the remainder in February 2011.
F-31
Table of Contents
Index to Financial Statements
Appendix A
GLOSSARY OF OIL AND NATURAL GAS TERMS
The following is a description of the meanings of some of the oil and natural gas industry terms used in this prospectus.
2-D seismic or 3-D seismic. Geophysical data that depicts the subsurface strata in two dimensions or three dimensions, respectively. 3-D seismic typically provides a more detailed and accurate interpretation of the subsurface strata than 2-D seismic
AMI. Area of mutual interest.
Basin. A large natural depression on the earth’s surface in which sediments generally brought by water accumulate.
Bbl. One stock tank barrel, or 42 U.S. gallons liquid volume, used in this prospectus in reference to crude oil or other liquid hydrocarbons.
Boe. Barrels of oil equivalent, with six thousand cubic feet of natural gas being equivalent to one barrel of oil.
Boepd. Boe per day.
Completion. The process of treating a drilled well followed by the installation of permanent equipment for the production of oil or natural gas, or in the case of a dry hole, the reporting of abandonment to the appropriate agency.
Condensate. Liquid hydrocarbons associated with the production of a primarily natural gas reserve.
Developed reserves. Reserves of any category that can be expected to be recovered through existing wells with existing equipment and operating methods or for which the cost of required equipment is relatively minor when compared to the cost of a new well.
Dry hole. A well found to be incapable of producing hydrocarbons in sufficient quantities such that proceeds from the sale of such production exceed production expenses and taxes.
Farm-in or farm-out. An agreement under which the owner of a working interest in an oil and natural gas lease assigns the working interest or a portion of the working interest to another party who desires to drill on the leased acreage. Generally, the assignee is required to drill one or more wells in order to earn its interest in the acreage. The assignor usually retains a royalty or reversionary interest in the lease. The interest received by an assignee is a “farm-in” while the interest transferred by the assignor is a “farm-out.”
Field. An area consisting of either a single reservoir or multiple reservoirs, all grouped on or related to the same individual geological structural feature and/or stratigraphic condition.
Formation. A layer of rock which has distinct characteristics that differ from nearby rock.
Horizontal well. A well that is drilled vertically to a certain depth and then drilled at a right angle within a specific interval.
Gross acres or gross wells. The total acres or wells, as the case may be, in which a working interest is owned.
A-1
Table of Contents
Index to Financial Statements
Mcf. Thousand cubic feet of natural gas.
Mcfpd. Mcf per day.
Mcfe. Thousand cubic feet equivalent, determined using the ratio of six Mcf of natural gas to one Bbl of crude oil, condensate or natural gas liquids.
Mmcf. Million cubic feet of natural gas.
Mmcfe. Million cubic feet equivalent, determined using the ratio of six Mcf of natural gas to one Bbl of crude oil, condensate or natural gas liquids.
Net acres or net wells. The sum of the fractional working interest owned in gross acres or gross wells, as the case may be.
Plugging and abandonment. Refers to the sealing off of fluids in the strata penetrated by a well so that the fluids from one stratum will not escape into another or to the surface. Regulations of all states require plugging of abandoned wells.
Productive well. A well that is found to be capable of producing hydrocarbons in sufficient quantities such that proceeds from the sale of the production exceed production expenses and taxes.
Prospect. A specific geographic area which, based on supporting geological, geophysical or other data and also preliminary economic analysis using reasonably anticipated prices and costs, is deemed to have potential for the discovery of commercial hydrocarbons.
Proved developed reserves. Reserves that can be expected to be recovered through existing wells with existing equipment and operating methods.
Proved properties. Properties with proved reserves. As of July 31, 2010, we had no proved reserves.
Proved reserves. The estimated quantities of oil, natural gas and natural gas liquids which geological and engineering data demonstrate with reasonable certainty to be commercially recoverable in future years from known reservoirs under existing economic and operating conditions.
Reserves. Estimated remaining quantities of oil and natural gas and related substances anticipated to be economically producible as of a given date by application of development prospects to known accumulations.
Reservoir. A porous and permeable underground formation containing a natural accumulation of producible oil and/or natural gas that is confined by impermeable rock or water barriers and is separate from other reservoirs.
Spacing. The distance between wells producing from the same reservoir. Spacing is often expressed in terms of acres and is often established by regulatory agencies.
Unit. The joining of all or substantially all interests in a reservoir or field, rather than a single tract, to provide for development and operation without regard to separate property interests. Also, the area covered by a unitization agreement.
Unproved properties. Properties with no proved reserves.
Wellbore. The hole drilled by the bit that is equipped for oil or natural gas production on a completed well.
Working interest. The operating interest that gives the owner the right to drill, produce and conduct operating activities on the property and receive a share of production and requires the owner to pay a share of the costs of drilling and production operations.
A-2
Table of Contents
Index to Financial Statements
9,000,000 Shares
Triangle Petroleum Corporation
COMMON STOCK
Prospectus
Johnson Rice & Company L.L.C.
Canaccord Genuity
Rodman & Renshaw, LLC
, 2010
Table of Contents
Index to Financial Statements
PART II
INFORMATION NOT REQUIRED IN PROSPECTUS
| Item 13. | Other expenses of issuance and distribution. |
The following table sets forth the costs and expenses, other than underwriting discounts and commissions, to be paid by the registrant in connection with the sale of the shares of common stock being registered hereby. All amounts are estimates except for the SEC registration fee and the FINRA filing fee.
| Amount paid or to be paid |
||||
| SEC registration fee |
$4,059 | |||
| FINRA filing fee |
5,500 | |||
| Listing fees |
* | |||
| Printing and engraving |
* | |||
| Legal fees and expenses |
* | |||
| Accounting fees and expenses |
* | |||
| Blue sky fees and expenses |
* | |||
| Transfer agent and registrar fees and expenses |
* | |||
| Miscellaneous |
* | |||
| Total |
$ | * | ||
| * | To be filed by amendment. |
| Item 14. | Indemnification of directors and officers. |
Chapter 78 of the Nevada Revised Statutes (“NRS”) provides that a corporation may indemnify any person who was or is a party or is threatened to be made a party to any threatened, pending or completed action, suit or proceeding whether civil, criminal, administrative or investigative (other than an action by or in the right of the corporation) by reason of the fact that he is or was a director, officer, employee or agent of the corporation, or is or was serving at the request of the corporation as a director, officer, employee or agent of another corporation, partnership, joint venture, trust or other enterprise, against expenses (including attorneys’ fees), judgments, fines and amounts paid in settlement actually and reasonably incurred by him in connection with such action, suit or proceeding if he is not liable pursuant to NRS Section 78.138 or acted in good faith and in a manner he reasonably believed to be in or not opposed to the best interests of the corporation, and, with respect to any criminal action or proceeding, had no reasonable cause to believe his conduct was unlawful. NRS Chapter 78 further provides that a corporation similarly may indemnify any such person serving in any such capacity who was or is a party or is threatened to be made a party to any threatened, pending or completed action or suit by or in the right of the corporation to procure a judgment in its favor by reason of the fact that he is or was a director, officer, employee or agent of the corporation or is or was serving at the request of the corporation as a director, officer, employee or agent of another corporation, partnership, joint venture, trust or other enterprise, against expenses (including attorneys’ fees) actually and reasonably incurred in connection with the defense or settlement of such action or suit if he is not liable pursuant to NRS Section 78.138 or acted in good faith and in a manner he reasonably believed to be in or not opposed to the best interests of the corporation and except that no indemnification shall be made in respect of any claim, issue or matter as to which such person shall have been adjudged, after exhaustion of all appeals, to be liable to the corporation unless and only to the extent that the court or other court of competent jurisdiction in which such action or suit was brought shall determine upon application that, despite the adjudication of liability but in view of all of the circumstances of the case, such person is fairly and reasonably entitled to indemnity for such expenses which the court or other court of competent jurisdiction shall deem proper.
Our bylaws provide that we may indemnify our officers, directors, employees, agents and any other persons to the maximum extent permitted by the NRS.
II-1
Table of Contents
Index to Financial Statements
| Item 15. | Recent sales of unregistered securities. |
On August 6, 2010, we completed a private placement with certain accredited investors, pursuant to which such investors purchased an aggregate of 2,044,187 shares of our common stock at a purchase price of $0.43 per share (without giving effect to the reverse stock split), yielding us aggregate gross proceeds of approximately $880,000 and net proceeds of approximately $836,000. Our common stock was offered and sold in reliance on the private placement exemption from registration under Section 4(2) of the Securities Act, and Regulation D promulgated thereunder, or Regulation D. We relied on this exemption based on applicable facts, including that (i) the offers and sales were made to a limited number of persons, all of whom represented that they were “accredited investors” (as such term is defined in Regulation D), (ii) no general solicitation or advertising was used in connection with the offering and sale of our common stock and (iii) the investors’ represented that they were acquiring our common stock for investment only. Johnson Rice & Company L.L.C. served as lead placement agent for the private placement.
On March 16, 2010, we completed a private placement with certain accredited investors, pursuant to which such investors purchased an aggregate of 27,993,939 shares of our common stock at a purchase price of $0.33 per share (without giving effect to the reverse stock split), yielding us aggregate gross proceeds of approximately $9,238,000 and net proceeds of approximately $8,300,000. Our common stock was offered and sold in reliance on the private placement exemption from registration under Section 4(2) of the Securities Act and Regulation D. We relied on this exemption based on applicable facts, including that (i) the offers and sales were made to a limited number of persons, all of whom represented that they were “accredited investors” (as such term is defined in Regulation D), (ii) no general solicitation or advertising was used in connection with the offering and sale of our common stock and (iii) the investors’ represented that they were acquiring our common stock for investment only. Johnson Rice & Company L.L.C. served as lead placement agent for the private placement.
On June 3, 2008, we sold an aggregate of 18,257,500 units to certain accredited investors for aggregate proceeds of $25,560,500. Each unit consisted of one share of our common stock and one-half of a warrant (without giving effect to the reverse stock split), with each whole warrant entitling the holder to purchase one share of our common stock exercisable at a price of $2.25 for a period of two years (without giving effect to the reverse stock split). The warrants expired in June 2010. The units were offered and sold in reliance on the private placement exemption from registration under Section 4(2) of the Securities Act and Regulation D. We relied on this exemption based on applicable facts, including that (i) the offers and sales were made to a limited number of persons, all of whom represented that they were “accredited investors” (as such term is defined in Regulation D), (ii) no general solicitation or advertising was used in connection with the offering and sale of the units and (iii) the investors’ represented that they were acquiring the units for investment only.
| Item 16. | Exhibits and financial statement schedules. |
(a) Exhibits.
II-2
Table of Contents
Index to Financial Statements
EXHIBIT INDEX
| 1.1*** | Form of Underwriting Agreement | |
| 3.1 | Articles of Incorporation, filed as an exhibit to the registration statement on Form SB-2 filed with the Securities and Exchange Commission on February 27, 2004 and incorporated herein by reference. | |
| 3.2 | Certificate of Amendment to Articles of Incorporation, filed as an exhibit to the Current Report on Form 8-K filed with the Securities and Exchange Commission on March 12, 2010 and incorporated herein by reference. | |
| 3.3 | Amended and Restated Bylaws of the Company, filed as an exhibit to the Current Report on Form 8-K filed with the Securities and Exchange Commission on November 19, 2008 and incorporated herein by reference. | |
| 3.4* | Form of Second Amended and Restated Bylaws of the Company | |
| 4.1* | Specimen Common Stock Certificate | |
| 5.1*** | Opinion of Jones Vargas, Chartered, Nevada Counsel to the Company | |
| 10.01† | 2005 Incentive Stock Plan, filed as an exhibit to the Registration Statement on Form S-8 filed with the Securities and Exchange Commission on October 14, 2005 and incorporated herein by reference. | |
| 10.02† | 2007 Incentive Stock Plan, filed as an exhibit to the Quarterly Report on Form 10-Q filed with the Securities and Exchange Commission on September 14, 2007 and incorporated herein by reference. | |
| 10.03† | Stock Option Plan, filed as an exhibit to the definitive proxy statement on Schedule 14A filed with the Securities and Exchange Commission on May 22, 2009 and incorporated herein by reference. | |
| 10.04 | Production Lease, dated as of April 15, 2009, by and between the Company and Her Majesty the Queen in the Right of the Province of Nova Scotia, filed as an exhibit to the Quarterly Report on Form 10-Q filed with the Securities and Exchange Commission on April 20, 2009 and incorporated herein by reference. | |
| 10.05 | Overriding Royalty Agreement, dated as of June 10, 2009, by and between Elmworth Energy Corporation and Contact Exploration Inc., filed as an exhibit to the Current Report on Form 8-K filed with the Securities and Exchange Commission on September 2, 2009 and incorporated herein by reference. | |
| 10.06 | Memorandum of Understanding, dated as of November 30, 2009, by and among Triangle Petroleum Corporation, Palo Alto Global Energy Master Fund, L.P. and Mark Gustafson, filed as an exhibit to the Current Report on Form 8-K filed with the Securities and Exchange Commission on December 3, 2009 and incorporated herein by reference. | |
| 10.07 | Separation Agreement, dated as of November 30, 2009, by and between Triangle Petroleum Corporation and Mark Gustafson, filed as an exhibit to the Current Report on Form 8-K filed with the Securities and Exchange Commission on December 3, 2009 and incorporated herein by reference. | |
| 10.08 | Termination of Employment of Shaun Toker, dated December 23, 2009, filed as an exhibit to the Current Report on Form 8-K filed with the Securities and Exchange Commission on January 5, 2010 and incorporated herein by reference. | |
| 10.09 | Termination of Employment of J. Howard Anderson, dated December 30, 2009, filed as an exhibit to the Current Report on Form 8-K filed with the Securities and Exchange Commission on January 5, 2010 and incorporated herein by reference. | |
| 10.10† | Employment Agreement, effective as of January 29, 2010, by and between Triangle USA Petroleum Corporation and Peter Hill, filed as an exhibit to the Annual Report on Form 10-K filed with the Securities and Exchange Commission on April 9, 2010 and incorporated herein by reference. | |
II-3
Table of Contents
Index to Financial Statements
| 10.11 | Employment Agreement, effective as of January 29, 2010, by and between Triangle USA Petroleum Corporation and Jonathan Samuels, filed as an exhibit to the Annual Report on Form 10-K filed with the Securities and Exchange Commission on April 9, 2010 and incorporated herein by reference. | |
| 10.12*† | Deferred Share Unit Agreement, dated February 2, 2010 between Triangle Petroleum Corporation and Peter Hill | |
| 10.13*† | Deferred Share Unit Agreement, dated February 2, 2010 between Triangle Petroleum Corporation and Jonathan Samuels | |
| 14.01 | Code of Business Conduct and Ethics, filed as an exhibit to the Current Report on Form 8-K filed with the Securities and Exchange Commission on October 25, 2010 and incorporated herein by reference. | |
| 21.01** | List of Subsidiaries | |
| 23.01* | Consent of KPMG LLP, Independent Accountants | |
| 23.02* | Consent of Ryder Scott, Independent Petroleum Engineers | |
| 23.03*** | Consent of Jones Vargas, Chartered, Nevada Counsel to the Company (included in Exhibit 5.1) | |
| 24.01** | Power of Attorney (set forth on the signature page to this registration statement) | |
| * | Filed herewith. |
| ** | Previously filed. |
| *** | To be filed by amendment. |
| † | Management Contract or Compensatory Plan or Arrangement. |
(b) Financial statement schedules.
Not applicable.
| Item 17. | Undertakings. |
Insofar as indemnification for liabilities arising under the Securities Act may be permitted to directors, officers and controlling persons of the registrant pursuant to the foregoing provisions, or otherwise, the registrant has been advised that in the opinion of the SEC such indemnification is against public policy as expressed in the Securities Act and is, therefore, unenforceable. In the event that a claim for indemnification against such liabilities (other than the payment by the registrant of expenses incurred or paid by a director, officer or controlling person of the registrant in the successful defense of any action, suit or proceeding) is asserted by such director, officer or controlling person in connection with the securities being registered, the registrant will, unless in the opinion of its counsel the matter has been settled by controlling precedent, submit to a court of appropriate jurisdiction the question whether such indemnification by it is against public policy as expressed in the Securities Act and will be governed by the final adjudication of such issue.
The undersigned registrant hereby undertakes that:
(1) For purposes of determining any liability under the Securities Act, the information omitted from the form of prospectus filed as part of this registration statement in reliance upon Rule 430A and contained in a form of prospectus filed by the Registrant pursuant to Rule 424(b)(1) or (4) or 497(h) under the Securities Act shall be deemed to be part of this registration statement as of the time it was declared effective.
(2) For the purpose of determining any liability under the Securities Act, each post effective amendment that contains a form of prospectus shall be deemed to be a new registration statement relating to the securities offered therein, and the offering of such securities at that time shall be deemed to be the initial bona fide offering thereof.
II-4
Table of Contents
Index to Financial Statements
Signatures
Pursuant to the requirements of the Securities Act, the registrant has duly caused this registration statement to be signed on its behalf by the undersigned, thereunto duly authorized, in the City of Denver, Colorado, on the 25th day of October, 2010.
| Triangle Petroleum Corporation | ||||
| Date: October 25, 2010 |
By: | /s/ Peter Hill | ||
| Name: | Peter Hill | |||
| Title: | Chief Executive Officer (Principal Executive Officer) | |||
| Triangle Petroleum Corporation | ||||
| Date: October 25, 2010 |
By: | /s/ Jonathan Samuels | ||
| Name: | Jonathan Samuels | |||
| Title: | Chief Financial Officer (Principal Financial and Accounting Officer) | |||
Pursuant to the requirements of the Securities Act, as amended, this registration statement has been signed below by the following persons in the capacities and on the dates indicated.
Signatures
Pursuant to the requirements of the Securities Act, this registration statement has been signed by the following persons in the capacities indicated on.
| Signature and Title |
Date | |
| /s/ Peter Hill Peter Hill (Principal Executive Officer) |
October 25, 2010 | |
| /s/ Jonathan Samuels Jonathan Samuels (Principal Financial and Accounting Officer) |
October 25, 2010 | |
| * F. Gardner Parker Director |
October 25, 2010 | |
| * Stephen A. Holditch Director |
October 25, 2010 | |
| * Randal Matkaluk Director |
October 25, 2010 | |
| * /s/ Jonathan Samuels |
October 25, 2010 | |
| Attorney-in-fact | ||
II-5
Table of Contents
Index to Financial Statements
EXHIBIT INDEX
| 1.1*** | Form of Underwriting Agreement | |
| 3.1 | Articles of Incorporation, filed as an exhibit to the registration statement on Form SB-2 filed with the Securities and Exchange Commission on February 27, 2004 and incorporated herein by reference. | |
| 3.2 | Certificate of Amendment to Articles of Incorporation, filed as an exhibit to the Current Report on Form 8-K filed with the Securities and Exchange Commission on March 12, 2010 and incorporated herein by reference. | |
| 3.3 | Amended and Restated Bylaws of the Company, filed as an exhibit to the Current Report on Form 8-K filed with the Securities and Exchange Commission on November 19, 2008 and incorporated herein by reference. | |
| 3.4* | Form of Second Amended and Restated Bylaws of the Company | |
| 4.1* | Specimen Common Stock Certificate | |
| 5.1*** | Opinion of Jones Vargas, Chartered, Nevada Counsel to the Company | |
| 10.01† | 2005 Incentive Stock Plan, filed as an exhibit to the Registration Statement on Form S-8 filed with the Securities and Exchange Commission on October 14, 2005 and incorporated herein by reference. | |
| 10.02† | 2007 Incentive Stock Plan, filed as an exhibit to the Quarterly Report on Form 10-Q filed with the Securities and Exchange Commission on September 14, 2007 and incorporated herein by reference. | |
| 10.03† | Stock Option Plan, filed as an exhibit to the definitive proxy statement on Schedule 14A filed with the Securities and Exchange Commission on May 22, 2009 and incorporated herein by reference. | |
| 10.04 | Production Lease, dated as of April 15, 2009, by and between the Company and Her Majesty the Queen in the Right of the Province of Nova Scotia, filed as an exhibit to the Quarterly Report on Form 10-Q filed with the Securities and Exchange Commission on April 20, 2009 and incorporated herein by reference. | |
| 10.05 | Overriding Royalty Agreement, dated as of June 10, 2009, by and between Elmworth Energy Corporation and Contact Exploration Inc., filed as an exhibit to the Current Report on Form 8-K filed with the Securities and Exchange Commission on September 2, 2009 and incorporated herein by reference. | |
| 10.06 | Memorandum of Understanding, dated as of November 30, 2009, by and among Triangle Petroleum Corporation, Palo Alto Global Energy Master Fund, L.P. and Mark Gustafson, filed as an exhibit to the Current Report on Form 8-K filed with the Securities and Exchange Commission on December 3, 2009 and incorporated herein by reference. | |
| 10.07 | Separation Agreement, dated as of November 30, 2009, by and between Triangle Petroleum Corporation and Mark Gustafson, filed as an exhibit to the Current Report on Form 8-K filed with the Securities and Exchange Commission on December 3, 2009 and incorporated herein by reference. | |
| 10.08 | Termination of Employment of Shaun Toker, dated December 23, 2009, filed as an exhibit to the Current Report on Form 8-K filed with the Securities and Exchange Commission on January 5, 2010 and incorporated herein by reference. | |
| 10.09 | Termination of Employment of J. Howard Anderson, dated December 30, 2009, filed as an exhibit to the Current Report on Form 8-K filed with the Securities and Exchange Commission on January 5, 2010 and incorporated herein by reference. | |
| 10.10† | Employment Agreement, effective as of January 29, 2010, by and between Triangle USA Petroleum Corporation and Peter Hill, filed as an exhibit to the Annual Report on Form 10-K filed with the Securities and Exchange Commission on April 9, 2010 and incorporated herein by reference. | |
II-6
Table of Contents
Index to Financial Statements
| 10.11 | Employment Agreement, effective as of January 29, 2010, by and between Triangle USA Petroleum Corporation and Jonathan Samuels, filed as an exhibit to the Annual Report on Form 10-K filed with the Securities and Exchange Commission on April 9, 2010 and incorporated herein by reference. | |
| 10.12*† | Deferred Share Unit Agreement, dated February 2, 2010 between Triangle Petroleum Corporation and Peter Hill | |
| 10.13*† | Deferred Share Unit Agreement, dated February 2, 2010 between Triangle Petroleum Corporation and Jonathan Samuels | |
| 14.01 | Code of Business Conduct and Ethics, filed as an exhibit to the Current Report on Form 8-K filed with the Securities and Exchange Commission on October 25, 2010 and incorporated herein by reference. | |
| 21.01** | List of Subsidiaries | |
| 23.01* | Consent of KPMG LLP, Independent Accountants | |
| 23.02* | Consent of Ryder Scott, Independent Petroleum Engineers | |
| 23.03*** | Consent of Jones Vargas, Chartered, Nevada Counsel to the Company (included in Exhibit 5.1) | |
| 24.01** | Power of Attorney (set forth on the signature page to this registration statement) | |
| * | Filed herewith. |
| ** | Previously filed. |
| *** | To be filed by amendment. |
| † | Management Contract or Compensatory Plan or Arrangement. |
II-7