Attached files
| file | filename |
|---|---|
| 8-K - FORM 8-K - DOVER Corp | y87252e8vk.htm |
| EX-99.1 - EX-99.1 - DOVER Corp | y87252exv99w1.htm |
| EX-99.2 - EX-99.2 - DOVER Corp | y87252exv99w2.htm |
Exhibit 99.3

| Dover Corporation Third Quarter 2010 Conference Call October 22, 2010 9:00 am ET |

| 2 Forward Looking Statements We want to remind everyone that our comments may contain forward-looking statements that are inherently subject to uncertainties. We caution everyone to be guided in their analysis of Dover Corporation by referring to our Form 10-K for a list of factors that could cause our results to differ from those anticipated in any such forward-looking statements. We would also direct your attention to our internet site, www.dovercorporation.com, where considerably more information can be found. |
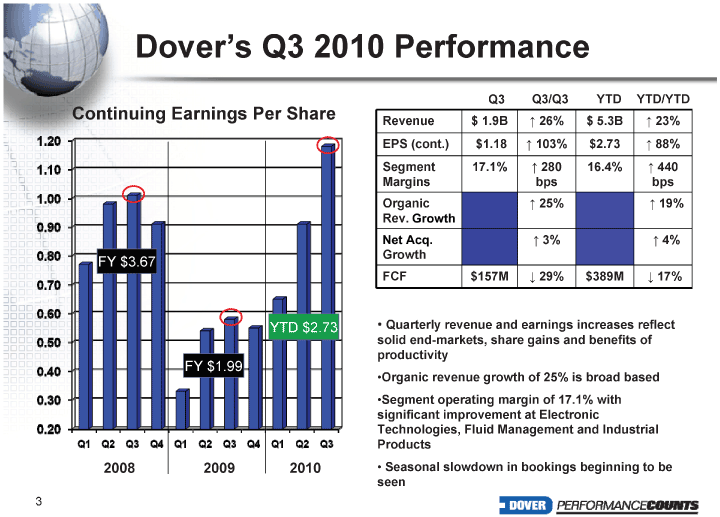
| 3 Dover's Q3 2010 Performance Continuing Earnings Per Share 2008 FY $3.67 Revenue $ 1.9B ^ 26% $ 5.3B ^ 23% EPS (cont.) $1.18 ^ 103% $2.73 ^ 88% Segment Margins 17.1% ^ 280 bps 16.4% ^ 440 bps Organic Rev. Growth ^ 25% ^ 19% Net Acq. Growth ^ 3% ^ 4% FCF $157M ^ 29% $389M ^ 17% Quarterly revenue and earnings increases reflect solid end-markets, share gains and benefits of productivity Organic revenue growth of 25% is broad based Segment operating margin of 17.1% with significant improvement at Electronic Technologies, Fluid Management and Industrial Products Seasonal slowdown in bookings beginning to be seen Q3 Q3/Q3 2009 FY $1.99 YTD $2.73 2010 YTD YTD/YTD |
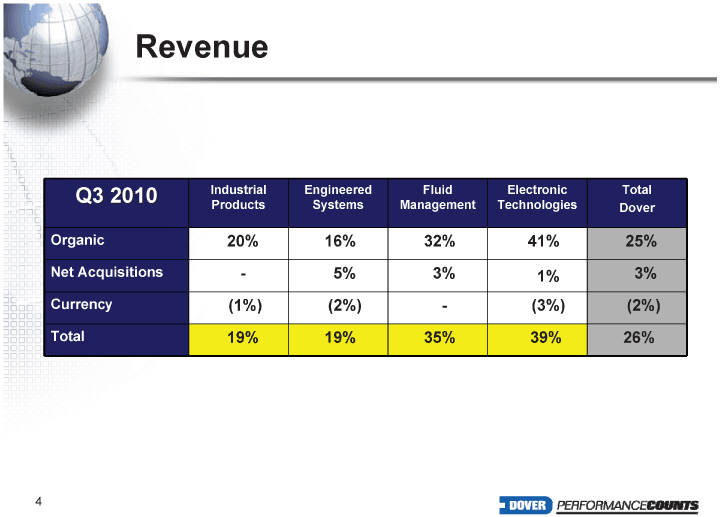
| 4 Revenue Q3 2010 Industrial Products Engineered Systems Fluid Management Electronic Technologies Total Dover Organic 20% 16% 32% 41% 25% Net Acquisitions - 5% 3% 1% 3% Currency (1%) (2%) - (3%) (2%) Total 19% 19% 35% 39% 26% |
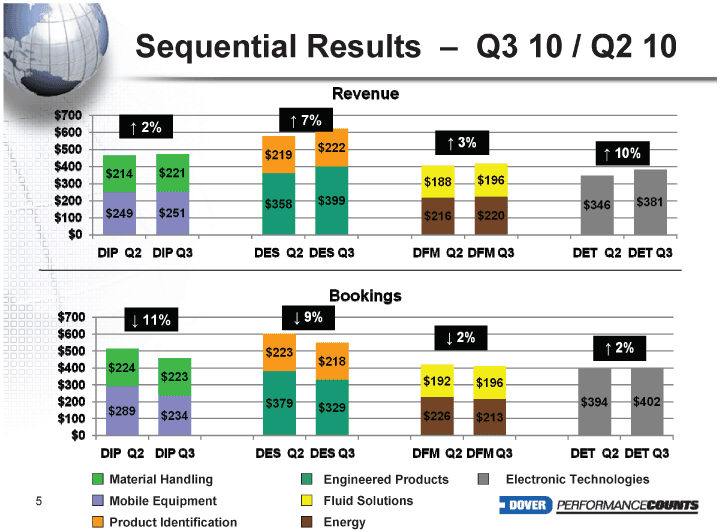
| 5 Sequential Results - Q3 10 / Q2 10 Material Handling Fluid Solutions Mobile Equipment Energy Product Identification Engineered Products ^ 2% ^ 7% ^ 11% Electronic Technologies |
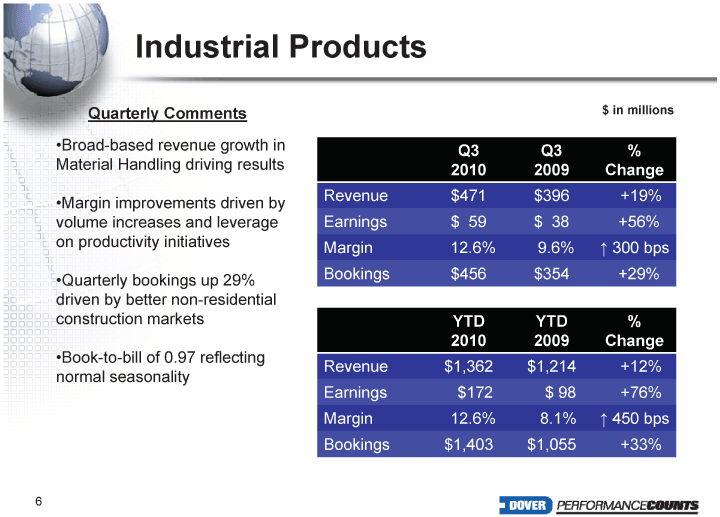
| 6 Industrial Products Broad-based revenue growth in Material Handling driving results Margin improvements driven by volume increases and leverage on productivity initiatives Quarterly bookings up 29% driven by better non-residential construction markets Book-to-bill of 0.97 reflecting normal seasonality $ in millions Q3 2010 Q3 2009 % Change Revenue $471 $396 +19% Earnings $ 59 $ 38 +56% Margin 12.6% 9.6% ^ 300 bps Bookings $456 $354 +29% Quarterly Comments YTD 2010 YTD 2009 % Change Revenue $1,362 $1,214 +12% Earnings $172 $ 98 +76% Margin 12.6% 8.1% ^ 450 bps Bookings $1,403 $1,055 +33% |
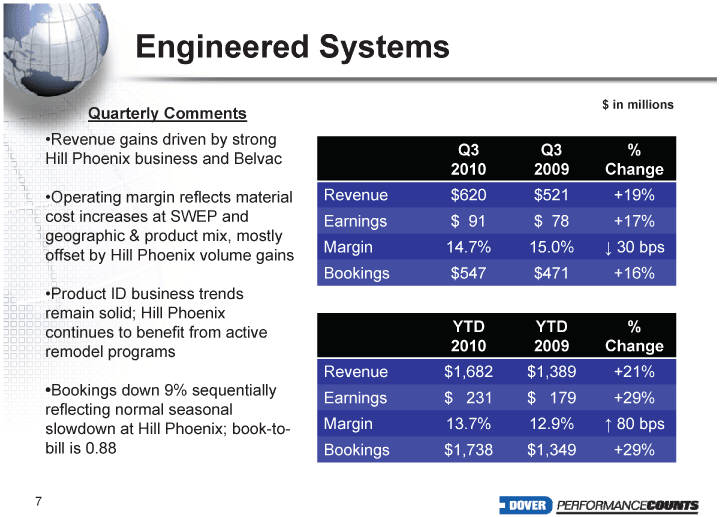
| 7 Engineered Systems Revenue gains driven by strong Hill Phoenix business and Belvac Operating margin reflects material cost increases at SWEP and geographic & product mix, mostly offset by Hill Phoenix volume gains Product ID business trends remain solid; Hill Phoenix continues to benefit from active remodel programs •Bookings down 9% sequentially reflecting normal seasonal slowdown at Hill Phoenix; book-to- bill is 0.88 $ in millions Quarterly Comments Q3 2010 Q3 2009 % Change Revenue $620 $521 +19% Earnings $ 91 $ 78 +17% Margin 14.7% 15.0% ^ 30 bps Bookings $547 $471 +16% YTD 2010 YTD 2009 % Change Revenue $1,682 $1,389 +21% Earnings $ 231 $ 179 +29% Margin 13.7% 12.9% ^ 80 bps Bookings $1,738 $1,349 +29% |
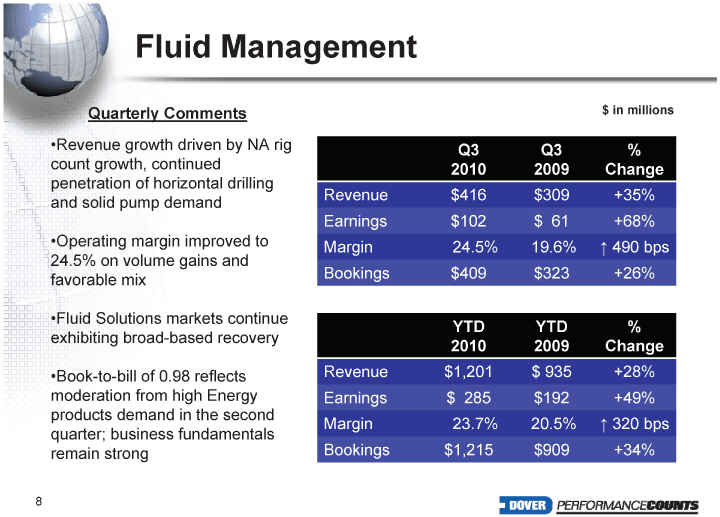
| 8 Fluid Management Revenue growth driven by NA rig count growth, continued penetration of horizontal drilling and solid pump demand Operating margin improved to 24.5% on volume gains and favorable mix Fluid Solutions markets continue exhibiting broad-based recovery Book-to-bill of 0.98 reflects moderation from high Energy products demand in the second quarter; business fundamentals remain strong $ in millions Quarterly Comments Q3 2010 Q3 2009 % Change Revenue $416 $309 +35% Earnings $102 $ 61 +68% Margin 24.5% 19.6% ^ 490 bps Bookings $409 $323 +26% YTD 2010 YTD 2009 % Change Revenue $1,201 $ 935 +28% Earnings $ 285 $192 +49% Margin 23.7% 20.5% ^ 320 bps Bookings $1,215 $909 +34% |
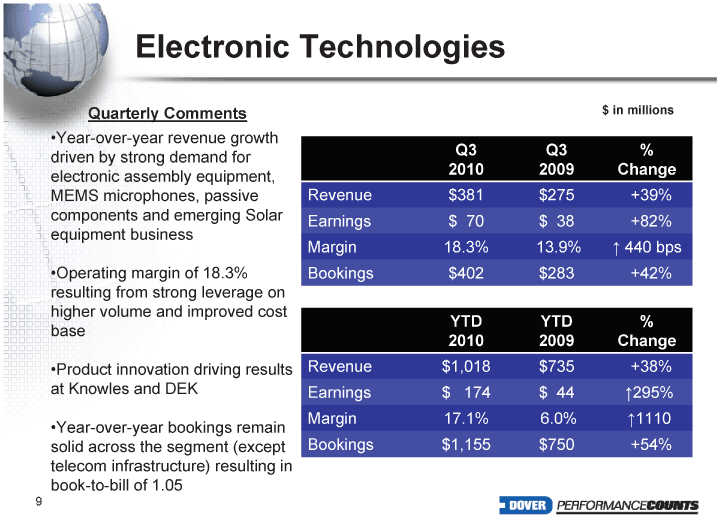
| 9 Electronic Technologies Year-over-year revenue growth driven by strong demand for electronic assembly equipment, MEMS microphones, passive components and emerging Solar equipment business Operating margin of 18.3% resulting from strong leverage on higher volume and improved cost base Product innovation driving results at Knowles and DEK Year-over-year bookings remain solid across the segment (except telecom infrastructure) resulting in book-to-bill of 1.05 $ in millions Quarterly Comments Q3 2010 Q3 2009 % Change Revenue $381 $275 +39% Earnings $ 70 $ 38 +82% Margin 18.3% 13.9% ^ 440 bps Bookings $402 $283 +42% YTD 2010 YTD 2009 % Change Revenue $1,018 $735 +38% Earnings $ 174 $ 44 ^295% Margin 17.1% 6.0% ^1110 bps Bookings $1,155 $750 +54% |
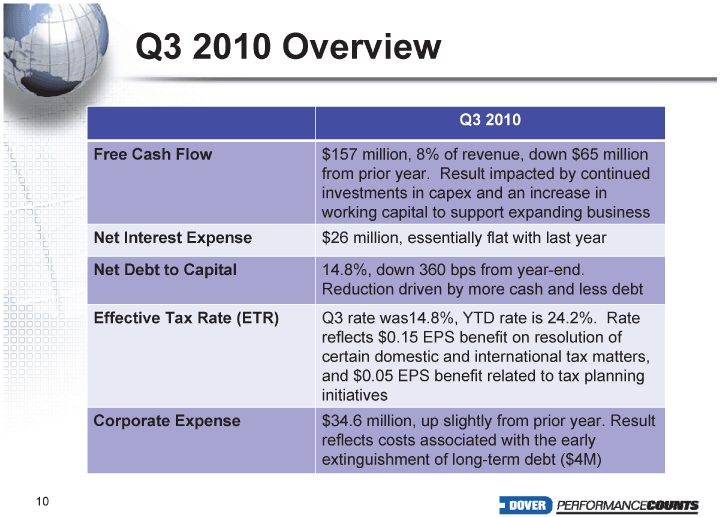
| Q3 2010 Overview Q3 2010 Free Cash Flow $157 million, 8% of revenue, down $65 million from prior year. Result impacted by continued investments in capex and an increase in working capital to support expanding business Net Interest Expense $26 million, essentially flat with last year Net Debt to Capital 14.8%, down 360 bps from year-end. Reduction driven by more cash and less debt Effective Tax Rate (ETR) Q3 rate was14.8%, YTD rate is 24.2%. Rate reflects $0.15 EPS benefit on resolution of certain domestic and international tax matters, and $0.05 EPS benefit related to tax planning initiatives Corporate Expense $34.6 million, up slightly from prior year. Result reflects costs associated with the early extinguishment of long-term debt ($4M) 10 |
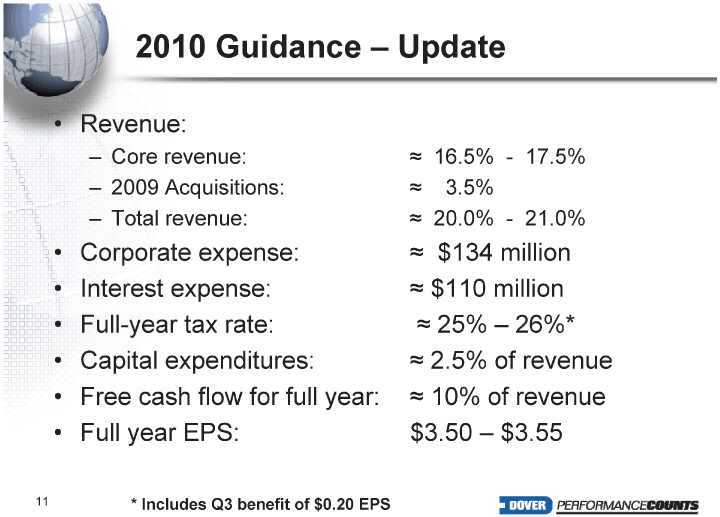
| 11 2010 Guidance - Update Revenue: Core revenue: ^ 16.5% - 17.5% 2009 Acquisitions: ^ 3.5% Total revenue: ^ 20.0% - 21.0% Corporate expense: ^ $134 million Interest expense: ^ $110 million Full-year tax rate: ^ 25% - 26%* Capital expenditures: ^ 2.5% of revenue Free cash flow for full year: ^ 10% of revenue Full year EPS: $3.50 - $3.55 * Includes Q3 benefit of $0.20 EPS |
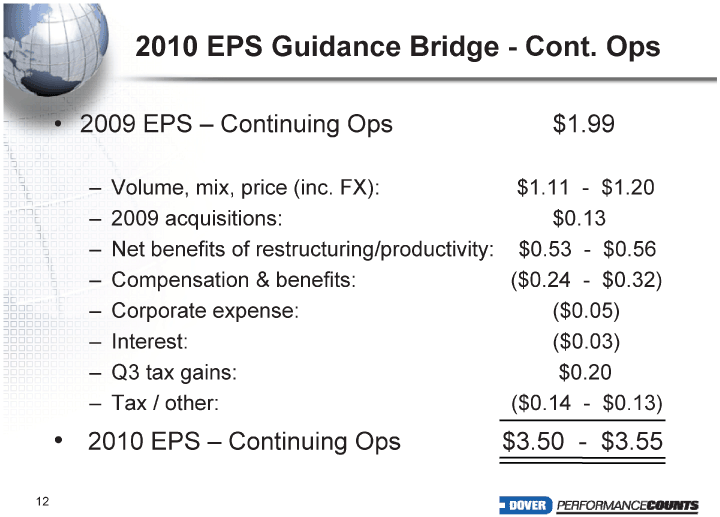
| 12 2010 EPS Guidance Bridge - Cont. Ops 2009 EPS - Continuing Ops $1.99 Volume, mix, price (inc. FX): $1.11 - $1.20 2009 acquisitions: $0.13 Net benefits of restructuring/productivity: $0.53 - $0.56 Compensation & benefits: ($0.24 - $0.32) Corporate expense: ($0.05) Interest: ($0.03) Q3 tax gains: $0.20 Tax / other: ($0.14 - $0.13) 2010 EPS - Continuing Ops $3.50 - $3.55 |