Attached files
 2010
Third-Quarter Earnings Results
October 21, 2010
Exhibit 99.3 |
 2
Introduction
Unless
otherwise
stated,
we
will
be
talking
about
results
in
the
third
quarter 2010 and comparing them with the same period in 2009
References to PMI volumes refer to PMI shipment data, unless
otherwise stated
Industry volume and market shares are the latest data available from
a number of internal and external sources
Net revenues exclude excise taxes
Acquisitions, for the purposes of this presentation, also include our
business combination with Fortune Tobacco Corporation in the
Philippines
Organic volume refers to volume excluding acquisitions
Data tables showing adjustments to net revenues and Operating
Companies Income, or “OCI”, for currency, acquisitions, asset
impairment, exit and other costs, adjustments to EPS, free cash flow
calculations, and reconciliations to U.S. GAAP measures are at the
end of today’s web cast slides and are posted on our web site
|
 3
Forward-Looking and Cautionary Statements
This presentation and related discussion contain statements that, to the
extent they do not relate strictly to historical or current facts, constitute
“forward-looking statements”
within the meaning of the Private Securities
Litigation Reform Act of 1995. Such forward-looking statements are
based on current plans, estimates and expectations, and are not
guarantees of future performance. They are based on management’s
expectations that involve a number of business risks and uncertainties,
any of which could cause actual results to differ materially from those
expressed in or implied by the forward-looking statements. PMI
undertakes no obligation to publicly update or revise any forward-looking
statements, except in the normal course of its public disclosure
obligations. The risks and uncertainties relating to the forward-looking
statements in this presentation include those described under Item 1A.
“Risk Factors”
in PMI’s Form 10-Q for the quarter ended June 30, 2010,
filed with the Securities and Exchange Commission. |
 4
Q3, 2010, Highlights
As anticipated, third quarter results adversely impacted by various
timing issues, in particular relating to Japan
Payback for the previously disclosed build-up of stocks at our
distributor in Japan during the second quarter this year
Difficult environment in Greece and Turkey, resulting from significant
tax increases that occurred earlier this year
Strong underlying business and market share performance
Good results for Marlboro, driven by the new architecture and
innovative line extensions
Marlboro
share higher or stable in the quarter across all four of our
Regions
Operating cash flow up more than 30% in the third quarter
Acceleration of share repurchase program in 2010
Dividend increased by 10.3% in September
Source: PMI Financials and PMI estimates |
 5
2010 EPS Guidance
We are raising and narrowing our reported diluted EPS
guidance for 2010 to a range of $3.90 to $3.95
This reflects an improved business performance, more
favorable exchange rates and a lower tax rate
This represents a reported diluted EPS growth of
approximately 20% to 22%, compared to the $3.24
achieved last year
This also represents a reported diluted EPS growth rate,
excluding currency, of approximately 16% to 18%,
compared to 14% to 17% projected previously |
 6
PMI Volume
Source: PMI Financials
Q3, 2010
(1.6)%
(10.5)
635.3
Organic Cigarette Volume
4.5 %
29.1
674.9
Cigarette Volume
YTD Sept, 2010
(2.9)%
(6.3)
213.0
Organic Cigarette Volume
4.5 %
9.9
229.2
Cigarette Volume
% Change
Variance
Results
(units billion) |
 7
PMI Financial Results
(a)
Excluding currency and acquisitions
Source: PMI Financials
3.6 %
(0.2)%
Net Revenues
YTD Sept, 2010
Results
(a)
Q3, 2010
Results
(a)
(% Change) |
 8
PMI Financial Results
(a)
Net
revenues
and
adjusted
OCI
exclude
currency
and
acquisitions.
Adjusted
diluted
EPS
excludes
currency.
(b)
OCI stands for Operating Companies Income, which is defined as operating income
before general corporate expenses and the amortization of intangibles. Q3
and YTD Sept, 2010, OCI growth rates are on an adjusted basis which excludes asset impairment, exit and other costs.
Source: PMI Financials
12.5 %
5.4 %
Adjusted Diluted EPS
4.5 %
(1.7)%
Adjusted
OCI
(b)
3.6 %
(0.2)%
Net Revenues
YTD Sept, 2010
Results
(a)
Q3, 2010
Results
(a)
(% Change) |
 9
Pricing
Recently implemented price increases in Argentina,
Indonesia, Italy, Japan, Russia and the UK
Announced a 30 Euro cent price increase in France, as
well as higher prices in Poland
Filed with the customs authorities for a price increase in
Portugal
Will substantially benefit in the fourth quarter from the
stock revaluation at our distributor in Japan
Expect our price variance to be significantly higher in the
fourth quarter this year than in the third quarter |
 10
PMI Business Momentum
Good market share momentum across all Regions:
-
PMI
and
Marlboro
share
up
0.2
points
in
Q3,
2010,
in
the
EU
Region
-
PMI gained share year-on-year or sequentially in a wide range of
markets, including Algeria, Argentina, Egypt, Greece, Indonesia,
Korea, Mexico, the Netherlands, Poland, Russia, Serbia, Spain
and Turkey
Source: PMI Financials, PMI estimates and A.C. Nielsen
|
 Marlboro
Architecture
Fresh Line
“Fresh taste sensations”
Gold Line
“Smooth taste and style”
Flavor Line
“Flavor enjoyment”
11 |
 12
Marlboro
Market Shares: EU Region
Source: PMI estimates
Market Shares
0.2
18.2
18.4
Total EU Region
1.0
15.3
16.3
Spain
1.5
9.5
11.0
Poland
1.4
33.2
34.6
Netherlands
0.1
23.1
23.2
Italy
(2.1)
22.1
20.0
Greece
(0.7)
21.8
21.1
Germany
(0.5)
26.2
25.7
France
0.4 pp
24.2 %
24.6 %
Belgium
Variance
Q3, 2009
Q3, 2010 |
 13
L&M
Market Shares: EU Region
Source: PMI estimates
(0.2)
6.6
6.4
Spain
Market Shares
0.6
5.7
6.3
Total EU Region
5.2
13.6
18.8
Slovakia
0.5
5.9
6.4
Portugal
1.4
14.6
16.0
Poland
1.7
7.0
8.7
Netherlands
4.5
0.6
5.1
Greece
0.9
8.3
9.2
Germany
0.3
7.3
7.6
Czech Rep.
0.7 pp
14.2 %
14.9 %
Belgium
Variance
Q3, 2009
Q3, 2010 |
 14
Marlboro
Market Shares: EEMA, Asia and LA&C
a)
QTD August
Source: PMI estimates, Japan Institute of Tobacco, Hankook Research and A.C.
Nielsen Market Shares
0.2
5.4
5.6
Ukraine
(a)
(1.6)
11.1
9.5
Turkey
0.4
8.7
9.1
Serbia
1.3
48.4
49.7
Mexico
0.9
6.0
6.9
Korea
0.4
10.6
11.0
Japan
1.2
4.9
6.1
Egypt
0.4
23.5
23.9
Argentina
8.7 pp
11.5 %
20.2 %
Algeria
Variance
Q3, 2009
Q3, 2010 |
 15
EU Region
Industry volume down by 5.5% in Q3, 2010, driven by
declines in Greece, Poland and Spain
Source: PMI estimates |
 16
EU Region
Industry volume down by 5.5% in Q3, 2010, driven by
declines in Greece, Poland and Spain
PMI market share up 0.2 points in the quarter to 39.1%:
Source: PMI estimates
Market Shares
0.2
38.9
39.1
Total EU Region
0.6
32.1
32.7
Spain
1.5
36.1
37.6
Poland
3.1
42.4
45.5
Netherlands
(0.4)
54.5
54.1
Italy
(0.4)
35.3
34.9
Germany
(0.1)pp
40.1 %
40.0 %
France
Variance
Q3, 2009
Q3, 2010 |
 17
Greece
PMI market share sequentially improving:
Expect Greek market to continue to act as a drag on our
regional profitability growth into the beginning of next
year, while discussions on structural changes to the
excise tax system continue
Source: PMI estimates
Market Shares
37.8
39.2
40.1
Total PMI
9.0
9.1
8.2
Other
0.4
4.0
5.1
L&M
6.7
6.8
6.8
Assos
21.7 %
19.3 %
20.0 %
Marlboro
Q1, 2010
Q2, 2010
Q3, 2010 |
 18
Russia
Source: PMI Financials
PMI volume grew by 1.4% in Q3,
2010, to a record level of 25.4
billion units
Strong performance driven by:
-
Parliament
-
Chesterfield
-
Bond
Street
and
Next
PMI implemented retail price
increases of two to three Rubles
per pack in July
Market stabilizing and consumer
downtrading continues to slow |
 19
Ukraine
Source: PMI estimates, A.C. Nielsen and PMI Financials
Industry volume in Q3, 2010,
down by around 15%, due to:
-
Trade purchases in June ahead
of tax increase
-
Market contraction due to
continuous price increases
Shares gains for premium
Marlboro
and mid-price
Chesterfield,
more
than
offset
by
share losses in low-price
segment
Pricing and mix improvement
enabled us to grow profitability
strongly in Q3, 2010 |
 20
Turkey
Total market estimated to be down about 6% in Q3, 2010
PMI market share improving:
Source: PMI estimates and A.C. Nielsen
Market Shares
41.1
40.9
41.8
Total PMI
6.6
5.9
5.8
Other
12.2
13.3
13.5
Lark
5.2
5.7
5.8
Muratti
17.1 %
16.0 %
16.7 %
Marlboro / Parliament
Q1, 2010
Q2, 2010
Q3, 2010 |
 21
PMI shipments down 3.5 billion units in Q3, 2010, while sales
by our distributor to the trade rose by 4.0 billion units
We estimate there was a build-up of stock of some ten days at
retail trade and three weeks with consumers
Consumer reaction to price increases uncertain:
Despite unprecedented price increases, cigarettes remain
relatively affordable and, therefore, we are optimistic that our
profitability will be enhanced going forward
Japan
Source: PMI Financials and Sojitz
(Marlboro,
Yen/pack)
New
Old
Variance
% Change
Retail Selling Price
440
320
120
37.5
Retail Margin
44
32
12
37.5
Consumption Tax
21
15
6
37.5
Excise Taxes
245
175
70
40.0
Price to Trade
130
98
32
33.0 |
 22
Indonesia
Industry volume estimated to be up 3.9% in Q3, 2010
PMI shipment volume increased by 3.1% in Q3, 2010
A
Mild
temporarily
under
share
pressure
after
passing
the
IDR 10,000 / pack price point
PMI profitability grew at a double-digit rate in Q3, 2010
Source: PMI estimates, PMI Financials and A.C. Nielsen
0.6
5.1
5.7
Other
Market Shares
(0.2)
29.2
29.0
Total PMI
(0.1)
4.5
4.4
Marlboro
-
7.8
7.8
Dji
Sam Soe
(0.7)pp
11.8 %
11.1 %
A
Mild
Variance
Q3, 2009
Q3, 2010 |
 23
Korea
PMI shipment volume increased by 9.7% in Q3, 2010
As elsewhere in the world, PMI continues to advocate for
adoption of system of regular, moderate excise tax
increases
Source: PMI Financials and Hankook Research
-
1.1
1.1
Lark
Market Shares
2.4
14.6
17.0
Total PMI
0.3
3.0
3.3
Virginia Slims
1.2
4.5
5.7
Parliament
0.9 pp
6.0 %
6.9 %
Marlboro
Variance
Q3, 2009
Q3, 2010 |
 24
Latin America & Canada Region
Overall industry volume in key markets stable
Volume decline in Q3, 2010, of 1.7%
PMI and Marlboro
market share increased in both
Argentina and Mexico:
Excluding currency and acquisitions, OCI increased 2.2%
in Q3, 2010, driven by higher prices, partly offset by the
lower volumes and an unfavorable mix in Canada
Source: PMI Financials and PMI estimates
Market Shares
1.3
48.4
49.7
Mexico –
Marlboro
1.2
69.4
70.6
Mexico –
PMI
0.4
23.5
23.9
Argentina –
Marlboro
1.8 pp
73.3 %
75.1 %
Argentina –
PMI
Variance
Q3, 2009
Q3, 2010 |
 25
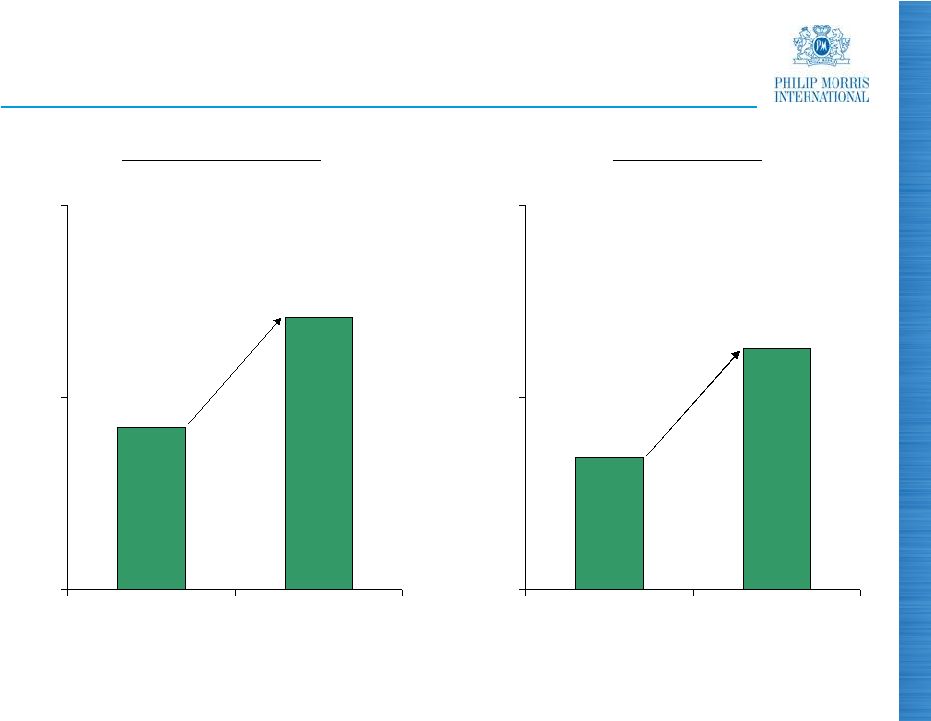
Cash Flow
(a)
Free cash flow equals net cash provided by operating activities less capital
expenditures Source: PMI Financials
Operating Cash Flow
Free Cash Flow
(a)
($ million)
($ million)
+30.9%
+33.6%
1,846
2,417
1,000
2,000
3,000
Q3
Q3
1,686
2,253
1,000
2,000
3,000
Q3
Q3
2009
2010
2009
2010 |
 26
Cumulative Operating Cash Flow (2008-2010)
2008
2009
2010
($ billion)
Source: PMI Financials
Forecast
Results
YTD Sept
Full Year
6.6
7.9
7.3
7.9
7.8
21.7
23.7
7.9
March 2008
Actual |
 27
Shareholder Returns: Share Repurchases
$5 billion allocated for share repurchases for full year
2010, $1 billion above level originally foreseen
$1.1 billion spent in Q3, 2010, to purchase 20.7 million
shares
$3.9 billion spent September YTD to purchase 78.5
million shares
Source: PMI Financials |
 28
Shareholder Returns: Dividends
Quarterly dividend increased in September by 10.3% to
$0.64 ($2.56 annualized)
Since March 2008 spin, dividend has been raised in total
by 39%
Dividend yield currently at 4.5%
Source: PMI Financials |
 29
Summary
(a)
Excluding China
Source: PMI Financials and PMI estimates
Strong business momentum going into Q4, 2010
2010 EPS guidance raised and narrowed to a reported diluted range
of $3.90 to $3.95, representing a growth rate of approximately 20% to
22% compared to 2009
Market leadership and growing volume and share in emerging
markets
(a)
Marlboro
performing well, with share up in the EU Region in the third
quarter, and up or stable in the other three Regions
Pricing power remains strong due to our brand leadership and broad
portfolio
Cost outlook improving
Share repurchases increased to $5 billion for full year 2010
Dividend raised by 10.3% in September |
 Questions & Answers
2010 Third-Quarter
Earnings Results |
 31
PHILIP MORRIS INTERNATIONAL INC. and Subsidiaries
Reconciliation of Non-GAAP Measures
Adjustments for the Impact of Currency and Acquisitions
For the Quarters Ended September 30,
($ in millions)
(Unaudited)
(1)
Represents the business combination in the Philippines
Reported Net
Revenues
Less
Excise
Taxes
Reported Net
Revenues
excluding
Excise Taxes
Less
Currency
Reported Net
Revenues
excluding
Excise Taxes
& Currency
Less
Acquisi-
tions
Reported Net
Revenues
excluding
Excise Taxes,
Currency &
Acquisitions
Reported
Net
Revenues
Less
Excise
Taxes
Reported Net
Revenues
excluding
Excise Taxes
Reported
Reported
excluding
Currency
Reported
excluding
Currency &
Acquisitions
7,045
$
4,906
$
2,139
$
(226)
$
2,365
$
-
$
2,365
$
European Union
7,783
$
5,375
$
2,408
$
(11.2)%
(1.8)%
(1.8)%
4,184
2,288
1,896
(37)
1,933
29
1,904
EEMA
3,722
1,892
1,830
3.6%
5.6%
4.0%
3,629
1,796
1,833
99
1,734
146
(1)
1,588
Asia
3,170
1,519
1,651
11.0%
5.0%
(3.8)%
2,078
1,332
746
26
720
-
720
Latin America & Canada
1,898
1,200
698
6.9%
3.2%
3.2%
16,936
$
10,322
$
6,614
$
(138)
$
6,752
$
175
$
6,577
$
PMI Total
16,573
$
9,986
$
6,587
$
0.4%
2.5%
(0.2)%
Reported
Operating
Companies
Income
Less
Currency
Reported
Operating
Companies
Income
excluding
Currency
Less
Acquisi-
tions
Reported
Operating
Companies
Income
excluding
Currency &
Acquisitions
Reported
Operating
Companies
Income
Reported
Reported
excluding
Currency
Reported
excluding
Currency &
Acquisitions
1,113
$
(106)
$
1,219
$
-
$
1,219
$
European Union
1,267
$
(12.2)%
(3.8)%
(3.8)%
856
32
824
9
815
EEMA
761
12.5%
8.3%
7.1%
690
79
611
36
(1)
575
Asia
653
5.7%
(6.4)%
(11.9)%
244
15
229
(2)
231
Latin America & Canada
226
8.0%
1.3%
2.2%
2,903
$
20
$
2,883
$
43
$
2,840
$
PMI Total
2,907
$
(0.1)%
(0.8)%
(2.3)%
2010
2009
% Change in Reported Operating
Companies Income
2010
2009
% Change in Reported Net Revenues
excluding Excise Taxes |
 32
PHILIP MORRIS INTERNATIONAL INC. and Subsidiaries
Reconciliation of Non-GAAP Measures
Reconciliation of Reported Operating Companies Income to Adjusted Operating
Companies Income & Reconciliation of Adjusted Operating Companies Income
Margin, excluding Currency and Acquisitions For the Quarters Ended September
30, ($ in millions)
(Unaudited)
(1)
Represents the business combination in the Philippines
(2)
For the calculation of net revenues excluding excise taxes, currency and
acquisitions refer to previous slide Reported
Operating
Companies
Income
Less
Asset
Impairment &
Exit Costs
Adjusted
Operating
Companies
Income
Less
Currency
Adjusted
Operating
Companies
Income
excluding
Currency
Less
Acquisi-
tions
Adjusted
Operating
Companies
Income
excluding
Currency &
Acquisitions
Reported
Operating
Companies
Income
Less
Asset
Impairment &
Exit Costs
Adjusted
Operating
Companies
Income
Adjusted
Adjusted
excluding
Currency
Adjusted
excluding
Currency &
Acquisitions
1,113
$
(20)
$
1,133
$
(106)
$
1,239
$
-
$
1,239
$
European Union
1,267
$
(1)
$
1,268
$
(10.6)%
(2.3)%
(2.3)%
856
-
856
32
824
9
815
EEMA
761
-
761
12.5%
8.3%
7.1%
690
-
690
79
611
36
(1)
575
Asia
653
-
653
5.7%
(6.4)%
(11.9)%
244
-
244
15
229
(2)
231
Latin America & Canada
226
-
226
8.0%
1.3%
2.2%
2,903
$
(20)
$
2,923
$
20
$
2,903
$
43
$
2,860
$
PMI Total
2,907
$
(1)
$
2,908
$
0.5%
(0.2)%
(1.7)%
% Points Change
Adjusted
Operating
Companies
Income
excluding
Currency
Net Revenues
excluding
Excise Taxes
& Currency
(2)
Adjusted
Operating
Companies
Income
Margin
excluding
Currency
Adjusted
Operating
Companies
Income
excluding
Currency &
Acquisitions
Net Revenues
excluding
Excise Taxes,
Currency &
Acquisitions
(2)
Adjusted
Operating
Companies
Income
Margin
excluding
Currency &
Acquisitions
Adjusted
Operating
Companies
Income
Net Revenues
excluding
Excise
Taxes
(2)
Adjusted
Operating
Companies
Income
Margin
Adjusted
Operating
Companies
Income
Margin
excluding
Currency
Adjusted
Operating
Companies
Income
Margin
excluding
Currency &
Acquisitions
1,239
$
2,365
$
52.4%
1,239
$
2,365
$
52.4%
European Union
1,268
$
2,408
$
52.7%
(0.3)
(0.3)
824
1,933
42.6%
815
1,904
42.8%
EEMA
761
1,830
41.6%
1.0
1.2
611
1,734
35.2%
575
1,588
36.2%
Asia
653
1,651
39.6%
(4.4)
(3.4)
229
720
31.8%
231
720
32.1%
Latin America & Canada
226
698
32.4%
(0.6)
(0.3)
2,903
$
6,752
$
43.0%
2,860
$
6,577
$
43.5%
PMI Total
2,908
$
6,587
$
44.1%
(1.1)
(0.6)
% Change in Adjusted Operating
Companies Income
2009
2010
2009
2010 |
 33
PHILIP MORRIS INTERNATIONAL INC. and Subsidiaries
Reconciliation of Non-GAAP Measures
Reconciliation of Reported Diluted EPS to Adjusted Diluted EPS and Adjusted
Diluted EPS, excluding Currency For the Quarters Ended September 30,
(Unaudited)
2010
2009
% Change
Reported Diluted EPS
0.99
$
0.93
$
6.5%
Adjustments:
Asset impairment and exit costs
0.01
-
Adjusted Diluted EPS
1.00
$
0.93
$
7.5%
Less:
Currency Impact
0.02
Adjusted Diluted EPS, excluding Currency
0.98
$
0.93
$
5.4% |
 34
PHILIP MORRIS INTERNATIONAL INC. and Subsidiaries
Reconciliation of Non-GAAP Measures
Adjustments for the Impact of Currency and Acquisitions
For the Nine Months Ended September 30,
($ in millions)
(Unaudited)
(1)
Represents the business combination in the Philippines
Reported Net
Revenues
Less
Excise
Taxes
Reported Net
Revenues
excluding
Excise Taxes
Less
Currency
Reported Net
Revenues
excluding
Excise Taxes
& Currency
Less
Acquisi-
tions
Reported Net
Revenues
excluding
Excise Taxes,
Currency &
Acquisitions
Reported
Net
Revenues
Less
Excise
Taxes
Reported Net
Revenues
excluding
Excise Taxes
Reported
Reported
excluding
Currency
Reported
excluding
Currency &
Acquisitions
21,053
$
14,435
$
6,618
$
(6)
$
6,624
$
3
$
6,621
$
European Union
20,988
$
14,313
$
6,675
$
(0.9)%
(0.8)%
(0.8)%
11,665
6,134
5,531
105
5,426
80
5,346
EEMA
9,953
5,031
4,922
12.4%
10.2%
8.6%
11,094
5,265
5,829
484
5,345
377
(1)
4,968
Asia
8,974
4,160
4,814
21.1%
11.0%
3.2%
6,094
3,901
2,193
151
2,042
-
2,042
Latin America & Canada
5,157
3,250
1,907
15.0%
7.1%
7.1%
49,906
$
29,735
$
20,171
$
734
$
19,437
$
460
$
18,977
$
PMI Total
45,072
$
26,754
$
18,318
$
10.1%
6.1%
3.6%
Reported
Operating
Companies
Income
Less
Currency
Reported
Operating
Companies
Income
excluding
Currency
Less
Acquisi-
tions
Reported
Operating
Companies
Income
excluding
Currency &
Acquisitions
Reported
Operating
Companies
Income
Reported
Reported
excluding
Currency
Reported
excluding
Currency &
Acquisitions
3,280
$
(81)
$
3,361
$
2
$
3,359
$
European Union
3,397
$
(3.4)%
(1.1)%
(1.1)%
2,412
74
2,338
28
2,310
EEMA
1,982
21.7%
18.0%
16.5%
2,259
263
1,996
63
(1)
1,933
Asia
1,933
16.9%
3.3%
-
699
69
630
(2)
632
Latin America & Canada
452
54.6%
39.4%
39.8%
8,650
$
325
$
8,325
$
91
$
8,234
$
PMI Total
7,764
$
11.4%
7.2%
6.1%
2010
2009
% Change in Reported Operating
Companies Income
2010
2009
% Change in Reported Net Revenues
excluding Excise Taxes |
 35
PHILIP MORRIS INTERNATIONAL INC. and Subsidiaries
Reconciliation of Non-GAAP Measures
Reconciliation of Reported Operating Companies Income to Adjusted Operating
Companies Income & Reconciliation of Adjusted Operating Companies Income
Margin, excluding Currency and Acquisitions For the Nine Months Ended
September 30, ($ in millions)
(Unaudited)
(1)
Represents the business combination in the Philippines
(2)
Represents 2009 Colombian investment and cooperation agreement charge
(3)
For the calculation of net revenues excluding excise taxes, currency and
acquisitions refer to previous slide Reported
Operating
Companies
Income
Less
Asset
Impairment &
Exit Costs
Adjusted
Operating
Companies
Income
Less
Currency
Adjusted
Operating
Companies
Income
excluding
Currency
Less
Acquisi-
tions
Adjusted
Operating
Companies
Income
excluding
Currency &
Acquisitions
Reported
Operating
Companies
Income
Less
Asset
Impairment,
Exit Costs &
Other
Adjusted
Operating
Companies
Income
Adjusted
Adjusted
excluding
Currency
Adjusted
excluding
Currency &
Acquisitions
3,280
$
(20)
$
3,300
$
(81)
$
3,381
$
2
$
3,379
$
European Union
3,397
$
(3)
$
3,400
$
(2.9)%
(0.6)%
(0.6)%
2,412
-
2,412
74
2,338
28
2,310
EEMA
1,982
-
1,982
21.7%
18.0%
16.5%
2,259
-
2,259
263
1,996
63
(1)
1,933
Asia
1,933
-
1,933
16.9%
3.3%
-
699
-
699
69
630
(2)
632
Latin America & Canada
452
(135)
(2)
587
19.1%
7.3%
7.7%
8,650
$
(20)
$
8,670
$
325
$
8,345
$
91
$
8,254
$
PMI Total
7,764
$
(138)
$
7,902
$
9.7%
5.6%
4.5%
% Points Change
Adjusted
Operating
Companies
Income
excluding
Currency
Net Revenues
excluding
Excise Taxes
& Currency
(3)
Adjusted
Operating
Companies
Income
Margin
excluding
Currency
Adjusted
Operating
Companies
Income
excluding
Currency &
Acquisitions
Net Revenues
excluding
Excise Taxes,
Currency &
Acquisitions
(3)
Adjusted
Operating
Companies
Income
Margin
excluding
Currency &
Acquisitions
Adjusted
Operating
Companies
Income
Net Revenue
excluding
Excise
Taxes
(3)
Adjusted
Operating
Companies
Income
Margin
Adjusted
Operating
Companies
Income
Margin
excluding
Currency
Adjusted
Operating
Companies
Income
Margin
excluding
Currency &
Acquisitions
3,381
$
6,624
$
51.0%
3,379
$
6,621
$
51.0%
European Union
3,400
$
6,675
$
50.9%
0.1
0.1
2,338
5,426
43.1%
2,310
5,346
43.2%
EEMA
1,982
4,922
40.3%
2.8
2.9
1,996
5,345
37.3%
1,933
4,968
38.9%
Asia
1,933
4,814
40.2%
(2.9)
(1.3)
630
2,042
30.9%
632
2,042
31.0%
Latin America & Canada
587
1,907
30.8%
0.1
0.2
8,345
$
19,437
$
42.9%
8,254
$
18,977
$
43.5%
PMI Total
7,902
$
18,318
$
43.1%
(0.2)
0.4
2009
2010
2009
2010
% Change in Adjusted Operating
Companies Income |
 36
PHILIP MORRIS INTERNATIONAL INC. and Subsidiaries
Reconciliation of Non-GAAP Measures
Reconciliation of Reported Diluted EPS to Adjusted Diluted EPS and Adjusted
Diluted EPS, excluding Currency For the Nine Months Ended September 30,
(Unaudited)
2010
2009
% Change
Reported Diluted EPS
2.96
$
2.44
$
21.3%
Adjustments:
Colombian investment and cooperation agreement charge
-
0.04
Tax items
(0.07)
-
Asset impairment and exit costs
0.01
-
Adjusted Diluted EPS
2.90
$
2.48
$
16.9%
Less:
Currency Impact
0.11
Adjusted Diluted EPS, excluding Currency
2.79
$
2.48
$
12.5% |
 37
PHILIP MORRIS INTERNATIONAL INC. and Subsidiaries
Reconciliation of Non-GAAP Measures
Reconciliation
of
Operating
Cash
Flow
to
Free
Cash
Flow
and
Free
Cash
Flow,
excluding
Currency
Reconciliation of Operating Cash Flow to Operating Cash Flow, excluding
Currency For the Quarters Ended September 30,
($ in millions)
(Unaudited)
(1) Operating Cash Flow
For the Quarters Ended
September 30,
2010
2009
% Change
Net
cash
provided
by
operating
activities
(a)
2,417
$
1,846
$
30.9%
Less:
Capital expenditures
164
160
Free cash flow
2,253
$
1,686
$
33.6%
Less:
Currency impact
(232)
Free cash flow, excluding Currency
2,485
$
1,686
$
47.4%
For the Quarters Ended
September 30,
2010
2009
% Change
Net
cash
provided
by
operating
activities
(a)
2,417
$
1,846
$
30.9%
Less:
Currency impact
(234)
Net cash provided by operating activities,
excluding Currency
2,651
$
1,846
$
43.6% |
 2010
Third-Quarter Earnings Results
October 21, 2010 |