Attached files
| file | filename |
|---|---|
| 8-K - GOLD HILLS MINING, LTD. | v199553_8k.htm |
| EX-99.3 - GOLD HILLS MINING, LTD. | v199553_ex99-3.htm |
| EX-99.1 - GOLD HILLS MINING, LTD. | v199553_ex99-1.htm |
Report
to:
Ardent
Mines Ltd. and Rio São Pedro Mineração Ltda.
WEATHERED
ORES OF THE FAZENDA LAVRAS GOLD
PROPERTY,
PARACATU, MINAS GERAIS, BRAZIL
prepared
by
João
Batista G. Teixeira
Geologist,
PhD, P.Geo.
September,
2010
Summary
|
Purpose
|
2
|
|
Scope
|
2
|
|
Disclaimer
|
3
|
|
Sources
of Information
|
3
|
|
The
Property
|
4
|
|
Regional
Geology
|
7
|
|
Local
Geology
|
8
|
|
Deposit
Type
|
10
|
|
Gold
Mining in Morro do Ouro
|
13
|
|
Early
Mining
|
13
|
|
Operation
of Rio Tinto Zinc
|
13
|
|
Operation
of Kinross Gold Inc.
|
15
|
|
Historical
Estimates (Kinross)
|
17
|
|
Current
Estimates (Kinross)
|
18
|
|
Mineral
Processing (Kinross)
|
18
|
|
Gold
Exploration at Fazenda Lavras
|
20
|
|
Early
Works
|
20
|
|
Exploration
of Weathered Deposits
|
20
|
|
Bulk
Sample and Gold Recovery
|
20
|
|
Recent
Exploration
|
21
|
|
Exploration
of Rio Tinto Zinc
|
24
|
|
Exploration
of Amazon Mining
|
26
|
|
Weathered
Ore Resources
|
26
|
|
Morro
do Ouro
|
26
|
|
Fazenda
Lavras
|
27
|
|
Estimation
of Weathered Ore Resource (Fazenda Lavras)
|
27
|
|
Conclusion
|
29
|
|
Certificate
and Consent
|
30
|
|
List
of Figures
|
|
|
Figure
1 – Location of the Fazenda Lavras gold concession (in red) and adjacent
concessions (Source: DNPM, Sept., 2010)
|
5
|
|
Figure
2 – Mosaic Google Earth image showing locations of the Fazenda Lavras
Property (São Pedro Mineração Ltda.) and of the Morro do Ouro
gold mine (Kinross Brasil Mmineração S.A.)
|
6
|
|
Figure
3 – Regional map of a sector of the Brasília Fold Belt, showing the main
zinc and gold mines and deposits (Source: Misi et al.,
2005).
|
7
|
|
Figure
4 – Satellite image with interpreted traces of regional structures. Barbed
black and red lines mark major east-vergent thrust faults (Source: Coelho
et al., 2008).
|
8
|
|
Figure
5 – Typical sulfide mineralization in boudinage structures of the Morro do
Ouro gold mine (Source: Hanson, 2005).
|
9
|
|
Figure
6 – The same type of mineralized boudinage structures at the Fazenda
Lavras gold deposit (Photo: J.B.G. Teixeira, 2007).
|
9
|
|
Figure
7 – Quartz boudins in the Fazenda Lavras Property (Photo: Y. Munemassa,
2007).
|
10
|
1
|
Figure
8 – Weathered carbonaceous quartz‐sericite
metarhythmite of the Fazenda Lavras Property (Photo: Y. Munemassa,
2007).
|
10
|
|
Figure
9 – Quartz boudins within the carbonaceous metarhythmite (Photo: Y.
Munemassa, 2007).
|
10
|
|
Figure
10 – Conceptual pre-mining weathering profile in the Morro do Ouro gold
mine (Source: Hanson, 2005).
|
12
|
|
Figure
11 – Early gold mining of the weathered profile at the Fazenda Lavras
Property (Photo: Y. Munemassa, 2007).
|
12
|
|
Figure
12 – Panoramic view of the Morro do Ouro open pit mine (Source: Puhlmann
et al., 2006). The town of Paracatu is in the foreground. In
the left side of the horizon is the Fazenda Lavras
Property.
|
16
|
|
Figure
13 – Drill section 07N Morro do Ouro mine, looking north
(Source: Hanson, 2005).
|
17
|
|
Figure
14 – Drill Section 05N Morro do Ouro mine, looking north (Source: Hanson,
2005).
|
17
|
|
Figure
15 – Gold mined in the Morro do Ouro as of October 31, 2005 (Source:
Hanson, 2007).
|
18
|
|
Figure
16 – Simplified flow sheet existing Morro do Ouro mine process
plant
|
19
|
|
Figure
17 – Simplified geological map of the Fazenda Lavras Property showing RTZ
drill-hole locations and contours of geophysical anomalies from airborne
surveys (Sources: Arantes & Associates, 1997 and Figueira et al.,
2002).
|
22
|
|
Figure
18 – Simplified geological sections of the Fazenda Lavras Property. For
locations see Figure 17 (Source: Arantes & Associates,
1997).
|
23
|
Purpose
To review
exploration potential of the weathered ores of the Fazenda Lavras Gold Property
located near Paracatu, Minas Gerais, Brazil.
Scope
At the
request of Ardent Mines Ltd. and Rio São Pedro Mineração Ltda.,
respectively, Dr. João Batista Guimarães Teixeira,
P.Geo. (the Author) was commissioned in September 2010 to prepare a
Technical Report on the Fazenda Lavras Gold Project. The scope of the inquiries
of the report included the following:
|
|
·
|
A
review of historical exploration, in particular, a detailed review of
early exploration conducted by previous tenement
holders.
|
|
|
·
|
Characterization
of the actual potential for the weathered gold
deposits.
|
2
Disclaimer
The
Author did not conduct a fully review of mineral title and ownership, and status
of claims as outlined in this Report was obtained from the web disclosure site
of DNPM, Departamento Nacional de Produção Mineral, at www.dnpm.gov.br.
Sources
of Information
This
report is based on three field visits to the area (July 4-5, 2007, January 8-10,
2010 and September 9-10, 2010) and on the following:
|
|
·
|
MSc
Dissertation, University of Brasília: “Geochemistry of Carbonaceous
Phyllites of the Morro do Ouro Deposit, Paracatu, State of Minas Gerais”,
by B.S. de Almeida (2009).
|
|
|
·
|
Paper
published in Revista Brasileira de Geociências, vol. 38, p.149-165:
”Estilos estruturais e evolução tectônica da porção mineira da bacia
proterozóica do São Francisco”, by J.C.C. Coelho, M.A. Martins-Neto and M.
S. Marinho (2008).
|
|
|
·
|
Consultancy
report: “Geological evaluation of the Rio São Pedro Mineração Ltda.
Property”, by Y. Munemassa (2007).
|
|
|
·
|
Paper
presented at the 7th International Conference on Acid Rock Drainage
(ICARD), March 26-30, 2006, St. Louis MO. R.I. Barnhisel (ed.) Published
by the American Society of Mining and Reclamation (ASMR), 3134 Montavesta
Road, Lexington, KY 40502: “Development and operation of a water balance
at Rio Paracatu Mineração, Brazil”, by T. Puhlmann, C. Voss, J. Esper and
R. D. Amaral (2006).
|
|
|
·
|
Report
prepared for Kinross Gold Corporation, to comply with Canada’s National
Instrument 43-101: “Paracatu Mining Technical Report, Paracatu, Minas
Gerais State, Brazil”, by R.D.
Henderson (2006).
|
|
|
·
|
Report
prepared for Kinross Gold Corporation, to comply with Canada’s National
Instrument 43-101: “Paracatu Mining Technical Report, Paracatu, Minas
Gerais State, Brazil”, by W. Hanson
(2005).
|
3
|
|
·
|
Paper
published in Ore Geology
Reviews, vol. 26, p. 263-304: “Sediment hosted lead–zinc deposits
of the Neoproterozoic Bambuí Group and correlative sequences, São
Francisco Craton, Brazil: A review and a possible metallogenic evolution
model”, by A. Misi, S.S.S. Iyer, C.E.S. Coelho, C.C. G. Tassinari, W.J.S.
Franca-Rocha, I.A. Cunha, A.S.R. Gomes, T.F. Oliveira, J.B.G.Teixeira and
V.M.Conceição Filho (2005).
|
|
|
·
|
Geophysical
report: Interpretação aerogeofísica do prospecto aurífero da Faz. Lavras,
Paracatu – MG. Ralatório Final, by E. P. Figueira, M.Vieira, E. Henrique
and R. Cordani (2002).
|
|
|
·
|
Consultancy
report: “Avaliação Geo-econômica do Prospecto Aurífero da Fazenda Lavras,
Paracatu, Minas Gerais”, by F.F. Silva, R. Moura, E. Lloyd, F.
Gomes, A. Borges, D. Arantes and A.C. Coelho
(2000).
|
|
|
·
|
Consultancy
report: “ Relatório da Fase I – Diagnóstico Técnico e Econômico do Projeto
Fazenda Lavras – Volume I: Texto e Anexos – Volume II: Mapa geológico;
Mapa de trincheiras e furos de sonda; Mapa de cubagem; Boletins de
análises químicas e logs de furos de sondagem; Perfís de cubagem”, by
Arantes & Associates (1997).
|
|
|
·
|
Consultancy
report: “Relatório Final de Pesquisa, Referência DNPM 831.810/86, Alvará
2432/93; Local: Fazenda Lavras; Substância: Ouro; Município: Paracatu;
Estado: Minas Gerais – Volumes I and II”, by A. N. de Figueiredo
(1996).
|
The
Property
The
Fazenda Lavras Property consists of one mineral concession covering an area of
859.5 hectares, which holds the mining permit granted to Rio São Pedro Mineração
Ltda.
The
Property is centered at latitude 17°05’30” South and longitude 46°55’00” West,
which is 10km northwest of the open pit of the Morro do Ouro mine, owned by
Kinross Gold Corporation (Figures 1and 2). The nearest large city is Brasília,
about 230km to the northwest.
4
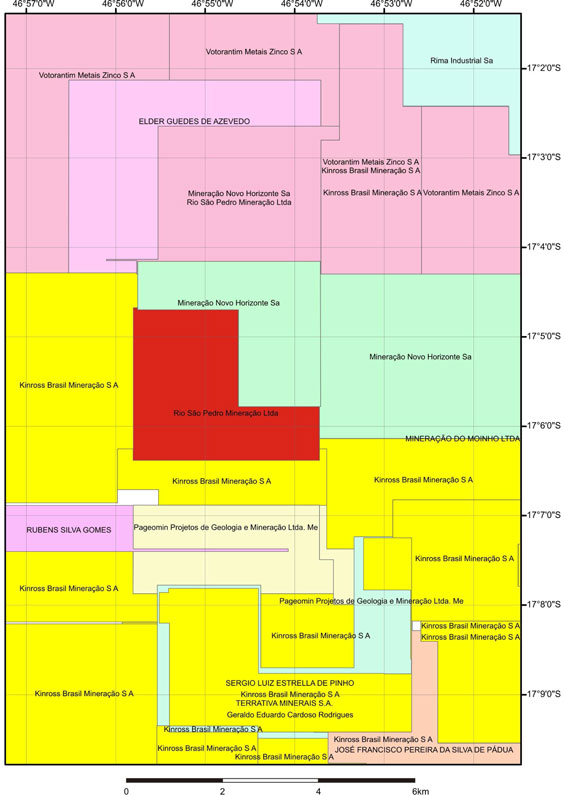
Figure 1
– Location of the Fazenda Lavras gold concession (in red) and adjacent
concessions
(Source:
DNPM, Sept., 2010)
5
Figure 2
– Mosaic Google Earth image showing locations of the Fazenda Lavras Property
(São
Pedro
Mineração Ltda.) and of the Morro do Ouro gold mine (Kinross Brasil
Mmineração
S.A.)
6
Regional
Geology
The
mineralization is hosted by a thick sequence of phyllites belonging to the basal
part of the Neoproterozoic Paracatu Formation and known locally as the Morro do
Ouro Sequence (Figure 3).
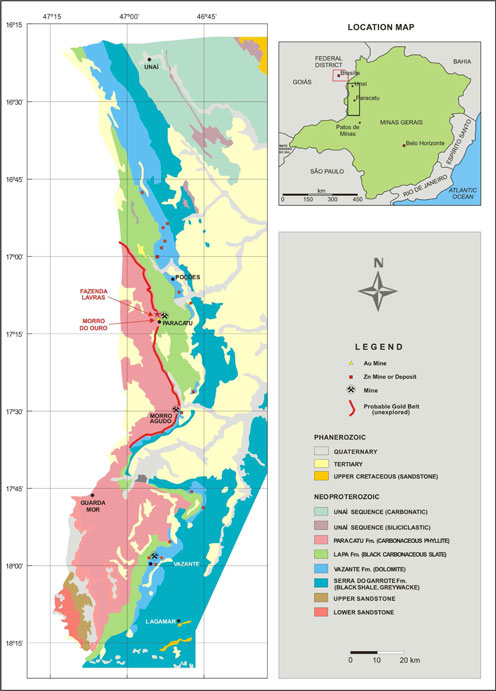
Figure 3
– Regional map of a sector of the Brasília Fold Belt, showing the main zinc and
gold
mines and
deposits (Source: Misi et al., 2005).
7
The
sequence outcrops in a northerly trend in the eastern Brasilia Fold Belt, which,
in turn, forms the western edge of the São Francisco Craton.
The
Brasilia Fold Belt predominantly consists of clastic sediments, which have
undergone lower greenschist grade metamorphism along with significant nappe and
thrust deformation. A series of east-northeast trending thrust faults are
extensively developed along the belt. Metamorphic grade increases towards the
west as the thickness of the fold belt increases.
The
timing of deformation is estimated at between 800-600 Ma during the Brasiliano
orogenic cycle and the mineralization is believed to originate syngenetically
with this period of deformation.
The
geotectonic evolution and the geological characteristics of the region allow one
to believe that the gold mineralizations of the Morro do Ouro mine and of the
Fazenda Lavras deposit belong to the same near N-S thrust related gold belt
located at the base of the Paracatu Formation (Figure 4). Until now this very
interesting gold belt is largely unexplored.
Figure 4
– Satellite image with interpreted traces of regional structures. Barbed black
and red lines mark major east-vergent thrust faults (Source: Coelho et al.,
2008).
Local
Geology
The
phyllites exhibit extensive deformation and feature well developed quartz
boudins and associated sulfide mineralization (Figures 5, 6 and 7). Sericite is
common, likely as a result of extensive metamorphism of the host
rocks.
Primary
sedimentary features and bedding planes are easily recognizable but are
intensively deformed with development of thrusting, bedding plane thrusting,
sygmoidal and boudinage structures (Figures 8 and 9).
Mineralization
is closely related to a period of ductile deformation, associated shearing and
thrust faulting. Overall, the Morro do Ouro sequence has been thrust to the
northeast. Intense, low angle isoclinal folds are commonly
observed.
The
mineralization plunges to the west-southwest at low angles (5 to 20°), and there
is secondary folding with axial planes striking to the northwest resulting in
kink bands and egg box fold pattern in some areas.
8
Figure 5
– Typical sulfide mineralization in boudinage structures of the Morro do Ouro
gold mine (Source: Hanson, 2005).
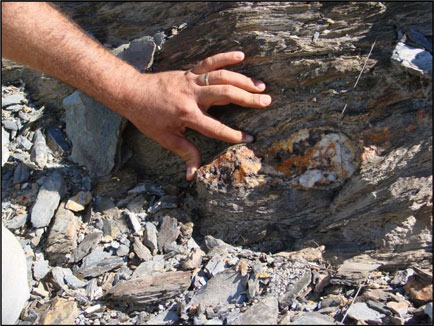
Figure 6
– The same type of mineralized boudinage structures at the Fazenda Lavras gold
deposit (Photo: J.B.G. Teixeira, 2007).
9
Figure 7
– Quartz boudins in the Fazenda Lavras Property (Photo: Y. Munemassa,
2007).
Figure 8
– Weathered carbonaceous quartz‐sericite
metarhythmite of the Fazenda Lavras Property (Photo: Y. Munemassa,
2007).
Figure 9
– Quartz boudins within the carbonaceous metarhythmite (Photo: Y. Munemassa,
2007).
Deposit
Type
The Morro do Ouro mine is the lowest
grade gold operation in the world (0.41g Au/t), notwithstanding, from 2009 it
became the largest gold producer in Brazil. In 2006, Kinross began an
expansion of the mill facilities, with an expected throughput to 61 million
tonnes per annum. Production of gold from the expansion plant began in September
2008. The expansion is expected to extend the life of the mining operation to
2040 (Kinross Gold Inc., Sept. 2010).
10
The Morro
do Ouro orebody is hosted by a shallow southwest dipping structural zone, within
which the Morro do Ouro metasedimentary rocks host abundant
quartz-carbonate-sulfide boudins.
Boudin
occurrence is higher in the central part of the deposit (5%) than on the margins
(2%). The boudins contain a sulfide assemblage dominated by pyrite and
arsenopyrite, with minor sphalerite, galena, pyrrhotite and
chalcopyrite.
Mineralization
in the Morro do Ouro mine is subdivided into four horizons defined by the degree
of oxidation and surface weathering and the associated sulfide mineralization.
These units are, from surface, the “C”, “T”, “B1” and “B2” horizons (Figure
10).
Type “C”
mineralization occurs at surface and extends to 20-40 meters from surface. Type
“C” mineralization is completely altered with no remaining sulfides. It also
features localized laterite development (Figure 11).
The “T”
horizon is generally only a couple of meters thick. It is multicolored and is
essentially marks the transition from the “C” horizon to the “B1”
horizon.
The “B1”
horizon is dark in colour and carbonaceous with less oxidation than the “C”
horizon. Sulfides have been completely oxidized but some fresh sulfide material
is visible in the quartz boudins.
“B2”
mineralization was originally described as unweathered or fresh mineralization
with primary sulfides. The contact between un-mineralized host rock (Type “A”)
and the various mineralized horizons is gradational, occurring over a 10 m wide
zone that is characterized by arsenic values of 200-500 ppm and up to 0.2 g
Au/t.
The Morro
do Ouro deposit is a metamorphic gold system with finely disseminated gold
mineralization hosted within an original bedded sedimentary host (phyllite).
Very fine, evenly distributed gold (associated with sulfides) is finely
disseminated throughout a thinly bedded phyllite (metamorphosed argillaceous
sedimentary rock) of Neoproterozoic age.
Whole
rock geochemistry, x-ray diffractrometry and counts of boudin volumes were used
to investigate geochemical variations within and around the orebody and their
relationship to boudins. Unmineralized carbonaceous phyllites in the footwall of
the orebody are composed of chlorite, muscovite and quartz, with rare quartz
boudins and weak deformation indicators. These rocks have higher values of
SiO2, Zr, V, Cr and Al than the mineralized phyllites..In contrast, mineralized
carbonaceous phyllites are dominated by quartz and muscovite (no chlorite), have
much higher boudin volumes (quartz, siderite and sulfides), have much more
intense deformation and are also enriched in Au, Ag, As, Pb, Zn, C and S
(Almeida, 2009).
11
Figure 10
– Conceptual pre-mining weathering profile in the Morro do Ouro gold mine
(Source: Hanson, 2005).
Figure 11
– Early gold mining of the weathered profile at the Fazenda Lavras Property
(Photo: Y. Munemassa, 2007).
The
phyllites at Morro do Ouro are highly deformed as a result of tectonic
processes. Gold mineralization was introduced syntectonically, the result of
metamorphic alteration during thrusting of the Morro do Ouro sequence over top
of the rocks of the younger Vazante Formation. Metamorphic grade increases from
east to the west.
12
Structural
interpretation suggests that mineralization was precipitated within a high
strain zone where silica and carbonate were scavenged out of the host phyllites
resulting in an increase in graphite content that may have acted as a chemical
trap, precipitating out gold and sulfide mineralization remobilized during
metamorphic alteration of the Morro do Ouro Sequence.
Gold
Mining in Morro do Ouro
Early
Mining
The
mining history of the Paracatu region is closely associated with the activities
of the “bandeirantes”, who prospected for gold in Brazil’s interior, arriving in
the Paracatu region in 1722 after the discovery of gold alluvial
placers.
Alluvial
mining peaked during the second half of the 18th century. The alluvial mining
was not limited to the placer deposits along Riacho Rico (creek), they also
exploited the oxidized ore outcrop on the top of Morro do Ouro hill or the “Hill
of Gold”.
Gold
production declined sharply in the region during the first decade of the 19th
century. From this point forward, production was limited to “garimpeiros”,
subsistence level mining practiced by local inhabitants. Various prospectors
explored the region but economically viable operations were limited as a result
of the low-grade nature of the deposits.
Operation
of Rio Tinto Zinc
Beginning
in 1970, Paracatu attracted some attention from mineral exploration companies
looking for lead and zinc deposits in the area. The interest in the gold of
Morro do Ouro was secondary as the majority of the companies were not attracted
by the gold grade, considered to be too low to be economically
extracted.
13
In 1980,
Rio Tinto Zinc (RTZ), operating in Brazil under the name of Riofinex do Brasil,
joined with Billiton in a partnership to explore land in Brazil. Billiton owned
the Morro do Ouro area but had no interest in investing in the
area.
In 1984
Billiton sold the balance of its shares in the Morro do Ouro area to Riofinex.
Riofinex embarked on a surface exploration program that focused on the oxidized
and weathered horizons of the Moro do Ouro area. At the end of 1984, based on
the data from hundreds of test pits (up to 25 m deep) and further supported by a
total of 44 drill holes, a reserve of 97.5Mt at 0.587g Au/t was
estimated at what is currently known as the Paracatu Mine.
RTZ was
the first company to apply modern exploration methods at Paracatu. Northeast of
Riacho Rico, the deposit had been drilled on a nominal 100×100 meter drill
spacing.
This
estimate only included the superficial oxidized ore, then categorized as type
“C” or “T” ore. Despite the low gold grade, Riofinex’s geologists believed that
profitable extraction of the ore could be realized. In 1985 this was confirmed
by a feasibility study. Total investment up to that period was $7.3 million
including ground acquisition costs, exploration costs, and the cost of the
feasibility study.
Approval
was granted by Rio Tinto to construct a mining project at a capital cost of
approximately US$ 65 million, on the condition that a Brazilian partner could be
secured for the venture. At the end of 1985, RTZ Mineracão, successor to
Riofinex, struck a joint venture agreement with Autram Mineração e Participações
(Autram) to joint venture the project through a new company, Rio Paracatu
Mineração (RPM), with Rio Tinto holding a 51% operating interest and Autram the
remaining 49%.
Autram’s
interest was ceded to TVX Participações who later became TVX Gold Inc. (TVX).
TVX entered into an agreement with Newmont that resulted in Newmont and TVX
holding a 24.5% interest in Paracatu.
In early
2003, TVX acquired Newmont’s 24.5% interest resulting in TVX having a 49%
interest in Paracatu. Almost immediately, Kinross acquired TVX’s interest as
part of the Kinross, TVX, Echo Bay Mines Ltd (EBM), merger
agreement.
Production
at Paracatu commenced in October 1987 treating oxidized and highly weathered ore
from the “C” and “T” ore horizons described above. The first gold bar was poured
in December 1987. The following year, the mine throughput reached the design
capacity of 6.1Mtpa.
14
After
start up, the throughput rate was progressively increased to 13 Mtpa, as a
result of a number of improvement programs. In 1993, an $18.3M Optimization
Project was commissioned providing extra water and flotation capacity for the
circuit.
Throughput
at Paracatu was increased again to 16 Mtpa in 1997 after completion of Expansion
Project I with a capital cost expenditure of $47.3 M.
Expansion
Project II (1999) increased the mill throughput to 20Mtpa after a capital
investment of $6.2M. Due to an increase in ore hardness, throughput has now
fallen to the 17.0Mtpa level.
Total
capital investment to December 31, 2004 totalled $249.4M dollars. This includes
the initial purchase costs of the land, all engineering, the initial
construction costs, later optimization and expansion capital costs, the purchase
of the mining fleet and other smaller capital investments to optimize the
existing project.
In
December 2004, Kinross purchased Rio Tinto’s 51% interest in the RPM mine giving
Kinross a 100% interest in RPM and the Paracatu mine.
Operation
of Kinross Gold Inc.
The Morro
do Ouro mine is operated by Kinross Brasil Mineração S.A., a wholly owned
subsidiary of Kinross Gold Corporation.
The mine
includes an open cast mine, process plant, tailings impoundment area and related
surface infrastructure and support buildings. The planned open pit operation
will developed over an area of 5000 by 2500 meters. Current plant throughput
averages 18Mtpa.
Currently,
mining does not require any waste removal (stripping) and just a limited amount
of explosive is necessary to blast the harder ores prior to excavation (Figure
12).
15
Figure 12
– Panoramic view of the Morro do Ouro open pit mine (Source: Puhlmann et al.,
2006). The town of Paracatu is in the foreground. In the left side of
the horizon is the Fazenda Lavras Property.
The
mineral resource model for Morro do Ouro is developed from a series of oriented
drill sections on which all exploration results have been plotted. Observation
of the drill core is used to define the “C”, “T”, “B1” and “B2” contacts, which
are interpreted on individual sections (Figures 13 and
14).
16
Figure 13
– Drill section 07N Morro do Ouro mine, looking north (Source:
Hanson, 2005).
Figure 14
– Drill Section 05N Morro do Ouro mine, looking north (Source: Hanson,
2005).
Historical
Estimates (Kinross)
The
history at Morro do Ouro indicates continuous growth of the reserve base
reflecting increased geological knowledge and improved process efficiencies.
Figure 15 is a graph showing the changes in contained ounces from the
start of commercial production.
17
Figure 15
– Gold mined in the Morro do Ouro as of October 31, 2005 (Source: Hanson,
2007).
Current
Estimates (Kinross)
The
proven and probable mineral reserve estimate for the Morro do Ouro mine is
summarized in Table 1. The mean specific gravity for mineralized drill cores was
2.77 and the cut off grade used to report mineral reserves was 0.21g
Au/t.
Table 1 -
Gold Reserves for the Morro do Ouro gold mine. (Source: Kinross Gold Inc., Sept.
2010)
|
Tonnes
|
Grade
|
Ounces
|
|||||||
|
Gold
|
(kt)
|
(g/t)
|
(koz)
|
||||||
|
Proven
& Probable Reserves
|
1,320,886
|
0.41
|
17,472
|
Mineral
Processing (Kinross)
Run-of-mine
ore is crushed and sent to blending bins, which feed the grinding circuit of
single stage ball mills. Ball mills are in closed circuit with hydrocyclones. A
portion of the circulating load passes through jigs for gravimetric recovery of
gold (Figure 16).
18
Flotation
is conducted in three stages: flash, scavenger and cleaner for Au and sulfide
recovery. The flotation tails are thickened and then sent to the main tailings
pond.
The
sulfidic flotation concentrates are sent to the hydrometallurgy plant and
average about 20g Au/t. The coarser fraction of this concentrate, about 10 %, is
treated gravimetrically in a Knelson concentrator recovering approximately 20%
of the Au. Concentrate from the Knelson is sent to shaking tables and then on to
the smelting furnace. The finer sulfide concentrate is reground, thickened and
sent to the carbon-in-leach (CIL) circuit. The Au is recovered by electrowinning
and then sent to the smelting furnace.
The
products from CIL and from the shaking tables are calcined and smelted in an
induction furnace resulting in bullion containing 75 to 80% Au and 20 to 25%
Ag.
Figure 16
– Simplified flow sheet existing Morro do Ouro mine process plant
(Source:
Hanson, 2005).
19
Gold
Exploration at Fazenda Lavras
Early
Works
Gold was
first recovered from the local streams in 1733. When settlers arrived during the
18th century they worked the alluvial deposits and later the soft bedrock of the
Morro do Ouro and surrounding areas. Old workings, excavations and washed
gravels are still visible on the ground of Fazenda Lavras.
Exploration
of Weathered Deposits
The
Fazenda Lavras deposit was first worked by Mineração Serra do Encanto Ltda. The
final exploration report was presented to the DNPM on August 1996 (Relatório
Final de Pesquisa. Reference: DNPM 831810/86. Alvará: 2432/93).
The
following reserves were calculated:
|
|
·
|
Proven:
16,464,350t @ 0.791g Au/t.
|
|
|
·
|
Indicated:
8,349,464t @ 0.618g Au/t.
|
|
|
·
|
Inferred:
7,326,131t @ 0.618g Au/t.
|
The
reserves were calculated using the analytical results of 11 diamond drill holes.
The maximum depth was observed on hole F5-08 (46 meters). The average Au values
obtained on 135 core samples from 15 diamond drill holes was 0.67g Au/t. The
assays were carried out at METAGO laboratory (currently FUNMINERAL), in Goiânia,
Goiás.
Bulk
Sample and Gold Recovery
During
the 1990’s a small plant was set up to bulk sample the Fazenda Lavras Property
bedrock. The first pass in 1993 processed 22 thousand tonnes of ore and
recovered 14.78kg of gold, for an approximate average grade of 0.67g Au/t.
During 1995 the same plant processed 30 thousand tonnes of ore, but the total
gold recovered has not been reported.
20
Results,
however, were encouraging enough that in 1997 a feasibility study was initiated
to investigate the technical and economic aspects of the Fazenda Lavras
deposit.
Recent
Exploration
A summary
of the modern sequential exploration done at the Fazenda Lavras Property is
presented below:
|
|
·
|
Geological
mapping, pitting, trenching and shallow drilling (average depth of 15
meters), described by Figueiredo
(1996).
|
|
|
·
|
Geological
mapping and detailed investigation of the gold mineralization, described
by Arantes & Associates (1997).
|
|
|
·
|
Geological
mapping, drilling (10 diamond-drill holes) and geophysical survey
(airborne and ground magnetometry), described by Silva et al.
(2000).
|
|
|
·
|
Arantes
& Associates (1997) presented a geological map (Figure 17) and a
series of interpreted cross sections of the Fazenda Lavras Property
(Figure 18).
|
Based on
the previous work commented above and on his own field observations, the present
Author concluded that the geological units, structures and gold mineralization
of the Fazenda Lavras deposit are quite similar to those of the Morro do Ouro
gold mine.
The
low-grade gold mineralization is hosted by a thick sequence of carbonaceous
phyllites belonging to the basal part of the Neoproterozoic Paracatu Formation
(Morro do Ouro Sequence).
21
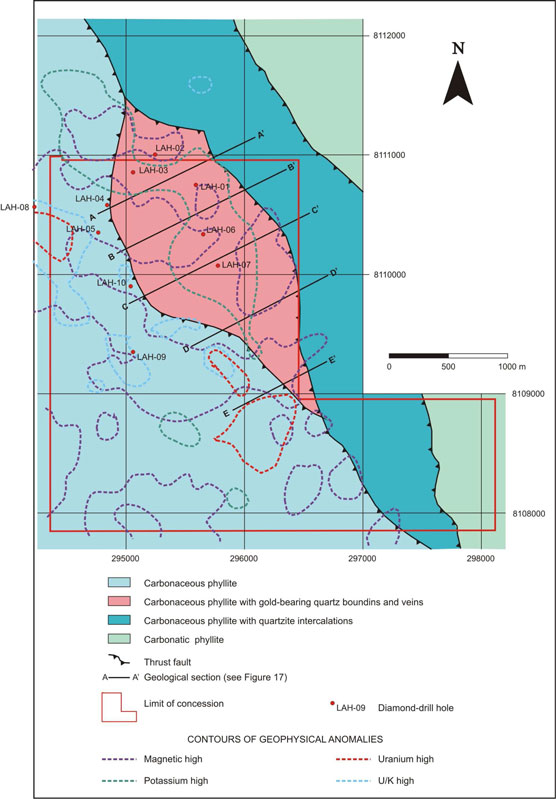
Figure 17
– Simplified geological map of the Fazenda Lavras Property showing RTZ
drill-hole
locations and contours of geophysical anomalies from airborne surveys
(Sources:
Arantes & Associates, 1997 and Figueira et al., 2002).
22
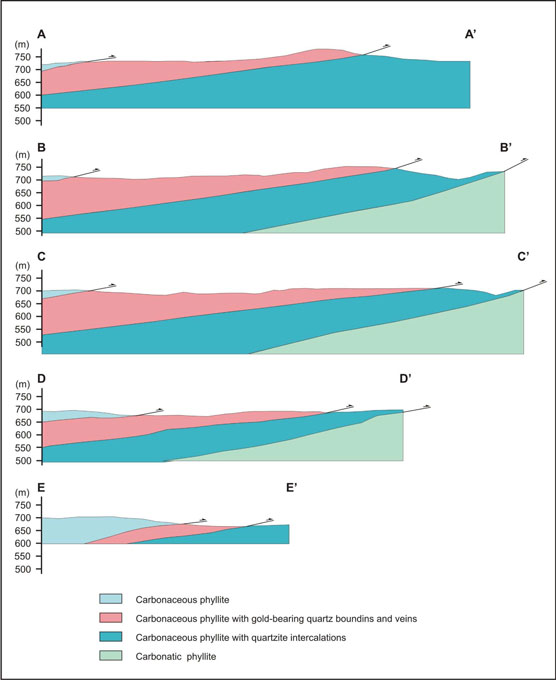
Figure 18
– Simplified geological sections of the Fazenda Lavras Property. For
locations
see Figure 17 (Source: Arantes & Associates, 1997).
23
Exploration
of Rio Tinto Zinc
Subsequently,
the Fazenda Lavras deposit was explored by RTDM a Brazilian exploration branch
of Rio Tinto Zinc (RTZ) in 2000 (Silva et al., 2000).
A diamond
core drilling program (1,613.57 m) was distributed in ten holes (Figure 17 and
Table 2).
A total
of 1,565 core samples were sent to the Bondar Clegg lab (now ALS Chemex) for
gold assays by FA/AA (50 grams). Standard controls samples were inserted on the
batches sent to the lab (total of 30 samples). The assays of the core samples
yielded very low Au values (Table 3) and no resource estimation was carried out
by RTZ.
Table 2 –
List of RTDM diamond drill holes in the Fazenda Lavras Property (Source: Silva
et al, 2000)
|
DDH
|
UTM
|
Altitude
of
collar
(m)
|
Inclination
|
Final
depth
(m)
|
Number
of
samples
|
Number
of
analyses
|
||||||||||||
|
LAH-01
|
295849.166
8110558.337
|
781.062
|
90º | 50.80 | 51 | 51 | ||||||||||||
|
LAH-02
|
2955512.173
8110809.173
|
790.792
|
90º | 67.50 | 67 | 67 | ||||||||||||
|
LAH-03
|
295329.529
8110662.340
|
765.918
|
90º | 135.10 | 135 | 135 | ||||||||||||
|
LAH-04
|
295113.692
8110391.714
|
758.444
|
90º | 169.05 | 169 | 157 | ||||||||||||
|
LAH-05
|
295040.550
8110163.771
|
749.759
|
90º | 166.68 | 167 | 153 | ||||||||||||
|
LAH-06
|
295910.469
8110149.908
|
749.415
|
90º | 159.75 | 160 | 149 | ||||||||||||
|
LAH-07
|
296031.999
8109888.920
|
734.245
|
90º | 151.50 | 151 | 151 | ||||||||||||
|
LAH-08
|
294512.047
8110376.374
|
768.792
|
90º | 229.50 | 229 | 229 | ||||||||||||
|
LAH-09
|
295330.468
8109174.377
|
746.194
|
90º | 248.54 | 248 | 248 | ||||||||||||
|
LAH-10
|
295308.711
8109717.768
|
|
742.862
|
70º/140º | 235.15 | 235 | 225 | |||||||||||
|
TOTAL
|
1,613.57 | 1,612 | 1,565 | |||||||||||||||
24
Table 3 –
Gold results of RTDM diamond drill holes in the Fazenda Lavras Property (Source:
Silva et al, 2000)
|
DDH
(LAH)
|
SAMPLE
(LAT)
|
Depth
(m)
|
Interval
(m)
|
Au
(ppm)
|
Best
sample
in
interval
|
|||||
|
01
|
12
– 17
|
11.00
– 17.00
|
6
|
0.329
|
LAT-15
1m @ 1.036 ppm
|
|||||
|
01
|
01
|
0.00
– 1.00
|
1
|
0.136
|
||||||
|
01
|
07
|
6.00
– 7.00
|
1
|
0.141
|
||||||
|
01
|
46
|
45.00
– 46.00
|
1
|
0.134
|
||||||
|
01
|
48
– 49
|
47.00
– 49.00
|
2
|
0.109
|
LAT-48
1m @ 0.122 ppm
|
|||||
|
02
|
65
– 68
|
13.00
– 17.00
|
4
|
0.245
|
LAT-65
1m @ 0.520 ppm
|
|||||
|
02
|
54
|
2.00
– 3.00
|
1
|
0.143
|
||||||
|
02
|
83
|
31.00
– 32.00
|
1
|
0.128
|
||||||
|
03
|
149
– 150
|
30.00
– 32.00
|
2
|
0.253
|
LAT-150
1m @ 0.356 ppm
|
|||||
|
04
|
256
– 259
|
2.00
– 6.00
|
4
|
0.130
|
LAT-259
1m @ 0.173 ppm
|
|||||
|
04
|
262
– 264
|
8.00
– 11.00
|
3
|
0.112
|
LAT-263
1m @ 0.136 ppm
|
|||||
|
04
|
266
|
12.00
– 13.00
|
1
|
0.111
|
||||||
|
04
|
276
– 280
|
22.00
– 27.00
|
5
|
0.681
|
LAT-279
1m @ 1.004 ppm
|
|||||
|
04
|
282
– 289
|
28.00
– 36.00
|
8
|
0.250
|
LAT-283
1m @ 0.436 ppm
|
|||||
|
04
|
331
|
77.00
– 78.00
|
1
|
0.218
|
||||||
|
04
|
350
|
96.00
– 97.00
|
1
|
0.610
|
||||||
|
05
|
417
– 418
|
6.00
– 8.00
|
2
|
0.135
|
LAT-418
1m @ 0.138 ppm
|
|||||
|
05
|
438
|
27.00
– 28.00
|
1
|
0.112
|
||||||
|
05
|
454
|
43.00
– 44.00
|
1
|
0.566
|
||||||
|
05
|
465
– 470
|
54.00
– 60.00
|
6
|
0.188
|
LAT-469
1m @ 0.592 ppm
|
|||||
|
06
|
573
|
9.00
– 10.00
|
1
|
0.298
|
||||||
|
06
|
583
|
19.00
– 20.00
|
1
|
0.162
|
||||||
|
06
|
586
|
22.00
– 23.00
|
1
|
0.398
|
||||||
|
06
|
592
|
28.00
– 29.00
|
1
|
0.171
|
||||||
|
06
|
599
|
35.00
– 36.00
|
1
|
0.255
|
||||||
|
06
|
609
|
45.00
– 46.00
|
1
|
0.112
|
||||||
|
06
|
623
|
59.00
– 60.00
|
1
|
0.262
|
||||||
|
06
|
626
|
62.00
– 63.00
|
1
|
0.144
|
||||||
|
07
|
713
|
0.00
– 1.00
|
1
|
0.162
|
||||||
|
07
|
718
|
5.00
– 6.00
|
1
|
0.283
|
||||||
|
07
|
730
– 733
|
17.00
– 21.00
|
4
|
0.120
|
LAT-730
1m @ 0.152 ppm
|
|||||
|
07
|
743
|
30.00
– 31.00
|
1
|
0.145
|
||||||
|
07
|
775
|
62.00
– 63.00
|
1
|
0.186
|
||||||
|
08
|
973
|
109.00
– 110.00
|
1
|
0.289
|
||||||
|
08
|
983
|
119.00
– 120.00
|
1
|
0.372
|
||||||
|
08
|
987
– 990
|
123.00
– 127.00
|
4
|
0.120
|
LAT-988
1m @ 0.229 ppm
|
|||||
|
08
|
992
– 993
|
128.00
– 130.00
|
2
|
0.112
|
LAT-992
1m @ 0.112 ppm
|
|||||
|
08
|
998
|
134.00
– 135.00
|
1
|
0.145
|
||||||
|
08
|
999
– 1005
|
135.00
– 142.00
|
7
|
0.365
|
||||||
|
08
|
1009
|
145.00
– 146.00
|
1
|
0.241
|
||||||
|
09
|
1230
|
137.00
– 138.00
|
1
|
0.152
|
||||||
|
09
|
1239
|
146.00
– 147.00
|
1
|
0.124
|
||||||
|
09
|
1246
|
153.00
– 154.00
|
1
|
0.180
|
||||||
|
09
|
1299
|
206.00
– 207.00
|
1
|
0.158
|
||||||
|
09
|
1302
|
209.00
– 210.00
|
1
|
0.117
|
||||||
|
09
|
1304
|
211.00
– 212.00
|
1
|
0.123
|
||||||
|
10
|
1412
|
71.00
– 72.00
|
1
|
0.124
|
||||||
|
10
|
1419
|
78.00
– 79.00
|
1
|
0.434
|
||||||
|
10
|
1423
|
82.00
– 83.00
|
1
|
0.208
|
||||||
|
10
|
1452
|
111.00
– 112.00
|
1
|
0.839
|
||||||
|
10
|
1456
|
115.00
– 116.00
|
1
|
0.350
|
||||||
|
10
|
1493
|
152.00
– 153.00
|
1
|
0.103
|
||||||
|
10
|
1522
|
181.00
– 182.00
|
1
|
0.119
|
25
Exploration
of Amazon Mining
In July
2007, an agreement with São Pedro Mineração Ltda. was signed in which Amazon
Mining Holding Plc. – AMZ (a UK public company with shares listed on the TSX
Venture Exchange) acquired a 100% interest in the Fazenda Lavras Gold Project.
In January 2008 AMZ announced that it would start drilling on the Lavras
Project.
Probably
affected by the financial crisis that developed worldwide in the Summer and Fall
of 2008, AMZ never committed resources to conduct a compliant drilling program.
In July of 2008 AMZ notified the owners of São Pedro Mineração Ltda of their
financial limitations and inability to conduct the promised drilling program or
effect payments as contemplated in their contract, which became
ineffective.
Weathered
Ore Resources
Morro
do Ouro
The Morro
do Ouro mine is located within a regional gold belt, which is structuraly
controlled at the basal part of the Neoproterozoic Paracatu
Formation.
Mineralization in this belt occurs
within a sequence of phyllites that have been thrust from SW to NE producing
extensive deformation. Gold grades increase along with the frequency of boudins,
intensity of shearing and arsenopyrite content.
The
timing of gold and sulfide mineralization was syn-deformational. Gold and
sulfides were scavenged from the Morro do Ouro sedimentary sequence during
deformation and localized within the high strain zone(s) that acted as chemical
traps due to dissolution of silica and carbonate and resulting increase in
graphite.
Subsequent
surface weathering produced four, discrete, weathering horizons, known as the
“C”, “T”, “B1” and “B2”, which are defined by the degree of oxidation and
surface weathering and the associated sulfide mineralization.
The
weathered ore contained in the “C” and “T” horizons of Morro do Ouro has been
entirely mined by Rio Tinto Zinc (RTZ), during a continuous operation that
lasted 17 years (1987-2004).
26
Exploitation
of the primary ore at Morro do Ouro (“B1” and “B2” horizons) is currently under
way, and was made possible because of a large amount of time and money invested
by Kinross on the optimization technology of resource evaluation and low-grade
gold recovery (0.4g Au/t), allied to the highly favorable gold price (for
details, see Henderson. 2006).
The Morro
do Ouro gold mine is now comprised of a large open pit, a mineral processing
plant, tailings storage facilities and related surface infrastructure, currently
operating at approximately 18 million tonnes per year.
Fazenda
Lavras
Based on
its geological characteristics and close proximity, the Fazenda Lavras deposit
appears to be the northward continuation of the gold mineralization found in the
Morro do Ouro mine.
Exploration
for the “B1” and B2” horizons, conducted by Rio Tinto Zinc and later by Amazon
Mining Holding Plc. failed to get any economic resource from the primary
ores.This could be interpreted in two ways: (i) both companies have employed
accurate exploration techniques, but primary mineralization in Fazenda Lavras is
discontinuous and prevents identification of an ore reserve amenable to open pit
mining, or (ii) exploration techniques were not adequate in regard of this
unique, very low-grade and unevenly distributed gold
mineralization.
In the
decade of 1990 a small sector of the “C” horizon of Fazenda Lavras was explored
by Mineração Serra do Encanto Ltda., which attained an approximate resource of
33Mt of ore @ 0.67g Au/t. Recent exploration efforts, however, paid little
attention to the potential for low-grade deposits hosted by the “C” and “T”
weathered horizons of the Fazenda Lavras Property.
Estimation
of Weathered Ore Resource (Fazenda Lavras)
The following estimate is based on
information from previous mining operations developed by Mineração Serra do
Encanto Ltda and also on additional investigation carried out by the
Author.
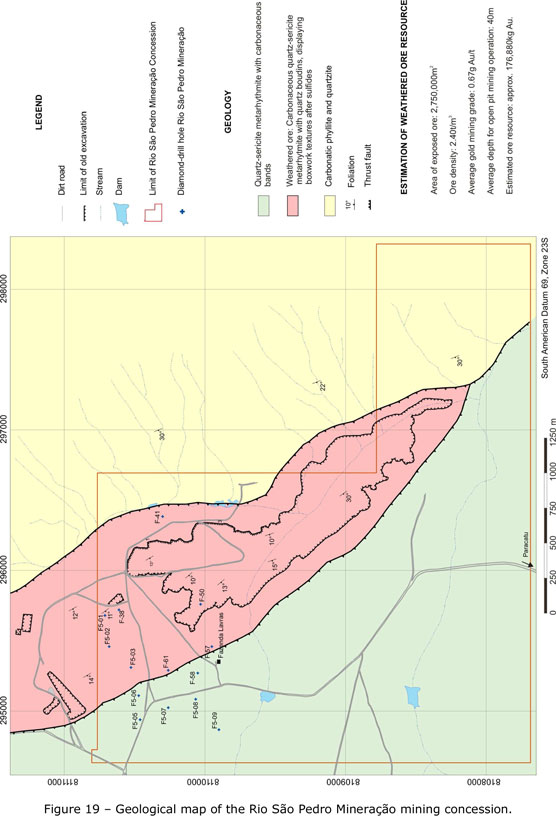
The total area of weathered ore outcrop
can be seen in Figure 19.
27
28
The
estimated (noncompliant) mineral resource for the Fazenda Lavras Property is
summarized in Table 4. The mean specific gravity for mineralized drill cores was
2.40 and the average grade was 0.67g Au/t. The average depth of mining operation
is 40 meters, and no cut off grade was used to report mineral
resources.
Table 4 –
Weathered Ore Resources for the Fazenda Lavras Gold Property
|
Resource
|
Grade
|
Gold
|
Ounces
|
|||||||||
|
(t)
|
(g/t)
|
(kg)
|
(oz)
|
|||||||||
|
Estimated
Resources
|
264,000,000
|
0.67
|
176,880
|
5,700,000
|
The
estimated mineral resources lie below the current water table and virtually
there is no overburden.
The
estimated metal content does not include any consideration of mining, mineral
processing, or metallurgical recoveries.
The most
likely cut-off grade for this deposit is not known at this time and must be
confirmed by the appropriate economic studies.
Conclusion
|
|
·
|
Recent
exploration, including 14 core holes, followed by a bulk sampling
prodecure, has identified potentially economic mineralization below the
depth reached by past garimpeiro mining inside the Fazenda Lavras gold
property.
|
|
|
·
|
A
mineral (noncompliant) resource estimation yielded approximately 5,700Moz
gold up to an average depth of 40
meters.
|
|
|
·
|
The
Fazenda Lavras Project justifies an exploration program and budget, of
which the greater part should be invested in detailed geological mapping,
trenching, pitting and shallow
drilling.
|
|
|
·
|
The
objective of this program is to calculate the actual ore reserves and
elaborate the mining planning for the weathered gold
mineralization.
|