Attached files
| file | filename |
|---|---|
| 8-K - FORM 8-K - TOTAL SYSTEM SERVICES INC | g24916e8vk.htm |
| EX-99.1 - EX-99.1 - TOTAL SYSTEM SERVICES INC | g24916exv99w1.htm |
Exhibit 99.2
| 2010 Third Quarter Results October 20, 2010 (c)2010 Total System Services, Inc.(r) Proprietary. All rights reserved worldwide. |
| Forward-Looking Statements This presentation and comments made by management contain forward-looking statements including, among others, statements regarding the expected future operating results of TSYS. These statements are based on management's current expectations and assumptions and are subject to risks, uncertainties and changes in circumstances. Forward-looking statements include all statements that are not historical facts and can be identified by the use of forward-looking terminology such as the words "believe," "expect," "anticipate," "intend," "plan," "estimate" or similar expressions. Actual results may differ materially from those set forth in the forward-looking statements due to a variety of factors. More information about these risks, uncertainties and factors may be found in TSYS' 2009 Annual Report on Form 10-K, Quarterly Reports on Form 10-Q and Current Reports on Form 8-K. TSYS does not assume any obligation to update any forward-looking statements as a result of new information, future developments or otherwise. (c)2010 Total System Services, Inc.(r) Proprietary. All rights reserved worldwide. 2 |
| Use of Non-GAAP Financial Measures This slide presentation contains certain non-GAAP financial measures determined by methods other than in accordance with generally accepted accounting principles. Such non-GAAP financial measures include the following: revenues before reimbursable items, operating margin excluding reimbursable items and the impact of the acquisition of FNMS, revenues measured on a constant currency basis, free cash flow and EBITDA. The most comparable GAAP measures to these measures are revenues, operating margin, revenues, cash flows from operating activities and net income, respectively. Management uses these non-GAAP financial measures to assess the performance of TSYS' core business. TSYS believes that these non-GAAP financial measures provide meaningful additional information about TSYS to assist investors in evaluating TSYS' operating results. These non-GAAP financial measures should not be considered as a substitute for operating results determined in accordance with GAAP and may not be comparable to other similarly titled measures of other companies. The computations of the non-GAAP financial measures used in this slide presentation are set forth in the Appendix to this slide presentation. (c)2010 Total System Services, Inc.(r) Proprietary. All rights reserved worldwide. 3 |
| (c)2010 Total System Services, Inc.(r) Proprietary. All rights reserved worldwide. 4 Agenda Financial Highlights Phil Tomlinson, Chairman and CEO Jim Lipham, Chief Financial Officer Q&A |
| Phil Tomlinson Chairman and Chief Executive Officer (c)2010 Total System Services, Inc.(r) Proprietary. All rights reserved worldwide. |
| Jim Lipham Chief Financial Officer (c)2010 Total System Services, Inc.(r) Proprietary. All rights reserved worldwide. |
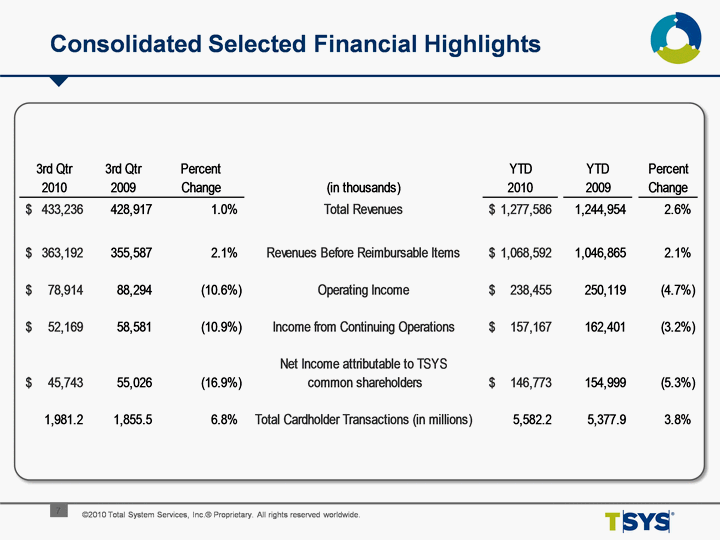
| (c)2010 Total System Services, Inc.(r) Proprietary. All rights reserved worldwide. 7 Consolidated Selected Financial Highlights |

| (c)2010 Total System Services, Inc.(r) Proprietary. All rights reserved worldwide. 8 Net Acquisition Impact - FNMS |
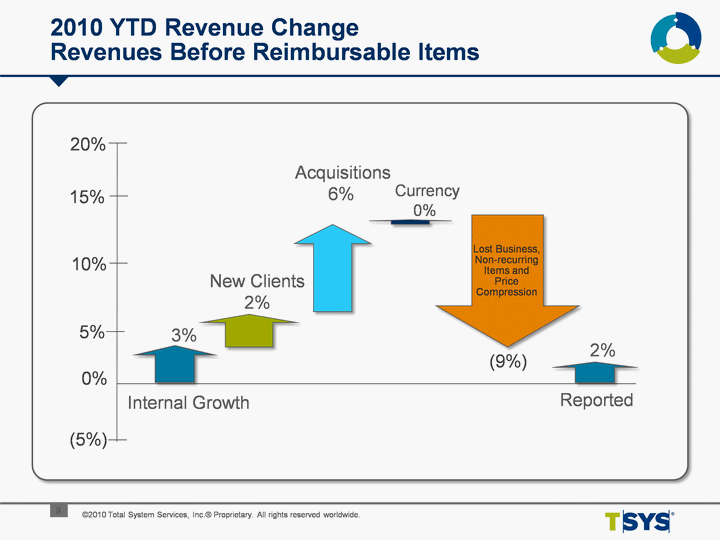
| 2010 Revenue Change Revenues Before Reimbursable Items (c)2010 Total System Services, Inc.(r) Proprietary. All rights reserved worldwide. 9 (5%) 5% 10% 2010 YTD vs. 2009 YTD 0% 2% Reported New Clients 2% Currency 0% Internal Growth 3% (9%) Lost Business, Non-recurring Items and Price Compression Acquisitions 6% 15% 20% |
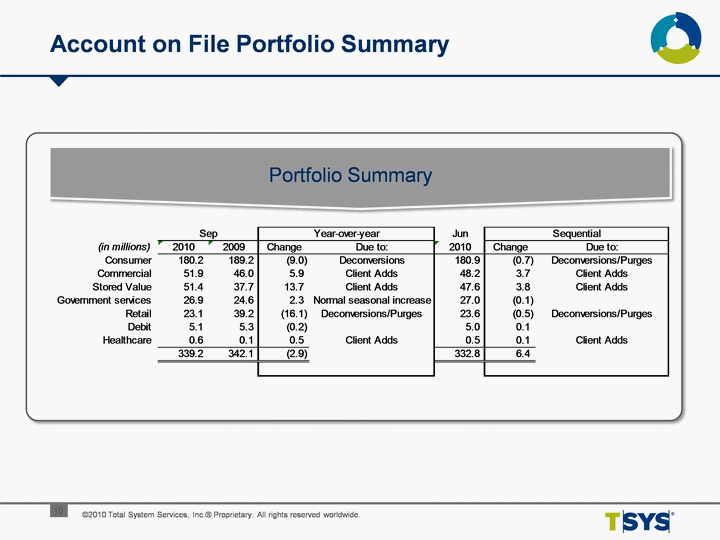
| (c)2010 Total System Services, Inc.(r) Proprietary. All rights reserved worldwide. 10 Account on File Portfolio Summary Portfolio Summary |
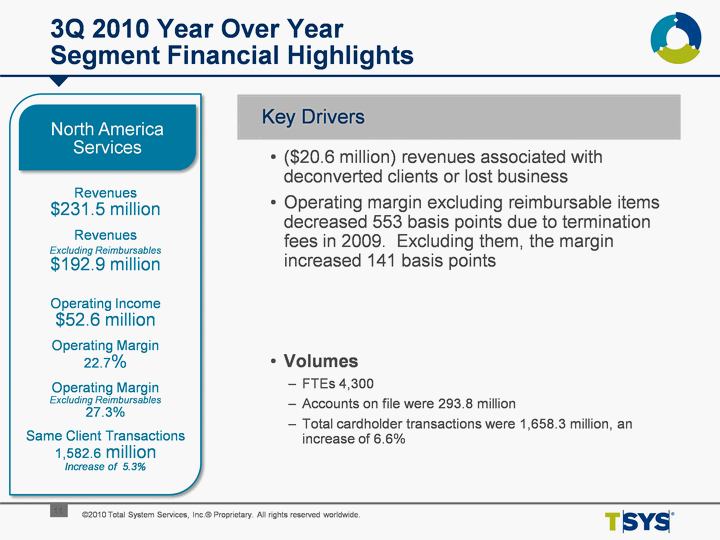
| Key Drivers 3Q 2010 Year Over Year Segment Financial Highlights ($20.6 million) revenues associated with deconverted clients or lost business Operating margin excluding reimbursable items decreased 553 basis points Volumes FTEs 4,300 Accounts on file were 293.8 million Total cardholder transactions were 1,658.3 million, an increase of 6.6% (c)2010 Total System Services, Inc.(r) Proprietary. All rights reserved worldwide. 11 Revenues $231.5 million Revenues Excluding Reimbursables $192.9 million Operating Income $52.6 million Operating Margin 22.7% Operating Margin Excluding Reimbursables 27.3% Same Client Transactions 1,582.6 million Increase of 5.3% North America Services |
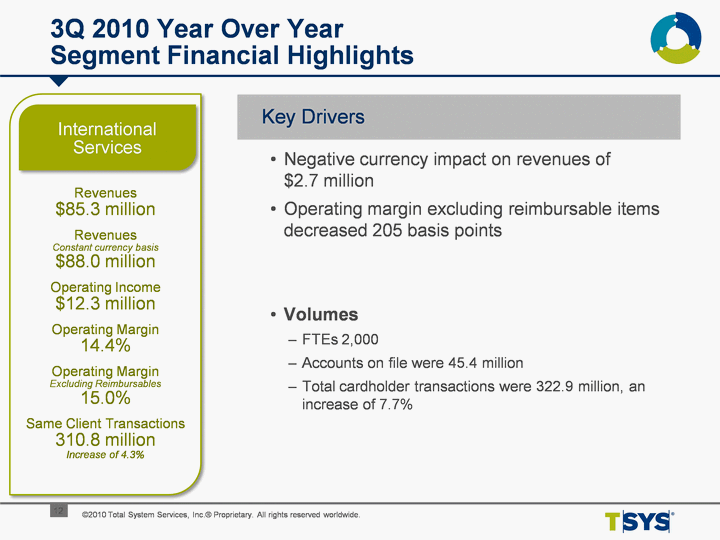
| Key Drivers 3Q 2010 Year Over Year Segment Financial Highlights Negative currency impact on revenues of $2.7 million Operating margin excluding reimbursable items decreased 205 basis points Volumes FTEs 2,000 Accounts on file were 45.4 million Total cardholder transactions were 322.9 million, an increase of 7.7% (c)2010 Total System Services, Inc.(r) Proprietary. All rights reserved worldwide. 12 Revenues $85.3 million Revenues Constant currency basis $88.0 million Operating Income $12.3 million Operating Margin 14.4% Operating Margin Excluding Reimbursables 15.0% Same Client Transactions 310.8 million Increase of 4.3% International Services |
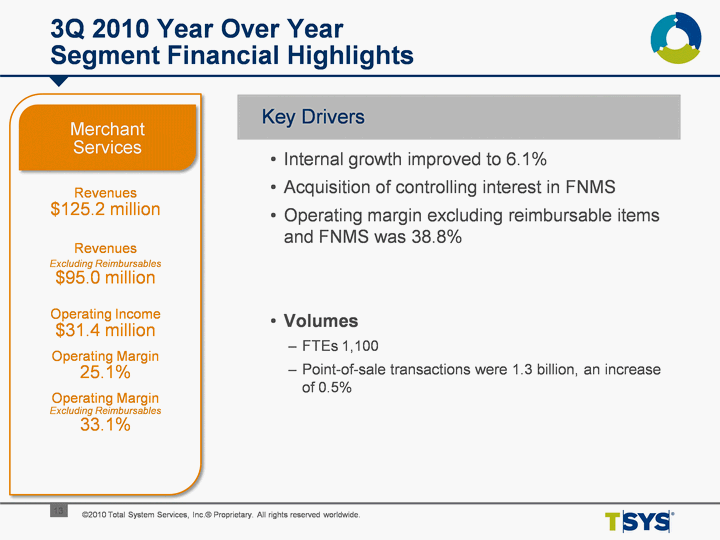
| Key Drivers 3Q 2010 Year Over Year Segment Financial Highlights Internal growth improved to 6.1% Acquisition of controlling interest in FNMS Operating margin excluding reimbursable items and FNMS was 38.8% Volumes FTEs 1,100 Point-of-sale transactions were 1.3 billion, an increase of 0.5% (c)2010 Total System Services, Inc.(r) Proprietary. All rights reserved worldwide. 13 Revenues $125.2 million Revenues Excluding Reimbursables $95.0 million Operating Income $31.4 million Operating Margin 25.1% Operating Margin Excluding Reimbursables 33.1% Merchant Services |
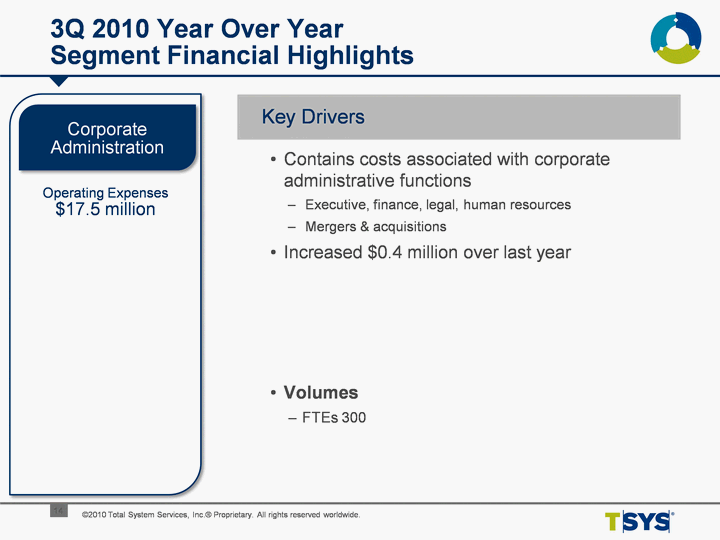
| Key Drivers 3Q 2010 Year Over Year Segment Financial Highlights Contains costs associated with corporate administrative functions Executive, finance, legal, human resources Mergers & acquisitions Increased $0.4 million over last year Volumes FTEs 300 (c)2010 Total System Services, Inc.(r) Proprietary. All rights reserved worldwide. 14 Operating Expenses $17.5 million Corporate Administration |
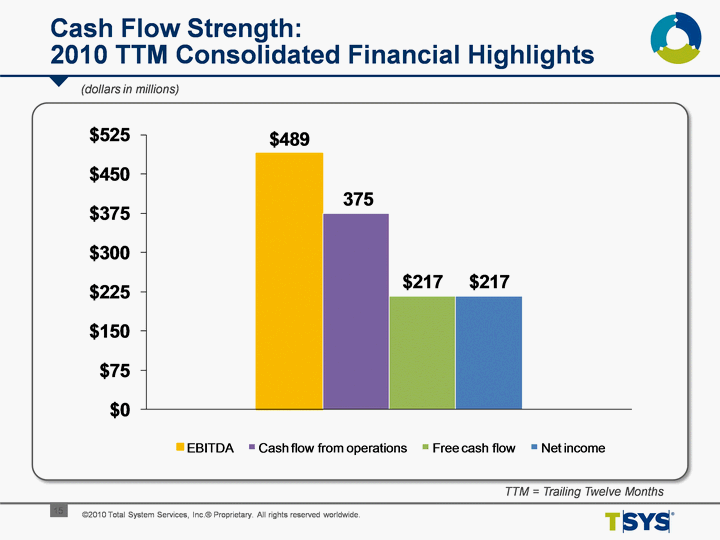
| Cash Flow Strength: 2010 TTM Consolidated Financial Highlights (c)2010 Total System Services, Inc.(r) Proprietary. All rights reserved worldwide. 15 TTM = Trailing Twelve Months (dollars in millions) |
| Q&A (c)2010 Total System Services, Inc.(r) Proprietary. All rights reserved worldwide. 16 |
| Appendix (c)2010 Total System Services, Inc.(r) Proprietary. All rights reserved worldwide. 17 |
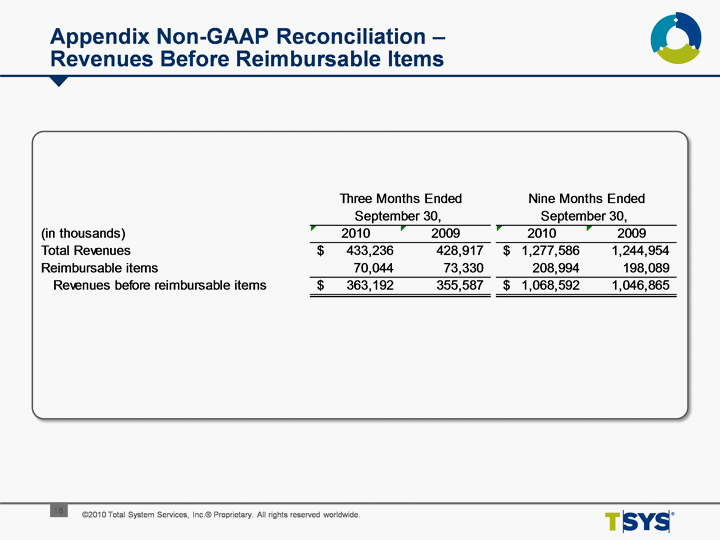
| (c)2010 Total System Services, Inc.(r) Proprietary. All rights reserved worldwide. 18 Appendix Non-GAAP Reconciliation - Revenues Before Reimbursable Items |
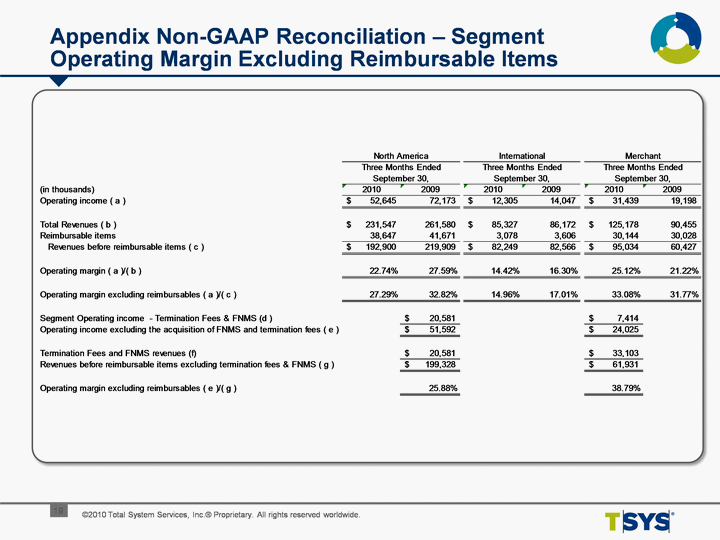
| (c)2010 Total System Services, Inc.(r) Proprietary. All rights reserved worldwide. 19 Appendix Non-GAAP Reconciliation - Segment Operating Margin Excluding Reimbursable Items |
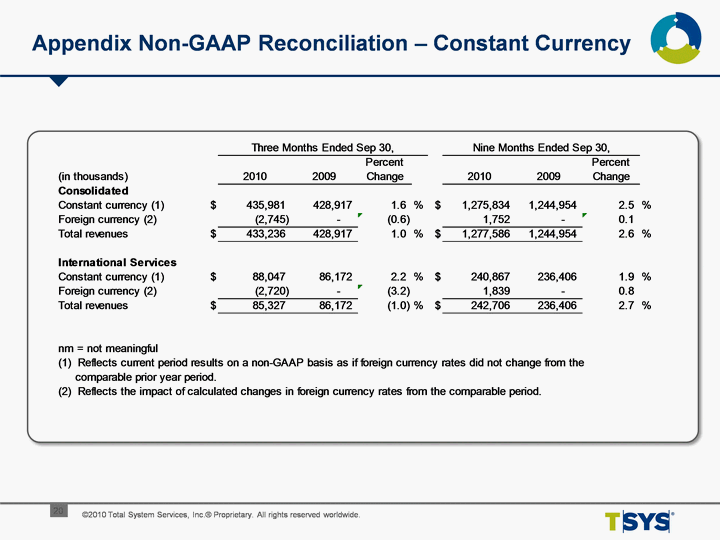
| (c)2010 Total System Services, Inc.(r) Proprietary. All rights reserved worldwide. 20 Appendix Non-GAAP Reconciliation - Constant Currency |
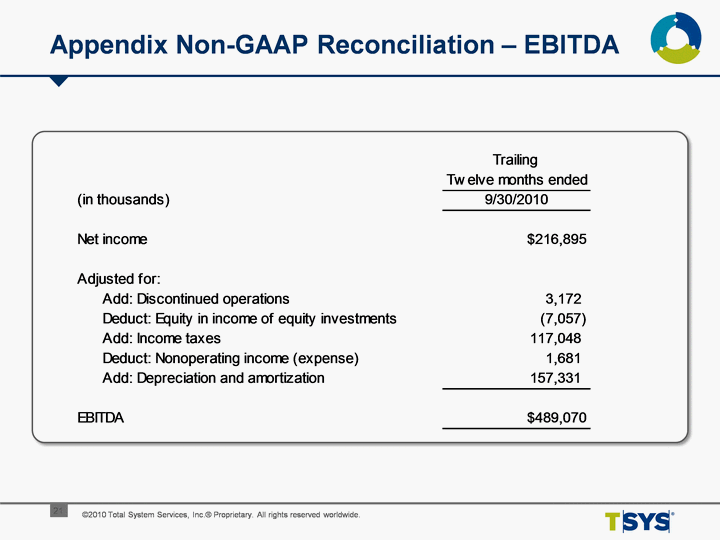
| (c)2010 Total System Services, Inc.(r) Proprietary. All rights reserved worldwide. 21 Appendix Non-GAAP Reconciliation - EBITDA |
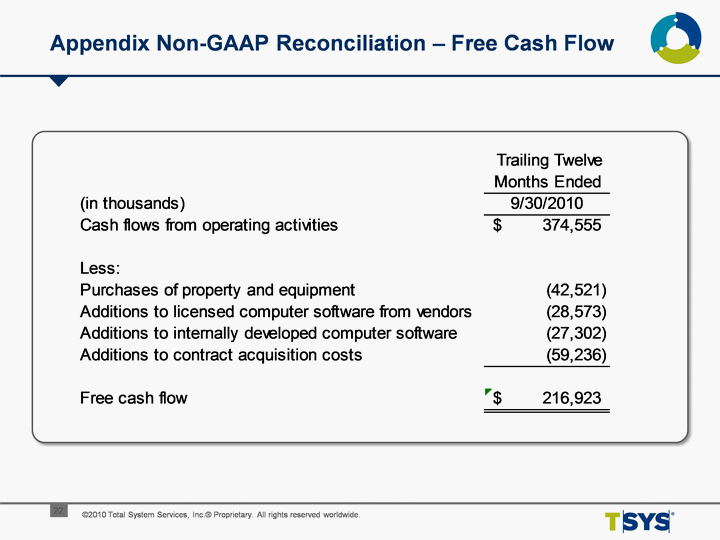
| (c)2010 Total System Services, Inc.(r) Proprietary. All rights reserved worldwide. 22 Appendix Non-GAAP Reconciliation - Free Cash Flow |
