Attached files
| file | filename |
|---|---|
| 8-K - FORM 8-K - ManpowerGroup Inc. | form_8k.htm |
| EX-99.1 - PRESS RELEASE DATED OCTOBER 20, 2010 - ManpowerGroup Inc. | exhibit_99-1.htm |
Exhibit 99.2

2010 October 20
2010 3rd Quarter
Manpower Inc.

Manpower Inc. 2010 3rd Quarter Results
October 2010
2
This presentation includes forward-looking
statements, including earnings projections
which are subject to risks and uncertainties.
Actual results might differ materially from
those projected in the forward-looking
statements. Additional information
concerning factors that could cause actual
results to materially differ from those in the
forward-looking statements is contained in
the Company’s Annual Report on Form 10-K
dated December 31, 2009, which information
is incorporated herein by reference, and
such other factors as may be described from
time to time in the Company’s SEC filings.
Forward-Looking Statement
Manpower Inc. 2010 3rd Quarter Results
October 2010
3
N/A
N/A
N/A
N/A
19%
24% CC
270 bps
Operating Profit $109M
OP Margin 2.2%
Revenue $5.0B
Gross Margin 16.9%
EPS $.62
10 bps
Q3 Highlights
Throughout this presentation, the difference between reported variances and Constant Currency (CC) variances
represents the impact of currency on our financial results. Constant Currency is further explained on our Web site.
represents the impact of currency on our financial results. Constant Currency is further explained on our Web site.
Consolidated Financial Highlights

Manpower Inc. 2010 3rd Quarter Results
October 2010
4
Consolidated Gross Margin Change
Manpower Inc. 2010 3rd Quarter Results
October 2010
5
62% CC
Americas Segment
(22% of Revenue)
(22% of Revenue)
Q3 Financial Highlights
64%
OUP Margin
3.3%
220 bps
Revenue
$1.1B
OUP
$36M
Operating Unit Profit (OUP) is the measure that we use to evaluate segment
performance. OUP is equal to segment revenues less direct costs and branch and
national headquarters operating costs.
performance. OUP is equal to segment revenues less direct costs and branch and
national headquarters operating costs.
(1) Included in these amounts is the US, which had revenue of $752M (+84%) and OUP of $27M. On an
organic basis, US revenue was $552M (+35%) and OUP was $18M.
organic basis, US revenue was $552M (+35%) and OUP was $18M.
(2) On an organic basis, Americas revenue increased 33% in USD (31% in CC).
(1)
391%CC
395%
(2)
(2)

Manpower Inc. 2010 3rd Quarter Results
October 2010
6
Americas - Q3 Revenue Growth YoY
Revenue Growth - CC
Revenue Growth
% of Segment
Revenue
70%
11%
5%
14%
(1) On an organic basis, US revenue was $552M (+35%).
(1)

Manpower Inc. 2010 3rd Quarter Results
October 2010
7
France Segment
(28% of Revenue)
(28% of Revenue)
Q3 Financial Highlights
OUP Margin
1.8%
Revenue
$1.4B
OUP
$25M
7%
19% CC
100 bps
136%
161% CC

Manpower Inc. 2010 3rd Quarter Results
October 2010
8
EMEA Segment
(36% of Revenue)
(36% of Revenue)
Q3 Financial Highlights
OUP Margin
3.0%
Revenue
$1.8B
OUP
$54M
12%
20% CC
150 bps
122%
139% CC
Manpower Inc. 2010 3rd Quarter Results
October 2010
9
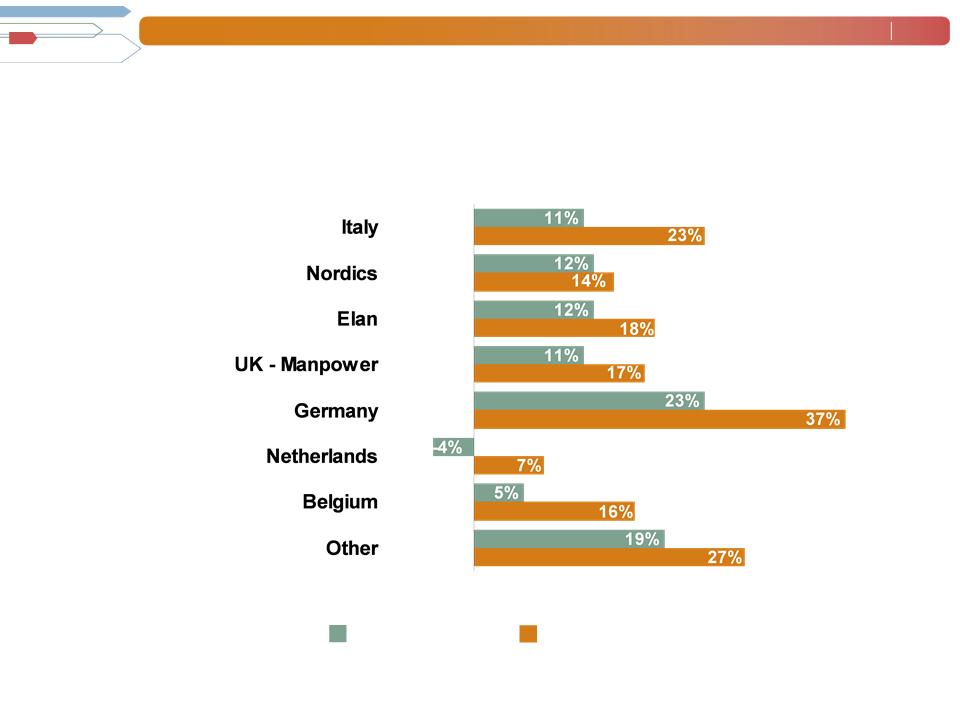
EMEA - Q3 Revenue Growth YoY
Revenue Growth - CC
Revenue Growth
% of Segment
Revenue
14%
14%
13%
11%
10%
6%
24%
8%

Manpower Inc. 2010 3rd Quarter Results
October 2010
10
Asia Pacific Segment
(11% of Revenue)
(11% of Revenue)
Q3 Financial Highlights
OUP Margin
2.4%
Revenue
$556M
OUP
$13M
30%
21% CC
150 bps
234%
211% CC

Manpower Inc. 2010 3rd Quarter Results
October 2010
11
Asia Pacific - Q3 Revenue Growth YoY
Revenue Growth - CC
Revenue Growth
% of Segment
Revenue
49%
27%
24%

Manpower Inc. 2010 3rd Quarter Results
October 2010
12
100%
102% CC
Right Management Segment
(2% of Revenue)
(2% of Revenue)
Q3 Financial Highlights
OUP Margin
0.0%
Revenue
$86M
OUP
$0M
37%
36% CC
1570 bps

Manpower Inc. 2010 3rd Quarter Results
October 2010
13
Jefferson Wells Segment
(1% of Revenue)
(1% of Revenue)
Q3 Financial Highlights
OUP Margin
- 3.5%
Revenue
$45M
OUP
$(2M)
230 bps
7%
N/A

Manpower Inc. 2010 3rd Quarter Results
October 2010
14
Cash Flow Summary - Nine Months
2010
2009
Cash from Operations
(56)
412
Capital Expenditures
(42)
(27)
Free Cash Flow
(98)
385
($ in millions)
Other
(11)
Change in Cash
(416)
327
(2)
Change in Debt
(261)
(89)
Effect of Exchange Rate Changes
8
54
Acquisitions of Businesses,
net of cash acquired
(21)
(19)
Share Repurchases
(35)
-

Manpower Inc. 2010 3rd Quarter Results
October 2010
15
Balance Sheet Highlights
Total Debt
($ in millions)
Total Debt to
Total Capitalization
Total Debt
Net Debt
2010
2010

Manpower Inc. 2010 3rd Quarter Results
October 2010
16
(b)
(b)
Credit Facilities as of September 30, 2010
($ in millions)
($ in millions)
(a)
(a)
This $400M agreement requires, as of September 30, that we comply with a Debt-to-EBITDA ratio of less than 5.75 to 1 and a fixed charge
coverage ratio of greater than 1.25 to 1. As defined in the agreement, we had a Debt-to-EBITDA ratio of 1.85 and a fixed charge coverage
ratio of 2.17 as of September 30, 2010.
coverage ratio of greater than 1.25 to 1. As defined in the agreement, we had a Debt-to-EBITDA ratio of 1.85 and a fixed charge coverage
ratio of 2.17 as of September 30, 2010.
As of September 30, there were $4.0M of standby letters of credit issued under the agreement.
Interest
Rate
Maturity
Date
Total
Outstanding
Remaining
Available
Euro Notes:
- Euro 200M
4.86%
June 2013
272
-
- Euro 300M
4.58%
June 2012
409
-
Revolving Credit Agreement
2.81%
Nov 2012
-
396
374
Uncommitted lines and Other
Various
Various
25
Total Debt
706
770

Manpower Inc. 2010 3rd Quarter Results
October 2010
17
Fourth Quarter Outlook
Revenue
Americas
Up 48-50%
France
Up 8-10%
(Up 15-17% CC)
Up 19-21%
Asia Pacific
(Up 14-16% CC)
Jefferson Wells
Right Management
Down 33-35%
(Down 31-33% CC)
Up 16-18%
(Up 19-21% CC)
Total
Gross Profit Margin
17.0-17.2%
Operating Profit Margin (a)
2.0-2.2%
Tax Rate
51%
EPS (a)
$0.54-$0.62 (Neg. $.02 Currency)
Up 0-2%
EMEA
(Up 16-18% CC)
Up 12-14%
(Up 47-49% CC)
(a) Excludes anticipated reorganization charges of $20M-$25M ($0.15-$0.20 per diluted share).

Manpower Inc. 2010 3rd Quarter Results
October 2010
18
Questions?
Answers