Attached files
EXHIBIT 99.3
As used herein, references to the “Issuer,” the “Company,” “American Achievement,” “we,” “us” and “our” refer to American Achievement Corporation and its consolidated subsidiaries. References to “Parent” refer to AAC Holding Corp., our parent company. References to “fiscal” refer to the 12-month period ending the last Saturday in August of the applicable year. Various financial terms, including “EBITDA” and “Adjusted EBITDA” have the meanings set forth under “—Summary Historical Consolidated Financial Data.” “Segment EBITDA” has the meaning set forth in “—Non-GAAP Financial Measures.”
The Company
We are one of the leading manufacturers and suppliers of yearbooks, class rings, graduation products and recognition and affinity products in the United States. Our products help people express their pride, passions and achievements. We market and sell yearbooks to the elementary school, junior high school, high school and college markets. We primarily sell our class rings and graduation products, which include fine paper products and graduation accessories, in the junior high school, high school and college markets. We also sell rings honoring our military and professional sports championships, as well as jewelry commemorating family and fan affinity jewelry, commercial printing and other recognition products such as letter jackets. We market our products on-campus under the Balfour brand, which has a heritage of nearly 100 years and a well-established reputation for quality. We also market our products through mass, national and independent retailers under the Keystone, ArtCarved, Keepsake and other smaller brands. We believe that our diverse products generate an emotional attachment for students and parents, resulting in embedded customer demand for our products. Our average annual retention rates of approximately 90% for both yearbooks and for high school class rings and graduation products reflect our sales force’s success in gaining and maintaining school administrator satisfaction and loyalty. For the twelve months ended May 29, 2010, we generated net sales of $285.5 million and Adjusted EBITDA of $71.2 million.
We recently announced a consolidation of our various on-campus product lines into one master brand, Balfour, in order to leverage our industry-leading reputations. We believe unifying these brands will enhance the relevance and association of our on-campus offerings, aid student recognition and promote cross-selling of our products. In addition to a new logo and marketing materials, the re-launch of this unified brand includes more dynamic digital strategies.
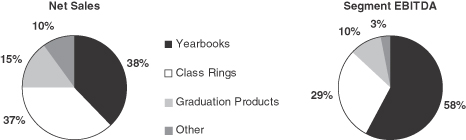
Our business comprises four reportable segments: Yearbooks, Class Rings, Graduation Products and Other Products. The following charts set forth a breakdown of our approximate net sales by Segment and Segment EBITDA for fiscal year 2009:
Yearbooks
We are one of the leading providers of yearbooks for elementary school, junior high school, high school and college students, with a stable and consistent market share of approximately 10%. This market share is supported by our significant nationwide presence in over 7,000 schools and colleges, as well as our continued product innovation and established sales force. We have maintained relatively stable revenues in this segment during the recent economic downturn, as we continue to benefit from our customers’ emotional attachment to yearbooks.
Our 175 independent sales representatives, who have an average tenure of approximately eight years, operate under exclusive contracts and maintain strong relationships with school administrators as they assist students and faculty advisors throughout their design process, continually providing technical and marketing support. While we typically enter into one-year contracts with schools, some of our contracts are multi-year
agreements. The strength of our representatives’ relationships with schools, coupled with continuous advancements in our yearbook systems and design, have been the primary drivers of our annual retention rates of approximately 90%. We believe we were the first yearbook provider to fully integrate digital technology throughout our production process. Since 1993, we have made significant expenditures on proprietary software, including our on-line publishing technology, complemented with full production support for off-the-shelf desktop publishing tools. These investments have led to increased output speed, enhanced print quality and lower overall cost, improving the customer experience through increased versatility, functionality and options for personalizing products.
We believe that our significant investments in technology, which enable us to provide customized design and support of yearbooks, together with the established relationships of our sales force in the school house, provide us with a strong competitive position relative to new entrants in the industry. Yearbook products contributed approximately 38%, 37% and 37% of our net sales in fiscal years 2009, 2008 and 2007, respectively. In fiscal year 2009, net sales were $109 million and Segment EBITDA was $38 million in this segment.
Class Rings
We manufacture class rings for high school and college students and, to a lesser extent, junior high school students. We believe that we are the largest provider of college class rings and the second largest provider of high school class rings, representing approximately 55% of the college class ring market and 30% of the high school class ring market. On-campus marketing of our rings is consolidated under the Balfour brand, which has been known in the market place for nearly 100 years. College rings are primarily sold through college bookstores and alumni associations, once our employee sales representative has established the school as a customer. For the majority of the schools that we serve, we are the sole on-campus class ring supplier. Our approximately 220 independent sales representatives, who operate under exclusive contracts and have an average tenure of approximately 12 years at the Company, maintain close relationships with the schools and coordinate ring design, promotion and order processing. The strength of these relationships has been the primary driver of our annual retention rates of approximately 90% in high school class rings. Further, we are the only class ring manufacturer with an established presence in the national retail market. We believe we will benefit from a continued expansion of the retail market with opportunities to increase sales to mass, national and independent retail chains.
We custom manufacture each ring and maintain an extensive inventory of unique proprietary dies. Our highly efficient manufacturing and distribution footprint enables us to deliver the product to the customer within two to eight weeks of receiving the customer’s order (delivery time depends on style, option selections and new or custom tooling requirements). We use computer-aided design software to quickly and cost-effectively convert new custom designs, such as school seals, mascots and activities, into physical tools capable of producing rings in large quantities. Rings are generally produced only upon receipt of a customer order and deposit, which reduces our credit risk and inventory needs. We manufacture many of the products in our own facilities but also use third-party independent overseas manufacturers for retail class rings.
We believe that our customized manufacturing process and the need to maintain an inventory of unique proprietary dies, together with our sales representatives’ established relationships with schools in the on-campus high school ring market, provide us with a strong competitive position relative to new entrants in the industry. Class ring products contributed approximately 37%, 38% and 39% of our net sales in fiscal years 2009, 2008 and 2007, respectively. In fiscal year 2009, net sales were $109 million and Segment EBITDA was $19 million in this segment.
Graduation Products
We offer an array of graduation products to junior high school, high school and college students that are marketed through our network of exclusive independent class ring sales representatives, as well as through college bookstores. Our graduation product line includes personalized graduation announcements, diplomas, certificates, appreciation gifts and other fine paper accessory items. We also offer caps and gowns for high school and college students through a strategic partnership with a manufacturer. A majority of our graduation products are personalized to some degree, have short production runs and are manufactured at our own facilities.
We believe there is an opportunity in this segment to enhance our current product line with greater personalization and customization and to offer incremental complementary products targeted to the same consumer audience. Graduation products contributed approximately 15%, 15% and 14% of our net sales in fiscal years 2009, 2008 and 2007, respectively. In fiscal year 2009, net sales were $42 million and Segment EBITDA was $6 million in this segment.
Other Products
We market and sell a large variety of personalized recognition products and event-related jewelry to individuals and members of large groups and associations under the Balfour, Celebrations of Life, ArtCarved, Generations of Love, Keepsake and Namesake brand names. We sell products that commemorate personal and group accomplishments, including rings and yearbooks for our military, and sports championship jewelry for professional teams, their members and their fans. We have produced several World Series, Super Bowl and Stanley Cup rings, including the rings for the New York Yankees’ 2009 World Series Championship and the Boston Celtics’ 2008 World Championship, among others. Other recognition products also include varsity letter jackets (along with the pins, inserts and chenelle letters) and embroidered soft goods that commemorate accomplishments in sports, band or other school-based organizations. Other recognition products are marketed on-campus under our unified Balfour brand and in sporting goods retailers under the Powers brand. We also provide a variety of printing products for the commercial market including military yearbooks, histories of professional sports teams, children books and travel books.
We manufacture many of these products at third-party independent overseas manufacturers, although we do manufacture some of the products in our own facilities. Other products contributed approximately 10% of our net sales in each of the fiscal years 2009, 2008 and 2007. In fiscal year 2009, net sales were $30 million and Segment EBITDA was $2 million in this segment.
Industry Overview
The on-campus graduation products market encompasses sales of yearbooks, class rings and other graduation products to junior high schools, high schools and colleges. There are approximately 33,500 high schools and approximately 3,900 colleges in the United States, and we believe that sales into the on-campus graduation market produce over $1.5 billion of annual revenues. Historically, the graduation products market has been supported by a favorable demographic trend: the U.S. Department of Education projects that the number of high school and college graduates will grow by an average of 0.4% and 1.5% per year, respectively, from 2007 to 2019, increasing from approximately 3.3 million to approximately 3.4 million high school graduates and from approximately 1.5 million to approximately 1.8 million college graduates.
We believe that the industry has proven to be relatively stable. Our full-service national competitors have historically been Jostens, Inc. and Herff Jones, Inc., which, together with American Achievement, we believe collectively represented approximately 85% of the market in fiscal 2009. The rest of the market consists of smaller regional competitors or competitors in particular graduation products business lines.
Competitive Strengths
Leading Player with a Strong Competitive Position in High Demand Market. We estimate that sales into the U.S. market for on-campus graduation products produce over $1.5 billion of annual revenues. Within the industry, we believe that we are one of the leading yearbook providers with approximately 10% market share and the second largest high school class ring provider with approximately 30% market share of on-campus and retail rings. We are the market leader in college class rings with a market share of approximately 55%. Further, we are the only class ring manufacturer with an established presence in the national retail market, allowing us to sell high school class rings to students who attend schools where our representatives do not have relationships, as well as to students who did not purchase a class ring at school, and to students who trade down during periods of economic softness. We believe our market share has been consistent over the last several years and that we have been among the top three providers of on-campus graduation products in the U.S. throughout that period of time. Further, our investments in technology and production processes have provided us with time-sensitive distribution capabilities necessary to compete effectively in this market. We believe that these investments, together with the established relationships that our sales representatives have with schools, provide us with a strong competitive position relative to new entrants in the industry. Although advances in technology and the emergence of international manufacturing have lowered manufacturing costs, production capabilities still require significant investment in technology and manufacturing processes for new entrants.
Experienced Sales Force with Longstanding Relationships. We have successfully established longstanding relationships with school administrators and other on-campus decision makers who value and trust that complex, customized, high quality products will be delivered on time. The longevity of these relationships has been fostered and sustained through our extensive network of exclusive independent sales representatives. We currently have approximately 175 yearbook exclusive independent sales representatives and approximately 220 ring and graduation product exclusive independent sales representatives, with long-term average tenures with our
company across the sales force, averaging approximately 10 years across both yearbooks and rings. The stability of our sales force and their integration into our design process means that we are able to effectively and reliably deliver highly customized products. Our average annual retention rates of approximately 90% for both yearbooks and for high school class rings and graduation products reflect our sales force’s success in gaining and maintaining school administrator satisfaction and loyalty. With the recent re-launch of the Balfour brand, we have also provided our sales force with improved on-line tools, on-trend and updated marketing materials (including trade show booths, displays, banners and posters) and technical support. We believe this continued support of our sales force will not only assist us in our brand awareness, but will also further increase the strength of their relationships in the school house and improve their ability to cross-sell our product portfolio.
Unique Access to Expanding Retail Channel. We are the only class ring manufacturer with an established presence in the national retail market, spanning over 30 years. We continue to market our retail rings under the well established ArtCarved, Keystone and Keepsake brands. We have relationships with large national and mass merchandisers, including Wal-mart and JCPenney. Last year, we sold over 200,000 units through over 3,400 Wal-mart stores and we recently tested a JCPenney personalized fashion rings program that will be launched to all JCPenney stores in fiscal year 2011. We believe our position in the retail channel provides us with a strong, complementary sales platform that enables us to extend our on-campus reach and generate sales in regions where we do not necessarily have an established on-campus presence. We believe we will benefit from a continued expansion of this market, with opportunities to increase sales to mass, national and independent retail chains.
Strong Track Record of Efficiency Improvements. Over the past five years, we have been successful in continuing to identify and realize significant cost savings. These initiatives have included:
| • | adoption of lean manufacturing principles to increase production efficiencies, improve quality control and reduce waste |
| • | implementation of procurement initiatives aimed at reducing costs of materials and services used in our operations and reducing corporate and administrative expenses |
| • | transition to on-line, digitally designed pre-press in the Yearbook segment, which has reduced the cost and cycle time of the design and delivery of a yearbook |
| • | closing of Chester County, PA, El Paso, TX and San Angelo, TX yearbook facilities and consolidation into our state-of-the-art yearbook facility in Dallas, TX |
| • | strategic outsourcing of certain ring production to Asia and Mexico |
By using a combination of manufacturing consolidation and third-party sourcing, we have also been able to reduce our working capital requirements and improve gross profit margins, which have increased by 170 bps since 2005, from 55.5% for the fiscal year 2005 to 57.2% for the twelve month period ended May 29, 2010.
Strong and Stable Cash Flow. The combination of the recurring nature of our revenue base, relatively low investment requirements, minimal working capital needs and operational efficiencies has provided us with strong unlevered free cash flow from operations. These strong cash flows have provided us with flexibility on discretionary capital expenditures and the ability to de-leverage our balance sheet. During the last three fiscal years and the twelve-month period ended May 29, 2010, we retired between approximately $10 million and $30 million in term loans per year.
Business Strategy
Our mission is to help people express their pride, passions and achievements while always celebrating life. We recently recruited Alyce Alston as President and Chief Executive Officer, who brings a 25-year track record of successfully developing brands, products and new business ventures. Under Ms. Alston’s guidance, we restructured our senior leadership team along functional lines of business, clarified accountability, created critical new senior positions and selectively hired new members to the management team. This new management team is focused on increasing sales, cash flow, profitability and market share by executing the principal initiatives of our business strategy, outlined below:
Align Distribution Channels with Geographic Territories. We plan to leverage our unique distribution mix, including retail, to grow markets where we may be underrepresented. We believe that strategically aligning geographic areas with the most effective distribution channel for specific products will drive sales and market share.
Expand Product Lines. We have continued confidence in the staying power and growth of our products, supported by research and market feedback validating the highly meaningful nature of our products to our customers. To accelerate this growth we plan to create additional sales through product line extensions and leveraging consumers’ desire for personalization, customization and digitization. We plan to create customized digital and video yearbook product lines, customized and personalized graduation announcements and invitations, and on-campus personalized jewelry that reflects a larger group of customer affinities and interests.
Grow Consumer Desire for On-Campus Brand and Products. We believe the most effective method to increase demand for our product is through a renewed focus on consumer marketing. This strategy began with our on-campus brand consolidation, brand re-launch, unified brand website and enhanced marketing and communications. This consolidation has unified our representatives and on-campus products under one brand, Balfour, which we believe increases brand recognition on campus, enhances our image and creates efficiencies by combining resources for marketing and promotions. The brand re-launch also includes enhancements to the Balfour brand that speak directly to the student and modernize the formerly traditional brand to connect with the target audience; the brand is far fresher in photography style, copy and tone, and is more relevant to students. Unifying the on-campus products under one brand also includes unifying our websites under one umbrella site, Balfour.com, which has been updated consistent with the new brand refresh and includes engaging features, e-commerce capabilities and traffic-driving social media campaigns created to increase sales.
Continue to Focus on Operational Efficiencies. We have a culture of reducing non-essential costs through a number of cost-saving initiatives, including the consolidation of our manufacturing footprint and the outsourcing of certain manufacturing activities. We will continue to pursue opportunities to further leverage our production capabilities and utilize our management’s industry expertise to capitalize on opportunities to further reduce costs and inefficiencies. We will continue to focus on streamlining overhead and reducing costs in targeted areas of the business, consolidation in our manufacturing facilities, and the outsourcing of additional product manufacturing and order entry capabilities.
Build New Businesses and Revenue Streams. We believe we have the opportunity to expand distribution channels, further leverage the equity of our brands, grow our on-campus product lines and directly sell additional products through customer relationship management database marketing. Currently, the e-commerce model is a representative-to-school-to-consumer relationship. We believe we can grow our business first through a direct-to-consumer e-commerce model. We plan to expand these distribution channels by adding new retailers, pursuing other direct-to-consumer marketing programs such as television shopping channels and targeted digital (email and viral) marketing and exploring other currently un-tapped traditional marketing channels. Secondly, we plan to leverage our assets and relationships with our existing customer base, with a focus on customer relationship management and rich database marketing. By combining the demographic and psychographic information we compile on customer purchasing habits and preferences, we expect to build capacity for ongoing relationships with our customers and their families to sell them additional products through the various stages of their lives. Thirdly, we plan to further leverage our recognized brands—ArtCarved, Keepsake and Keystone—in current and new retail and direct-to-consumer channels.
SUMMARY HISTORICAL CONSOLIDATED FINANCIAL DATA
The summary historical consolidated financial data should be read in conjunction with “Management’s Discussion and Analysis of Financial Condition and Results of Operations” and the consolidated financial statements and the related notes thereto appearing in our annual reports on Form 10-K and our quarterly reports on Form 10-Q. The summary historical consolidated financial data set forth below as of and for the fiscal years ended August 25, 2007, August 30, 2008 and August 29, 2009 has been derived from our audited consolidated financial statements. The summary historical consolidated financial data presented below as of and for the nine month periods ended May 30, 2009 and May 29, 2010 has been derived from our unaudited condensed consolidated financial statements and has been prepared on the same basis as the audited consolidated financial statements. Operating results for the nine month period ended May 29, 2010 are not necessarily indicative of the results that may be expected for the fiscal year ending August 28, 2010. The unaudited financial data for the twelve months ended May 29, 2010 has been derived by adding our financial data for the year ended August 29, 2009 to our financial data for the nine months ended May 29, 2010 and subtracting our financial data for the nine months ended May 30, 2009.
| Fiscal Year Ended | Nine Months Ended |
Twelve Months Ended May 29, 2010 | ||||||||||||||||||
| August 25, 2007(1) |
August 30, 2008 |
August 29, 2009 |
May 30, 2009 |
May 29, 2010 |
||||||||||||||||
| (unaudited) | ||||||||||||||||||||
| (in thousands) | ||||||||||||||||||||
| Statement of Operations Data: |
||||||||||||||||||||
| Net sales |
$ | 310,588 | $ | 313,403 | $ | 289,660 | $ | 250,169 | $ | 245,995 | $ | 285,486 | ||||||||
| Cost of sales |
138,892 | 140,373 | 125,540 | 105,511 | 102,101 | 122,130 | ||||||||||||||
| Gross profit |
171,696 | 173,030 | 164,120 | 144,658 | 143,894 | 163,356 | ||||||||||||||
| Selling, general and administrative expenses |
126,731 | 132,809 | 124,336 | 101,775 | 100,863 | 123,424 | ||||||||||||||
| Other charges(2) |
5,262 | — | 3,595 | — | — | 3,595 | ||||||||||||||
| Operating income |
39,703 | 40,221 | 36,189 | 42,883 | 43,031 | 36,337 | ||||||||||||||
| Interest expense, net |
22,064 | 19,775 | 16,849 | 12,390 | 12,789 | 17,248 | ||||||||||||||
| Income before income taxes |
17,639 | 20,446 | 19,340 | 30,493 | 30,242 | 19,089 | ||||||||||||||
| Provision for income taxes |
7,986 | 8,122 | 7,933 | 11,849 | 11,822 | 7,906 | ||||||||||||||
| Income from continuing operations |
9,653 | 12,324 | 11,407 | 18,644 | 18,420 | 11,183 | ||||||||||||||
| Discontinued operations: |
||||||||||||||||||||
| Loss from discontinued operations before income taxes(3) |
(28,406 | ) | (6,375 | ) | — | — | — | — | ||||||||||||
| Benefit for income taxes |
(11,108 | ) | (9,123 | ) | — | — | — | — | ||||||||||||
| Income (loss) from discontinued operations |
(17,298 | ) | 2,748 | — | — | — | — | |||||||||||||
| Net income (loss) |
$ | (7,645 | ) | $ | 15,072 | $ | 11,407 | $ | 18,644 | $ | 18,420 | $ | 11,183 | |||||||
| Balance Sheet Data (at end of period): |
||||||||||||||||||||
| Cash and cash equivalents |
$ | 620 | $ | 9,735 | $ | 11,836 | $ | 14,765 | $ | 14,651 | $ | 14,651 | ||||||||
| Total assets(3) |
451,744 | 442,399 | 403,623 | 448,357 | 420,148 | 420,148 | ||||||||||||||
| Total debt(4) |
245,055 | 225,485 | 196,753 | 196,877 | 174,088 | 174,088 | ||||||||||||||
| Total stockholder’s equity(5) |
129,055 | 143,847 | 110,192 | 128,376 | 113,974 | 113,974 | ||||||||||||||
| Other Data: |
||||||||||||||||||||
| EBITDA from continuing operations(6) |
$ | 63,355 | $ | 65,050 | $ | 61,438 | $ | 62,072 | $ | 61,033 | $ | 60,399 | ||||||||
| Adjusted EBITDA from continuing operations(6) |
72,563 | 73,043 | 71,658 | 67,472 | 67,027 | 71,213 | ||||||||||||||
| Capital expenditures from continuing operations |
10,159 | 12,579 | 5,928 | 4,311 | 3,570 | 5,187 | ||||||||||||||
| Depreciation and amortization from continuing operations |
23,652 | 24,829 | 25,249 | 19,189 | 18,002 | 24,062 | ||||||||||||||
| (1) | Includes the results of Powers from April 1, 2007. In April 2007, CBI, our wholly-owned subsidiary, acquired all of the outstanding stock of BFJ Holdings, Inc. and its wholly owned subsidiary, Powers Embroidery, Inc., which we refer to together as Powers. |
| (2) | Other charges in fiscal 2009 include a non-cash charge of $3.6 million related to the impairment of capitalized software development costs. Other charges in fiscal 2007 includes non-cash charges of $4.9 million for the class rings segment related to impairment of goodwill and trademarks in retail class rings, and $0.4 million for the other segment related to impairment of trademarks in personalized fashion jewelry. |
| (3) | As discussed in Note 7 to the consolidated financial statements appearing in our annual report on Form 10-K for the fiscal year ended August 29, 2009, we have restated our consolidated balance sheets for all years presented and income from discontinued operations for the year ended August 30, 2008. |
| (4) | Total debt includes all borrowings outstanding under notes, credit facilities and capital lease obligations. |
| (5) | Reflects distributions to our indirect parent company, Parent Holdings, of $35.9 million during fiscal 2009 in connection with the repurchase of $104.3 million aggregate principal amount of Existing Senior PIK Notes on February 25, 2009 and the repurchase of $65.3 million aggregate principal amount of Existing Senior PIK Notes on August 7, 2009. |
| (6) | EBITDA from continuing operations represents income from continuing operations before interest expense, income taxes, depreciation and amortization. Adjusted EBITDA from continuing operations represents EBITDA from continuing operations adjusted for the various items described below. EBITDA from continuing operations and Adjusted EBITDA from continuing operations do not represent net income or cash flows from operations, as these terms are defined under generally accepted accounting principles, and should not be considered as an alternative to net income as an indicator of our operating performance or to cash flows as a measure of liquidity. See”—Non-GAAP Financial Measures.” |
A reconciliation of Income from continuing operations to EBITDA from continuing operations and of EBITDA from continuing operations to Adjusted EBITDA from continuing operations is included below:
| Fiscal Year Ended | Nine Months Ended |
Twelve Months Ended May 29, 2010 | |||||||||||||||||
| August 25, 2007 |
August 30, 2008 |
August 29, 2009 |
May 30, 2009 |
May 29, 2010 |
|||||||||||||||
| (in thousands) | |||||||||||||||||||
| Income from continuing operations |
$ | 9,653 | $ | 12,324 | $ | 11,407 | $ | 18,644 | $ | 18,420 | $ | 11,183 | |||||||
| Interest expense, net |
22,064 | 19,775 | 16,849 | 12,390 | 12,789 | 17,248 | |||||||||||||
| Provision for income taxes |
7,986 | 8,122 | 7,933 | 11,849 | 11,822 | 7,906 | |||||||||||||
| Depreciation and amortization expense |
23,652 | 24,829 | 25,249 | 19,189 | 18,002 | 24,062 | |||||||||||||
| EBITDA from continuing operations |
$ | 63,355 | $ | 65,050 | $ | 61,438 | $ | 62,072 | $ | 61,033 | $ | 60,399 | |||||||
| EBITDA from continuing operations |
$ | 63,355 | $ | 65,050 | $ | 61,438 | $ | 62,072 | $ | 61,033 | $ | 60,399 | |||||||
| Non-recurring owner expenses(a) |
2,665 | 2,406 | 2,386 | 1,790 | 3,365 | 3,961 | |||||||||||||
| Non-cash impairment(b) |
5,262 | — | 3,595 | — | — | 3,595 | |||||||||||||
| Non-recurring expenses related to growth strategy initiatives(c) |
— | — | — | — | 1,372 | 1,372 | |||||||||||||
| Plant rationalization and restructuring(d) |
2,583 | 2,724 | 2,523 | 2,209 | 857 | 1,171 | |||||||||||||
| Consulting and professional fees(e) |
682 | 1,235 | 197 | 141 | 90 | 146 | |||||||||||||
| Financing fees(f) |
— | — | 1,073 | 1,073 | 125 | 125 | |||||||||||||
| Other(g) |
(1,984 | ) | 1,628 | 446 | 187 | 185 | 444 | ||||||||||||
| Total Adjustments to EBITDA from continuing operations |
$ | 9,208 | $ | 7,993 | $ | 10,220 | $ | 5,400 | $ | 5,994 | $ | 10,814 | |||||||
| Adjusted EBITDA from continuing operations |
$ | 72,563 | $ | 73,043 | $ | 71,658 | $ | 67,472 | $ | 67,027 | $ | 71,213 | |||||||
| (a) | Represents a portion of the management fees payable to Fenway Partners, LLC pursuant to the management agreement entered into in connection with the March 2004 acquisition of the Company, and reflects, on a pro forma basis for prior periods, the parties’ agreement to limit the annual management fees payable by the Company to $1.0 million per year, beginning with fees earned in 2011. |
| (b) | Non-cash impairment in fiscal 2009 includes a non-cash fixed asset impairment charge of $3.6 million related to the write-off of certain legacy investments in systems that did not have future usability. Non-cash impairment in fiscal 2007 includes non-cash charges of $4.9 million for the class rings segment related to impairment of goodwill and trademarks in retail class rings and $0.4 million for the other segment related to impairment of trademarks in personalized fashion jewelry. |
| (c) | Includes non-recurring consulting, professional, technology and other marketing expenses related to our growth strategy initiatives as described in our October 18, 2010 earnings release. |
| (d) | Represents costs related to plant closings, outsourcing and restructuring, including severance. |
| (e) | Represents consulting and professional fees and other costs incurred by the Company relating to streamlining its business and software implementation. |
| (f) | Represents professional fees incurred to amend the Company’s Existing Senior Secured Credit Facility in fiscal 2009 and professional fees incurred related to the refinancing of our capital structure in fiscal 2010. |
| (g) | Primarily includes non-recurring costs relating to the re-branding of certain products, including the Company’s pre-press yearbook platform. Fiscal 2007 includes gain on sale of land. |
NON-GAAP FINANCIAL MEASURES
EBITDA and Adjusted EBITDA, as presented herein, are supplemental measures of our performance and are presented for continuing operations. In each case, these measures are not required by, or presented in accordance with, generally accepted accounting principles in the United States, or GAAP. EBITDA and Adjusted EBITDA are not measurements of our financial performance or financial position under GAAP and should not be considered as alternatives to total revenues, net income (loss) or any other performance measures derived in accordance with GAAP or as alternatives to cash flow from operating activities as measures of our liquidity.
On October 26, 2007, we decided to shut down the operations of our achievement publications segment. All shutdown activities were substantially complete prior to November 24, 2007 and were fully complete by May 31, 2008. The results of operations of the achievement publications business are reported as discontinued operations for fiscal years 2007 and 2008, and are excluded from the calculation of EBITDA and Adjusted EBITDA. Because all shutdown activities were fully complete by May 31, 2008, the results of operations for the achievement publications business did not have an impact on our results of operations following the end of fiscal year 2008.
EBITDA is defined as income (loss) from continuing operations, plus interest expense net of interest income, income tax provision (benefit) and depreciation and amortization from continuing operations as set out in our consolidated financial statements and the notes related thereto appearing in our annual reports on Form 10-K and our quarterly reports on Form 10-Q. We present Adjusted EBITDA as a further supplemental measure of our performance. We calculate Adjusted EBITDA by adjusting EBITDA for the items of income and expense described in the notes under “—Summary Historical Consolidated Financial Data.” We consider EBITDA and Adjusted EBITDA to be key indicators of operating performance as they and similar measures are instrumental in the determination of compliance with certain financial covenants in our credit facility and other debt obligations, and are used by our management in the calculation of the aggregate fee payable under our management agreement and in determining a portion of compensation for certain of our employees.
EBITDA and Adjusted EBITDA have limitations as analytical tools, and you should not consider them in isolation or as substitutes for analysis of our results as reported under GAAP. Some of these limitations are that EBITDA and Adjusted EBITDA:
| • | do not reflect our cash expenditures or future requirements for capital expenditures or contractual commitments; |
| • | do not reflect changes in or cash requirements for our working capital needs; |
| • | do not reflect the significant interest expense or the cash requirements necessary to service interest or principal payments on our debts; |
| • | exclude tax payments that represent a reduction in cash available to us; |
| • | do not reflect cash requirements for any future replacements of assets that are depreciated or amortized over their estimated useful lives; |
| • | do not adjust for all non-cash income or expense items that are reflected in our statements of cash flows; and |
| • | do not reflect limitations on, or costs related to, transferring earnings from our subsidiaries to us. |
Because of these limitations, EBITDA and Adjusted EBITDA should not be considered as a measure of discretionary cash available to us to invest in the growth of our business or as a measure of cash that will be available to us to meet our obligations. We compensate for these limitations by relying primarily on our GAAP results and using EBITDA and Adjusted EBITDA supplementally.
As an analytical tool, Adjusted EBITDA is subject to all of the limitations applicable to EBITDA. You are encouraged to evaluate each adjustment to EBITDA and the reasons we consider them appropriate for supplemental analysis. In addition, in evaluating Adjusted EBITDA, you should be aware that in the future we may incur expenses similar to those for which adjustments are made in calculating Adjusted EBITDA. Our presentation of Adjusted EBITDA should not be construed as a basis to infer that our future results will be unaffected by unusual or non-recurring items. Other companies in our industry may calculate EBITDA and Adjusted EBITDA differently than we do, limiting their usefulness as comparative measures.
See the notes under “—Summary Historical Consolidated Financial Data” for a description of the calculation of EBITDA and Adjusted EBITDA and a reconciliation of EBITDA from continuing operations and Adjusted EBITDA from continuing operations to income (loss) from continuing operations.
Segment EBITDA, as presented herein, is defined as segment operating income (loss) for each segment, plus depreciation and amortization and other charges for such segment, as set out in our consolidated financial statements and the notes related thereto appearing in our annual report on Form 10-K for the fiscal year ended August 29, 2009. The sum of Segment EBITDA for all segments for any fiscal period does not equal the Adjusted EBITDA for such period, because of certain adjustments listed in the reconciliation of EBITDA from continuing operations to Adjusted EBITDA from continuing operations that are added back in the determination of Adjusted EBITDA.