Attached files
| file | filename |
|---|---|
| 8-K - FORM 8-K - MOSAIC CO | d8k.htm |
Exhibit 99.1

Near Term P&K Outlook:
Demand Pull Pressures (Again)

Market Mosaic is a quarterly newsletter published for our customers, suppliers and stakeholders by the Market and Strategic Analysis group of The Mosaic Company. The spring and fall issues recap our assessment of the near term outlook for agricultural and crop nutrient markets. The summer and winter issues provide an in-depth look at a topic of special interest to our readers.
Michael R. Rahm
Vice President Market and Strategic Analysis
mike.rahm@mosaicco.com
Luis F. Dowling
Manager Market and Strategic Analysis
luis.dowling@mosaicco.com
Joseph Fung
Sr. Market Analyst
joseph.fung@mosaicco.com
Mathew Philippi
Data Analyst
matt.philippi@mosaicco.com
Our last outlook issue published in June concluded that phosphate (P) and potash (K) demand was back on track, fundamentals looked stronger than market sentiment at the time, and the food story had not changed despite back-to-back bumper crops and the prospect of another record harvest in 2010. Developments since then have put an exclamation mark on each of those conclusions!
The disappointing global harvest this year has ignited powerful rallies in a wide array of agricultural commodity prices and bolstered P&K demand prospects. Futures markets are sending extraordinarily strong signals to farmers to expand planted area and intensify cropping practices next year in order for supply to keep pace with the accelerating demand for agricultural commodities. The increasingly positive outlook for crop nutrient demand coupled with the need to re-stock both the global distribution pipeline as well as many farm fields underpins our forecasts for large jumps in P&K shipments in 2010 and 2011.
In the case of phosphate, global shipments of finished products are projected to surge to a record-shattering high this year and increase further in 2011. U.S. shipments also are forecast to advance to above average levels in 2010/11 with all of the stars and moons aligned for a blockbuster fall application season. On the supply side, several uncertainties overhang this market. U.S. producer inventories on August 31 were at a record low for this date and the combination of raging demand and uncertain supply is expected to keep the global phosphate market tight throughout 2010/11.
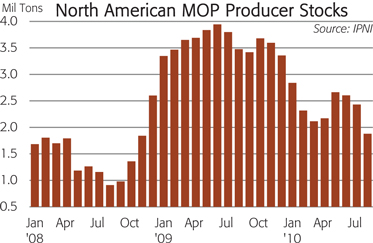
In the case of potash, global shipments of muriate of potash (MOP) are projected to take a giant step up this year and then jump again in 2011. Domestic shipments also are forecast to register a second large increase in 2010/11. Peak shipments to both offshore and domestic customers this fall are expected to test the logistical capacity of North American suppliers and result in a further sharp drawdown of producer inventories. North American producer stocks on August 31 were slightly below the five-year average for this date and inventories are projected to plunge during the next few months and then stay at low levels throughout 2010/11.
Phosphate prices have increased sharply and potash prices are beginning to firm as a result of strong demand pull pressure. Pressure is expected to continue to build as long as agricultural commodity prices remain at or continue to increase from current high values. Given this increasingly positive demand outlook, P&K markets are projected to remain tight until new capacity comes online later this decade.
Game Change
Powerful rallies in a wide array of agricultural commodity prices have changed the game for crop nutrient producers and distributors. Higher commodity prices have boosted crop nutrient demand prospects and swung market sentiment from cautious to positive.
— continued inside
Rallies were sparked by two reports released by the U.S. Department of Agriculture (USDA) on June 30. These reports showed that U.S. farmers planted less corn than expected last spring and that corn inventories on June 1 were smaller than expected. Corn prices jumped following the release of these reports and the rally spilled over to other nearby trading pits.
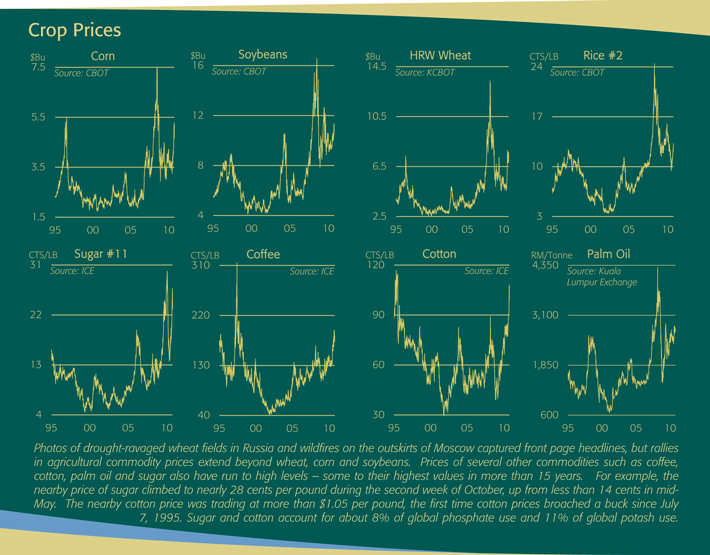
Following the June 30th surprise, several weather events combined to pour the equivalent of a tanker truck of gasoline on this spark. The severe drought and horrific wildfires in Russia captured front page headlines and fueled a strong run in wheat prices. USDA’s October WASDE report estimated that the 2010 Russian wheat crop would total only 42.5 million tonnes, down 31% from 61.7 million tonnes last year and off 33% from the post break-up record of 63.7 million tonnes in 2008.
Russia was not the only major wheat growing region that experienced adverse weather, this summer. Excessive rain reduced this year’s harvest in Saskatchewan, Europe, Pakistan and China while dry conditions plagued the crop in other parts of Europe and China as well as Western Australia. As a consequence, the USDA estimates that the global wheat harvest will drop 6% from 682 million tonnes in 2009 to 641 million tonnes in 2010. Global wheat production peaked at 683 million tonnes in 2008.
What Worries the Wheat Market?
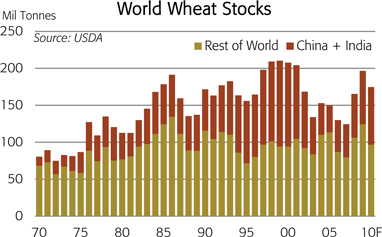
The back-to-back bumper crops in 2008 and 2009 resulted in a large increase in global wheat stocks. For example, after dropping to a dangerously low level of 124 million tonnes or just 74 days of use at the end of the 2007/08 crop year, global wheat stocks increased to 197 million tonnes or about 110 days of use at the end of 2009/10. The drop in this year’s harvest combined with steady demand growth will reduce world stocks to 175 million tonnes or 97 days of use by the end of the 2010/11 crop year, according to USDA estimates.
Projected wheat stocks may look adequate to absorb another supply shock in 2011, but the wheat market continues to fret about a couple of issues. The first is exportable wheat supplies. Of the 175 million tonnes of projected stocks at the end of 2010/11, the USDA estimates that China and India will hold 78 million tonnes and these inventories typically are not available for export. As a result, wheat stocks outside these two countries at the end of 2010/11 are projected to total 97 million tonnes or just 17 million tonnes more than the dangerously low level three years ago.
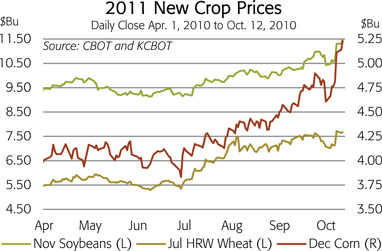
The second concern is 2011 supply prospects. Drought conditions still persist in some parts of Russia where soils remain too dry to seed winter wheat. In addition, La Niña raises warning flags about the 2010/11 South American crop. These worries are the main reason why the 2011 new crop price for hard red winter wheat was trading in the $7.70 per bushel range when this publication went to press.
Is the Corn Rally Over or Just Beginning?
The most recent issue to rile agricultural commodity markets is uncertainty about U.S. corn supplies. The USDA surprised the market on September 30 when it reported that inventories on September 1 were more than 300 million bushels greater than its previous estimate and market expectations. The nearby corn price plunged nearly 40 cents per bushel following the report. Larger than expected supplies triggered a mass sell-off by commodity funds that had built extremely large net long positions during the summer.
The agency then shocked the market again on October 8 when it reported that the 2010 corn crop was much smaller than expected due to disappointing yields. Although U.S. farmers planted the crop early and USDA condition scores tracked the high values associated with record yields last year, excessive rainfall and warm nighttime temperatures robbed yield from this year’s crop. USDA slashed its yield estimate to 155.8 bushels per acre, down more than 4% from its September estimate of 162.5 bushels per acre and well below consensus of about 160 bushels per acre. USDA has lowered its yield estimate between the September and October Crop Production reports only four times since 1974!

Although the agency found a few more acres in this survey, the large drop in yield swamped the impact of additional area. As a result, USDA estimated that U.S. farmers will harvest 12.66 billion bushels of corn this fall, down almost 500 million bushels from its September estimate and down more than 285 million bushels from industry estimates. However, the 2010 crop still will rank as the third largest ever.
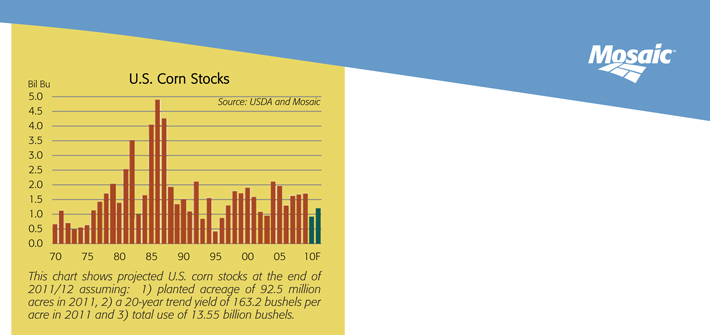
The combination of a smaller crop and strong demand prospects resulted in a large drop in projected U.S. corn stocks. The USDA forecast that U.S. corn inventories will decline to just 902 million bushels or 6.7% of use at the end of the 2010/11 crop year. This projected stocks-to-use percentage is the second lowest in modern history. Futures prices locked limit up on the day of the report with the 2011 new crop price closing at $5.11 per bushel, a life-of-contract high and the first time this contract breached the $5.00 per bushel mark. Many analysts expected strong follow through in subsequent sessions with whispers of $6 corn surfacing once again.
The corn market is on edge not only because of increasingly tight U.S. fundamentals but also due to low tradable inventories outside the United States. Global corn stocks have not increased as much as wheat inventories during the last two years. More importantly, all of the increase in global corn stocks was in China, according to USDA
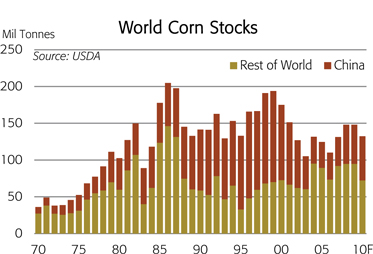
statistics. In fact, the most recent USDA estimates show that projected corn stocks outside China at the end of the 2010/11 crop year are one million tonnes less than the low level at the end of 2006/07!
The corn market will keep a close eye on yield monitors as U.S. farmers complete the harvest this fall and then will laser-focus on weather developments in the Southern Hemisphere where a La Niña event is underway. In Brazil, La Niña typically results in delayed rains in the Midwest and hot and dry conditions in the South during
December and January. Indeed, soybean planting in the Midwest is delayed about two weeks and later planting could jeopardize the second crop corn harvest in this region. More importantly, La Niña threatens the larger summer corn crop in the South if hot and dry conditions materialize. In fact, some reports indicate that farmers in the region are cautious about committing crop inputs this planting season due to the La Niña threat.
A Donnybrook for 2011 Acreage
The battle for acreage next spring in the United States is shaping up to be a real donnybrook. If the 2010 corn yield is 155.8 bushels per acre and 2010/11 ending stocks drop to the 900 million bushel range, the corn market will have to bid for 92 to 93 million acres in 2011 in order to rebuild inventories to a more safe level. How much the corn market has to pay for that many acres will depend largely on the size of the 2010/11 crops in the Southern Hemisphere and how much competition emerges from the soybean and wheat markets.
Sharply higher 2011 new crop prices are sending extraordinarily strong signals to farmers to expand planted area and intensify cropping practices next year. Some analysts are beginning to question the role that cutbacks in P&K application rates during the last two years may have played in the lower-than-expected yields this year – particularly the surprisingly low U.S. corn yields. The increasingly positive demand outlook coupled with the need to re-stock both the global distribution pipeline as well as many farm fields underpins our forecasts for large jumps in P&K shipments in 2010 and 2011.
Phosphate: Raging Demand – Uncertain Supply
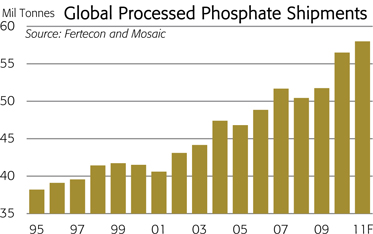
Global phosphate (DAP/MAP/TSP) shipments are projected to surge to 56 to 57 million tonnes in 2010, shattering the previous record of 52 million tonnes set in 2007 and equaled again in 2009. Shipments are projected to climb further to 57 to 59 million tonnes in 2011.
India is the most powerful engine of growth. Domestic DAP/MAP shipments climbed to 10.3 million tonnes during the 2009/10 fertilizer year and are forecast to increase to 10.9 million tonnes in 2010/11.
Shipments during the kharif season (April to September) increased almost 7% this year. Annual Indian DAP/MAP shipments have increased almost 5.0 million tonnes since the middle of the last decade or the equivalent of two Ma’aden plants operating at 85% of capacity.
We estimate that India will import about 8.0 million tonnes of DAP/MAP in 2010, up from 6.6 million tonnes in 2009. Imports are projected to remain in the 8.0 million tonne range in 2011. Annual DAP/MAP imports by India now exceed peak Chinese imports in the mid-1990s by roughly 2.5 million tonnes!
India is the most powerful but certainly not the only engine of growth. Processed phosphate imports by Latin American buyers are projected to rebound more than 900,000 tonnes to 4.8 million tonnes in 2010 and then increase another one-half million tonnes to 5.3 million in 2011.
Brazilian phosphate imports are forecast to increase from 2.1 million tonnes in 2009 to 2.5 million tonnes in 2010 and to more than 2.8 million tonnes in 2011. P&K demand prospects are bolstered by profitable soybean and sugar economics. The key March 2011 soybean contract was trading at more than $12.00 per bushel as farmers planted soybeans during the second week of October and the March 2011 sugar contract was trading a whisker less than 28 cents per pound!
Import demand prospects in Oceania are bolstered by higher wheat prices and excellent soil moisture in Eastern Australia. Processed phosphate imports are forecast to climb to more than 1.0 million tonnes
in 2010 and to almost 1.3 million tonnes in 2011, up from 760,000 tonnes in 2009.
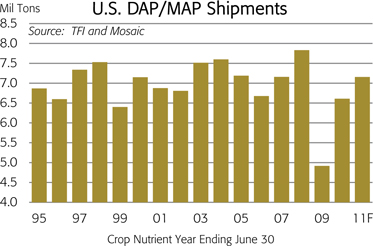
Closer to home, U.S. DAP/MAP shipments are projected to climb more than 8% to 7.2 million tons in 2010/11, slightly above the 10-year Olympic average. That forecast assumes farmers will apply phosphate at normal rates on major crops. North American producers and distributors expect a blockbuster fall season.
Phosphate Supply Uncertainties
On the supply side, several uncertainties overhang the global phosphate market. The first is the availability and cost of purchased raw materials – particularly sulphur in the United States. U.S. phosphate producers likely will continue to scramble to find enough sulphur to keep plants operating at consistently high rates during the next several months.
The second uncertainty is how the market will make up the loss of up to 750,000 tons from Agrifos. Phosphate operations at the Agrifos facility at Pasadena, TX are slated to close permanently during the first quarter of 2011 in compliance with a consent decree in which the company agreed to cease phosphate operations when gypsum disposal reached capacity at the facility.
The third uncertainty is export supply from China. China provided the supply surge needed to meet the large increase in global phosphate shipments in 2007, but producers shorted their domestic customers in the process. As a consequence, the government imposed prohibitive export taxes during peak domestic seasons. A similar situation is shaping up in 2010 and 2011. For example, China Customs statistics show that DAP/MAP exports during the first eight months of 2010 totaled 2.7 million tonnes with record-smashing exports of 844,000 tonnes in July and 986,000 tonnes in August. Chinese producers exported 2.2 million tonnes during the first eight months of 2007. Current inventories throughout the domestic distribution pipeline are low and domestic phosphate prices have increased. Published reports indicate that the government is closely monitoring this situation and officials have met with the major domestic producers in an effort to insure adequate supplies of competitively priced phosphate for the fall and spring application seasons. If voluntary agreements fail, more stringent export restrictions could follow.
The fourth supply uncertainty is the timing of the start-up of the much-anticipated Ma’aden facility in Saudi Arabia. Some distributors had banked on supplies from this new facility as early as the first quarter of 2011 and most expected commercial start-up during the second quarter of 2011. Industry publications recently have reported that construction of the chemical complex is behind schedule and that commercial start-up may get pushed back to the last half of 2011 or even the first half of 2012.
The final uncertainty is the temporary closure of Mosaic’s South Fort Meade mine in central Florida due to litigation over its recently issued mining permit in Hardee County. The South Fort Meade mine, one of two flagship operations, produced an average of 5.4 million tonnes of phosphate rock per year during the last five fiscal years, the most of any Mosaic operation. Mosaic expects to mitigate the loss of this production at least in the near term by drawing down rock and finished product inventories, maximizing output from other mines and buying rock. This mitigation plan is short term and not without downside. Purchased rock will push up Mosaic’s costs, and at some point, inventories will run out. There are also practical limits for discharging and blending purchased rock.
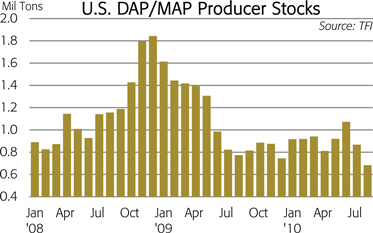
Recent statistics show that the increase in shipments this year has tightened the global phosphate market and pulled up prices. Inventories of DAP/MAP held by U.S. producers at the end of August dropped to a record low level for this date – less than the low level two years ago and 33% less than the five-year average. The robust demand outlook coupled with several supply uncertainties is expected to keep the global phosphate market tight until new capacity comes online later this decade.
Potash: Demand Growth Quickly Tightens Market
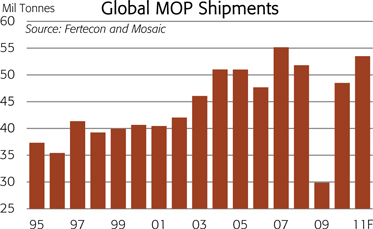
Demand recoveries in all of the major consuming countries have quickly tightened the global potash market. Global muriate of potash (MOP) shipments now are projected to climb to 48 to 49 million tonnes in calendar 2010 and then jump to 52 to 55 million tonnes in 2011. Global potash shipments peaked at 55 million tonnes in 2008 before plummeting to less than 32 million tonnes in 2009.
Shipments to all of the major importing countries are projected to rebound this year and then increase further in 2011. In Brazil, MOP imports are forecast to increase to 5.9 million tonnes in 2010, up from just 3.4 million tonnes in 2009. Imports during the first eight months of 2010 totaled 3.8 million tonnes, a 96% jump from the low level a year earlier. Imports are forecast to climb to 6.0 to 6.5 million tonnes in 2011.
In China, imports are estimated to recover to almost 5.0 million tonnes in 2010, up from only 1.6 million tonnes in 2009. According to China Customs statistics, imports during the first eight months of this year totaled 3.2 million tonnes or a 72% increase from the same period a

year earlier. Chinese imports next year are a wildcard. MOP imports peaked at 9.4 million tonnes in 2007 and the five year average from 2004 to 2008 was 7.3 million tonnes. Production and trade statistics imply that Chinese potash use has plummeted since 2007. Given a growing policy focus on controlling food inflation and achieving greater food security, potash imports are expected to rebound sharply at some point. We currently project that imports will climb to 6.0 to 8.0 million tonnes in 2011.
In India, potash consumption and imports are on the rise. MOP imports are expected reach 6.0 million tonnes this year, in line with the record level of 2009. MOP imports for the first eight months of 2010 totaled 4.2 million tonnes, up from 2.4 million tonnes a year earlier. Imports are projected to increase to 6.3 to 6.5 million tonnes in 2011. Farm economics in India are as strong as anywhere in the world given high local commodity prices and subsidized crop input costs.
In North America, MOP shipments are projected to climb 21% to 9.7 million tons KCL in 2010/11 or 93% of the 10-year Olympic average of 10.5 million tons. This forecast assumes that U.S. farmers will plant 92 to 93 million acres of corn, 75 to 76 million acres of soybeans and 56 to 57 million acres of wheat next year and that potash application rates will continue to recover toward average rates. North American
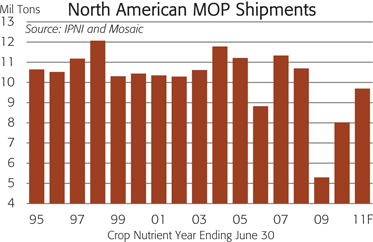
shipments plunged 51% from 10.7 million tons KCL in 2007/08 to just 5.3 million tons in 2008/09, the lowest total in modern history by a wide margin, before rebounding 51% to 8.0 million tons in 2009/10.
Expectations for the North American fall application season are running high for several reasons. First, unlike the last two years, this year’s early harvest should provide a much wider application window. Second, farmers can lock in profitable margins by selling grain and buying crop inputs this fall. Finally, the run-up in agricultural commodity prices coupled with relatively good yields this year has boosted farm income and farmers are expected to buy and apply as many crop inputs as possible in 2010 for tax planning purposes.
The strong recovery in offshore and domestic shipments has tightened the market and pulled up prices. For example, MOP stocks held by North American producers on August 31 were almost one-half of the high level a year earlier and slightly less than the five-year average for this date. Producer inventories are projected to plunge during the next few months and remain at low levels throughout the 2010/11 fertilizer year due to blockbuster domestic shipments this fall as well as large and steady offshore shipments. Like phosphate, the positive demand outlook is expected to keep the global potash market tight until new capacity comes online later this decade.