Attached files
| file | filename |
|---|---|
| 8-K - FORM 8-K - PLAINS EXPLORATION & PRODUCTION CO | d8k.htm |
| EX-99.1 - PRESS RELEASE DATED OCTOBER 5, 2010 - PLAINS EXPLORATION & PRODUCTION CO | dex991.htm |
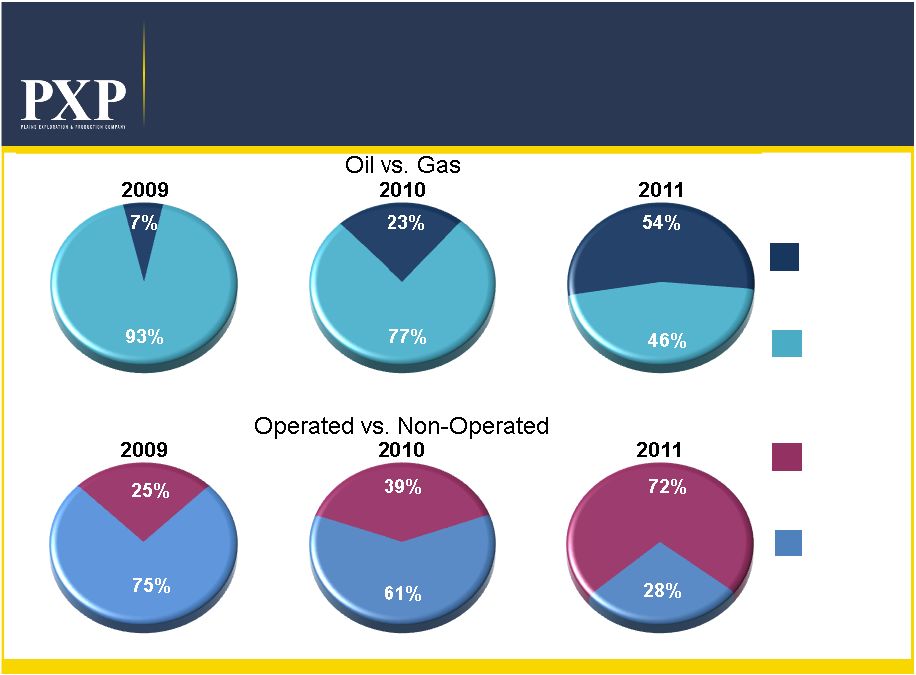
 2009
Capex Profile
2009
Oil
Gas + Exploration
Operated
Non-operated
10
Includes Eagle Ford acquisition and excludes Gulf of Mexico assets, shallow water
as of 11/1/2010 and deepwater as of 1/1/2011. |
 Corporate
Headquarters Contacts
Plains Exploration & Production Company
700 Milam, Suite 3100
Houston, Texas 77002
Forward-Looking Statements
This
presentation
is
not
for
reproduction
or
distribution
to
others
without
PXP’s
consent.
Corporate Information
James C. Flores –
Chairman, President & CEO
Winston M. Talbert –
Exec. Vice President & CFO
Hance
V. Myers –
Vice President Investor Relations
Joanna Pankey
–
Manager, Investor
Relations
& Shareholder Services
Phone: 713-
579-
6000
Toll Free: 800-
934-
6083
Email: investor@pxp.com
Web Site: www.pxp.com
Except for the historical information contained herein, the matters
discussed
in
this
presentation
are
“forward-looking
statements”
as
defined
by the Securities and Exchange Commission. These statements involve
certain assumptions PXP made based on its experience and perception
of historical trends, current conditions, expected future developments and
other factors it believes are appropriate under the circumstances.
The forward-looking statements are subject to a number of known and
unknown risks, uncertainties and other factors that could cause our actual
results to differ materially. These risks and uncertainties include, among
other things, uncertainties inherent in the exploration for and development
and production of oil and gas and in estimating reserves, the timing and
closing of acquisitions and divestments, unexpected future capital
expenditures, general economic conditions, oil and gas price volatility, the
success of our risk management activities, competition, regulatory
changes
and
other
factors
discussed
in
PXP’s
filings
with
the
SEC.
References to quantities of oil or natural gas may include amounts that
the Company believes will ultimately be produced, but that are not yet
classified as "proved reserves" under SEC definitions. |
 2010 Asset
Rotation •
Asset rotation from GOM to onshore U.S.
•
Expect to receive $1.8 –
$2.8 Billion of total
proceeds from GOM sales
•
Plan to spend $500 –
$600 Million in onshore oil
asset acquisitions
•
Remaining proceeds used to accelerate oil
development, strengthen balance sheet and/or
repurchase common stock
3 |
 Asset Rotation to
Onshore 4 |
 Strong Liquidity
With No Near Term Debt Maturities
(1) As of August 3, 2010 upon closing of Amended and Restated Revolving Credit Facility.
Millions ($)
Revolver
Availability
Senior
Notes
5
MMR Stock
Plus
Net DW Proceeds
$1.4B
(1)
Available Liquidity |
 WTI NYMEX Historical
Prices and Forward Curves ($/bbl)
Source: Goldman Sachs, NYMEX
6
20
30
40
50
60
70
80
90
100
110
120
130
140
150
2004
2005
2006
2007
2008
2009
2010
2011
2012
2013
June 29, 2004
May 20, 2005
September 30, 2010
January 22, 2007
February 6, 2008
February 18, 2009 |
 PXP
Today •
$5.6
billion
enterprise
value
(1)
•
360 MMBOE proved reserves YE 2009
•
85.1 MBOE per day production for 1H 2010
•
+1.6
billion
BOE
resource
potential
(2)
•
140.1
million
shares
outstanding
(3)
•
45% net debt-to-total capitalization
(1) Reflects stock price and total debt as of June 30, 2010.
(2) Includes Eagle Ford acquisition and excludes Gulf of Mexico assets.
(3) As of June 30, 2010.
(4)
Does
not
include
51MM
shares
MMR
common
stock
($743
MM
as
of
September
17,
2010).
7
(3)(4) |
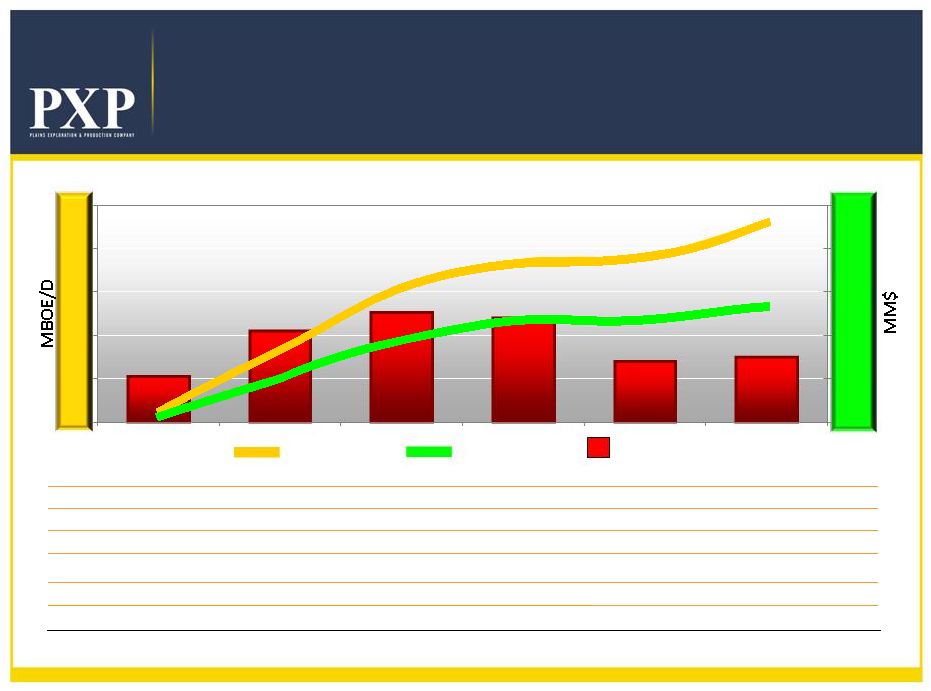
 PXP
Operational Plan Including Eagle Ford
Capital
Cash Flow
Production
8
PXP Net
Production
PXP Net
Cash Flow
(1)(2)
$1400 MM
$1400 MM
$1100 MM
$1500 MM
$1200 MM
$1500 MM
0
25
50
75
100
125
150
175
200
2010
2011
2012
2013
2014
2015
$0
$500
$1,000
$1,500
$2,000
$2,500
$3,000
$3,500
$4,000
(1) Net revenue minus net expenses.
(2) Assumes Strip pricing in 2010, $85/Bbl of oil and natural gas
pricing of $5.00/MMBtu in 2011, $85/Bbl of oil and natural gas pricing of $5.50/MMBtu in 2012, and $86/Bbl of oil
and natural gas pricing of $6.00/MMBtu 2013
and beyond. Includes Eagle Ford acquisition and excludes Gulf of Mexico assets,
shallow water as of 11/1/2010 and deepwater as of 1/1/2011. |
 (1)
Illustrates estimated reserves using NYMEX pricing.
Includes Eagle Ford acquisition and excludes Gulf of Mexico assets, shallow water as of 11/1/2010 and
deepwater as of 1/1/2011. Proved Reserves Target Growth
Proved
Developed
Proved
Undeveloped
9
209
230
237
273
83
130
178
247
0
100
200
300
400
500
600
700
800
2008
2009
2010
2011
292
360
415
(1)
520
(1)
72%
72%
64%
64%
53%
53%
57%
57% |
 2009
Capex Profile
2009
Oil
Gas + Exploration
Operated
Non-operated
10
Includes Eagle Ford acquisition and excludes Gulf of Mexico assets, shallow water
as of 11/1/2010 and deepwater as of 1/1/2011. |
 Development
(1)
Haynesville
California
Other Capital
(1)
Capital Allocation
Capital Program
2010E
$1.1 Billion
2011E
Targeting $1.2 Billion
(1)
Includes development, exploitation, real estate, capitalized interest and G&A costs but does not
include additional capital for exploratory successes.
Exploration capital is defined as discovery and dry hole costs.
Exploration
Haynesville
Eagle Ford
Granite Wash
11 |
 Operational Strategy
Focused Oil Growth Strategy
•
Operate substantially all oil assets
•
Maintain total company liquids volumes between 50% and 60%
of total production
•
Hedging strategy protects high oil margins that preserve
excellent returns
Targeted High Liquids/Natural Gas Strategy
•
Granite Wash development focusing on high liquids and highest
rate of return wells
•
Haynesville Shale development drilling continues for our Held By
Production (HBP) program
12 |
 Oil Assets
13 |
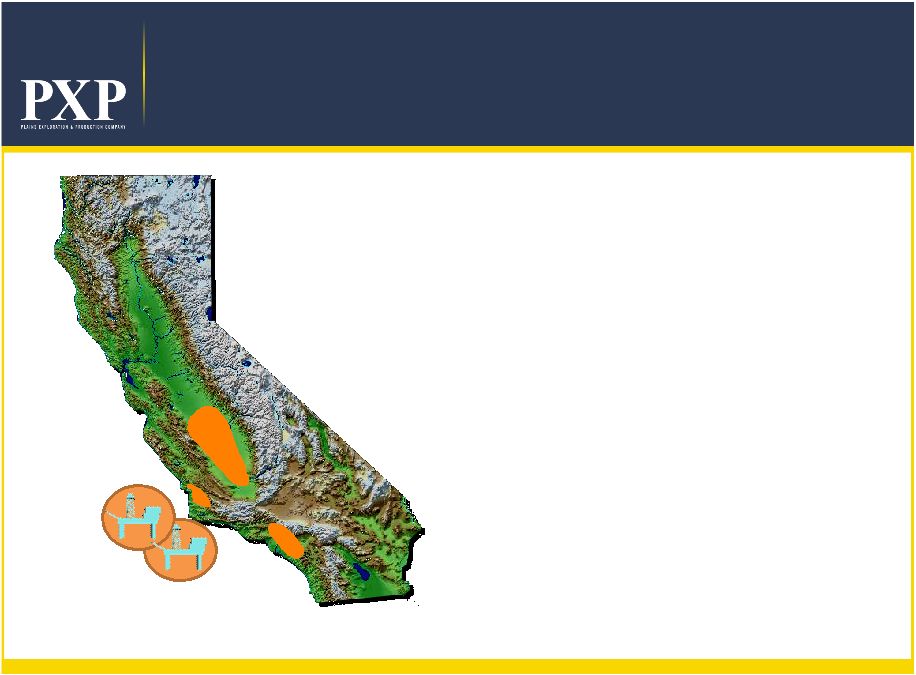 California
Onshore/Offshore
Los
Angeles
Basin
Los
Angeles
Basin
San Joaquin
Valley
San Joaquin
Valley
Arroyo
Grande
Arroyo
Grande
Pt Pedernales
Pt Arguello
•
215 MMBOE Net Proved Reserves
•
275 MMBOE Net Development
Resource Potential
•
68% Proved Developed
•
2009 Capex $92 MM; 2010E Capex
$190 MM
•
14 yr R/P
•
2,500+ future well locations
•
Price differentials protected by
contract
The shaded areas are for illustrative purposes only and do not reflect actual leasehold
acreage. 14 |
 California
Operational Plan
January 1, 2010 Project Cost Forward F&D:
$9.87/BOE
(2)
PXP
Interest:
98% WI / 86% NRI
Potential Net Locations:
2,500+
Proved Net
Reserves:
215 MMBOE
Net Development Resource
Potential:
275 MMBOE
Average Gross Well Cost:
$1.2 MM
Average Gross EUR per Well:
135 MBOE
15
Capital
Cash Flow
Production
PXP Net
Production
PXP Net
Cash Flow
(1)(2)
$349 MM
$367 MM
$190 MM
$323 MM
$272 MM
$374 MM
0
15
30
45
60
75
90
2010
2011
2012
2013
2014
2015
$0
$200
$400
$600
$800
$1,000
$1,200
(1) Net revenue minus net operating expenses.
(2) Assumes Strip pricing in 2010, $85/Bbl of oil and natural gas
pricing of $5.00/MMBtu in 2011, $85/Bbl of oil and natural gas pricing of $5.50/MMBtu in 2012, and $86/Bbl of oil
and natural gas pricing of $6.00/MMBtu 2013
and beyond. |
 Eagle Ford Oil Acquisition
•
$578 MM Purchase Price
$100,000
to
$125,000
per
flowing
barrel
x
2,000
BOEPD
=
$200
to
$250
MM
60,000 net acres x $6,300 to $5,467 per acre = $378 to $328 MM
•
Production:
Net
production
capability
2,000
BOEPD,
YE
2011
production
target
exit
5,000
BOEPD
•
Acreage:
60,000 net acres
Drilling Stats:
4 rigs currently operating (2 PXP and 2 EOG)
17 gross wells drilled, completed or producing
•
Net Resource Potential:
140 –
175 MMBOE
•
Potential Net Well Locations:
500
•
Anticipated Closing by YE 2010
•
Effective Date 9/1/2010
16 |
 Eagle Ford Horizontal Oil Play
•
PXP acreage position
•
60,000 net acres
•
4 to 6 rigs operating by YE
•
Depth to Eagle Ford Top
•
~9,500' -
11,500' TVD
Location Map
WILSON
ATASCOSA
Legend
PXP ACREAGE
OIL WINDOW
GAS CONDENSATE
WINDOW
DRY GAS WINDOW
17
The shaded area is for illustrative purposes only and do not reflect actual
leasehold acreage. |
 Eagle Ford
Operational Plan
PXP Net
Production
PXP Net
Cash Flow
(1)(2)
18
Capital
Cash Flow
Production
September 1, 2010 Project Cost Forward F&D:
$18.81/BOE
PXP
Interest:
73% WI/ 56%
NRI Potential Net Locations:
500
Net Development Resource
Potential:
175 MMBOE
Average Gross Well Cost:
$7.00 MM
Average Gross Resource Potential per Well:
483 MBOE
$349 MM
$424 MM
$17 MM
$426 MM
$277 MM
$396 MM
0
5
10
15
20
25
30
2010
2011
2012
2013
2014
2015
$0
$150
$300
$450
$600
$750
$900
(1) Net revenue minus net expenses.
(2) Assumes Strip pricing in 2010, $85/Bbl of oil and natural gas pricing of $5.00/MMBtu in
2011, $85/Bbl of oil and natural gas pricing of $5.50/MMBtu in 2012, and $86/Bbl of oil
and natural gas pricing of $6.00/MMBtu 2013 and beyond.
|
 Mowry
Shale Horizontal Oil Play
Big Horn Basin, Wyoming
•
PXP acreage position
54,000 net acres
•
Proven Source Rock
•
Petrophysical
characteristics of
successful oil shale plays
•
Depth Range
~6,000' to 10,000'
•
Shale Thickness Range
~250' to 400'
•
Expected first drilling late 2010
Legend
Location Map
19
USGS Oil Fairway
Mowry
Gas
Production
Mowry
Oil
Production
PXP ACREAGE
USGS OIL FAIRWAY |
 Legend
PXP ACREAGE
PXP
MONTEREY
PRODUCTION
OXY DISCOVERY
VENOCO ACTIVITY
•
PXP acreage position
86,000 net acres
•
Acquiring 3D seismic data
over key assets
•
Exploratory wells planned
in 2011
Location Map
20
Monterey Shale Oil Play
Los Angeles Basin
Los Angeles Basin
Point Pedernales
Point Arguello
Rocky Point
Arroyo Grande
Lompoc
Belridge
McKittrick
Midway Sunset
Pescado
Hondo
San Joaquin Basin
San Joaquin Basin
Santa Maria Basin
Santa Maria Basin
*
Jesus Maria
Cymric
Las Cienegas
Inglewood
Montebello
Urban Area |
 Natural Gas
Assets 21 |
 PRODUCING
AWAITING COMPLETION
2010 DRILL LOCATIONS
ACTIVE DRILLING
Haynesville Shale
Activity Map
TEXAS
LOUISIANA
Location Map
Legend
22 |
 Haynesville
Shale Operational Plan
PXP Net
Production
PXP Net
Cash Flow
(1)(3)
January 1, 2010 Project Cost Forward F&D:
$8.24/BOE
(3)
or
$1.37/Mcfe
(1) Net revenue minus net expenses.
(2) Assumes D&C costs for first 4 years = $7.5 MM per well, after 4 years = $6 MM per well.
(3)
Assumes
Strip
pricing
in
2010,
$85/Bbl
of
oil
and
natural
gas
pricing
of
$5.00/MMBtu
in
2011,
$85/Bbl
of
oil
and
natural
gas
pricing
of
$5.50/MMBtu
in
2012,
and
$86/Bbl
of
oil
and natural gas pricing of $6.00/MMBtu 2013 and beyond.
PXP
Interest:
20% WI / 15% NRI
Net Acreage:
105,000
Potential Net
Locations:
1,400
Net Resource
Potential:
6.8 Tcfe
Average Gross Well Cost:
$7.5 MM
(2)
Average Gross EUR per Well:
6.5 Bcfe
23
$312 MM
$319 MM
$336 MM
$218 MM
$232 MM
$315 MM
0
15
30
45
60
2010
2011
2012
2013
2014
2015
$0
$200
$400
$600
$800
Capital
Cash Flow
Production |
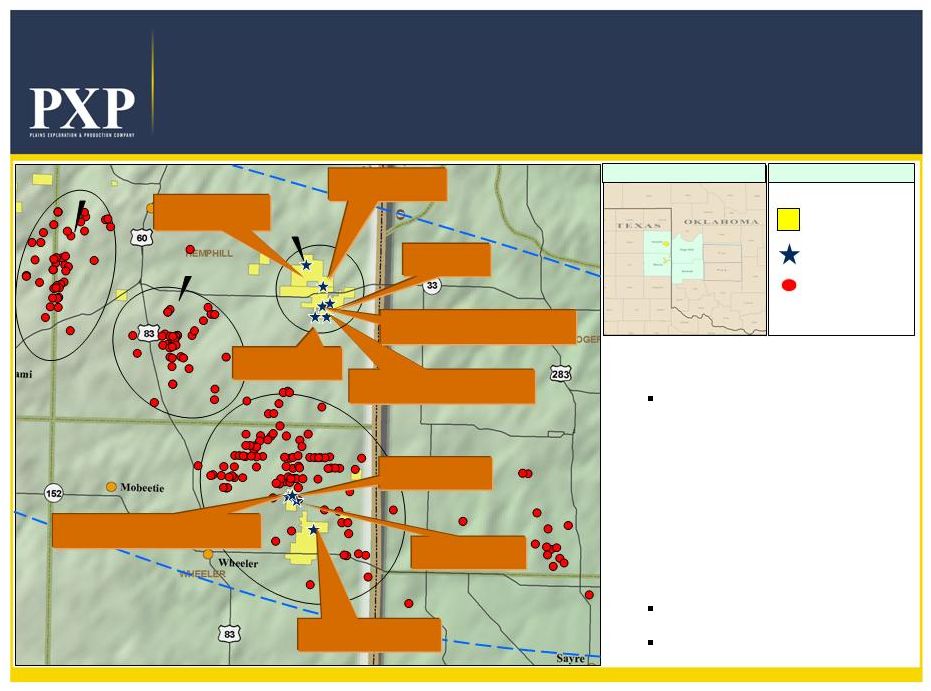 Granite Wash
Horizontal Play Recent High-Rate Completions
24
PXP LEASES
PXP WELLS
Producing
Horizontal Wells
•
PXP acreage position
19,100 net acres
•
Five rigs currently operating
•
152 Granite Wash Locations
(PXP WI 88%)
•
Industry ROI 39% @
$5.00/MMBtu & $75/bbl
•
2010 Plan
19 wells Spud
$105 MM Capex
Legend
Location Map
NW. Mendota Area
Buffalo
Wallow Area
PXP Hanson #29-2H 18MMCFED
10.4 MMCFD/344 BOPD/888NGL
Marvin
Lake Area
PXP Britt Caldwell #9026H
Drilling
PXP Thomas #1003H
WOC
PXP Thomas #903H
28 MMCFED
12.2 MMCFD/1373 BOPD/1311 NGL
PXP Sanders #74-1H
WOC
Thomas 1103H
WOC
JO Well 96-6H
Drilling
PXP Hanson #40-4H
29 MMCFED
15.4 MMCFD/746 BOPD/1532 NGL
PXP Cook 39-2H
Drilling
PXP Hanson #29-3H
Drilling |
 PXP Net
Production
PXP Net
Cash Flow
(1)(2)
Granite Wash Horizontal Potential
Operational Plan
(1) Net revenue minus net expenses.
(2)
Assumes
Strip
pricing
in
2010,
$85/Bbl
of
oil
and
natural
gas
pricing
of
$5.00/MMBtu
in
2011,
$85/Bbl
of
oil
and
natural
gas
pricing
of
$5.50/MMBtu
in
2012,
and
$86/Bbl
of
oil
and natural gas pricing of $6.00/MMBtu 2013 and beyond.
25
Capital
Cash Flow
Production
January 1, 2010 Project Cost Forward F&D:
$9.79/BOE or $1.62/Mcfe
(2)
PXP
Interest:
88% WI / 70% NRI
Net Acreage:
19,100
Potential
Locations:
152
Net Resource
Potential:
113.2 MMBOE
Average Gross Well Cost:
$8.2 MM
Average Gross EUR per Well:
1.1 MMBOE
$105MM
$140MM
$148MM
$240MM
$210MM
$253MM
0
6
12
18
24
30
2010
2011
2012
2013
2014
2015
$0
$100
$200
$300
$400
$500 |
 +1.6 Billion BOE
Resource Potential Potential Reserves
950 MMBOE
275 MMBOE
175 MMBOE
100 MMBOE
10 MMBOE
Region
Haynesville
California
Eagle Ford
Granite Wash
Rockies
Potential Reserves
90 MMBOE
30 MMBOE
Region
Mowry
Shale
Monterey Shale
26 |
 Revenue Per
MCFE 2Q 2010
Revenue
Per
MCFE
(3)
(1) Revenues for non oil and gas producing operations servicing third parties not included.
(2) Peer group average includes the following peers: COG, HK, RRC, SD, UPL. Source: Company
filings. (3) Excludes the impact of derivatives.
27
$7.84/
MCFE
$4.58/
MCFE
$0.00
$2.00
$4.00
$6.00
$8.00
$10.00
PXP
Gas Peer Group Avg.
(1)(2) |
 Debt-Adjusted
Cash
Operating
Margin
(1)(8)
2Q 2010
28
$/Mcfe
$0.00
$2.00
$4.00
$6.00
$8.00
$10.00
$12.00
Derivatives
Margin (Excl. Derivatives)
Interest
(7)
G&A
(6)
Production Costs
(5)
$2.22
$0.47
$0.61
4.40
$1.23
$0.46
$0.98
$1.24
$
)
$1.92
(4
$4.40
$3.16
Gas Peer
Group Avg.
(2)(3) |
 PXP Targets Over Next
3 Years •
Grow reserves 15% to 20% per year over the
next 3 years
•
Grow production 10% to 15% per year over the
next 3 years
•
Efficiently manage business focusing on cost
reduction and profitability
•
Maintain conservative balance sheet with active
hedging program
•
Focus drilling on high liquid development projects
to increase total percentage of oil production
29 |
 Addendum
30 |
 Commodity Price
Protection Oil and Natural Gas Derivative Positions
31
(1)
All of our derivative instruments are settled monthly.
(2)
In addition to the deferred premium, an upfront payment of $3.86 per barrel was paid upon entering
into these derivative contracts. (3)
PXP receives difference between floor of $80.00 less the Index price up to a maximum of $20.00 per
barrel. (4)
PXP receives difference between floor of $80.00 less the Index price up to a maximum of $20.00 per
barrel. PXP pays if Index > $110.00 ceiling. (5)
PXP receives difference between floor of $6.12 less the Index price up to a maximum of $1.48 per
MMBtu. PXP pays if Index > $8.00 ceiling. |
 (Millions)
3 mo. ended
6/30/10
3 mo. ended
6/30/09
Revenues
$ 364.6
$ 278.7
Production Costs
(100.7)
(105.8)
General & Administrative Expenses
(30.3)
(37.6)
DD&A & Accretion Expense
(128.2)
(94.4)
Impairment of Oil & Gas Properties
(59.5)
-
Legal Recovery
-
87.3
Other Operating Income (Expense)
3.9
(1.5)
Income From Operations
$ 49.8
$ 126.7
Income Before Income Taxes
$ 91.0
$ 21.3
Net Income
(1)(2)
$ 45.4
$ 43.6
Earnings Per Share -
diluted
$ 0.32
$ 0.37
Income Statement Summary
(1) Includes an after-tax gain (loss) on mark-to-market derivative
contracts of approximately $36.2 million and ($56.0) million for the three months
ended June 30, 2010 and 2009, respectively.
(2) Three months ended June 30, 2009 includes a beneficial income tax effect of $24
million from a change in the balance of unrecognized tax benefits. 32
|
 Reconciliation of Debt-Adjusted Cash Operating Margin
(Non-GAAP) to Net Cash Provided by Operating Activities (GAAP)
Three Months
Ended
June 30, 2010
Per MCFE
(In Millions)
Oil and gas revenues
$ 363.9
$
7.84 Production expenses
(103.0)
(2.22)
Oil and Gas related DD&A & impairments
(179.4)
(3.86)
Gross margin (GAAP)
81.5
1.76
Oil and Gas related DD&A & impairments
179.4
3.86
General & administrative
(30.3)
(0.65)
Noncash compensation
8.3
0.18
Interest expense, net of capitalized interest
(28.0)
(0.61)
Realized loss on mark-to-market derivative contracts
(6.7)
(0.14)
Debt adjusted cash operating margin (Non-GAAP)
$ 204.2
$
4.40 Net cash provided by operating activities (GAAP)
$ 252.6
$
5.44 Changes in operating assets & liabilities
(28.3)
(0.61)
Noncash and other income items
(16.1)
(0.35)
Realized loss on mark-to-market derivative contracts
(6.7)
(0.14)
Current income taxes attributable to derivative contracts
2.7
0.06
Debt adjusted cash operating margin (Non-GAAP)
$ 204.2
$
4.40 33
The following table reconciles the debt-adjusted operating margin (non-GAAP) to the net cash
provided by operating activities (GAAP) for the three months ended June 30, 2010. Management
believes this presentation may be useful to investors. PXP management uses this information for comparative purposes within the
industry and as a means to measure cash generated by our oil and gas production and the ability to
fund, among other things, capital expenditures and acquisitions. This measure is not
intended to replace the GAAP statistic but rather to provide additional information that may be helpful in evaluating the
Company's operational trends and performance.
Debt-adjusted operating margin is calculated by adjusting gross margin to include general &
administrative expenses, interest expense and realized losses on mark-to-market
derivative contracts and to exclude depreciation, depletion, and amortization expense (DD&A) and noncash compensation expense. |
 |