Attached files
| file | filename |
|---|---|
| 8-K - 8-K - InvenTrust Properties Corp. | a10-18880_18k.htm |
Exhibit 99.1
|
|
As of June 30, 2010 A Program Sponsored by Inland Real Estate Investment Corporation The Track Record Companytm INLAND AMERICAN REAL ESTATE TRUST, INC. 2010 2nd Quarter FlashReport PORTFOLIO SUMMARY As of 6/30/2010 Total Assets.$11.7 billion Number of Properties (a).980 Total Square Feet Owned (a).56.5 million Mortgage Loans to Total Assets.48% Current Annualized Distribution Rate.5.0% Total Distributions Declared Since Inception.$1.3 billion (a) Owned directly or indirectly through joint ventures 2010 COMPANY HIGHLIGHTS • Selectively acquired approximately $800 million of high quality commercial real estate in the first half of 2010. • Addressed 100% of 2010 debt maturities, having retired, refinanced, or secured new financing. • During the six months ended 6/30/2010, declared distributions totaling $207.5 million or $0.50 per share on an annualized basis. • Demonstrated strong leasing activity with 196 signed leases across the portfolio. • Maintained strong occupancy results throughout the portfolio despite the current economic realities that have impacted commercial real estate owners. TOP TEN TENANTS As of 6/30/2010 Tenant % of Total Annualized Income SunTrust Banks 8.6% AT&T 7.1% RBS Citizens 2.9% Sanofi-Aventis U.S. 2.5% United Healthcare Services 2.5% C&S Wholesaler Grocers 2.3% VersaCold Storage 2.0% ShopRite Supermarkets 1.6% Cornell Corrections 1.6% Lockheed Martin Corp. 1.5% •74% are Investment Grade STRATEGY • Generate Sustainable and Predictable Cash Flow to Distribute • Maximize Long-Term Shareholder Value • Maintain a Diverse Strategy to Balance Risk Exposure • Manage Balance Sheet Conservatively GEOGRAPHY DISTRIBUTIONS HISTORY MORTGAGE DEBT MATURITY SCHEDULE *Yield based on $10.00 share price *Percentages shown are of Total Assets The Woodlands Waterway® Marriott Hotel & Convention Center |
|
|
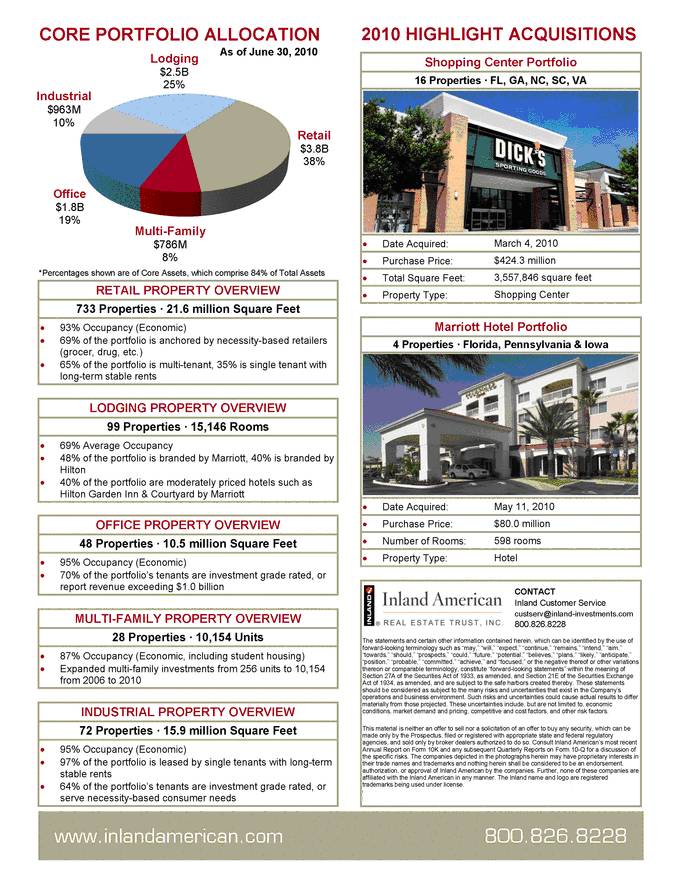
CORE PORTFOLIO ALLOCATION RETAIL PROPERTY OVERVIEW 733 As of June 30, 2010 Properties 21.6 million Square Feet • 93% Occupancy (Economic) • 69% of the portfolio is anchored by necessity-based retailers (grocer, drug, etc.) • 65% of the portfolio is multi-tenant, 35% is single tenant with long-term stable rents LODGING PROPERTY OVERVIEW 99 Properties · 15,146 Rooms • 69% Average Occupancy • 48% of the portfolio is branded by Marriott, 40% is branded by Hilton • 40% of the portfolio are moderately priced hotels such as Hilton Garden Inn & Courtyard by Marriott OFFICE PROPERTY OVERVIEW 48 Properties · 10.5 million Square Feet • 95% Occupancy (Economic) • 70% of the portfolio's tenants are investment grade rated, or report revenue exceeding $1.0 billion MULTI-FAMILY PROPERTY OVERVIEW 28 Properties · 10,154 Units • 87% Occupancy (Economic, including student housing) • Expanded multi-family investments from 256 units to 10,154 from 2006 to 2010 INDUSTRIAL PROPERTY OVERVIEW 72 Properties · 15.9 million Square Feet • 95% Occupancy (Economic) • 97% of the portfolio is leased by single tenants with long-term stable rents • 64% of the portfolio's tenants are investment grade rated, or serve necessity-based consumer needs 2010 HIGHLIGHT ACQUISITIONS Shopping Center Portfolio 16 Properties · FL, GA, NC, SC, VA • Date Acquired: March 4, 2010 • Purchase Price: $424.3 million • Total Square Feet: 3,557,846 square feet • Property Type: Shopping Center Marriott Hotel Portfolio 4 Properties · Florida, Pennsylvania & Iowa • Date Acquired: May 11, 2010 • Purchase Price: $80.0 million • Number of Rooms: 598 rooms • Property Type: Hotel The statements and certain other information contained herein, which can be identified by the use of forward-looking terminology such as "may," "will," "expect," "continue," "remains," "intend," "aim," "towards," "should," "prospects," "could," "future," "potential," "believes," "plans," "likely," "anticipate," "position," "probable," "committed," "achieve," and "focused," or the negative thereof or other variations thereon or comparable terminology, constitute "forward-looking statements" within the meaning of Section 27A of the Securities Act of 1933, as amended, and Section 21E of the Securities Exchange Act of 1934, as amended, and are subject to the safe harbors created thereby. These statements should be considered as subject to the many risks and uncertainties that exist in the Company's operations and business environment. Such risks and uncertainties could cause actual results to differ materially from those projected. These uncertainties include, but are not limited to, economic conditions, market demand and pricing, competitive and cost factors, and other risk factors. This material is neither an offer to sell nor a solicitation of an offer to buy any security, which can be made only by the Prospectus, filed or registered with appropriate state and federal regulatory agencies, and sold only by broker dealers authorized to do so. Consult Inland American's most recent Annual Report on Form 10K and any subsequent Quarterly Reports on Form 10-Q for a discussion of the specific risks. The companies depicted in the photographs herein may have proprietary interests in their trade names and trademarks and nothing herein shall be considered to be an endorsement, authorization, or approval of Inland American by the companies. Further, none of these companies are affiliated with the Inland American in any manner. The Inland name and logo are registered trademarks being used under license. www.inlandamerican.com 800.826.8228 *Percentages shown are of Core Assets, which comprise 84% of Total Assets CONTACT Inland Customer Service custserv@inland-investments.com 800.826.8228 Industrial $963M 10% Multi-Family $786M 8% Lodging $2.5B 25% CONTACT Inland Customer Service custserv@inland-investments.com 800.826.8228 Industrial $963M 10% |