Attached files
| file | filename |
|---|---|
| 8-K - FORM 8-K - PRUDENTIAL FINANCIAL INC | d8k.htm |
| EX-99.1 - NEWS RELEASE, DATED SEPTEMBER 30, 2010, OF PRUDENTIAL FINANCIAL, INC. - PRUDENTIAL FINANCIAL INC | dex991.htm |
 PRUDENTIAL FINANCIAL, INC.
ACQUISITION OF STAR/EDISON
ACQUISITION OF STAR/EDISON
SEPTEMBER 30, 2010
SEPTEMBER 30, 2010
1
Exhibit 99.2 |
 Attractive Financial Transaction
–
In-force business + cost synergies = attractive expected returns
–
Expected near-term accretion to earnings per share, growing as synergies
are realized
–
Meaningful contribution to Prudential’s ROE prospects
–
Strong expected cash flow and capital generation
Strategic Benefits for Prudential’s Japanese Insurance Business
–
Complementary distribution, well-suited to Prudential’s core protection
and retirement products
–
Increased scale supports efficient cost structure across Japanese businesses
–
Client base offers second-sale opportunities
Acquisition of Star/Edison
Acquisition of Star/Edison
Building on Success in a Market We Know Well
Building on Success in a Market We Know Well
2 |
 Low
Execution Risk Low Execution Risk
•
Products compatible with Prudential’s established Japanese
insurance operations
•
Recent update of Prudential’s administrative platform facilitates
absorption of acquired business
•
Seasoned Prudential management team with strong business
combination track record in Japan: Kyoei/Gibraltar Life (2001);
Aoba Life (2004); Yamato Life (2009)
•
Expected returns primarily based on in-force business that has
persisted through financial crisis
3 |
 Transaction Highlights
•
Purchase price $4.8 billion; “net”
purchase price, approximately $4.2
billion
(1)
•
Expected financing: approximately $1.7 billion available capital, $1.3 billion
equity issuance, $1.2 billion debt
•
Acquired businesses to be adequately capitalized at closing,
consistent with “AA”
ratings targets
(2)
•
Expected pre-tax integration expenses, $500 million over 5 year
period to achieve targeted annual cost savings of $250 million after
integration completed
•
Minimal goodwill
•
Closing expected first quarter, 2011
4
1)
“Net”
purchase price reflects expected application of a portion of net assets acquired to
repay assumed debt. 2)
Based
on
approximately
$4.2
billion
“net”
purchase
price. |
 Expected Transaction Financing
Available On-Balance-Sheet Capital
Available On-Balance-Sheet Capital
–
–
Parent company funds
Parent company funds
–
–
Capital resident in international units
Capital resident in international units
$1.7 billion
$1.7 billion
Common Equity
Common Equity
–
–
Public equity offering prior to closing
Public equity offering prior to closing
$1.3 billion
$1.3 billion
Debt Financing
Debt Financing
–
–
Long term senior notes of Prudential Financial, Inc.
Long term senior notes of Prudential Financial, Inc.
to be issued prior to closing
to be issued prior to closing
$1.2 billion
$1.2 billion
Total
Total
$4.2
$4.2
billion
billion
Ratio of Capital Debt
Ratio of Capital Debt
To Total Capitalization
To Total Capitalization
(1)
(1)
Actual
Actual
6/30/10
6/30/10
24.3%
24.3%
Pro-Forma with
Pro-Forma with
Expected Financing
Expected Financing
(2)
(2)
25.8%
25.8%
1)
For the Financial Services Businesses.
2)
Reflects repayment of third-party debt assumed in transaction.
5 |
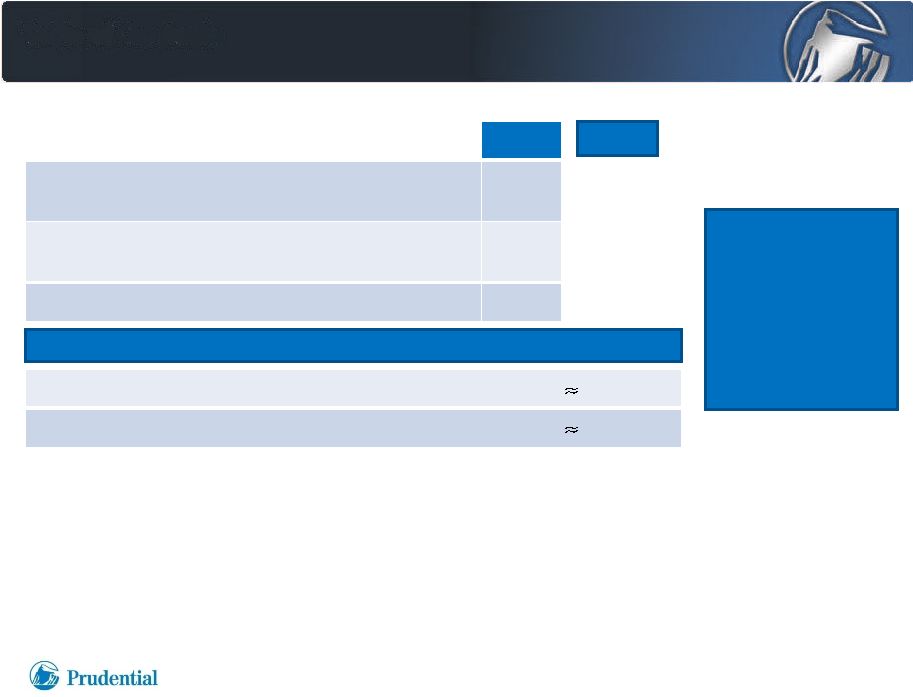 Attractive Financial Returns
Driven
Driven
by
by
In-Force
In-Force
Business
Business
and
and
Cost
Cost
Synergies
Synergies
(1)
(1)
6
1)
Amounts in millions except per share data.
2)
Excludes net realized capital gains and losses.
3)
Based on contribution of acquired businesses to after-tax adjusted operating
income of Financial Services Businesses before integration costs, net of
expected financing costs and impact of Prudential Common Stock issuance at $55.00
per share. 2009
2009
Star/Edison pre-tax operating income,
historical
basis
(2)
$900
Purchase accounting and other adjustments
(primarily reset of investment portfolio yield)
(500)
Pro-forma earnings base
$400
Approximately
30% of
Star/Edison
expense base,
realized over
3-5 year
period
Expected Cost
Synergies
$170 Expected Cost
Synergies
$170 Expected
EPS
Accretion
(3)
$.40
Expected
ROE
Accretion
(3)
70
bps
2012
2012 |
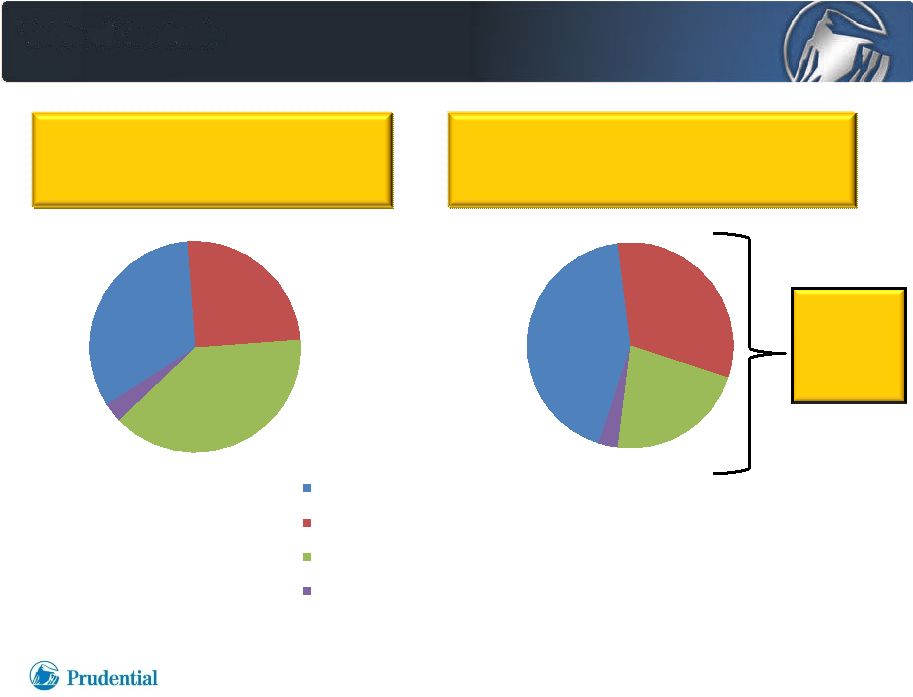
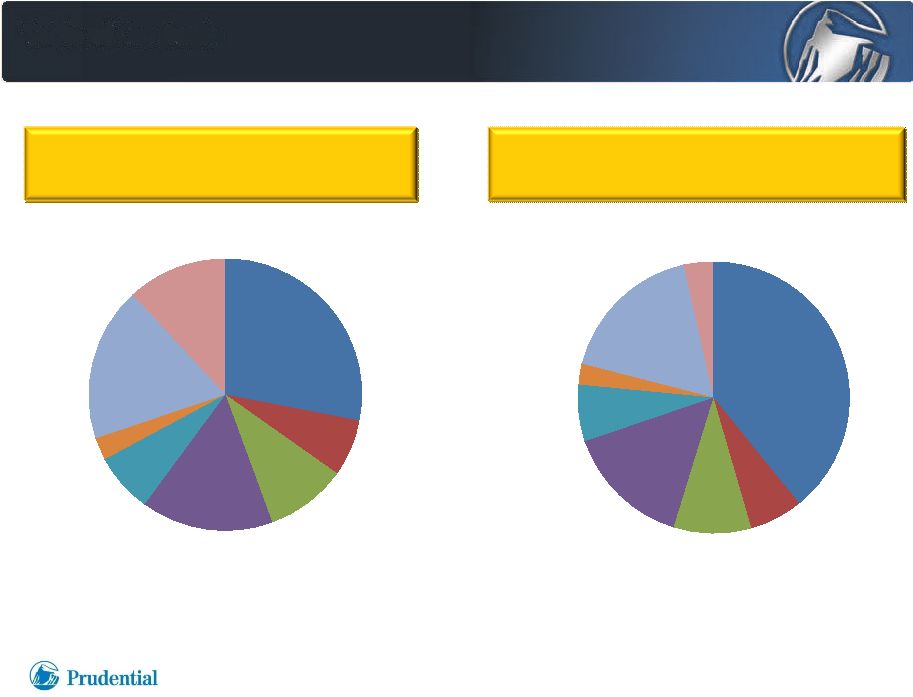 International
Insurance
39%
Group
Insurance
6%
Individual
Life
9%
Retirement
15%
Asset
Management
7%
International
Investments
2%
Individual
Annuities
18%
Corporate
and Other
4%
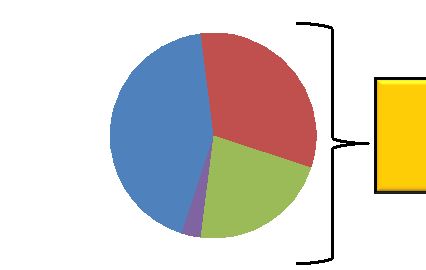
Transaction Effectively Deploys Capital and
Transaction Effectively Deploys Capital and
Strengthens Balanced Mix of Businesses
Strengthens Balanced Mix of Businesses
6/30/10 Actual
6/30/10 Actual
Attributed Equity $26.8 Billion
Attributed Equity $26.8 Billion
(1)
(1)
Pro-Forma Including Star/Edison,
Pro-Forma Including Star/Edison,
Attributed Equity $28.1 Billion
Attributed Equity $28.1 Billion
(1)(2)
(1)(2)
1)
For the Financial Services Businesses, excluding accumulated other comprehensive
income related to unrealized gains and losses on investments and pension /
postretirement benefits. 2)
Based on expected transaction financing.
7
International
Insurance
28%
Group
Insurance
7%
Individual
Life
9%
Retirement
16%
Asset
Management
7%
International
Investments
3%
Individual
Annuities
18%
Corporate
and Other
12% |
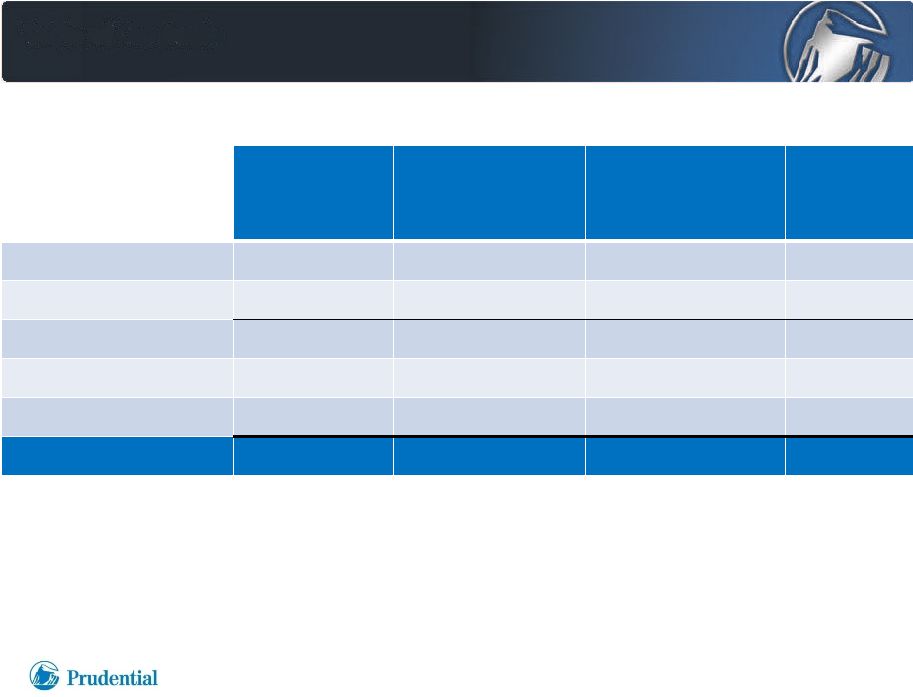 Building a Leading Foreign Life Insurer in Japan
Assets
Assets
(1)(2)(3)
(1)(2)(3)
($ Billions)
($ Billions)
Face Amount
Face Amount
in-Force
in-Force
(2)(3)(4)(5)
(2)(3)(4)(5)
($ Billions)
($ Billions)
Insurance
Insurance
Revenues
Revenues
(1)(3)(6)
(1)(3)(6)
($ Millions)
($ Millions)
Captive
Captive
Agents
Agents
(2)
(2)
Star
$ 18.6
$ 76.3
$ 1,462
4,333
Edison
29.0
70.5
2,065
3,400
Combined
47.6
146.8
3,527
7,733
Gibraltar Life
45.4
219.7
2,939
6,101
Prudential of Japan
35.4
303.6
4,046
3,122
TOTAL
TOTAL
$128.4
$128.4
$670.1
$670.1
$10,512
$10,512
16,956
16,956
1)
Certain data based on one month reporting lag.
2)
As of June 30, 2010.
3)
Translated based on actual exchange rates.
4)
Face amount in-force for individual insurance only (excluding annuity).
5)
Source: Life Insurance Association of Japan
6)
Net premiums, policy charges and fee income for the year ended December 31, 2009.
8 |
 Business Integration Drives Cost Synergies
•
Expect to integrate Star and Edison businesses with Prudential’s
Japanese insurance operations by early 2012
•
Integration includes branch and back office consolidations,
migration to Prudential’s IT platform, rationalization of
administrative expenses
•
Expect pre-tax integration costs of approximately $500 million
over 5 year period, including approximately $400 million in
2011-2012
•
Expect annual cost savings of about $170 million by 2012,
$200 million by 2013, and $250 million after integration completed
9 |
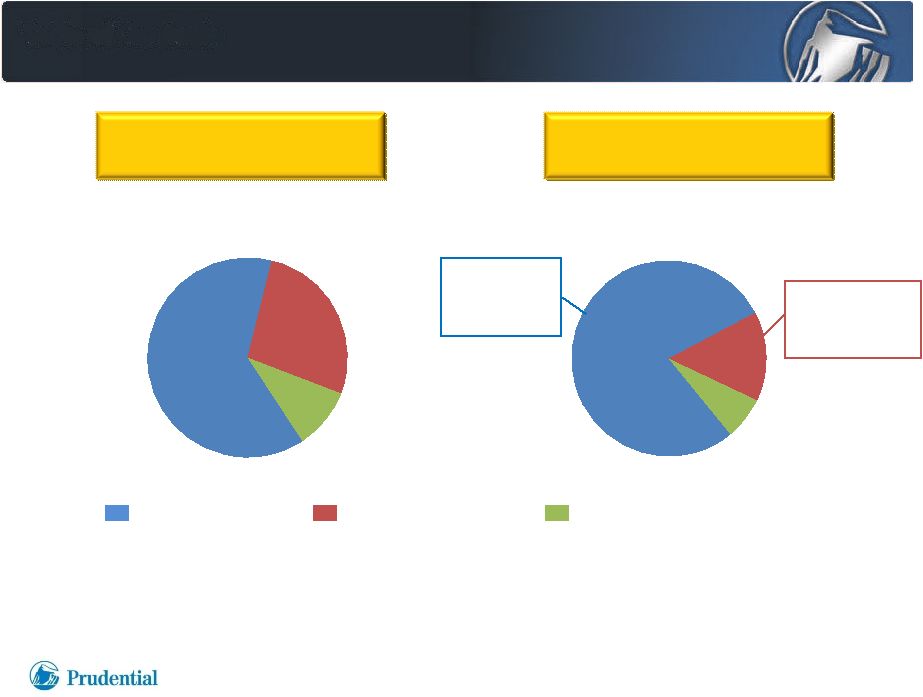 63%
27%
10%
78%
15%
7%
Diversified Distribution Channels
Diversified Distribution Channels
Star/Edison
Star/Edison
2009
2009
Sales
Sales
(1)
(1)
$599 million
$599 million
1)
Annualized new business premiums; foreign denominated activity translated to U.S.
dollars based on average exchange rates for periods indicated including 118
Japanese yen per U.S. dollar for 2007 and 94 Japanese yen per U.S. dollar for 2009; based on one-month reporting lag.
2)
As of June
30,
2010.
3)
Includes distribution through corporations and associations.
7,733
Captive
Agents
(2)
4,400
Independent
Agents
(2)
Star/Edison
Star/Edison
2007
2007
Sales
Sales
(1)
(1)
$708 million
$708 million
Captive
Agents Independent Agents
Banks
and
Other
Distribution
(3)
10 |
  33%
25%
39%
3%
Life Insurance -
whole life, term, universal life
Third Sector -
primarily hospital daily benefits
Fixed Annuities
Group Life -
primarily term insurance
Product Mix Compatible with Prudential’s
Product Mix Compatible with Prudential’s
Emphasis on Protection and Retirement Markets
Emphasis on Protection and Retirement Markets
Star/Edison
In-Force Annualized
Premiums
(1)
As of December 31, 2009
Star/Edison
Star/Edison
Annualized New Business Premiums
Annualized New Business Premiums
Year
Year
ended
ended
December
December
31,
31,
2009
2009
(1)
(1)
1)
1)
Foreign denominated activity translated to U.S. dollars based on
average exchange rates, Japanese yen 94 per U.S. dollar; data based on
one-month reporting lag; percentage comprised of U.S. dollar business
estimated. 11
45%
45%
U.S.
U.S.
dollar
dollar
business
business
43%
32%
22%
3% |
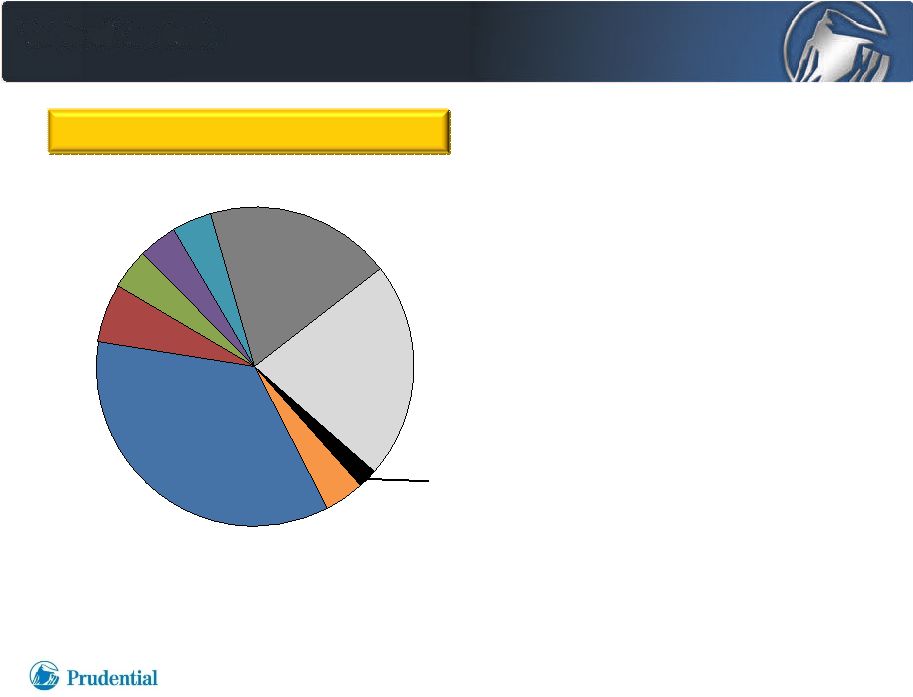 Star/Edison General Account Portfolio
1)
As of June 30, 2010, at estimated market value.
2)
Securities not rated by either Moody’s or S&P have been classified as
below investment grade for purposes of this display. 3)
Based on bonds and structured products.
•
90% of fixed maturity investments
are
investment
grade
(2)(3)
•
72% of non-Japanese bonds
are U.S. Dollar denominated
•
Expect to migrate portfolio to
reduce exposure to structured
securities, real estate and equities
Non-
Japanese
Corporate
Bonds
35%
Structured
Products
6%
Equities 4%
Loans 4%
Real Estate
4%
Japanese
Corporate
Bonds
19%
Japanese
Government
Bonds
22%
Other
Japanese
Bonds 2%
Non-
Japanese
Gov't
&
Muni Bonds
4%
12
$41 billion General Account
$41 billion General Account
(1)
(1) |
 Building on Success in a Market We Know Well
•
Attractive
financial
and
strategic
transaction;
expected
returns
primarily
driven
by
in-force
business
and
cost
synergies
•
Low strategic and execution risk: compatible products; updated
Prudential systems facilitate integration; seasoned management team
with strong business combination track record
•
Effective deployment of capital enhances Prudential’s ROE prospects;
accretive to earnings per share
•
Expanded footprint in Japan: world’s second largest insurance market,
with substantial retirement market opportunity driven by demographics
and savings fund base
•
Distribution and client base deepen and extend growth opportunities
in Japanese life insurance market
13 |
 Forward-Looking Statements
Certain of the statements included in this presentation constitute
forward-looking statements within the meaning of the U. S. Private Securities
Litigation Reform Act of 1995. It is possible that actual results may differ
materially from any expectations or predictions expressed in this
presentation. Words such as “expects,”
“believes,”
“anticipates,”
“includes,”
“plans,”
“assumes,”
“estimates,”
“projects,”
“intends,”
“should,”
“will,”
“shall,”
or variations of such words are generally part of forward-looking
statements. Forward-looking statements are made based on
management’s current expectations and beliefs concerning future developments
and their potential effects upon Prudential Financial, Inc. and its
subsidiaries.
There
can
be
no
assurance
that
future
developments
affecting
Prudential
Financial,
Inc.
and
its
subsidiaries
will
be
those
anticipated
by
management.
These
forward-looking
statements
are
not
a
guarantee
of
future
performance
and
involve
risks
and
uncertainties,
and
there
are
certain important factors that could cause actual results to differ, possibly
materially, from expectations or estimates reflected in such forward-
looking
statements,
including,
among
others:
(1)
general
economic,
market
and
political
conditions,
including
the
performance
and
fluctuations
of
fixed income, equity, real estate and other financial markets; (2) the availability
and cost of external financing for our operations, which has been
affected
by
the
stress
experienced
by
the
global
financial
markets;
(3)
interest
rate
fluctuations;
(4)
reestimates
of
our
reserves
for
future
policy
benefits and claims; (5)
differences between actual experience regarding mortality, morbidity, persistency,
surrender experience, interest rates or market
returns
and
the
assumptions
we
use
in
pricing
our
products,
establishing
liabilities
and
reserves
or
for
other
purposes;
(6)
changes
in
our
assumptions
related
to
deferred
policy
acquisition
costs,
valuation
of
business
acquired
or
goodwill;
(7)
changes
in
our
claims-paying
or
credit
ratings;
(8)
investment
losses,
defaults
and
counterparty
non-performance;
(9)
competition
in
our
product
lines
and
for
personnel;
(10)
changes
in
tax
law;
(11)
economic,
political,
currency
and
other
risks
relating
to
our
international
operations;
(12)
fluctuations
in
foreign
currency
exchange
rates
and
foreign
securities
markets;
(13)
regulatory
or
legislative
changes,
including
the
recently
enacted
Dodd-Frank
Wall
Street
Reform
and
Consumer
Protection Act; (14)
adverse determinations in litigation or regulatory matters and our exposure to
contingent liabilities, including in connection with our
divestiture
or
winding
down
of
businesses;
(15)
domestic
or
international
military
actions,
natural
or
man-made
disasters
including
terrorist
activities
or
pandemic
disease,
or
other
events
resulting
in
catastrophic
loss
of
life;
(16)
ineffectiveness
of
risk
management
policies
and
procedures
in
identifying,
monitoring
and
managing
risks;
(17)
effects
of
acquisitions,
divestitures
and
restructurings,
including
possible
difficulties
in
integrating
and
realizing
the
projected
results
of
acquisitions;
(18)
changes
in
statutory
or
U.S.
GAAP
accounting
principles,
practices
or
policies;
(19)
changes
in
assumptions
for
retirement
expense;
(20)
Prudential
Financial,
Inc.’s
primary
reliance,
as
a
holding
company,
on
dividends
or
distributions
from
its
subsidiaries
to
meet
debt
payment
obligations
and
the
ability
of
the
subsidiaries
to
pay
such
dividends
or
distributions
in
light
of
our
ratings
objectives
and/or
applicable
regulatory
restrictions;
and
(21)
risks
due
to
the
lack
of
legal
separation
between
our
Financial
Services
Businesses
and
our
Closed
Block
Business.
The
foregoing
risks
are
even
more
pronounced
in
severe
adverse
market
and
economic
conditions
such
as
those
that
began
in
the
second
half
of
2007
and
continued
into
2009.
Prudential
Financial,
Inc.
does
not
intend,
and
is
under
no
obligation,
to
update
any
particular
forward-looking
statement
included
in
this
presentation.
_______________________________________________________________________________
Prudential
Financial,
Inc.
of
the
United
States
is
not
affiliated
with
Prudential
PLC
which
is
headquartered
in
the
United
Kingdom.
14 |
 This
presentation
includes
references
to
“adjusted
operating
income.”
Adjusted
operating
income
is
a
non-GAAP
measure
of
performance
of
our
Financial
Services
Businesses.
Adjusted
operating
income
excludes
“Realized
investment
gains
(losses),
net,”
as
adjusted,
and
related
charges
and
adjustments.
A
significant
element
of
realized
investment
gains
and
losses
are
impairments
and
credit-related
and
interest
rate-related
gains
and
losses.
Impairments
and
losses
from
sales
of
credit-impaired
securities,
the
timing
of
which
depends
largely
on
market
credit
cycles,
can
vary
considerably
across
periods.
The
timing
of
other
sales
that
would
result
in
gains
or
losses,
such
as
interest
rate-related
gains
or
losses,
is
largely
subject
to
our
discretion
and
influenced
by
market
opportunities
as
well
as
our
tax
and
capital
profile.
Realized
investment
gains
(losses)
within
certain
of
our
businesses
for
which
such
gains
(losses)
are
a
principal
source
of
earnings,
and
those
associated
with
terminating
hedges
of
foreign
currency
earnings
and
current
period
yield
adjustments
are
included
in
adjusted
operating
income.
Realized
investment
gains
and
losses
from
products
that
are
free
standing
derivatives
or
contain
embedded
derivatives,
and
from
associated
derivative
portfolios
that
are
part
of
an
economic
hedging
program
related
to
the
risk
of
those
products,
are
included
in
adjusted
operating
income.
Adjusted
operating
income
excludes
gains
and
losses
from
changes
in
value
of
certain
assets
and
liabilities
related
to
foreign
currency
exchange
movements
that
have
been
economically
hedged,
as
well
as
gains
and
losses
on
certain
investments
that
are
classified
as
other
trading
account
assets
and
debt
that
is
carried
at
fair
value.
Adjusted
operating
income
also
excludes
investment
gains
and
losses
on
trading
account
assets
supporting
insurance
liabilities
and
changes
in
experience-rated
contractholder
liabilities
due
to
asset
value
changes,
because
these
recorded
changes
in
asset
and
liability
values
are
expected
to
ultimately
accrue
to
contractholders.
Trends
in
the
underlying
profitability
of
our
businesses
can
be
more
clearly
identified
without
the
fluctuating
effects
of
these
transactions.
In
addition,
adjusted
operating
income
excludes
the
results
of
divested
businesses,
which
are
not
relevant
to
our
ongoing
operations.
Discontinued
operations,
which
is
presented
as
a
separate
component
of
net
income
under
GAAP,
is
also
excluded
from
adjusted
operating
income.
We
believe
that
the
presentation
of
adjusted
operating
income
as
we
measure
it
for
management
purposes
enhances
understanding
of
the
results
of
operations
of
the
Financial
Services
Businesses
by
highlighting
the
results
from
ongoing
operations
and
the
underlying
profitability
of
our
businesses.
However,
adjusted
operating
income
is
not
a
substitute
for
income
determined
in
accordance
with
GAAP,
and
the
adjustments
made
to
derive
adjusted
operating
income
are
important
to
an
understanding
of
our
overall
results
of
operations.
For
additional
information
about
adjusted
operating
income
and
the
comparable
GAAP
measure
please
refer
to
our
Annual
Report
on
Form
10-K
for
the
year
ended
December
31,
2009
and
our
Quarterly
Report
on
Form
10-Q
for
the
quarter
ended
June
30,
2010
located
on
the
Investor
Relations
website
at
www.investor.prudential.com.
Additional
historical
information
relating
to
the
Company’s
financial
performance,
including
its
second
quarter
2010
Quarterly
Financial
Supplement,
is
also
located
on
the
Investor
Relations
website.
The
information
referred
to
above
and
on
the
prior
page,
as
well
as
the
risks
of
our
businesses
described
in
our
Annual
Report
on
Form
10-K
for
the
year
ended
December
31,
2009
and
our
Quarterly
Report
on
Form
10-Q
for
the
quarter
ended
June
30,
2010
should
be
considered
by
readers
when
reviewing
forward-looking
statements
contained
in
this
presentation.
Non–GAAP Measure
Non–GAAP Measure
15 |
 PRUDENTIAL FINANCIAL, INC.
ACQUISITION OF STAR/EDISON
ACQUISITION OF STAR/EDISON
SEPTEMBER 30, 2010
SEPTEMBER 30, 2010
16 |