Attached files
| file | filename |
|---|---|
| 8-K - FORM 8-K - TOYOTA MOTOR CREDIT CORP | dp19303.htm |
                     Presentation to Fixed Income Investors

                                 September 2010
|
 |
Disclaimer Disclaimer

This presentation includes certain "forward-looking statements" within the
meaning of The U.S. Private Securities Litigation Reform Act of 1995.

These statements are based on current expectations and currently available
information.

Actual results may differ materially from these expectations due to certain
risks, uncertainties and other important factors, including the risk factors set
forth in the most recent annual and periodic reports of Toyota Motor Corporation
and Toyota Motor Credit Corporation

We do not undertake to update the forward-looking statements to reflect actual
results or changes in the factors affecting the forward-looking statements.

This presentation does not constitute an offer to sell or a solicitation of an
offer to purchase any securities. Any offer or sale of securities will be made
only by means of a prospectus and related documentation.


                                                                               2
|
 |
Toyota's Global Businesses


                                                                               3
|
 |
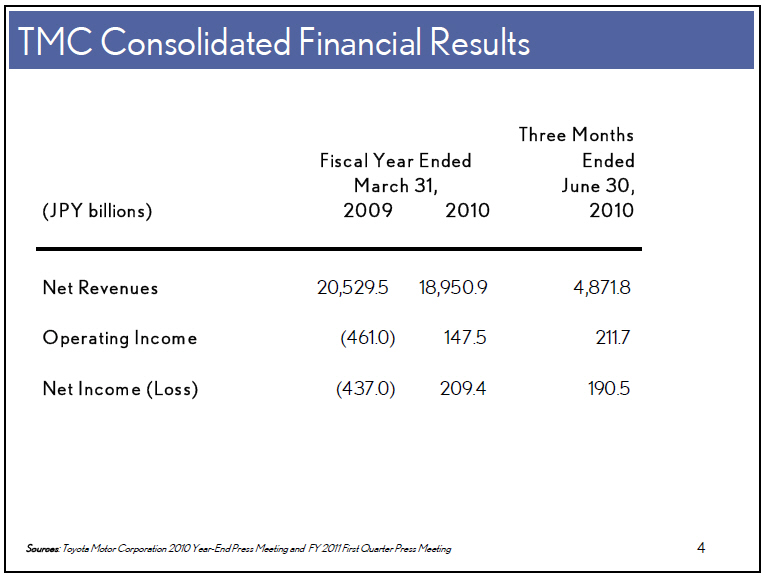
TMC Consolidated Financial Results

                                                     Three Months
                              Fiscal Year Ended             Ended
                                 March 31,               June 30,
(JPY billions)                 2009        2010              2010
-----------------------------------------------------------------

Net Revenues               20,529.5    18,950.9           4,871.8
Operating Income             (461.0)      147.5             211.7
Net Incom e ( Loss)          (437.0)      209.4             190.5

Sources: Toyota Motor Corporation 2010 Year-End Press Meeting and FY 2011 First
Quarter Press Meeting 4

                                                                               4
|
 |
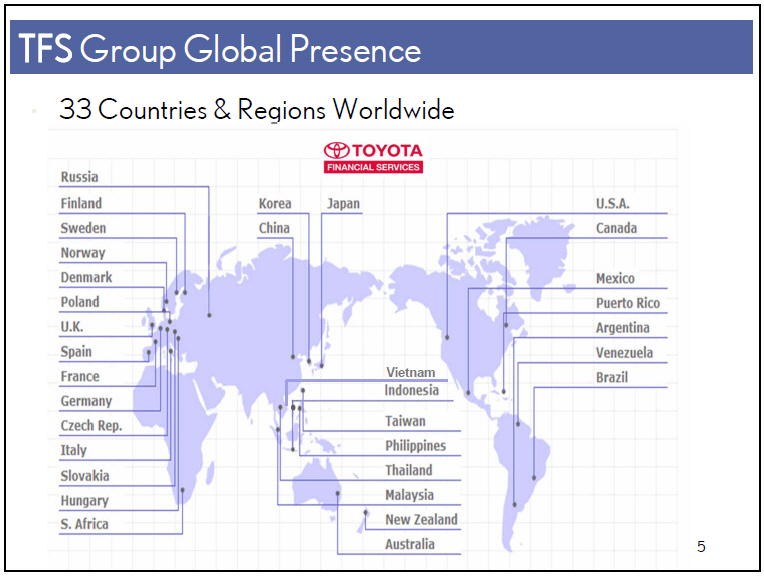
TFS Group Global Presence

33 Countries andRegions Worldwide

                                                                               5
|
 |
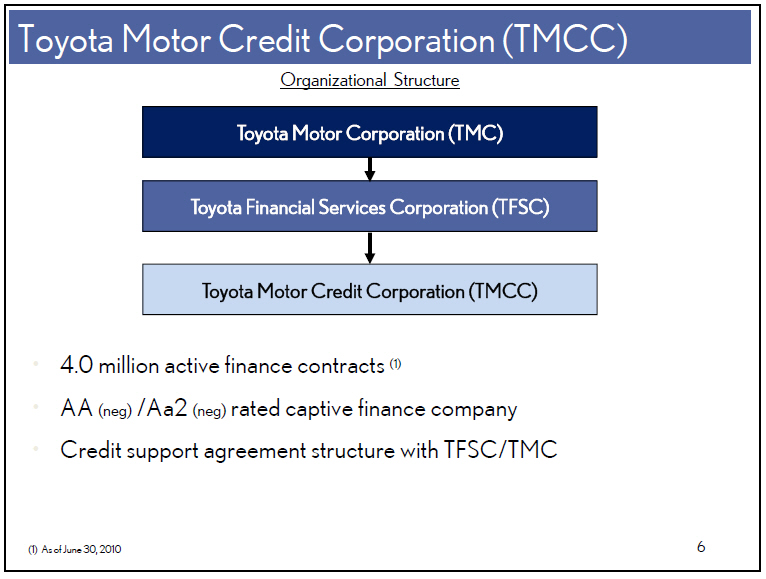
Toyota Motor Credit Corporation (TMCC)

Organizational Structure

                         Toyota Motor Corporation (TMC)

                  Toyota Financial Services Corporation (TFSC)

                     Toyota Motor Credit Corporation (TMCC)

4.0 million active finance contracts (1)
AA (neg) /Aa2 (neg) rated captive finance company
Credit support agreement structure with TFSC/TMC

(1) As of June 30, 2010

                                                                               6
|
 |
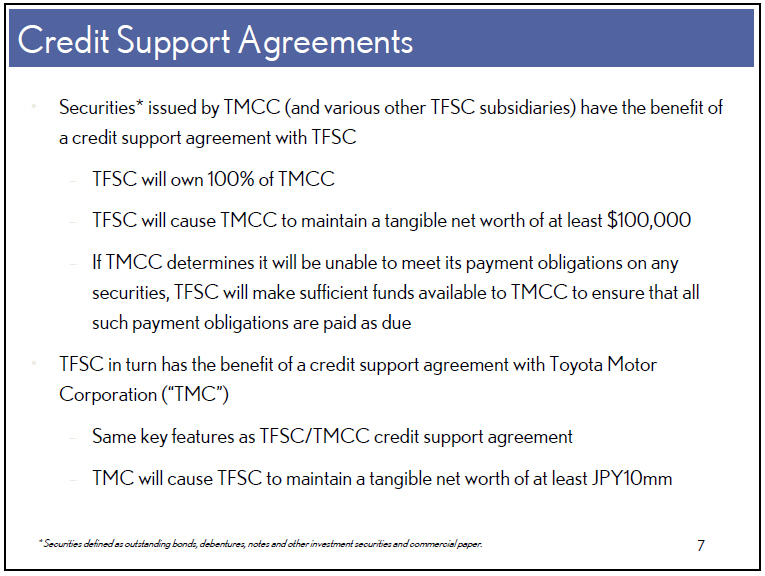
Credit Support Agreements

Securities* issued by TMCC (and various other TFSC subsidiaries) have the
benefit of a credit support agreement with TFSC

     TFSC will own 100% of TMCC

     TFSC will cause TMCC to maintain a tangible net worth of at least $100,000

     If TMCC determines it will be unable to meet its payment obligations on any
     securities, TFSC will make sufficient funds available to TMCC to ensure
     that all such payment obligations are paid as due

TFSC in turn has the benefit of a credit support agreement with Toyota Motor
Corporation ("TMC")

     Same key features as TFSC/TMCC credit support agreement

     TMC will cause TFSC to maintain a tangible net worth of at least JPY10mm

* Securities defined as outstanding bonds, debentures, notes and other
investment securities and commercial paper.


                                                                               7
|
 |
TMCC Products and Services


Consumer          Dealer               Commercial
Finance           Finance              Finance               Insurance

Retail            Wholesale            Forklift              Service Agmts
Lease             Real Estate          Hino Medium Duty      Ext. Warranty
                  Working Capital      Class 8 Heavy Duty    Guaranteed Auto
                  Revolving Credit     Retail                Protection
                  Lines                Lease                 Roadside Assistance


                                                                               8
|
 |
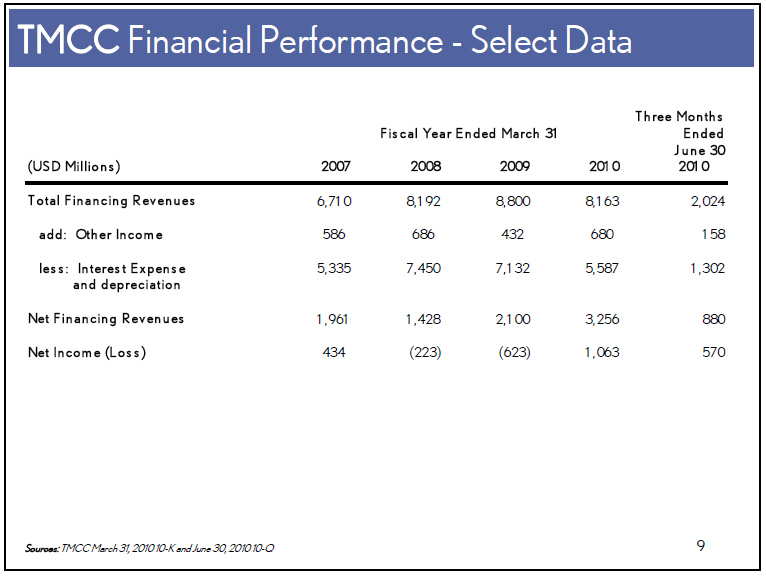
TMCC Financial Performance -Select Data
(USD Millions)


Sources: TMCC March 31, 2010 10-K and June 30, 2010 10-Q 9

                                                                               9
|
 |
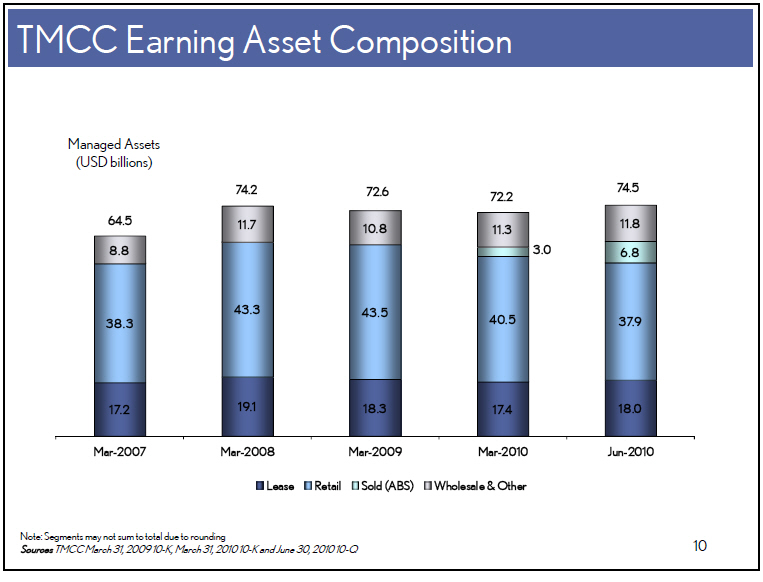
TMCC Earning Asset Composition TMCC Earning Asset Composition
Managed Assets
(USD billions)


Mar-2007   Mar-2008   Mar-2009   Mar-2010   Jun-2010

                  Lease Retail Sold (ABS) Wholesale and Other

Note: Segments may not sum to total due to rounding
Sources TMCC March 31, 2009 10-K, March 31, 2010 10-K and June 30, 2010 10-Q
64.5

                                                                              10
|
 |
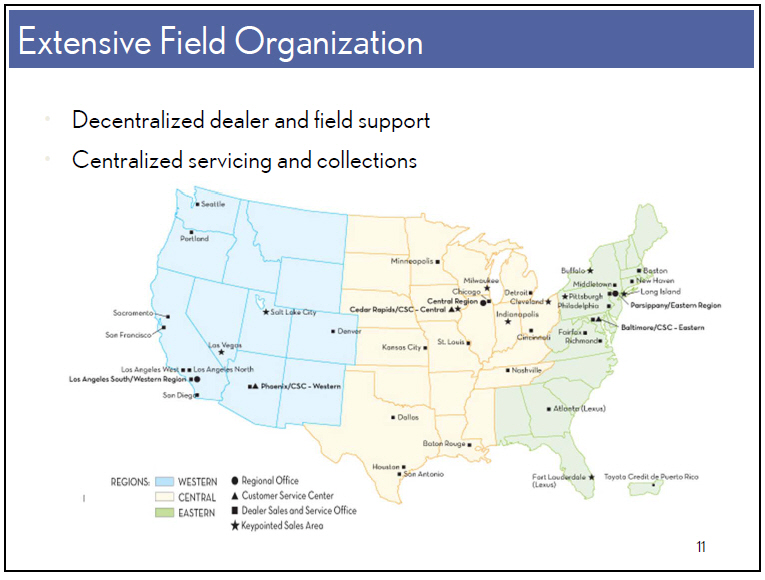
Extensive Field Organization

Decentralized dealer and field support
Centralized servicing and collections


                                                                              11
|
 |
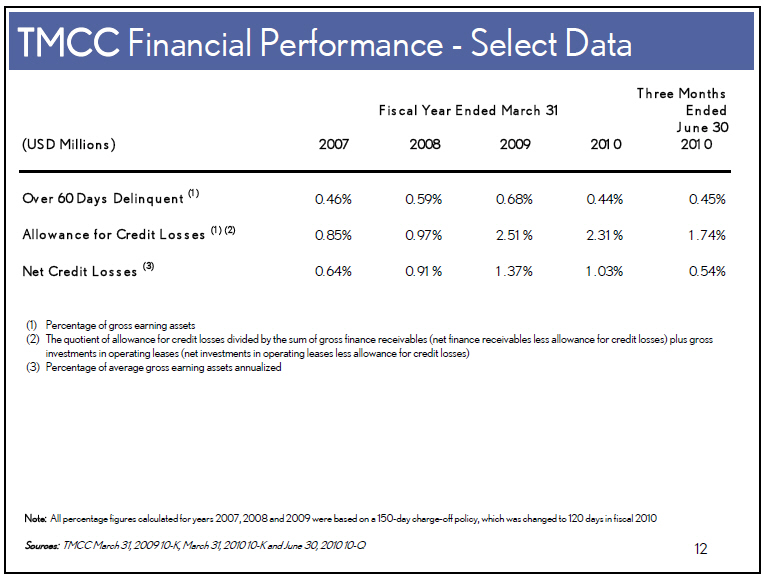
TMCC Financial Performance - Select Data

                                                                Three Months
                                         Fiscal Year Ended March 31    Ended
                                                                     June 30
(USD Millions)                        2007     2008     2009    2010    2010

Over 60 Days Delinquent (1)          0.46%    0.59%    0.68%   0.44%   0.45%

Allowance for Credit Losses (1) (2)  0.85%    0.97%    2.51%   2.31%   1.74%

Net Credit Losses (3)                0.64%    0.91%    1 .37%  1.03%   0.54%

(1) Percentage of gross earning assets

(2) The quotient of allowance for credit losses divided by the sum of gross
finance receivables (net finance receivables less allowance for credit losses)
plus gross investments in operating leases (net investments in operating leases
less allowance for credit losses)

(3) Percentage of average gross earning assets annualized

Note: All percentage figures calculated for years 2007, 2008 and 2009 were based
on a 150-day charge-off policy, which was changed to 120 days in fiscal 2010

Sources: TMCC March 31, 2009 10-K, March 31, 2010 10-K and June 30, 2010 10-Q

                                                                              12
|
 |
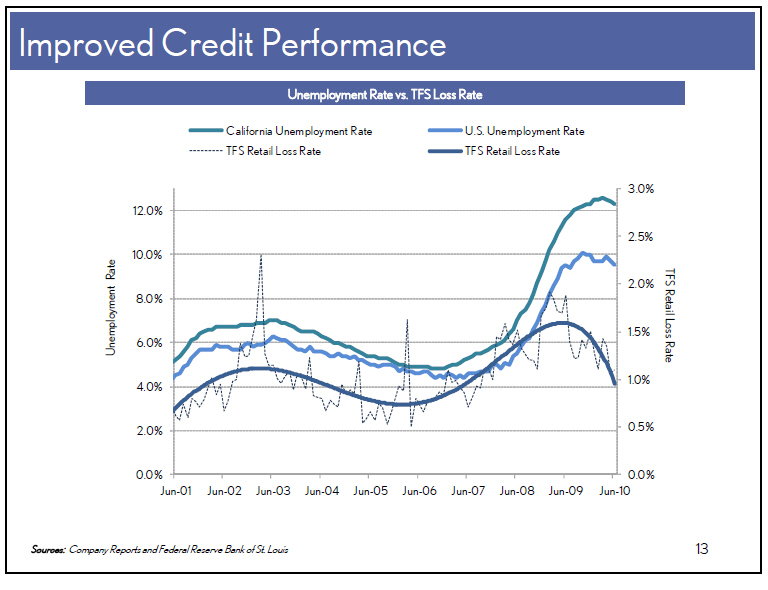
Improved Credit Performance

                      Unemployment Rate vs. TFS Loss Rate

Sources: Company Reports and Federal Reserve Bank of St. Louis
|
 |
TMCC Funding Programs

                                                                              14
|
 |
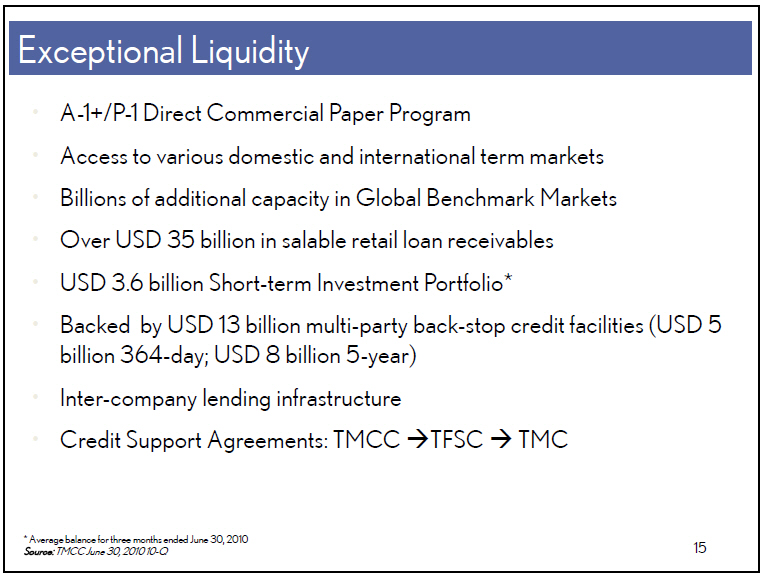
Exceptional Liquidity Exceptional Liquidity

A-1+ / P-1 Direct Commercial Paper Program

Access to various domestic and international term markets

Billions of additional capacity in Global Benchmark Markets

Over USD 35 billion in salable retail loan receivables

USD 3.6 billion Short-term Investment Portfolio*

Backed by USD 13 billion multi-party back-stop credit facilities (USD 5
billion 364-day; USD 8 billion 5-year)

Inter-company lending infrastructure

Credit Support Agreements: TMCC - TFSC - TMC

* Average balance for three months ended June 30, 2010

Source: TMCC June 30, 2010 10-Q


                                                                              15
|
 |
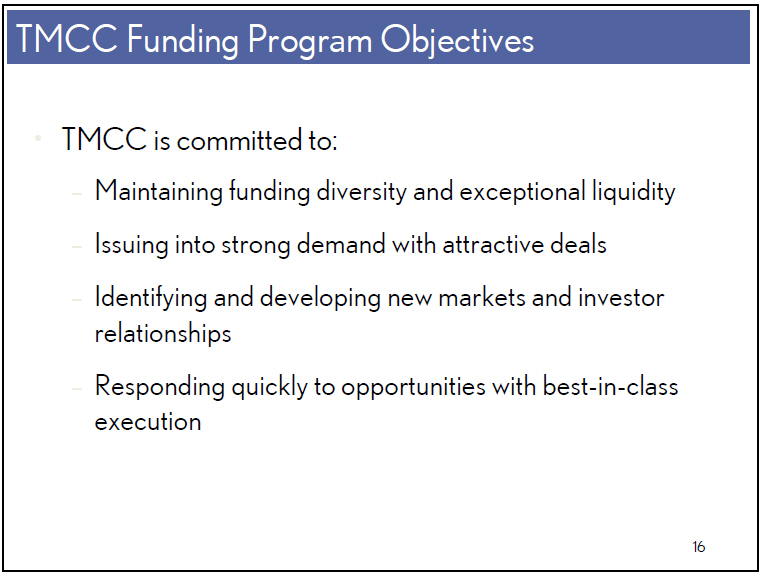
TMCC Funding Program Objectives TMCC Funding Program Objectives

TMCC is committed to:

     Maintaining funding diversity and exceptional liquidity

     Issuing into strong demand with attractive deals

     Identifying and developing new markets and investor relationships

     Responding quickly to opportunities with best-in-class execution


                                                                              16
|
 |
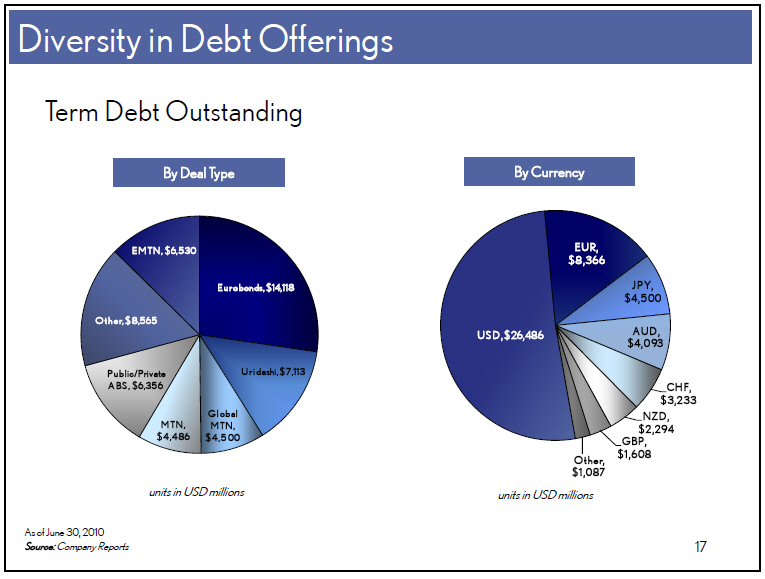
Diversity in Debt Offerings

Term Debt Outstanding

                   By Deal Type             By Currency


              units in USD millions   units in USD millions

As of June 30, 2010
Source: Company Reports

                                                                              17
|
 |
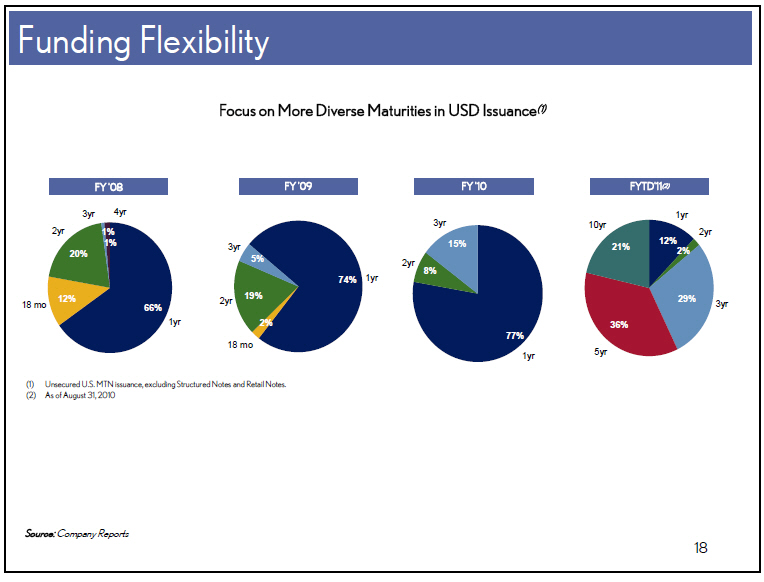
Funding Flexibility

              Focus on More Diverse Maturities in USD Issuance(1)

                  FY '08  FY '09  FY '10  FYTD 11(2)


(1) Unsecured U.S. MTN issuance, excluding Structured Notes and Retail Notes.
(2) As of August 31, 2010

Source: Company Reports

                                                                              18
|
 |
Key Investment Highlights Key Investment Highlights

Financial strength supported by strong credit ratings

Transparent business model with exceptional liquidity

Rational funding programs with long term perspective

     Diversification in bond offerings

     Focus on proactively meeting needs of market

     Strong emphasis placed on flexibility and responsiveness

                                                                              19
|
 |
|
|
 |