Attached files
| file | filename |
|---|---|
| EX-32 - EX-32 - MxEnergy Holdings Inc | a10-18479_1ex32.htm |
| EX-31.1 - EX-31.1 - MxEnergy Holdings Inc | a10-18479_1ex31d1.htm |
| EX-31.2 - EX-31.2 - MxEnergy Holdings Inc | a10-18479_1ex31d2.htm |
UNITED STATES
SECURITIES AND EXCHANGE COMMISSION
Washington, D.C. 20549
FORM 10-K/A
Amendment No. 1
(Mark One)
x ANNUAL REPORT PURSUANT TO SECTION 13 OR 15(d) OF THE SECURITIES EXCHANGE ACT OF 1934
For the fiscal year ended June 30, 2010
OR
o TRANSITION REPORT PURSUANT TO SECTION 13 OR 15(d) OF THE SECURITIES EXCHANGE ACT OF 1934
For the transition period from to
Commission File Number 333-138425
MXENERGY HOLDINGS INC.
(Exact Name of Registrant as Specified in Its Charter)
|
Delaware |
|
20-2930908 |
|
(State or Other Jurisdiction of |
|
(I.R.S. Employer Identification No.) |
|
Incorporation or Organization) |
|
|
|
|
|
|
|
595 Summer Street, Suite 300 |
|
|
|
Stamford, Connecticut |
|
06901 |
|
(Address of Principal Executive Offices) |
|
(Zip Code) |
(203) 356-1318
(Registrant’s telephone number, including area code)
Indicate by check mark if the registrant is a well-known seasoned issuer, as defined in Rule 405 under the Securities Act. Yes o No x
Indicate by check mark if the registrant is not required to file reports pursuant to Section 13 or Section 15(d) of the Securities Act. Yes o No x
Indicate by check mark whether the registrant: (1) has filed all reports required to be filed by Section 13 or 15(d) of the Securities Exchange Act of 1934 during the preceding 12 months (or for such shorter period that the registrant was required to file such reports), and (2) has been subject to such filing requirements for the past 90 days. Yes o No x
Indicate by check mark whether the registrant has submitted electronically and posted on its corporate Website, if any, every Interactive Data File required to be submitted and posted pursuant to Rule 405 of Regulation S-T (§232.405 of this chapter) during the preceding 12 months (or for such shorter period that the registrant was required to submit and post such files). Yes o No o
Indicate by check mark if disclosure of delinquent filers pursuant to Item 405 of Regulation S-K (§229.405 of this chapter) is not contained herein, and will not be contained, the best of registrant’s knowledge, in definitive proxy or information statements incorporated by reference in Part III of this Form 10-K or any amendment to this Form 10-K. x
Indicate by check mark whether the registrant is a large accelerated filer, an accelerated filer, a non-accelerated filer or a smaller reporting company. See definitions of “large accelerated filer,” “accelerated filer” and “smaller reporting company” in Rule 12b-2 of the Exchange Act. (Check one):
|
Large accelerated filer o |
|
Accelerated filer o |
|
|
|
|
|
Non-accelerated filer x |
|
Smaller reporting company o |
|
(Do not check if a smaller reporting company) |
|
|
Indicate by check mark whether the registrant is a shell company (as defined in Rule 12b-2 of the Act). Yes o No x
Aggregate market value of voting and non-voting common equity held by non-affiliates of the registrant: Not applicable. The registrant has no publicly traded equity securities.
As of August 31, 2010, there were 33,710,902 shares of the Registrant’s Class A Common Stock (par value $0.01 per share), 4,002,290 shares of the Registrant’s Class B Common Stock (par value $0.01 per share) and 16,438,669 shares of the Registrant’s Class C Common Stock (par value $0.01 per share) outstanding.
Documents incorporated by reference: None
EXPLANATORY NOTE
This Amendment No. 1 on Form 10-K/A (“Amendment”) amends and restates in its entirety the Registrant’s Annual Report on Form 10-K for the fiscal year ended June 30, 2010 as originally filed with the Securities and Exchange Commission on September 28, 2010 (the “Original Filing”). This Amendment is being filed to correct an inadvertent clerical error in the Item 6 table which provides a reconciliation of Adjusted EBITDA to net cash provided by (used in) operating activities that appears on page 32 herein.
Pursuant to Rule 12b-15 under the Securities Exchange Act of 1934, as amended (the “Exchange Act”), the certifications required pursuant to the rules promulgated under the Exchange Act, as adopted pursuant to Sections 302 and 906 of the Sarbanes-Oxley Act of 2002, which were included as exhibits to the Original Filing, have been restated and re-executed as of the date of this Amendment and are included as Exhibits 31.1, 31.2 and 32 hereto.
This Amendment has no effect on the Registrant’s consolidated financial statements. Except as described above, this Amendment does not amend, update or change any other items or disclosures contained in the Original Filing or otherwise reflect events that occurred subsequent to the filing of the Original Filing.
MXENERGY HOLDINGS INC.
ANNUAL REPORT ON FORM 10-K/A
FOR THE FISCAL YEAR ENDED JUNE 30, 2010
|
Item |
|
|
Page |
|
|
|
|
|
|
|
|
|
|
|
|
4 |
||
|
|
18 |
||
|
|
28 |
||
|
|
28 |
||
|
|
28 |
||
|
|
28 |
||
|
|
|
|
|
|
|
|
|
|
|
|
29 |
||
|
|
30 |
||
|
Management’s Discussion and Analysis of Financial Condition and Results of Operations |
|
35 |
|
|
|
61 |
||
|
|
64 |
||
|
Changes in and Disagreements with Accountants on Accounting and Financial Disclosure |
|
113 |
|
|
|
113 |
||
|
|
115 |
||
|
|
|
|
|
|
|
|
|
|
|
|
116 |
||
|
|
121 |
||
|
Security Ownership of Certain Beneficial Owners and Management and Related Stockholders Matters |
|
138 |
|
|
Certain Relationships and Related Transactions, and Director Independence |
|
141 |
|
|
|
145 |
||
|
|
|
|
|
|
|
|
|
|
|
|
146 |
||
|
|
|
|
|
|
|
147 |
||
Cautionary Note Regarding Forward-Looking Statements
Some statements in this Annual Report on Form 10-K (the “Annual Report”) are known as “forward-looking statements” within the meaning of Section 27A of the Securities Act of 1933, as amended (the “Securities Act”), and Section 21E of the Securities Exchange Act of 1934, as amended (the “Exchange Act”). Forward-looking statements include, but are not limited to, statements about our plans, objectives, expectations and intentions and other statements contained in the Annual Report that are not historical facts and may relate to, among other things:
· future performance generally;
· our business goals, strategy, plans, objectives and intentions;
· our post-acquisition integration of acquired businesses;
· expectations concerning future operations, margins, profitability, attrition, bad debts, expenses, interest rates, liquidity and capital resources; and
· expectations regarding the effectiveness of our hedging practices and the performance of suppliers, pipelines and transmission companies, storage operators, independent system operators, financial hedge providers, banks providing working capital and other counterparties supplying, transporting, and storing physical commodity.
When used in this Annual Report on Form 10-K, the words “may,” “will,” “should,” “expects,” “anticipates,” “intends,” “plans,” “believes,” “seeks,” “predicts,” “estimates,” “potential,” “continue,” “projected” and similar expressions are generally intended to identify forward-looking statements, although the absence of such a word does not mean that such statement is not a forward-looking statement.
Forward-looking statements are subject to risks, uncertainties, and assumptions about us and our operations that are subject to change based on various important factors, some of which are beyond our control. The following factors, as well as the factors identified in “Risk Factors,” among others, could cause our financial performance to differ significantly from the goals, plans, objectives, intentions and expectations expressed in our forward-looking statements:
· failures in our risk management policies and hedging procedures;
· shortfalls in marketing or unusual customer attrition that result in our purchases exceeding our supply commitments;
· unavailability or lack of reliability in monthly settlement index prices;
· changes in the forward prices of natural gas and electricity;
· insufficient liquidity to properly implement our hedging strategy or manage commodity supply;
· changes in weather patterns from historical norms that affect customer consumption patterns;
· failure of our customers to pay their bills or our failure to maintain adequate billing and collection procedures;
· failure of LDCs (as defined herein) to pay amounts owed to us when due;
· failure to collect imbalance receivables;
· inaccuracy of data in our billing systems;
· disruptions in local transportation and transmission facilities;
· changes in regulations that affect our ability to use marketing channels;
· changes in statutes or regulations that affect growth and commodity, operating or financing costs or otherwise impact our profitability;
· investigations by any state utility commissions, state attorneys general or federal agencies that could result in fines, sanctions or damage to our reputation;
· failure to properly manage our growth;
· the loss of key members of management or failure to retain employees;
· changes in general economic conditions;
· competition from utilities and other marketers;
· malfunctions in computer hardware or software or in database management systems or power systems, due to mechanical or human error, that result in billing errors or problems with collections, reconciliation, accounting or risk management;
· natural disasters, including hurricanes; and
· our reliance on energy infrastructure and transportation within the United States and Canada.
Therefore, we caution you not to place undue reliance on any forward-looking statements. We undertake no obligation to publicly update or revise any forward-looking statements after the date of this Annual Report on Form 10-K to conform these statements to actual results. All forward-looking statements attributable to us are expressly qualified by these cautionary statements.
Definitions
References in this Annual Report to “Holdings” refer to MXenergy Holdings Inc., a Delaware corporation. References to “the Company,” “we,” “us,” “our,” or similar terms refer to Holdings together with its consolidated subsidiaries.
References to “MMBtu” refer to a million British thermal units, a standard unit of heating equivalent measure for natural gas. A unit of heat equal to 1,000,000 Btus, or 1 MMBtu, is the thermal equivalent of approximately 1,000 cubic feet of natural gas. One billion cubic feet, or BCF, of gas is approximately 1,000,000 MMBtus.
References to “MWhr” refer to megawatt hours, each representing 1 million watt hours or a thousand kilowatt hours, which is the amount of electric energy produced or consumed in a period of time.
References to “RCEs” refer to residential customer equivalents, each of which represents a natural gas customer with a standard consumption of 100 MMBtus per year or an electricity customer with a standard consumption of 10 MWhrs per year. These quantities, which are used for convenience, represent the approximate amount of natural gas or power used by a typical household in some parts of the country.
References to “LDC” refer to a local distribution company, or utility, that provides the distribution infrastructure to supply natural gas and electricity to our customers. In some cases, LDCs also provide billing services and guarantee customer accounts receivable within various markets that we serve.
References to “customers” refer to individual accounts served by us. An individual or business with multiple accounts will be counted multiple times in our tabulation of customers. An individual or business may be counted as a single customer despite having multiple meters in a single location. A governmental entity or LDC may be counted as a single customer despite representing an aggregation of multiple consumers of natural gas or electricity within a geographic service area under the terms of specific service agreements. Prospective customers that have initiated new service from us are not included in our customer portfolio until we have completed all required processing steps, including credit verification and sharing of appropriate information with the respective LDC. Customers that have initiated the process for termination of their service are included in our customer portfolio until the termination has been properly processed and coordinated with the LDC.
Company Overview, History and Development
The Company was founded and incorporated in the state of Delaware in 1999. Headquartered in Stamford, Connecticut, we are an independent energy provider of retail natural gas and electric power to residential and commercial customers in deregulated markets in the U.S. and Canada. We are one of a number of retail energy marketers in the growing deregulated market. We currently serve natural gas and electricity customers located in 41 market areas across 14 states in the U.S. and in the provinces of Ontario and British Columbia in Canada.
The following map reflects the states in the U.S. and the Canadian provinces where we have natural gas and electricity customers as of June 30, 2010.

Recent Developments
Equity and Debt Restructuring
A sharp drop in natural gas market prices during the six months ended December 31, 2008 resulted in a significant reduction in the available borrowing base under the Company’s revolving credit facility (the “Revolving Credit Facility”). The reduced borrowing base strained the Company’s ability to post letters of credit as collateral with suppliers and hedge providers, caused defaults of certain financial covenants included in the agreement that governed the Revolving Credit Facility, prompted downgrades in the Company’s ratings from credit rating agencies and ultimately resulted in the Company obtaining material waivers of, and amendments to, the agreement that governed the Revolving Credit Facility and the Company’s principal commodity hedge facility (the “Hedge Facility”). Such amendments had material direct impacts on the Company’s liquidity position and operations during fiscal year 2009 and the first three months of fiscal year 2010, including requiring that the Company seek a new facility to replace the Revolving Credit Facility and the Hedge Facility.
On September 22, 2009, the Company completed an equity and debt restructuring, which included various transactions (the “Restructuring”). The Restructuring included a debt exchange transaction that was accounted for as a troubled-debt restructuring in accordance with accounting principles generally accepted in the United States (“U.S. GAAP”) and therefore did not result in any gain or loss recorded in the consolidated statements of operations. The Company also entered into two master supply and hedge agreements with Sempra Energy Trading LLC (“RBS Sempra”) (the “ISDA Master Agreements” and collectively, the “Commodity Supply Facility”) to replace the Revolving Credit Facility and Hedge Facility. The transactions consummated in connection with the Restructuring had material impacts on various asset, liability and stockholders’ equity accounts during the quarter ended September 30, 2009, as summarized in the following table.
|
|
|
Balance at |
|
Restructuring |
|
Other |
|
Balance at |
|
||||
|
|
|
(in thousands) |
|
||||||||||
|
Selected asset accounts: |
|
|
|
|
|
|
|
|
|
||||
|
Cash and cash equivalents |
|
$ |
23,266 |
|
$ |
(2,375 |
) |
$ |
(17,385 |
) |
$ |
3,506 |
|
|
Restricted cash |
|
75,368 |
|
(75,000 |
) |
1,133 |
|
1,501 |
|
||||
|
Accounts receivable — RBS Sempra |
|
— |
|
17,948 |
|
(6,072 |
) |
11,876 |
|
||||
|
Fixed Rate Notes Escrow Account |
|
— |
|
8,977 |
|
— |
|
8,977 |
|
||||
|
Deferred debt issue costs |
|
4,475 |
|
15,083 |
|
(3,546 |
) |
16,012 |
|
||||
|
Net impact on selected asset accounts |
|
$ |
103,109 |
|
$ |
(35,367 |
) |
$ |
(25,870 |
) |
$ |
41,872 |
|
|
|
|
|
|
|
|
|
|
|
|
||||
|
Selected Liability and stockholders’ equity accounts: |
|
|
|
|
|
|
|
|
|
||||
|
Liabilities: |
|
|
|
|
|
|
|
|
|
||||
|
Bridge Financing Loans payable |
|
$ |
5,400 |
|
$ |
(5,400 |
) |
$ |
— |
|
$ |
— |
|
|
Denham Credit Facility |
|
12,000 |
|
(12,000 |
) |
— |
|
— |
|
||||
|
Long-term debt: |
|
|
|
|
|
|
|
|
|
||||
|
Fixed Rate Notes due 2014 |
|
— |
|
49,951 |
|
79 |
|
50,030 |
|
||||
|
Floating Rate Notes due 2011 |
|
163,476 |
|
(158,787 |
) |
1,665 |
|
6,354 |
|
||||
|
Net impact on selected liability accounts |
|
180,876 |
|
(126,236 |
) |
1,744 |
|
56,384 |
|
||||
|
|
|
|
|
|
|
|
|
|
|
||||
|
Redeemable convertible preferred stock |
|
54,632 |
|
(54,632 |
) |
— |
|
— |
|
||||
|
|
|
|
|
|
|
|
|
|
|
||||
|
Stockholders’ equity: |
|
|
|
|
|
|
|
|
|
||||
|
Common stock |
|
47 |
|
496 |
|
— |
|
543 |
|
||||
|
Additional paid in capital |
|
18,275 |
|
119,080 |
|
(117 |
) |
137,238 |
|
||||
|
Accumulated deficit |
|
(90,469 |
) |
25,925 |
|
(10,236 |
) |
(74,780 |
) |
||||
|
Net impact on selected stockholders’ equity accounts |
|
(72,147 |
) |
145,501 |
|
(10,353 |
) |
63,001 |
|
||||
|
Net impact on selected liability and stockholders’ equity accounts |
|
$ |
163,361 |
|
$ |
(35,367 |
) |
$ |
(8,609 |
) |
$ |
119,385 |
|
Material impacts of the Restructuring are further described in the “Balance Sheet Overview” section within Item 7 of this Annual Report. As a result of the Restructuring, we significantly decreased our outstanding debt obligations, which resulted in lower debt service requirements for fiscal year 2010 and future years. In addition, the Revolving Credit Facility and Hedge Facility were replaced by the Commodity Supply Facility, which provides us with a stable source of liquidity through August 2012 with an investment grade counterparty. Overall, the transactions consummated in the Restructuring improved our liquidity position, improved our financial and operational flexibility and allowed us to compete more effectively within the markets that we serve.
Ohio SSO Program
In April 2010, we began delivering natural gas to an LDC in Ohio as part of a new Standard Service Offer program (the “SSO Program”). Under the SSO Program, for the twelve-month period from April 1, 2010 through March 31, 2011, we will receive a NYMEX-referenced price plus a price adjustment for natural gas delivered by the LDC to its customers who are eligible to participate in the SSO Program. We expect that our gross profit per MMBtu sold to the LDC will be lower under the SSO Program than the gross profit that we normally experience from our direct retail energy customers. From April 1 through June 30, 2010, we delivered approximately 1.6 million MMBtus of natural gas to the LDC under the SSO Program. As of June 30, 2010, based upon estimates received directly from the LDC, we expect that the customers assigned to us as a participant in the SSO Program will consume approximately 9.7 million MMBtus of natural gas annually, the majority of which will occur during the upcoming winter heating season.
Information Regarding Our Business Segments
Sales of natural gas and electricity are summarized in the following table. The sales amounts in the table are intended to provide an indication of operational growth within the segments, and are not necessarily indicative of similar growth in gross profit or net income. Refer to “Item 7. Management’s Discussion and Analysis of Financial Condition and Results of Operations” located elsewhere in this Annual Report for commentary regarding gross profit and other components of net income.
|
|
|
Fiscal Year Ended June 30, |
|
|||||||||||||
|
|
|
2010 |
|
2009 |
|
2008 |
|
|||||||||
|
|
|
Sales |
|
% of |
|
Sales |
|
% of |
|
Sales |
|
% of |
|
|||
|
|
|
($ in thousands) |
|
|||||||||||||
|
|
|
|
|
|
|
|
|
|
|
|
|
|
|
|||
|
Natural gas |
|
$ |
457,909 |
|
82 |
|
$ |
670,584 |
|
85 |
|
$ |
669,522 |
|
89 |
|
|
Electricity |
|
103,297 |
|
18 |
|
119,196 |
|
15 |
|
82,761 |
|
11 |
|
|||
|
Total sales |
|
$ |
561,206 |
|
100 |
|
$ |
789,780 |
|
100 |
|
$ |
752,283 |
|
100 |
|
Additional information regarding our business segments can be found in Note 23 of the audited consolidated financial statements, included in Item 8 of this Annual Report.
Our Products
We sell natural gas and electricity at variable or market-based prices that, in most cases, change monthly or at fixed prices for a forward term that generally does not exceed two years. In the case of variable sales contracts as well as most mid-market commercial sales, we purchase natural gas or electricity at the time of sale. In the case of fixed price retail customers, we purchase natural gas and electricity in advance of sales. Costs are marked up with a reasonable profit margin.
For fixed price sales contracts, the cost of the commodity is hedged in the forward markets with financial swaps and physical forward contracts that settle monthly. Physical natural gas and electricity is then purchased at the time such swap contracts settle. We regularly calculate the amount of the commodity required to meet our expected customer deliveries and balance this against the quantity hedged or purchased for such customers. Differences between expected customer deliveries and commodity purchases are managed by adjusting natural gas deliveries from storage and buying any shortfall or selling any excess in the market.
We market variations of two basic products:
· Fixed price contracts — Generally with terms of up to two years for natural gas and electricity, fixed rate products provide consumers with price protection against fluctuations in natural gas and electricity prices. In marketing this product, we do not promise savings as a consumer could pay more if prices offered by a local utility or other competitor, which are based on variable market conditions, fall during the term of the fixed rate contract.
We have a risk management policy that is intended to reduce our financial exposure related to changes in the price of natural gas and electricity. Under this policy, our objective is to hedge a minimum of 100% of the anticipated natural gas and electricity commodity purchases required to meet expected customer demand for all accounts served under fixed price contracts. Any difference between actual consumption and our purchased commodity volume results in pricing risk for the month.
· Variable price contracts — Variable price products generally are priced competitively with the price offered by the region’s incumbent utility and/or other local competitors (the “price to compare” or “PTC”). Our variable rate product is similar to utility variable rate pricing. By using alternative supply arrangements, we are sometimes able to supply customers with the commodity at a price lower than the utility’s tariff pricing due to the utility’s prior period cost recovery charges, fixed term transportation costs and/or hedging strategy. We do not guarantee to customers that our price will be below the PTC.
We generally do not hedge to protect against price volatility associated with deliveries under variable rate natural gas and electricity contracts because our variable price is set ahead of the month of commodity flow, which ensures a direct correlation between our cost for commodity delivered and the price charged to the customer. However, we do hedge natural gas inventory purchased during the summer to ensure that the value of storage inventory is correlated to the market price of natural gas when it is withdrawn during the winter months. Any difference between actual consumption and our purchased commodity volume results in pricing risk for the month.
The natural gas and electricity sold is metered and delivered to customers by LDCs. Except in our Georgia natural gas and Texas electricity markets and for certain of our commercial customers, LDCs generally provide billing and collection services on our behalf for residential and small commercial customers. In the case of our Georgia and Texas retail markets, we bill and collect directly from customers the price of delivered commodity plus the charges associated with the local utility’s distribution costs, the latter of which is remitted to such utility.
Our Customer Portfolio
Our customer base consists of residential and small and mid-market commercial customers. We have limited exposure to high concentrations of sales volumes to individual customers. From April 1 through June 30, 2010, we delivered approximately 1.6 million MMBtus of natural gas to the LDC under the SSO Program, which represented approximately 3.6% of our total natural gas sales volume for fiscal year 2010. For fiscal years 2009 and 2008, no single natural gas customer accounted for more than 3% of our total natural gas sales volume.
The following graph illustrates changes in our average RCE count for fiscal years 2006 through 2010.
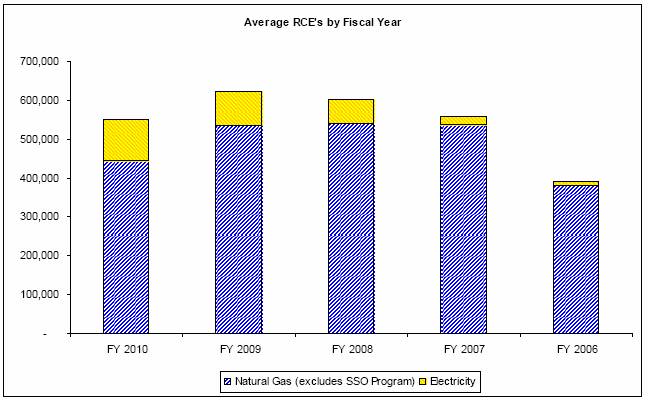
The reduction in average natural gas RCEs during fiscal year 2010 resulted primarily from liquidity-related limitations placed on our ability to obtain new customers and to retain existing customers and from high credit-related attrition in certain of our markets. Volatility in natural gas prices negatively impacted our liquidity position and resulted in amendments to our Revolving Credit Facility, which placed formal constraints on the term and type of contracts that we could offer to new customers and to existing customers who informed us of their intent to terminate their contract before its termination date. In order to conserve cash, we also reduced direct mail marketing and advertising expenditures and scaled back our use of certain sales channels during fiscal year 2009 and the first quarter of fiscal year 2010, which had a negative impact on brand awareness and our ability to acquire new customers.
Deteriorating economic conditions during fiscal year 2009 resulted in credit-related attrition that was higher than historical levels. Refer to “Retaining and Winning Back Customers” below for additional commentary regarding customer attrition.
During fiscal year 2010, we experienced a more stable price environment and lower customer defaults as compared with the prior fiscal year. In addition, under the provisions of the Commodity Supply Facility, the constraints on our marketing and hedging activities have been removed, and we are able to offer a wider variety of natural gas and electricity products to current and potential customers using our traditional marketing channels. As a result, during the second and third quarters of fiscal year 2010, we experienced in-contract attrition in most of our natural gas and electricity markets that was lower than that experienced during fiscal year 2009 and the first quarter of fiscal year 2010, and we experienced customer growth in certain of our electricity markets.
Acquiring New Customers
As of June 30, 2010, most of our current customers have been acquired organically through an integrated marketing approach that consists of multiple combinations of direct marketing activities, such as door-to-door marketing, success-based and hourly telemarketing and direct mailings, and indirect marketing activities, which include traditional and online media, public
relations and local event participation. We are focused on growing our customer base while controlling customer acquisition costs. Our objective has been to maintain customer acquisition costs below 12 months of gross profit resulting in a pay back period of less than one year. As a result of our return to normal marketing activities, our total expenditures for acquiring customers, which includes amounts capitalized as customer acquisition costs and certain other marketing and advertising expenses, increased approximately 50% during fiscal year 2010, as compared with the prior fiscal year. Our cost to acquire customers approximated $100 per RCE for fiscal year 2010, which was consistent with the amount spent per RCE in the prior fiscal year.
In order to conserve cash, we significantly reduced direct mail marketing, advertising and overall marketing expenditures during fiscal year 2009, as compared to the prior fiscal year. We also scaled back our use of certain sales channels, which had a negative impact on brand awareness and new customer acquisitions during fiscal year 2009. During fiscal year 2010, as a result of the Restructuring, we are offering a wider variety of natural gas and electricity products to current and potential customers using our traditional marketing channels.
In addition to organic growth, we have historically followed a disciplined acquisition strategy, acquiring only businesses that meet certain criteria, including the following:
· the acquired operations must be consistent with our business objectives to build a profitable retail business;
· the customers of the acquired company must have been acquired by such company in a manner consistent with our marketing principles and values and in accordance with applicable laws and regulations;
· the operations of the acquired company can be integrated with existing internal systems and processes;
· the acquired customers are located in markets that facilitate risk management through transparent pricing and liquid instruments; and
· the acquisition can be supported by our financing capabilities.
Some of the companies we acquired were located in markets not previously served by us and therefore, provided us with new strategic marketing opportunities. We intend to continue this strategy when evaluating new acquisition opportunities. We completed 10 separate acquisitions since our inception in 1999, including the following acquisitions since 2005:
|
Acquisition Date |
|
Company / Business Acquired |
|
Number and |
|
|
|
|
|
|
|
|
|
November 2005 |
|
Castle Power LLC |
|
53,000 natural gas |
|
|
August 2006 |
|
Shell Energy Services Company L.L.C. (“SESCo”) |
|
315,000 natural gas |
|
|
May 2007 |
|
Vantage Power Services L.P. |
|
12,000 electricity |
|
|
January 2008 |
|
GasKey division of PS Energy Group, Inc. |
|
60,000 natural gas |
|
|
October 2008 |
|
Catalyst Natural Gas LLC |
|
38,000 natural gas |
|
On August 1, 2006, we acquired substantially all of the assets of SESCo, a wholly owned subsidiary of Shell Oil Company. As of August 1, 2006, SESCo supplied natural gas to approximately 315,000 RCEs in the deregulated markets of Georgia and Ohio. In addition to expanding our relationships with customers in two of our existing LDC markets in Ohio, the SESCo acquisition added Georgia to the list of states in which we operate. Georgia has been our largest natural gas market since the acquisition of SESCo.
Customer Retention and Attrition
To retain existing customers, we rely on a team of highly trained internal and external customer care representatives. Customers requesting cancellation of service are provided information on the volatility of commodity rates and encouraged to retain the benefits of long-term rate protection, if appropriate. If we receive notification from an LDC that a customer has cancelled or switched to another supplier, attempts to communicate with those customers are made through both mail and phone, encouraging the customer to reconsider his or her decision, reminding the customer of early-termination fees he or she may incur and, in some cases, offering a new rate plan.
Customer renewal and in-contract attrition percentages are summarized in the following tables.
|
|
|
Activity for Fiscal Year Ended |
|
||||
|
|
|
2010 |
|
2009 |
|
2008 |
|
|
|
|
|
|
|
|
|
|
|
Customer renewal percentage (1) |
|
93 |
% |
84 |
% |
85 |
% |
|
In-contract attrition percentage (2) |
|
26 |
% |
34 |
% |
20 |
% |
(1) At the end of each customer contract term, customer contracts in most of our markets are renewed upon notification by the marketers unless the customer indicates otherwise. Customer renewal percentages in the table represent the percentage of customers who received such notification that ultimately continued their relationship with us.
(2) In-contract customer attrition percentage is defined as: (a) the percentage of loss of fixed rate customers after they have begun to receive natural gas or electricity from us but before their contract term officially expires; and (b) the percentage of loss of any variable rate customers, whose contracts generally do not have expiration dates.
Attrition data is calculated based upon actual customer level data. For analytical purposes, we assume that one RCE represents a natural gas customer with a standard consumption of 100 MMBtus per year, or an electricity customer with a standard consumption of 10 MWhr per year. However, each customer does not actually consume 100 MMBtu of natural gas or 10 MWhr of electricity. For example, one of our mid-market or large commercial customers may consume the equivalent of several hundred or even thousands of RCEs. Therefore, any reduction or increase in RCEs in any of our markets does not necessarily correlate directly with net customer attrition.
Fiscal year 2009 was an unusually challenging year for us with respect to customer retention and attrition. Our marketing activities and hedging capabilities were constrained under the Revolving Credit Facility and Hedge Facility, which severely limited our ability to offer desirable product options to existing or new customers. For instance, our ability to offer long-term fixed rate products to new and renewal customers was severely limited. This contributed to attrition generally, and particularly for various commercial customers, each of which represented a large number of RCEs per customer. Organic customer growth was also well below our historical levels due to these constraints.
Difficult economic conditions in many of our markets during fiscal year 2009 and the first three months of fiscal year 2010 resulted in credit-related attrition that was higher than historical levels. Credit-related attrition was particularly high in our Georgia natural gas market, partially due to expected credit quality issues within the portfolio of customers that we acquired from Catalyst Natural Gas LLC (“Catalyst”) in October 2008.
Volatile commodity prices during fiscal year 2009 caused many consumers of natural gas and electricity to migrate to market rates that were lower than their current rates. Since we were limited in our ability to offer new competitive rates to customers who indicated their intention to terminate their contract, many of our customers left us in favor of other retail marketers or their local utility.
During fiscal year 2010, we and our customers experienced a more stable price environment and lower customer defaults as compared with the prior year. In addition, under the provisions of the Commodity Supply Facility, the constraints on our marketing and hedging activities have been removed, and we are able to offer a wider variety of natural gas and electricity products to current and potential customers using our traditional marketing channels. As a result, during fiscal year 2010, we experienced lower in-contract attrition in most of our natural gas and electricity markets and customer growth in certain of our electricity markets.
Customer Contract Concentrations
We provide customers with a choice of natural gas and electricity products with alternative price structures that are designed to manage the risks of energy price volatility. The two basic alternative price structures are variable market-based pricing and fixed price forward contracts. Pricing and terms for these products are developed so that at any given time, potential customers can choose the product to meet their household or business needs. We attempt to be flexible and to respond quickly to market conditions to ensure that our products match consumer interests. Unlike competitors offering one product choice at a time, we simultaneously provide multiple product offerings. We also attempt to keep our product offerings simple in order to facilitate marketing to residential and small commercial customers.
As of June 30, 2010, 2009 and 2008, approximately 42%, 45% and 60%, respectively, of our natural gas customer portfolio had fixed rate contracts while the remaining 58%, 55% and 40%, respectively, had variable rate contracts. We have a risk management policy that is intended to reduce our financial exposure related to changes in the price of natural gas and electricity. Under this policy, our objective is to hedge a minimum of 100% of the anticipated natural gas commodity purchases required to meet expected customer demand for all accounts served under fixed price contracts. We also have a natural gas hedging facility that limits our exposure to mark-to-market margin payments. As of June 30, 2010, contracts with our fixed price natural gas customers have an average remaining life of approximately 5 months.
As of June 30, 2010, 2009 and 2008, approximately 70%, 36% and 36%, respectively, of our electricity customer portfolio had fixed rate contracts while the remaining 30%, 64% and 64%, respectively, had variable rate contracts. Although our objective is to economically hedge a minimum of 100% of anticipated electricity commodity purchases required to meet expected customer demand under fixed price contracts, there are certain ancillary and capacity costs that we are unable to hedge due to the term and the size of our electricity portfolio. In addition, since we cannot fully anticipate hourly spikes in demand for electricity during peak summer months, we may be unable to fully hedge commodity purchases necessary to meet such spikes in demand. Historically, our inability to economically hedge certain electricity commodity purchases and related costs has not had a material impact on our results of operations. As of June 30, 2010, contracts with our fixed price electricity customers have an average remaining life of approximately 6 months.
Geographic Market Concentrations
We believe that our diversified geographical coverage provides several benefits to us, including flexibility in product offerings and marketing campaigns, a broad demographic mix and diversified credit and regulatory exposure. Our multi-state approach allows us to:
· benefit from a diverse geographic stream of sales;
· lower the delivery risk associated with daily balancing gas markets;
· lower supply price risk and/or the risk of ancillary services events in a particular electricity market;
· achieve scalability from knowledge of multiple LDC programs and procedures;
· lower the risk of material impact from a regulatory change in a single jurisdiction;
· lower the risk of extreme regional weather patterns;
· lower the risk of material impact from regional economic downturns;
· improve inventory management opportunities across a diverse natural gas transportation and storage infrastructure; and
· capitalize on our regional supply and pricing knowledge.
RCEs by geographic area, excluding the SSO Program, are summarized in the following table.
|
|
|
RCEs at June 30, |
|
||||||||||
|
|
|
2010 |
|
2009 |
|
2008 |
|
||||||
|
|
|
No. |
|
% |
|
No. |
|
% |
|
No. |
|
% |
|
|
|
|
|
|
|
|
|
|
|
|
|
|
|
|
|
Southern U.S. (1): |
|
|
|
|
|
|
|
|
|
|
|
|
|
|
Natural gas |
|
150,000 |
|
|
|
197,000 |
|
|
|
241,000 |
|
|
|
|
Electricity |
|
27,000 |
|
|
|
25,000 |
|
|
|
25,000 |
|
|
|
|
|
|
177,000 |
|
29 |
% |
222,000 |
|
40 |
% |
266,000 |
|
38 |
% |
|
Northeastern U.S., Mid-Atlantic U.S. and Canada (2): |
|
|
|
|
|
|
|
|
|
|
|
|
|
|
Natural gas |
|
144,000 |
|
|
|
138,000 |
|
|
|
156,000 |
|
|
|
|
Electricity |
|
146,000 |
|
|
|
50,000 |
|
|
|
73,000 |
|
|
|
|
|
|
290,000 |
|
48 |
% |
188,000 |
|
33 |
% |
229,000 |
|
33 |
% |
|
Midwestern U.S. (3): |
|
|
|
|
|
|
|
|
|
|
|
|
|
|
Natural gas |
|
139,000 |
|
|
|
152,000 |
|
|
|
205,000 |
|
|
|
|
Electricity |
|
— |
|
|
|
— |
|
|
|
— |
|
|
|
|
|
|
139,000 |
|
23 |
% |
152,000 |
|
27 |
% |
205,000 |
|
29 |
% |
|
Total RCEs (4): |
|
|
|
|
|
|
|
|
|
|
|
|
|
|
Natural gas |
|
433,000 |
|
|
|
487,000 |
|
|
|
602,000 |
|
|
|
|
Electricity |
|
173,000 |
|
|
|
75,000 |
|
|
|
98,000 |
|
|
|
|
Total |
|
606,000 |
|
100 |
% |
562,000 |
|
100 |
% |
700,000 |
|
100 |
% |
(1) Includes markets in Georgia, Texas and Florida.
(2) Includes markets in New York, New Jersey, Connecticut, Massachusetts, Pennsylvania, Maryland, Ontario and British Columbia.
(3) Includes markets in Ohio, Michigan, Indiana, Illinois and Kentucky.
(4) Excludes RCEs to be served in connection with the SSO Program in Ohio, pursuant to a one-year contract that expires March 31, 2011.
Our business platform is partly based on providing long-term, fixed rate price protection in contrast to variable rates offered by LDCs against which we compete in the markets that we serve. For the majority of fiscal year 2009, our financial and liquidity restrictions limited new and renewed contract terms to 12 months or less. Therefore, we were unable to fulfill consumer demand for longer-term products, losing growth and renewal opportunity to LDCs and competitors in many of our markets.
Southern U.S. markets — Total RCEs in our southern markets decreased 20% and 17% during fiscal years 2010 and 2009, respectively, mainly due to a decrease in our customer base in the Georgia natural gas market. In addition to the impact of liquidity constraints in Georgia, customer account terminations were also unusually high due to bad debt experience attributed to economic conditions, and to more stringent credit standards initiated during the year for new and renewable customer accounts. Liquidity and contract term limitations also impacted growth and renewals in our Texas electricity market.
Northeastern U.S., Mid-Atlantic U.S. and Canadian markets — Total RCEs within this region increased 54% during fiscal year 2010, primarily due to strong customer growth in various electricity markets. During fiscal year 2010, we focused on growth in our existing guaranteed electricity markets in order to improve the seasonal cash flow associated with the electricity business segment and reduce risks associated with commodity and geographic concentrations. In addition, actual electricity RCEs at June 30, 2010 include approximately 56,000 RCEs added as a result of our expansion into a new electricity market in Pennsylvania.
In April 2010, we obtained our electricity retail supplier license in the State of Maryland and began actively marketing in July to electricity customers within a Maryland service territory. Additionally, recently approved regulations in Maryland will require natural gas and electricity utilities to either guarantee supplier receivables or improve the way customer payments are allocated to suppliers. Within one of the two natural gas markets in Maryland where we currently operate, the LDC began guaranteeing the receivables of retail suppliers on July 15, 2010. We anticipate the other LDC market in Maryland will begin guaranteeing receivables sometime during fiscal year 2011.
Recent legislation in Massachusetts will require electricity LDCs to guarantee the accounts receivable of retail suppliers, although the time frame for this implementation is currently unknown. New initiatives that will increase the attractiveness of certain other northeastern electricity and natural gas markets also began to take effect early in fiscal year 2011.
Midwestern U.S. markets — Total RCEs in our Midwestern region, excluding RCEs expected to be served in connection with the SSO Program, decreased 9% and 26% during fiscal years 2010 and 2009, respectively, due primarily to competitive pressure and budgetary constraints placed on our sales and marketing team. The contract term limitations placed on us prior to the Restructuring also significantly impacted growth opportunities in the Michigan market.
In April 2010, we began delivering natural gas to an LDC in Ohio as a participant in the SSO Program. Under the SSO Program, we receive a NYMEX-referenced wholesale price plus a retail price adjustment for natural gas delivered by the LDC to its customers who remain eligible to participate in the SSO Program. As of June 30, 2010, based upon estimates received directly from the LDC, we expect that the customers assigned to us as a participant in the SSO Program will consume approximately 9.7 million MMBtus of natural gas annually.
Potential market growth opportunities — For fiscal year 2011, we will continue to explore expansion into LDC markets that are open to competition and appear to provide attractive growth potential. The decision to enter into new LDC territories will continue to be governed by several factors, including:
· compatibility with our existing operating systems and supply base;
· attractiveness of LDC program rules, such as billing options and guarantees of customer accounts receivable;
· competitive landscape;
· mass market consumption profiles;
· regulatory climate;
· market location and size; and
· our ability to provide value to customers.
Guaranteed and Non-Guaranteed Market Concentrations
We are exposed to direct credit risk associated with customer accounts receivable in eleven of the markets that we serve, where such receivables are not guaranteed by LDCs. For fiscal years 2010, 2009 and 2008, 51%, 55% and 56%, respectively, of our total sales of natural gas and electricity were within markets where LDCs do not guarantee customer accounts receivable. We refer to these markets as “non-guaranteed” markets. We maintain an allowance for doubtful accounts, which represents our estimate of potential credit losses associated with accounts receivables from customers within non-guaranteed markets. We record a provision for doubtful accounts based on historical loss experience within our markets and periodically assess the adequacy of the allowance for doubtful accounts through review of the aging of customer accounts receivable and general economic conditions in the markets that we serve.
Within thirty of the markets that we serve, we operate under a purchase of receivables program whereby all billed receivables are purchased by the LDC. We refer to these markets as “guaranteed” markets. For fiscal years 2010, 2009 and 2008, 49%, 45% and 44%, respectively, of our total sales of natural gas and electricity were within markets where LDCs guarantee customer accounts receivable at a weighted average discount rate of approximately 1%. Such discount is the cost of service to guarantee the customer accounts receivable. Within these markets, we are exposed only to the credit risk of the LDC, rather than that of our customers. We monitor the credit ratings of LDCs and the parent companies of LDCs that guarantee customer accounts receivable. We also periodically review payment history and financial information for LDCs to ensure that we identify and respond to any deteriorating trends. As of June 30, 2010, all of our customer accounts receivable in LDC-guaranteed markets were from LDCs with investment grade credit ratings.
In addition, in certain markets, we have commercial customers that have asked us to bill them directly for consumption of natural gas and electricity. For these customers, we bear credit risk associated with non-payment by the customer.
Commodity Supply and Pricing Risk Management
Natural Gas Supply
We buy natural gas in the wholesale market in time and location specific bulk quantities at fixed and indexed prices. Effective September 22, 2009, under the Commodity Supply Facility, we began purchasing natural gas supply from RBS Sempra, as our exclusive natural gas supplier. The Commodity Supply Facility also requires that we release natural gas transportation and storage capacity to RBS Sempra and for RBS Sempra to perform certain transportation and storage nominations. During fiscal year 2010, we released transportation and storage capacity in several markets to RBS Sempra according to a mutually acceptable schedule and in a manner intended to ensure an effective transition of these functions. In connection with the Commodity Supply Facility, we are obligated to reimburse RBS Sempra for various direct costs associated with transportation and storage capacity released to RBS Sempra by the Company.
We periodically adjust our portfolio of supply purchase and sales contracts, storage and transportation capacity based upon continual analysis of our forecasted load requirements to determine whether it would be more economical to utilize natural gas from storage or to purchase from the spot market, with consideration given to transportation costs and availability. Natural gas is delivered to the LDC city-gate or other specified delivery points where the LDC takes control of the natural gas and delivers it to individual customers’ locations of use, utilizing its extensive network of small diameter distribution pipe.
LDCs provide ancillary services such as billing, meter reading and balancing services. Because of this extensive transportation infrastructure and the services provided, LDC costs typically make up a significant portion of the end user’s utility bill.
Electricity Supply
We buy electricity in the wholesale market in time and location specific block and hourly shaped quantities at fixed and indexed prices. Effective September 22, 2009, under the Commodity Supply Facility, we began purchasing electricity from RBS Sempra, as our exclusive electricity supplier. The Commodity Supply Facility also requires that RBS Sempra perform certain load bidding and scheduling services on our behalf with the respective Independent System Operator (ISO) or Regional Transmission Organization (RTO) to the Company’s customers in each LDC. In connection with the Commodity Supply Facility, we are obligated to reimburse RBS Sempra for various direct costs associated with scheduling and balancing the Company’s supply to the ISOs and RTOs. ISOs and RTOs provide services such as transmission and load balancing, which comprise a relatively small portion of the end user’s utility bill in comparison with energy and capacity costs.
Commodity Pricing Risk Management
We have a risk management policy that is intended to reduce our financial exposure to changes in the prices of natural gas and electricity. Our objective under this policy is to economically hedge all anticipated natural gas and electricity commodity purchases required to meet expected customer demand for all accounts served under fixed price contracts. We typically contract for sufficient commodity volume to meet expected customer consumption assuming normal weather patterns. We may purchase additional commodity volumes for the summer in the case of electricity and for the winter in the case of natural gas in order to protect against a potential demand increase in peak seasons. As a result of the natural swing in customer consumption related to weather changes, we may have to buy or sell additional natural gas or electricity volume, which exposes us to additional price volatility. We utilize various hedging strategies in order to mitigate the risk associated with potential volumetric variability of our monthly deliveries for fixed priced customers.
We utilize the following instruments to offset price risk associated with volume commitments under fixed and variable price contracts where the price to the customer must be established ahead of the index settlement: (1) for natural gas: NYMEX-referenced gas swaps, basis swaps, physical commodity hedges, physical basis hedges and index options; and (2) for electricity: ISO zone specific swaps, basis swaps, physical commodity hedges, physical basis hedges and index options. We also utilize carbon dioxide offset credits and various renewable energy credits in order to meet regulatory requirements related to operating in electricity markets and our commitments from “green” product offers.
Refer to Item 7A of this Annual Report for additional commentary regarding commodity price risk management.
Seasonality of Operations
The majority of natural gas customer consumption occurs during the months of November through March. By contrast, electricity customer consumption peaks during the months of June through September. Because the natural gas business segment comprises such a large component of the Company’s overall business operations, operating results for the second and third fiscal quarters represent the vast majority of operating results for the Company’s full fiscal year.
Cash collected from natural gas customers peaks in the late winter and early spring of each calendar year, while cash collected from electricity customers peaks in the late summer and early fall. The Company utilizes a considerable amount of cash from operations to meet working capital requirements during the months of November through March of each fiscal year. In addition, the Company utilizes considerable cash to purchase natural gas inventories during the months of April through October.
Budget billing programs can reduce the seasonality of cash receipts, but they can also cause timing differences between the billing and collection of accounts receivable and the recording of revenues. The payment terms of LDCs also can cause timing differences between the billing and collection of accounts receivable and the recording of revenues.
Weather conditions have a significant impact on customer demand and market prices for natural gas and electricity. Customer demand exposes the Company to a high degree of seasonality in sales, cost of sales, billing and collection of customer accounts receivable, inventory requirements and cash flows.
The impact of rapidly rising or falling commodity prices also varies greatly depending on the period of time in which they occur during our fiscal year. Although commodity price movements can have material short-term impacts on monthly and
quarterly operating results, our economic hedging and contract pricing strategies may reduce the impact of such trends on operating results for a full fiscal year.
Industry Overview
Market Deregulation
In markets that are open to competitive choice of retail energy suppliers, our primary competition comes from utility-affiliated retail marketers, small to mid-size independent retail energy companies and default service with the incumbent utility. Competition is based primarily on product offerings, price and customer service.
Increasing our market share depends in part on our ability to convince customers to switch to our service. The local utilities and their affiliates have the advantage of long-standing relationships with their customers, and they may have longer operating histories, greater financial and other resources, and greater name recognition in their markets than we do. In addition, local utilities have been subject to many years of regulatory oversight and thus have significant experience regarding the regulators’ policy preferences, as well as a critical economic interest in the outcome of proceedings concerning their revenues and terms and conditions of service. The incumbents’ advantages in many markets are intended to be limited, however, by regulatory structures that, for example, prohibit incumbents from offering non-standard service and pricing structures, minimize the opportunity for the regulated business to subsidize the unregulated business and limit the ability of the utilities to solicit customers that have switched. In Georgia and Texas, however, the market is fully deregulated where the incumbent utilities no longer use a regulated benchmark price.
In many cases, LDCs actively support deregulation and have welcomed the entry of retail energy marketers. Regulated LDCs generally do not profit from commodity supplied to their customers; rather, their rate of return is based on their infrastructure assets or “rate base.” Accordingly, regulated LDCs charge consumers for commodity on a pass-through basis, and do not hedge their forward energy costs. By relieving LDCs of the need to engage in risk management, regulations permitting retail competition allows LDCs to focus on their core competency of local distribution, which typically constitutes a significant portion of most customers’ utility bills. Many LDCs assume customer bad debt exposure since this encourages more market entrants and supports continued deregulation. LDCs may recover the bad debt expense as part of their tariff rates. The interests of retail energy marketers and most LDCs are thus highly aligned, providing crucial support for continued deregulation, while increasing penetration of the retail energy marketer model. We have successfully forged strong relationships with many of the LDCs throughout our service territories.
Some of our competitors, including local utilities, have formed alliances and joint ventures in order to compete in the restructured retail electricity and natural gas industries. Many customers of these local utilities may decide to stay with their longtime energy provider if they have been satisfied with their service in the past. Therefore, it may be difficult for us to compete against local utilities and their affiliates.
Our retail energy sales depend upon our ability to identify and enter profitable, deregulated, retail energy markets, manage the cost of customer acquisitions, retain customers and attract new customers in our existing markets, and integrate acquired businesses successfully. The principal components of our strategy to compete in existing and new markets include:
· offering competitively priced products;
· maintaining prudent and proven hedging and risk management policies;
· building and maintaining an excellent commodity supply team;
· pursuing organic growth and opportunistic acquisitions;
· maintaining a low cost operating structure;
· upholding high customer service standards; and
· leveraging our investment in information systems.
Deregulated Natural Gas Industry
The Natural Gas Policy Act of 1978 took the first steps toward deregulating the natural gas market by instituting a scheme for the gradual removal of price ceilings at the wellhead. In 1985, the Federal Energy Regulatory Commission (“FERC”) issued Order 436, which changed how interstate pipelines were regulated. Essentially, this order allowed pipelines, on a voluntary basis, to offer transportation services to customers who requested them on a first-come, first-serve basis. The movement towards allowing pipeline customers a choice in the purchase of their natural gas and transportation arrangements became known as “open access,” and spurred the emergence of natural gas marketers.
While large commercial and industrial consumers have had the option of purchasing the natural gas commodity separately from natural gas suppliers for many years, state regulators and law makers have moved more slowly in implementing choice programs for residential and small-volume commercial customers.
According to the United States Energy Information Agency (“EIA”), as of December 2009, twenty-one states and the District of Columbia have legislation or programs in place that let residential consumers and other small-volume users purchase natural gas from someone other than their traditional utility company. As of December 2009, of the approximately 65.3 million residential natural gas customers in the U.S., nearly 35.0 million have access to choice programs, with approximately 5.1 million (or 14.7% of eligible customers) actually purchasing from residential marketers. State regulators continue to refine and evaluate existing programs in order to promote a competitive marketplace. The low penetration rate, coupled with the desire for a competitive marketplace, has created attractive growth opportunities for residential marketers such as us.
As of December 31, 2009, there were approximately 150 marketers licensed to serve residential natural gas customers, of which 110 were actively serving or enrolling customers. Marketers competing for the commercial and residential markets fall into three categories: utility affiliates, national marketers and niche marketers. The commitment of many of these marketers is often modest, confined to a limited geographic region, and supported by limited capital, personnel and operational infrastructure.
We focus on natural gas markets that are less susceptible to competitive pressures on profit margins and that lend themselves to mass-market techniques. The number of active competitive retail natural gas marketers ranges from 2 to 15 in most of the states that we serve, with as many as 60 in New York. In addition to all local utilities, we consider the main retail competitors within our natural gas markets to be Georgia Natural Gas, Direct Energy (an affiliate of UK based Centrica), Gas South, Vectren Source, IDT Energy, Dominion Retail Energy (a deregulated affiliate of Dominion Resources, Inc.), Just Energy and Interstate Gas Services.
Deregulated Electricity Industry
In 1978, Congress passed the Public Utility Regulatory Policies Act, which laid the groundwork for deregulation and competition by opening wholesale power markets to non-utility producers of electricity. In 1996, FERC Orders 888 and 889 required open and equal access to jurisdictional utilities’ transmission lines for all electricity producers, thus facilitating the states’ restructuring of the electric power industry by allowing customers direct access to retail power generation.
As a result of federal and state initiatives, the electric power industry in several states has changed from a structure characterized by highly regulated, vertically integrated local monopolies, which provide their customers with a comprehensive package of electricity services, to a deregulated structure. The deregulated structure includes independent power producers and unregulated owners of electricity generation, competitive providers like us who supply electricity to end-use customers, and utilities that continue to provide transmission or distribution services as common carriers.
According to the EIA, as of May 2010, 15 states and the District of Columbia operate retail markets in which customers may choose alternative electricity suppliers. For electricity, our primary retail competitors are ConEd Solutions, Direct Energy, StarTex Power, TXU Energy, Reliant Energy, Champion Energy Services and Dominion Retail Energy.
Foreign Operations
Our foreign operations are located in Canada. Foreign operations comprised less than 1% of our consolidated total assets at June 30, 2010 and 2009 and less than 1% of our consolidated sales of natural gas and electricity for the fiscal years ended June 30, 2010 and 2009. Management believes that the financial and operational risks associated with our Canadian operations are immaterial.
Management Team and Employees
The members of our executive management team have extensive experience in energy risk management and retail marketing as well as in creating, developing and managing businesses and risk on behalf of major international corporations. The professional backgrounds of our executive management team are described in Item 10 of this Annual Report.
As of June 30, 2010, we had approximately 203 full-time equivalent employees in the United States and Canada. None of our employees are subject to a collective bargaining agreement, and we believe that our relationship with our employees is good.
Environmental Matters
We do not have physical custody or control of the natural gas provided to our customers, or any facilities used to produce or transport natural gas or electricity. Although we hold title to natural gas in interstate pipelines and storage tanks, we believe that the carriers have the liability risk associated with infrastructure failures that could cause environmental issues. Therefore, we do not believe that we have significant exposure to legal claims or other liabilities associated with
environmental concerns.
Where You Can Find More Information
Our filings with the SEC are available to the public over the Internet at the SEC’s website at www.sec.gov. You may also read and copy any document we file at the SEC’s public reference room located at 100 F Street, N.E., Washington, D.C. 20549. Our filings with the SEC are also available under the SEC Filings section of our website, www.mxholdings.com, as soon as reasonably practicable after we electronically file such reports with the SEC. The information contained on this Internet site is not incorporated by reference in this Annual Report. You may also request a copy of these filings, at no cost, by writing to us at our corporate headquarters: MXenergy Holdings Inc., 595 Summer Street, Suite 300, Stamford, Connecticut 06901, Attention: Chief Financial Officer, or by calling us at (203) 356-1318.
The website at www.mxholdings.com contains information concerning Holdings and its subsidiaries. This website is separate from our consumer website, www.mxenergy.com. The information contained on our website and those of our subsidiaries is not incorporated by reference in this Annual Report.
Any of the following risks could have an adverse effect on our business, financial condition or results of operations. Additional risks or uncertainties not currently known to us may also arise in the future that could have an adverse effect on our business, financial condition or results of operations.
Risks Related to Our Business
Our risk management policies and hedging procedures may not mitigate risk as planned, and we may fail to fully or effectively hedge our commodity supply and price risk exposure against changes in consumption volumes or market rates.
To provide energy to our customers, we purchase the relevant commodity in the wholesale energy markets, which are often highly volatile. It is our policy to match estimated consumption by our customers by purchasing offsetting volumes of natural gas and electricity. To reduce our financial exposure related to commodity price fluctuations and changes in consumption volumes, we routinely enter into contracts to hedge our fixed price sale commitments, delivery requirements and inventory of natural gas, as well as fixed price sale commitments and line loss of electricity.
We have contractual obligations to many of our customers to provide full requirements service and as a result, our hedging procedures require constant monitoring and adjustment. Failure to continue to use valid assumptions may lead to inappropriate hedging positions. In addition, there are a number of factors that are beyond our control, such as risk of loss from counterparties’ nonperformance, volumetric risks related to customer demand and seasonal fluctuations. Although we purchase anticipatory hedges that represent volume we expect to sell to residential and small commercial customers for up to one month of projected marketing, we are exposed to the risk of a shortfall in marketing that could result in our purchases exceeding our supply commitments to those customers. We cannot fully protect ourselves against these factors and if our risk management policies are inadequate, this may have a detrimental effect on our business.
Actual customer attrition may exceed or be below expected attrition, which could result in a cost to cover previously purchased fixed price hedges and physical commodity supply or in incremental cost to source additional commodity supply.
Although our fixed price contracts with residential customers generally have terms of up to two years, those customers may terminate their contracts at any time for a termination fee that, in most cases, is relatively modest and does not bear any relation to our costs or lost profit with respect to the remainder of the contract. Most of our small and mid-market commercial customers cannot terminate their fixed price contracts without triggering a damages provision designed to cover costs related to the termination of those contracts. For larger commercial customers, we utilize various means to ensure that we recover our costs, including legal remedies if appropriate. We depend on our hedging strategies to cover the costs related to terminations by residential and small commercial customers. To hedge effectively against terminations, we must, at the inception of the contracts, attempt to accurately forecast the number of residential and small commercial customers that will terminate their contracts prior to the end of their term. If we experience a number of cancellations greater than originally forecasted or if we are not able to replace terminating customers with new customers, our financial results may be negatively impacted. Conversely, if forecasted attrition is higher than actual realized attrition, we are at risk for having to source additional hedges or supply at potentially higher market prices where no price increase can be passed on to customers through the duration of their contract terms.
Most of our financial swap agreements are settled against published index prices that could cease to be reliable or could become unavailable.
We hedge our forward natural gas exposures through a combination of physical supply purchases and financial swap agreements. Financial swap agreements may be settled against monthly New York Mercantile Exchange (“NYMEX”) settlement prices or against index prices published by various industry publications. NYMEX settlement prices could be affected by supply and demand factors at the Henry Hub delivery point of the contract that are not present elsewhere in the country. Accordingly, the NYMEX settlement prices may cease to accurately reflect the market price of natural gas. Likewise, index prices for market areas in which our customers are located, and which are contained in daily and monthly industry publications, are published based on private polling of industry participants and therefore may be distorted, deliberately or unintentionally, thereby ceasing to be an accurate gauge of market pricing in those areas.
In the event either NYMEX settlement prices or published index prices were to become unavailable or cease to be reliable, we and our counterparties could seek to find a replacement price that would more accurately or reliably reflect the market prices that we are hedging. However, there is no certainty that such efforts would be successful.
The accounting method utilized for our hedging activities results in volatility in our quarterly and annual financial results.
We engage in risk management activities related to our natural gas and electricity purchases in order to economically hedge our exposure to commodity price risk. Through the use of financial derivative and physical contracts, we attempt to balance our physical and financial purchases and sales commitments. We have not designated these derivative instruments as hedges for accounting purposes. Therefore, changes in the fair value of these instruments are recognized immediately in earnings. As a result of this accounting treatment, changes in the forward prices of natural gas and electricity cause volatility in our quarterly and annual earnings, which we are unable to fully estimate or predict.
We may not have sufficient liquidity or credit capacity to hedge market risks, to continue to grow our business, or to operate effectively.
Certain of our LDC, transportation and storage agreements require us to maintain restricted cash balances or letters of credit as collateral for the performance risk associated with the future delivery of natural gas. These collateral requirements may increase as our customer base grows or as a result of movements in the market prices of commodity. The effectiveness of our operations and future growth depends in part on the amount of cash and letters of credit available to enter into or maintain these contracts. Such liquidity requirements may be greater than we anticipate or are able to meet.
Despite our efforts to hedge risk and accurately forecast demand, our financial results are susceptible to changing weather conditions and commodity price fluctuations and therefore will fluctuate on a seasonal and quarterly basis.
Our overall operating results fluctuate substantially on a seasonal basis, and the pattern of this fluctuation may change depending on: (1) the geographic mix of our customer base; (2) the terms of any contract to which we become a party; (3) weather conditions, which directly influence the demand for electricity and natural gas and affect the prices of energy commodities; and (4) variability in market prices for natural gas and electricity.
Generally, demand for electricity peaks in the summer with a secondary peak during the winter. Demand for natural gas peaks in the winter. Recent growth in natural gas-fired electric generation has introduced a secondary peak for natural gas in the summer. Typically, when winters are warmer than expected and summers are cooler than expected, demand for energy is lower, resulting in less natural gas and electricity consumption than forecasted. Likewise, when winters are colder or summers are warmer than expected, consumption may be greater than we have hedged and, in the case of natural gas, may be greater than we are able to meet with storage or swing supply. Depending on prevailing market prices for electricity and gas, these and other unexpected conditions may reduce our sales or increase our costs and negatively impact our results of operations. We may experience lower consumption volumes, and therefore, lower sales. We may experience losses from the purchase of additional volumes at higher prices or the sale of excess volumes at prices below our acquisition cost. Our failure to anticipate changing weather-related demands or to effectively manage our supply in response to changing demands could negatively impact our financial results.
The impact of rapidly rising or falling commodity prices also varies greatly depending on the period of time that they occur within our fiscal year. Although operating results for a full fiscal year may not be impacted materially by such trends due to our commodity hedging and contract pricing strategies, they can have material short-term impacts on monthly and quarterly operating results.
Large fluctuations in the market price of natural gas and electricity within short periods of time also may have a negative impact on the availability of credit necessary to operate our business.
We are subject to direct credit risk for certain customers who may fail to pay their bills as they become due.
We bear direct credit risk related to our customers located in markets where accounts receivable are not guaranteed by LDCs. This group of customers represented approximately 51% of our sales of natural gas and electricity during the fiscal year ended June 30, 2010. With the exception of customers in Georgia and Texas, we have the ability to terminate our agreement with customers in the event of non-payment, but we cannot terminate their electricity or natural gas service. Even if we terminate service to customers who fail to pay their utility bill, we remain liable to our suppliers of electricity and natural gas for the cost of those commodities. Furthermore, in the Georgia and Texas markets, we are responsible for billing the distribution charges for the local utility and are at risk for these charges, in addition to the cost of the commodity, in the event customers fail to pay their bills. Changing economic factors, such as rising unemployment rates and energy prices also result in a higher risk of customers being unable to pay their bills when due.
The failure of our customers to pay their bills or our failure to maintain adequate billing and collection procedures could adversely affect our results of operations or financial condition.
We are subject to credit, operational and financial risks related to certain LDCs that provide billing services and guarantee the customer receivables for their markets.
In certain markets, we rely on the LDC to guarantee customer accounts receivable and to perform timely and accurate billing. Sales within these guaranteed markets represented approximately 49% of our total sales of natural gas and electricity during the fiscal year ended June 30, 2010. As our business grows, the proportion of customers we serve that are billed by utilities could increase. The bankruptcy of an LDC could result in a default in such LDC’s payment obligations to us.
In addition, LDCs that provide billing services and guarantee customer accounts receivable rely on us for accurate and timely communication of contract rates and other information necessary for accurate billing to customers. The number of territories within which we provide natural gas and electricity supply demands considerable management, personnel and information system resources. Each territory requires unique and often varied electronic data interface systems. Rules that govern the exchange of data may be changed by the LDCs. In certain instances, we must rely on manual processes and procedures to communicate data to LDCs for inclusion in customer bills. Failure to provide accurate data to LDCs on a timely basis could adversely impact our results of operations.
Settlements of imbalance receivables from certain LDCs and independent system operators may be subject to such LDCs’ or independent system operators’ ability to settle their imbalance receivables from other retail marketers.
Retail energy marketers are responsible for providing adequate natural gas to LDCs and electricity to independent system operators (“ISOs”) for ultimate delivery to customers. Commodity amounts provided are generally based on estimates of customer usage over a prescribed period. Imbalances occur when commodity amounts delivered by us to an LDC (for natural gas) or an ISO (for electricity) exceed amounts consumed by our customers (resulting in a receivable from the LDC or ISO) or when commodity amounts consumed by our customers exceed amounts delivered by us to the LDC or ISO (resulting in a payable to the LDC or ISO). Certain LDCs and ISOs rely on collection of imbalances payable to them in order to settle imbalances payable by them to retail marketers. If retail marketers default on their obligations to settle an imbalance owing to an LDC or an ISO, such LDC or ISO may not have adequate resources to satisfy its obligation to settle imbalances owing to marketers. Therefore, the inability of an LDC or an ISO to collect imbalance amounts from other retail energy marketers may hinder our ability to collect imbalance amounts owed to us by such an LDC or ISO.
We depend on the accuracy of data in our billing systems. Inaccurate data could have a negative impact on our results of operations, financial condition, cash flows and reputation with customers and/or regulators.
We depend on the accuracy and timeliness of customer billing, collections and consumption information in our information systems. We rely on many internal and external sources for this information, including:
· our internal marketing, pricing, information systems and customer operations functions;
· LDCs and ISOs with which we have billing service agreements; and
· various LDCs and ISOs for volume or meter read information, certain billing rates and billing types (e.g., budget billing) and other fees and expenses.
Inaccurate or untimely information, which may be outside of our direct control, could result in:
· inaccurate and/or untimely bills sent to customers;
· inaccurate accounting and reporting of customer revenues, gross profit and accounts receivable activity;
· customer complaints; and
· increased regulatory scrutiny.
The Commodity Supply Facility is an exclusive arrangement to purchase natural gas and electricity from a single supplier. The lack of competitive suppliers could result in higher commodity supply prices for us.
Prior to the Restructuring, we purchased natural gas and electricity from a portfolio of producers, marketers and energy trading firms in either a producing region or at delivery points. The ability to source supply from multiple suppliers ensured a competitive pricing environment in which we could seek the lowest possible price for our business.
Effective September 22, 2009, we are required to purchase natural gas and electricity from RBS Sempra under an exclusive supply arrangement. Under the terms of the Commodity Supply Facility, we have the ability to: (1) seek commodity price quotes from third parties for certain physically or financially settled transactions with respect to gas and electricity; and (2) request that RBS Sempra enter into such transactions with such third parties at such prices and to concurrently enter into back-to-back off-setting transactions with us with respect to such third party transactions. RBS Sempra would not be obligated to enter into a transaction with any third party unless it is satisfied with the proposed transaction and counterparty
and the volume of those transactions does not exceed annual limits. In addition to the actual purchase price paid by RBS Sempra and certain related costs and expenses, we will be charged a fee for such purchases.
There is no guarantee that RBS Sempra would approve purchases of natural gas and electricity from third-parties when the prices offered by those third parties are beneficial to us. Additionally, if RBS Sempra approves these transactions, RBS Sempra will charge us a fee and other transaction-related costs, which would decrease the benefit to us. As a result, our ability to obtain the lowest possible pricing for commodity transactions may be reduced, which may result in higher commodity costs and lower gross profit per unit of natural gas or electricity sold to our customers.
In connection with the Commodity Supply Facility, RBS Sempra currently manages the scheduling of natural gas and electricity deliveries to LDCs and natural gas transportation logistics and storage capacity that we formerly managed internally. As a result, we have less direct control over scheduling of natural gas and electricity to LDCs, which could result in lower reliability for deliveries to customers.
Prior to the Restructuring, we managed natural gas and electricity supply and natural gas storage capacity and transportation logistics internally. We have well-trained management and staff who have developed strong expertise and effective working relationships related to these functions. RBS Sempra now manages these functions in connection with the Commodity Supply Facility, with the operating support of our management and staff. If RBS Sempra fails to effectively manage these functions, or fails to appropriately utilize our expertise, deliveries of natural gas and electricity to LDCs, and ultimately to our customers, could become less reliable, which could have a negative impact on our reputation and results of operations.
RBS Sempra’s majority owner announced that it intends to sell its stake in RBS Sempra, which could impact RBS Sempra’s ability to function as our primary commodity hedge and credit provider.
Royal Bank of Scotland Group announced that it intends to divest its majority interest in RBS Sempra. We are uncertain whether such a divestiture will occur, whether it will occur in an orderly fashion, whether RBS Sempra’s ability to maintain its operations will be impacted, or whether its ability to provide us with commodity and economic hedges pursuant to the Commodity Supply Facility will be affected. If RBS Sempra is unable to meet its supply, credit and hedging obligations under the Commodity Supply Facility, our liquidity position and operations may be adversely affected.
We depend on local transportation and transmission facilities of third parties to supply our customers. Our financial results may be harmed if transportation and transmission availability is limited or unreliable.
We depend on transportation and transmission facilities owned and operated by utilities and other energy companies to deliver the electricity and natural gas we sell to customers. Under the regulatory structures adopted in most jurisdictions, we are required to enter into agreements with local incumbent utilities for use of the local distribution systems and to establish functional data interfaces necessary to serve our customers. Any delay in the negotiation of such agreements or inability to enter into reasonable agreements could delay or negatively impact our ability to serve customers in those jurisdictions, which could have an adverse impact on our business, results of operations, and financial condition.
We also depend on local utilities for maintenance of the infrastructure through which we deliver electricity and natural gas to our customers. We are unable to control the level of service the utilities provide to our customers. Any infrastructure failure that interrupts or impairs delivery of electricity or natural gas to our customers could cause customer dissatisfaction, which could adversely affect our business. If transportation or transmission is disrupted, or if transportation or transmission capacity is inadequate, our ability to sell and deliver products may be hindered. Such disruptions could also hinder our providing electricity or natural gas to our customers and adversely impact our risk management policies, hedge contracts and financial results and condition.
Regulations in many markets require that meter reading and the billing and collection processes be retained by the local utility. In those states, we also are required to rely on the local utility to provide us with our customers’ information regarding energy usage. Our inability to confirm information received from the utilities could negatively impact our reputation with customers and, therefore, our sales and results of operations.
We are subject to competition in each of the markets that we serve.
While there are barriers to entry, we operate only in markets that are open to alternate energy suppliers. Competition is based primarily on product offering, price and customer service. We generally face competition in those markets from utility-affiliated retail marketers and small to mid-size independent retail energy companies. Some of these competitors or potential competitors may be larger and better capitalized than we are.
Increasing our market share depends in part on our ability to convince customers to switch to our service. The local utilities have the advantage of long-standing relationships with their customers, longer operating histories, greater financial strength
and greater name recognition than we do. In addition, customers may be less familiar with the fixed price product that we offer, and we may not be successful in educating potential customers about the benefits of fixed price energy supply nor of the other products we offer. Convincing customers to switch to a new company for the supply of a critical commodity such as electricity or natural gas is a challenge. If our marketing strategy is not successful, our business, results of operations and financial condition will be adversely affected.
In addition, our marketing efforts may be hindered in a market where our offers are less competitive relative to price offerings of the utilities or other marketers. Utilities historically react more slowly to changing commodity prices, whereas our products generally reflect the prevailing market prices. These factors may result in less effective marketing or higher than anticipated attrition.
We depend on continued state and federal regulation to permit us to operate in deregulated segments of the natural gas and electricity industries. If competitive restructuring of the natural gas and electricity utility industries are altered, reversed, discontinued or delayed, our business prospects and financial results could be materially adversely affected.
The regulatory environment applicable to the electricity and natural gas LDC distribution systems has undergone substantial change over the past several years as a result of restructuring initiatives at both the state and federal levels. We have targeted the deregulated segments of the electricity and natural gas markets created by these initiatives. Regulations may be revised or reinterpreted or new laws and regulations may be adopted or become applicable to our operations or us. Such changes may have a detrimental impact on our business, including our ability to use our established marketing channels.
In certain deregulated electricity markets, proposals have been made by governmental agencies and/or other interested parties to re-regulate areas of these markets. Other proposals to re-regulate may be made and legislated or other attention to the electric and gas restructuring process may: (i) delay or reverse the deregulation process; (ii) interfere with our ability to do business; (iii) inhibit our growth; (iv) increase our commodity, operating or financing costs; or (v) otherwise impact our profitability. If competitive restructuring of electricity and natural gas markets is altered, reversed, discontinued or delayed, our business prospects and financial results could be negatively impacted.
As a result of recent economic events affecting the U.S. and world economies, the federal government recently enacted new legislation pursuant to which various federal agencies will implement new regulations for the financial services industry that could have an impact on the availability and cost of credit and hedging instruments.
The federal government recently enacted the Dodd-Frank Wall Street Reform and Consumer Protection Act pursuant to which various federal agencies will implement new regulations that will have significant impacts on the operations of financial institutions. The impact of such regulations may affect the ability of financial institutions to offer credit and hedging instruments without significant additional capital or other costs to them. Such increases in capital and other costs to financial institutions may result in higher costs to us in connection with our Commodity Supply Facility, which could increase our commodity, operating or financing costs or otherwise impact our profitability.
We may not be able to manage our growth successfully, which could strain our liquidity and other resources and lead to poor customer satisfaction with our services.
We intend to continue to assess new product offerings, apply new technologies for our business development and make investments in acquisitions of complementary companies. If we buy a company or business, we may experience difficulty integrating that company’s personnel and operations, or key personnel of the acquired company may decide not to work for us. Furthermore, if we acquire the residential or small commercial businesses of an incumbent utility or other energy provider in a particular market, the customers of that entity may not be under any obligation to use our services. If we make other types of acquisitions, we may experience difficulty in assimilating the acquired technology or products into our operations or information systems. These difficulties could disrupt our ongoing business, distract our management and employees and increase our expenses.
Among other things, the growth of our operations will depend upon our ability to expand our customer base in our existing markets and to enter new markets in a timely manner at reasonable costs. We anticipate that our employee base will grow to accommodate our increased customer base. As we expand our operations, we may encounter difficulties integrating new customers and employees as well as any legacy systems of acquired entities. We also may experience difficulty managing the growth of a portfolio of customers that is diverse with respect to the types of service offerings, applicable market rules and the infrastructure for product delivery.
Expanding our operations could result in increased liquidity needs to support working capital, for the purchase of natural gas and electricity supply to meet our customers’ needs, for the credit requirements of forward physical supply and for generally higher operating expenses. The Commodity Supply Facility may not be adequate to meet these higher liquidity requirements.
Expanding our operations also may require continued development of our operating and financial controls and may place additional stress on our management and operational resources. If we are unable to manage our growth and development successfully, our operating results, financial condition and internal controls over financial reporting could be adversely affected.
Our success depends on key members of our management, the loss of whom could disrupt our business operations.
We depend on the continued employment and performance of key management personnel. A number of our senior executives have substantial experience in consumer and energy markets that have undergone regulatory restructuring and have extensive risk management and hedging expertise. We believe their experience is important to our continued success. If our key executives do not continue in their present roles and are not adequately replaced, our business operations could be adversely affected. In addition, failure to retain or adequately replace our chief executive officer or chief financial officer could give rise to a default under the Commodity Supply Facility.
We rely on a capable, well-trained workforce to operate effectively. Retention of employees with strong industry or operational knowledge is essential to our ongoing success.
Many of the employee positions within our customer operations, information systems, pricing, marketing, risk management and finance functions require extensive industry, operational or financial experience that may not be easily replaced if an employee were to leave employment with us. While some normal employee turnover is expected, and additional turnover may occur due to reduced job responsibilities in certain roles as a result of the Restructuring, unusually high turnover could strain our ability to manage our ongoing operations as well as inhibit organic and acquisition growth.
We are susceptible to downturns in general economic conditions, which could have a material adverse affect on our business, results of operations and financial condition.
The natural gas and electricity industries have historically been affected by general economic downturns, including conditions within the housing market. Periods of slowed economic activity generally result in decreased natural gas and electricity consumption, and could result in increased customer attrition. As a consequence, national or regional recessions or downturns in economic activity that impact our industrial, commercial and residential customers could adversely affect our revenues, our collections of billed accounts receivable and our cash flows, and could restrict our future growth in certain markets, any of which could have an adverse effect on our business, results of operations and financial condition.
General economic conditions can also impact the performance of various counterparties to various arrangements, including:
· failure of a supplier to deliver commodity at a specified time for a specified price under existing supply agreements, which could result in penalty assessments against us and/or could result in higher commodity prices from purchasing replacement commodities on the spot market;
· failure of local transportation and transmission facilities to allow their facilities to be utilized in accordance with related agreements, which could result in significant delays in delivery or higher costs associated with alternate facilities;
· failure of other contracted entities to deliver goods or services when due or requested; and
· failure of performance by a counterparty to our hedge positions or lending agreements.
Such failures to perform by our business counterparties could have an adverse effect on our business, results of operations and financial condition.
The successes, failures or activities of various LDCs and other retail marketers within the markets that we serve may impact the perception of the Company.
The general perception on the part of customers and regulators of utilities and retail energy marketers in general, and the Company in particular, is essential for our continued growth and success. Questionable pricing, billing, collections or customer service practices on the part of any utility or retail marketer can damage the reputation of all market participants, which could result in lower customer renewals and impact our ability to sign-on new customers. Any utility or retail marketer that defaults on its obligations to its customers, suppliers, lenders, hedge counterparties, or employees can have a similar impact on the retail energy industry as a whole and on our operations in particular.
We are subject to regulatory scrutiny in all of our markets. Failure to follow prescribed regulatory guidelines could result in customer complaints and regulatory sanctions.
We generally must apply to become a retail marketer of natural gas and electricity in the markets that we serve. Approval by the local regulatory body is subject to our understanding of and compliance with various federal, state and local regulations that govern the activities of retail marketers. If we fail to comply with all such regulations, we could suffer certain consequences, which may include:
· higher customer complaints and attrition;
· increased regulatory scrutiny and sanctions, up to and including termination of our license or ability to operate in those markets; and
· damage to our reputation with customers and regulators.
We expend extensive resources to convert, improve and maintain our information systems and related computer hardware. Failure to continue to successfully do so may result in a negative impact on our results of operations, financial condition, cash flow and reputation with our customers and/or regulators.
Our operations rely heavily on the quality of our information systems, computer hardware and the employees that are responsible to manage them. If any of our system conversion or improvement projects is unsuccessful, if we experience a catastrophic malfunction in any of our hardware or software, or if our processes for managing and maintaining our information systems are inadequate, we could be subjected to:
· inaccurate or non-timely financial accounting and reporting information;
· inaccurate or non-timely customer billing information;
· customer complaints;
· increased regulatory scrutiny;
· inability to successfully complete future business combinations or other customer acquisitions; and/or
· inaccurate forecasts of expected customer consumption requirements, potentially resulting in misalignment with hedged positions and related impact on gross profit.
Our operations in Houston, Texas and the communities where our employees and certain of our customers live are located along the southeast coast of Texas and are vulnerable to hurricanes in the Gulf of Mexico.
Because of its proximity to the Gulf of Mexico, the southeastern coast of Texas is vulnerable to hurricanes, which can cause significant damage to property and public infrastructure. In particular, damage to property and disruption of electrical and other basic utilities for extended periods can have a devastating impact on areas struck by hurricanes, including our leased facilities in Houston, Texas and the surrounding communities where our employees live. In addition, because we provide electricity to customers along the southeast coast of Texas, extended disruption of electrical service also could have an adverse impact on our results of operations.
We have a business continuity plan that is periodically reviewed and enhanced to ensure that the effects of such disruptions on our operations result in minimal impact on service provided to our customers and on our results of operations. If our business continuity plan does not function as planned, our operations, financial position and results of operations may be negatively impacted.
Our reliance on the electrical power generation and transmission infrastructure within the U.S. and Canada makes us vulnerable to large-scale power blackouts.
The power generation and transmission infrastructure in the U.S. is very complex. Maintaining reliability of the infrastructure requires appropriate oversight by regulatory agencies, careful planning and design, trained and skilled operators, sophisticated information technology and communication systems, ongoing monitoring and, where necessary, improvements to various components of the infrastructure. Despite extensive oversight and development of numerous safeguards, major electric power blackouts are possible, which could disrupt electrical service for extended periods of time to large geographic regions of the U.S. and Canada. If such a major blackout were to occur, we may be unable to deliver electricity to our customers in the affected region, which would have an adverse impact on our results of operations.
We identified a material weakness in the design and operation of our internal controls over financial reporting as of June 30, 2010 and 2009. Although we instituted new controls and processes to address the material weakness during fiscal year 2010, there can be no assurance that such controls will effectively prevent material misstatements in our consolidated financial statements in future periods.
In our Annual Report on Form 10-K for the fiscal year ended June 30, 2009, we reported our conclusion that a combination of significant deficiencies, when considered in the aggregate, constituted a material weakness in our internal control over financial reporting. For certain of the deficiencies noted as of June 30, 2009, we instituted and tested new controls and processes, which we concluded were effective during fiscal year 2010.
Certain prior deficiencies still exist as of June 30, 2010, resulting in adjustments to our accounting records at June 30, 2010 for amounts that related to quarterly and annual periods previously reported. These adjustments were not deemed by management to be material, individually or in the aggregate, in relation to our financial position or results of operations, taken as a whole, for any annual or quarterly reporting period during fiscal years 2010 or 2009. However, we concluded that the deficiency continues to be a material weakness in the design and operation of our internal controls over financial reporting as of June 30, 2010 such that there was a reasonable possibility that a material misstatement of our interim or annual financial statements would not have been prevented or detected on a timely basis.
As of June 30, 2010, we have instituted enhanced processes and controls to support and validate the proper recording of revenue for substantially all of our markets. Because controls for some of the markets were completed late in our fiscal year, however, we have not yet adequately tested the effectiveness of the controls for those markets. While we believe that these enhanced controls and processes will remedy the material weakness, there can be no assurance that such controls will effectively prevent material misstatements in our consolidated financial statements.
Risks Related to Liquidity, Indebtedness and Capital Structure
We may need to raise additional debt or letter of credit capacity to fund growth or operations, which may not be available to us on favorable terms or at all.
Our business requires substantial capital to fund growth through organic marketing or acquisition, for supporting working capital, for the purchase of natural gas and electricity supply to meet our customers’ needs, and for the credit requirements of forward physical supply. We may need to incur additional debt or obtain additional letter of credit capacity in order to fund working capital, finance other acquisitions or for other purposes. Our ability to obtain new financing will be constrained by the current economic conditions affecting financial markets and by the restrictive covenants contained in the agreements that govern the Commodity Supply Facility and the Fixed Rate Notes due 2014. Specifically, the recent credit crisis and other related trends affecting the banking industry have caused significant operating losses and failures throughout the banking industry. Many lenders and institutional investors have ceased to provide funding to potential borrowers. We may be unable to take advantage of opportunities to acquire customer portfolios or operations of other retail energy businesses, to finance our existing operations or to otherwise expand our business as planned. We cannot be certain that we will be able to obtain such additional financing on favorable terms or at all. If we need additional debt or letter of credit capacity and cannot raise it on acceptable terms, our financial condition and business will be adversely affected.
We will require a significant amount of cash to service our debt obligations. Our ability to generate sufficient cash to service debt depends on the ability of our primary operating subsidiaries to generate adequate cash flow. We are limited in our ability to utilize the proceeds from new debt and equity issuances to prepay and repay the Fixed Rate Notes due 2014.
Holdings has no material operating activities. Accordingly, Holdings’ only material source of cash, including cash to service the Commodity Supply Facility, the Fixed Rate Notes due 2014 and the Floating Rate Notes due 2011, comes from Holdings’ ownership interests in its primary operating subsidiaries. Available distributions from our operating subsidiaries may depend on factors out of our control, which may include:
· the financial performance of our operating subsidiaries;
· covenants contained in our debt agreements;
· covenants contained in other agreements to which we or our subsidiaries are or may become subject;
· business and tax considerations; and
· applicable laws, including laws regarding the payment of distributions.
Our ability to make payments on and to refinance our debt, and to fund planned capital expenditures and expansion efforts and any strategic acquisitions we may make in the future, if any, will depend on our ability to generate cash in the future. This, to a certain extent, is subject to general economic, financial, competitive and other factors that are beyond our control. There can be no assurance that our business will generate sufficient cash flow from operations in the future, that our currently anticipated growth in net sales and cash flow will be realized or that future borrowings will be available to us in an amount sufficient to enable us to repay indebtedness. Additionally, the terms of the Commodity Supply Facility limit our ability to incur additional indebtedness. We may need to refinance all or a portion of our indebtedness on or before maturity. There can be no assurance that we will be able to refinance any of our indebtedness on commercially reasonable terms or at all.
We are exposed to the risk of rapid and significant increases in market prices and their potential impact on our operations in general and on our liquidity under the Commodity Supply Facility in particular.
Dramatic swings in the market prices for natural gas during the fiscal year ended June 30, 2009 resulted in a significant strain on our liquidity under our Revolving Credit Facility, which was terminated as part of the Restructuring. The significant increases and decreases in market prices over this period highlighted the difficulty of predicting market prices and anticipating their impact on our operations. There can be no assurance that any actions we have taken will mitigate the risks associated with the volatile market price environment. As a result, we will continue to be exposed to the risk of volatile market prices for natural gas and electricity and their impact on availability under the Commodity Supply Facility.
Our substantial debt obligations could adversely affect our financial health and prevent us from fulfilling such obligations, including our obligations under the Commodity Supply Facility, the Fixed Rate Notes due 2014 and the Floating Rate Notes due 2011 and we might have difficulty obtaining additional financing.
Our substantial debt obligations could have important consequences, which could include:
· making it more difficult for us to satisfy our debt service obligations;
· increasing our vulnerability to general adverse economic and industry conditions;
· requiring us to dedicate a substantial portion of our cash flow from operations to debt service, thereby reducing the availability of our cash flow to fund working capital, capital expenditures, acquisitions and other general corporate purposes;
· limiting our flexibility in planning for, or reacting to, changes in our business and the markets in which we operate;
· placing us at a competitive disadvantage compared to our competitors that have less debt; and
· limiting our ability to borrow additional funds.
Significant increases in energy prices or other adverse industry or financial trends that are outside of our direct control could cause us to draw down on a portion or all of our available credit. We may require additional indebtedness in the future. Our ability to obtain new debt is limited by the agreements governing the Commodity Supply Facility, the Fixed Rate Notes due 2014 and the Floating Rate Notes due 2011. If new debt is added to current debt levels, the related risks described above could intensify. If such debt financing is not available when required or is not available on acceptable terms, we may be unable to grow our business, take advantage of business opportunities, respond to competitive pressures or refinance maturing debt, any of which could have a material adverse effect on our operating results and financial condition.
Restrictive covenants in the terms of our financings may reduce our operational and financial flexibility, which may prevent us from capitalizing on business opportunities.
The agreements that govern the Commodity Supply Facility and the Fixed Rate Notes due 2014 contain a number of operating and financial covenants restricting Holdings’ and its subsidiaries’ ability to, among other things:
· incur additional indebtedness;
· create liens on assets;
· pay dividends or distributions on, or redeem or repurchase, capital stock;
· make investments;
· transfer or sell assets;
· guarantee debt;
· restrict dividends and other payments;
· consolidate, merge or transfer all or substantially all assets and the assets of subsidiaries; and
· engage in unrelated businesses.
In addition, under the Commodity Supply Facility, Holdings and its subsidiaries are required to maintain a collateral coverage ratio. If we breach any of the covenants contained in the agreements that govern the Commodity Supply Facility or the indenture, the principal of, and accrued interest on, the applicable debt could become due and payable. In addition, that default could constitute a cross-default under our other indebtedness. Although any default under the Fixed Rate Notes due 2014 is subject to certain standstill provisions, if such a default or cross-default were to occur, we would not be able to satisfy our debt obligations, which would have a substantial material adverse impact on our ability to continue as a going concern. There can be no assurance that we will be able to comply with these restrictions in the future or that our compliance would not cause us to forego opportunities that might otherwise be beneficial to us.
As a result of the Restructuring, our amended organizational documents and governance agreements and the significant changes in our equity ownership could have a material impact on the Company’s future strategic direction.
As a result of the Restructuring, there was a significant change in our ownership. In addition, holders of our Class A Common Stock, Class B Common Stock and Class C Common Stock were given separate approval rights under our organizational documents, which could have an impact on the future direction of the Company, including decisions regarding financing arrangements, capital structure, senior management appointments and business operations. The interests of the
holders of the various classes of our common stock may not be compatible with the interests of other shareholders and directors, or with the strategic objectives of senior management of the Company.
ITEM 1B. UNRESOLVED STAFF COMMENTS
None.
Certain of our executive, finance, marketing, internal audit and legal functions are located in our corporate headquarters in Stamford, Connecticut. Substantially all of our operations, including pricing, information technology and data solutions, risk management, supply, customer operations, accounting, billing and collections and certain human resources functions are located in Houston, Texas, where most of our employees currently work. We also have customer care and various other staff located in Annapolis Junction, Maryland.
We lease all of our properties. As of June 30, 2010, we believe that all properties are suitable and adequate for the business conducted therein, are being appropriately used and have sufficient capacity for the present intended purposes.
From time to time, we are a party to claims and legal proceedings that arise in the ordinary course of business, including investigations of product pricing, billing practices and employment matters by various governmental or other regulatory agencies. We do not believe that any such proceedings to which we are currently a party will have a material adverse impact on our results of operations or financial position.
ITEM 4. (REMOVED AND RESERVED)
None.
ITEM 5. MARKET FOR REGISTRANT’S COMMON EQUITY, RELATED STOCKHOLDER AND ISSUER PURCHASES OF EQUITY SECURITIES
There is no established trading market for our common stock, par value $0.01 per share. As of August 31, 2010, there were 49 holders of record of our Class A Common Stock, 1 holder of record of our Class B Common Stock and 78 holders of record of our Class C Common Stock.
Dividend Policy and Restrictions
Our Board of Directors, at its discretion, has the authority to declare and pay dividends on our common stock, subject to the conditions and limitations set forth in various debt, supply and hedging agreements. We are restricted in our ability to pay dividends by various provisions of agreements that govern the Commodity Supply Facility, the Fixed Rate Notes due 2014 and the Floating Rate Notes due 2011. Refer to “Liquidity and Capital Resources” in Item 7 of this Annual Report for additional information regarding dividend restrictions and the agreements that govern the Commodity Supply Facility, the Fixed Rate Notes due 2014 and the Floating Rate Notes due 2011.
We have never declared or paid any cash dividends on our common stock and do not intend to pay any cash dividends on our common stock in the foreseeable future. We currently intend to retain any future earnings in order to finance the expansion of our business and for general corporate purposes.
ITEM 6. SELECTED FINANCIAL DATA
Adjusted EBITDA
Management believes that Adjusted EBITDA, which is not a financial measure recognized under U.S. GAAP, is a measure commonly used by financial analysts in evaluating operating performance and liquidity of companies, including energy companies. Management also believes that this measure allows a standardized comparison between companies in the energy industry, while minimizing the differences from depreciation policies, financial leverage, hedging strategies and tax strategies. Accordingly, management believes that Adjusted EBITDA is the most relevant financial measure in assessing our operating performance and liquidity. Adjusted EBITDA, as used herein, is not necessarily comparable to similarly titled measures of other companies.
EBITDA is defined as net income (loss) before interest expense, income tax expense (benefit), depreciation and amortization. Adjusted EBITDA is defined by management as net income (loss) before interest expense, income tax expense (benefit), depreciation, amortization, stock compensation expense and unrealized gains (losses) from risk management activities. Management believes the items excluded from EBITDA to calculate Adjusted EBITDA are not indicative of true operating performance or liquidity of the business and generally reflect non-cash charges. Therefore, we believe that EBITDA would not provide an accurate reflection of the economic performance of the business since it includes the unrealized gains (losses) from risk management activities without giving effect to the offsetting changes in market value of the underlying customer contracts that are being economically hedged. In addition, as the underlying customer contracts are not marked-to-market, the unrealized gains (losses) from risk management activities do not offer an accurate indication of the ultimate cash impact to the business, as the ultimate cash impact to the business is not determinable until delivery of natural gas and electricity under the customer contracts and the associated realized gain (loss) on risk management activity.
Management uses Adjusted EBITDA for a variety of purposes, including assessing our performance and liquidity, allocating our resources for operational initiatives (e.g., establishing margins on sales initiatives), allocating our resources for business growth strategies (e.g., considering acquisition opportunities), determining new marketing initiatives, determining new market entry and rationalizing our internal resources. In addition, Adjusted EBITDA is a key variable for estimating our equity value, including various equity instruments (such as common stock, restricted stock units, stock options and warrants), and assessing compensation incentives for our employees. Management also provides financial performance measures to our senior executive team and significant shareholders with an emphasis on Adjusted EBITDA, on a consolidated basis, as the appropriate basis with which to measure the performance and liquidity of our business. Furthermore, certain financial ratios and covenants in the agreements governing our Commodity Supply Facility is based on EBITDA and the items defined above that are excluded to calculate Adjusted EBITDA, as well as other items. Accordingly, management and our significant shareholders utilize Adjusted EBITDA as a primary measure when assessing our operating performance and the liquidity of our business.
EBITDA and Adjusted EBITDA have limitations as analytical tools in comparison to operating income or other combined income data prepared in accordance with U.S. GAAP, including the following:
· They do not reflect cash outlays for capital expenditures or contractual commitments;
· They do not reflect changes in, or cash requirements for, working capital;
· They do not reflect the interest expense or the cash requirements necessary to service interest or principal payments on indebtedness;
· They do not reflect income tax expense or the cash necessary to pay income taxes;
· Although depreciation and amortization are non-cash charges, the assets being depreciated and amortized will often have to be replaced in the future, and EBITDA and Adjusted EBITDA do not reflect cash requirements for such replacements;
· Adjusted EBITDA does not reflect the impact of earnings or charges resulting from matters we consider not to be indicative of our ongoing operations; and
· Other companies, including other companies in our industry, may calculate these measures differently than as presented in this Annual Report, limiting its usefulness as a comparative measure.
Because of these limitations, EBITDA and Adjusted EBITDA and the related ratios should not be considered as a measure of discretionary cash available to invest in business growth or reduce indebtedness.
The financial data included in the following table was derived from our consolidated financial statements, which are included elsewhere in this Annual Report. The table includes a reconciliation from net income (loss) calculated on a U.S. GAAP basis to EBITDA and Adjusted EBITDA. The financial information in the table should be read in conjunction with, and is qualified by reference to, our consolidated financial statements and notes thereto and commentary included in this section.
|
|
|
Fiscal Year Ended June 30, |
|
||||||||||||||
|
|
|
2010 |
|
2009 |
|
2008 |
|
2007 |
|
2006 |
|
||||||
|
|
|
(in thousands) |
|
||||||||||||||
|
Selected statement of operations data: |
|
|
|
|
|
|
|
|
|
|
|
||||||
|
Sales of natural gas and electricity (1) |
|
$ |
561,206 |
|
$ |
789,780 |
|
$ |
752,283 |
|
$ |
703,926 |
|
$ |
362,561 |
|
|
|
Cost of goods sold (1) |
|
408,006 |
|
757,146 |
|
569,585 |
|
602,146 |
|
389,526 |
|
||||||
|
Gross profit (loss) |
|
153,200 |
|
32,634 |
|
182,698 |
|
101,780 |
|
(26,965 |
) |
||||||
|
Operating expenses |
|
92,021 |
|
114,779 |
|
106,645 |
|
91,015 |
|
36,618 |
|
||||||
|
Operating profit (loss) |
|
61,179 |
|
(82,145 |
) |
76,053 |
|
10,765 |
|
(63,583 |
) |
||||||
|
Interest expense, net of interest income |
|
34,982 |
|
45,305 |
|
34,105 |
|
33,058 |
|
3,200 |
|
||||||
|
Income (loss) before income tax (expense) benefit |
|
26,197 |
|
(127,450 |
) |
41,948 |
|
(22,293 |
) |
(66,783 |
) |
||||||
|
Income tax (expense) benefit |
|
(14,692 |
) |
27,249 |
|
(17,155 |
) |
8,495 |
|
27,001 |
|
||||||
|
Net income (loss) |
|
11,505 |
|
(100,201 |
) |
24,793 |
|
(13,798 |
) |
(39,782 |
) |
||||||
|
|
|
|
|
|
|
|
|
|
|
|
|
||||||
|
Items to reconcile net (loss) income to EBITDA: |
|
|
|
|
|
|
|
|
|
|
|
||||||
|
Add (less): |
Interest expense, net of interest income (2) |
|
34,982 |
|
45,305 |
|
34,105 |
|
33,058 |
|
3,200 |
|
|||||
|
|
Depreciation and amortization |
|
22,174 |
|
37,575 |
|
32,698 |
|
27,730 |
|
8,504 |
|
|||||
|
|
Income tax (benefit) expense |
|
14,692 |
|
(27,249 |
) |
17,155 |
|
(8,495 |
) |
(27,001 |
) |
|||||
|
EBITDA |
|
83,353 |
|
(44,570 |
) |
108,751 |
|
38,495 |
|
(55,079 |
) |
||||||
|
|
|
|
|
|
|
|
|
|
|
|
|
||||||
|
Items to reconcile EBITDA to Adjusted EBITDA: |
|
|
|
|
|
|
|
|
|
|
|
||||||
|
Add (less): |
Stock compensation expense |
|
2,363 |
|
519 |
|
3,358 |
|
4,539 |
|
911 |
|
|||||
|
|
Unrealized (gains) losses from risk management activities, net (3) |
|
(27,139 |
) |
87,575 |
|
(67,168 |
) |
17,079 |
|
79,897 |
|
|||||
|
Adjusted EBITDA |
|
$ |
58,577 |
|
$ |
43,524 |
|
$ |
44,941 |
|
$ |
60,113 |
|
$ |
25,729 |
|
|
|
|
|
|
|
|
|
|
|
|
|
|
|
||||||
|
Selected balance sheet data (period-end balances): |
|
|
|
|
|
|
|
|
|
|
|
||||||
|
Total current assets |
|
$ |
148,324 |
|
$ |
203,506 |
|
$ |
271,973 |
|
$ |
257,708 |
|
$ |
67,517 |
|
|
|
Customer acquisition costs, net |
|
30,425 |
|
27,950 |
|
41,693 |
|
38,954 |
|
10,822 |
|
||||||
|
Total assets |
|
202,020 |
|
259,071 |
|
355,752 |
|
335,644 |
|
97,969 |
|
||||||
|
Total current liabilities |
|
54,490 |
|
99,042 |
|
108,276 |
|
91,686 |
|
29,894 |
|
||||||
|
Long-term debt (4) |
|
58,722 |
|
163,476 |
|
162,648 |
|
185,404 |
|
— |
|
||||||
|
Redeemable convertible preferred stock (5) |
|
— |
|
54,632 |
|
48,779 |
|
29,357 |
|
29,357 |
|
||||||
|
Total stockholders’ equity |
|
86,951 |
|
(72,150 |
) |
33,210 |
|
25,611 |
|
35,393 |
|
||||||
(1) Sales of natural gas and electricity and cost of goods sold each include pass-through revenue, primarily representing transportation and distribution charges billed to customers on behalf of certain LDCs, of approximately $56.8 million, $68.3 million, $63.6 million and $54.5 million for the fiscal years ended June 30, 2010, 2009, 2008 and 2007, respectively. Sales of natural gas and electricity also include fee income charged to customers, such as late payment fees, early termination fees and service shut-off fees of approximately $18.6 million, $22.4 million, $19.4 million and $17.1 million for the fiscal years ended June 30, 2010, 2009, 2008 and 2007, respectively. Pass-through revenue and fee income were not material for fiscal years prior to 2007;
(2) Interest expense includes interest and fees incurred in connection with debt instruments, supply facilities and hedging facilities. Interest expense also includes non-cash amortization of deferred debt issuance costs and original issue discount of approximately $11.6 million, $10.3 million and $5.3 million for fiscal years 2010, 2009 and 2008, respectively.
(3) Unrealized gains and losses from risk management activities result from changes in forward natural gas and electricity prices during the respective periods in relation to the contracted forward prices. These amounts should be fully or substantially offset in future periods, as physical commodity is delivered to customers during the remaining terms of their fixed rate contracts.
(4) The Floating Rate Notes due 2011 were issued during the fiscal year ended June 30, 2007 primarily to provide financing for the SESCo acquisition, with the balance being used for working capital needs. Pursuant to the Restructuring, $158.8 million aggregate principal amount of Floating Rate Notes were exchanged for cash, common stock and $67.7 million aggregate principal amount of Fixed Rate Notes due 2014.
(5) As of June 30, 2009, the Preferred Stock was recorded at its estimated redemption value outside of stockholders’ equity on the consolidated balance sheet because it was deemed to be redeemable at the option of the Preferred Investors. As of June 30, 2009, the holders of Preferred Stock did not make an election to redeem the Preferred Stock. In connection with the Restructuring, the Preferred Stock was converted to Class C Common Stock on September 22, 2009.
A reconciliation of Adjusted EBITDA to net cash provided by (used in) operating activities is provided in the following table.
|
|
|
Fiscal Year Ended June 30, |
|
|||||||||||||
|
|
|
2010 |
|
2009 |
|
2008 |
|
2007 |
|
2006 |
|
|||||
|
|
|
|
|
|
|
|
|
|
|
|
|
|||||
|
Adjusted EBITDA |
|
$ |
58,577 |
|
$ |
43,524 |
|
$ |
44,941 |
|
$ |
60,113 |
|
$ |
25,729 |
|
|
Interest expense, net of interest income |
|
(34,982 |
) |
(45,305 |
) |
(34,105 |
) |
(33,058 |
) |
(3,200 |
) |
|||||
|
Income tax (expense) benefit |
|
(14,692 |
) |
27,249 |
|
(17,155 |
) |
8,495 |
|
27,001 |
|
|||||
|
Stock compensation expense |
|
— |
|
— |
|
(1,654 |
) |
— |
|
— |
|
|||||
|
Provision for doubtful accounts |
|
5,164 |
|
12,009 |
|
5,051 |
|
3,018 |
|
|
|
|||||
|
Deferred tax (benefit) expense |
|
19,102 |
|
(23,406 |
) |
18,187 |
|
(14,449 |
) |
(32,764 |
) |
|||||
|
Unrealized losses on interest rate swaps and amortization of deferred financing fees |
|
10,146 |
|
16,233 |
|
10,836 |
|
7,906 |
|
1,057 |
|
|||||
|
Amortization of customer contracts acquired |
|
(50 |
) |
(634 |
) |
(762 |
) |
11,891 |
|
(3,276 |
) |
|||||
|
Change in assets and liabilities, net of effects of acquisitions: |
|
|
|
|
|
|
|
|
|
|
|
|||||
|
Restricted cash |
|
73,794 |
|
(74,781 |
) |
463 |
|
(623 |
) |
6,953 |
|
|||||
|
Fixed Rate Notes Escrow Account |
|
(8,977 |
) |
— |
|
— |
|
— |
|
— |
|
|||||
|
Accounts receivable |
|
(6,491 |
) |
28,066 |
|
(35,232 |
) |
435 |
|
(13,003 |
) |
|||||
|
Accounts receivable, RBS Sempra |
|
(43,054 |
) |
— |
|
— |
|
— |
|
— |
|
|||||
|
Natural gas inventories |
|
13,554 |
|
36,509 |
|
(7,308 |
) |
(1,712 |
) |
(2,685 |
) |
|||||
|
Income taxes receivable |
|
398 |
|
1,063 |
|
(7,173 |
) |
5,184 |
|
(5,535 |
) |
|||||
|
Option premiums |
|
(335 |
) |
1,571 |
|
1,191 |
|
1,835 |
|
(1,834 |
) |
|||||
|
Other assets |
|
(4,732 |
) |
(10,443 |
) |
1,916 |
|
(993 |
) |
2,645 |
|
|||||
|
Customer acquisition costs |
|
(21,863 |
) |
(14,786 |
) |
(18,193 |
) |
(7,415 |
) |
(6,019 |
) |
|||||
|
Accounts payable and accrued liabilities |
|
(12,795 |
) |
(46,553 |
) |
17,882 |
|
31,555 |
|
(5,320 |
) |
|||||
|
Deferred revenue |
|
3,186 |
|
(3,164 |
) |
(4,352 |
) |
9,384 |
|
865 |
|
|||||
|
Net cash provided by (used in) operating activities |
|
$ |
35,950 |
|
$ |
(52,848 |
) |
$ |
(25,467 |
) |
$ |
81,866 |
|
$ |
(9,386 |
) |
|
Net cash used in investing activities |
|
$ |
(1,797 |
) |
$ |
(3,167 |
) |
$ |
(15,748 |
) |
$ |
(125,505 |
) |
$ |
(12,806 |
) |
|
Net cash (used in) provided by financing activities |
|
$ |
(51,199 |
) |
$ |
7,323 |
|
$ |
(23,769 |
) |
$ |
174,788 |
|
$ |
(25,345 |
) |
Selected Data for Business Segments
Selected financial operating data for our natural gas and electricity business segments is provided in the following table.
|
|
|
Natural Gas |
|
Electricity |
|
Total |
|
|||
|
|
|
(in thousands) |
|
|||||||
|
Fiscal year ended June 30, 2010: |
|
|
|
|
|
|
|
|||
|
Sales |
|
$ |
457,909 |
|
$ |
103,297 |
|
$ |
561,206 |
|
|
Cost of goods sold (excluding unrealized gains (losses) from risk management activities, net) (1) |
|
(354,615 |
) |
(80,530 |
) |
(435,145 |
) |
|||
|
Gross profit (excluding unrealized gains (losses) from risk management activities, net) (1) |
|
$ |
103,294 |
|
$ |
22,767 |
|
126,061 |
|
|
|
|
|
|
|
|
|
|
|
|||
|
Items to reconcile total segment gross profit to income before income tax expense: |
|
|
|
|
|
|
|
|||
|
Unrealized gains (losses) from risk management activities, net |
|
|
|
|
|
27,139 |
|
|||
|
Operating expenses |
|
|
|
|
|
(92,021 |
) |
|||
|
Interest expense, net of interest income |
|
|
|
|
|
(34,982 |
) |
|||
|
|
|
|
|
|
|
|
|
|||
|
Income before income tax expense |
|
|
|
|
|
$ |
26,197 |
|
||
|
|
|
|
|
|
|
|
|
|||
|
Fiscal year ended June 30, 2009: |
|
|
|
|
|
|
|
|||
|
Sales |
|
$ |
670,584 |
|
$ |
119,196 |
|
$ |
789,780 |
|
|
Cost of goods sold (excluding unrealized gains (losses) from risk management activities, net) (1) |
|
(572,616 |
) |
(96,955 |
) |
(669,571 |
) |
|||
|
Gross profit (excluding unrealized gains (losses) from risk management activities, net) (1) |
|
$ |
97,968 |
|
$ |
22,241 |
|
120,209 |
|
|
|
|
|
|
|
|
|
|
|
|||
|
Items to reconcile total segment gross profit to loss before income tax benefit: |
|
|
|
|
|
|
|
|||
|
Unrealized gains (losses) from risk management activities, net |
|
|
|
|
|
(87,575 |
) |
|||
|
Operating expenses |
|
|
|
|
|
(114,779 |
) |
|||
|
Interest expense, net of interest income |
|
|
|
|
|
(45,305 |
) |
|||
|
|
|
|
|
|
|
|
|
|||
|
Loss before income tax benefit |
|
|
|
|
|
$ |
(127,450 |
) |
||
|
|
|
|
|
|
|
|
|
|||
|
Fiscal year ended June 30, 2008: |
|
|
|
|
|
|
|
|||
|
Sales |
|
$ |
669,522 |
|
$ |
82,761 |
|
$ |
752,283 |
|
|
Cost of goods sold (excluding unrealized gains (losses) from risk management activities, net) (1) |
|
(564,219 |
) |
(72,534 |
) |
(636,753 |
) |
|||
|
Gross profit (excluding unrealized gains (losses) from risk management activities, net) (1) |
|
$ |
105,303 |
|
$ |
10,227 |
|
115,530 |
|
|
|
|
|
|
|
|
|
|
|
|||
|
Items to reconcile total segment gross profit to income before income tax expense: |
|
|
|
|
|
|
|
|||
|
Unrealized gains (losses) from risk management activities, net |
|
|
|
|
|
67,168 |
|
|||
|
Operating expenses |
|
|
|
|
|
(106,645 |
) |
|||
|
Interest expense, net of interest income |
|
|
|
|
|
(34,105 |
) |
|||
|
|
|
|
|
|
|
|
|
|||
|
Income before income tax expense |
|
|
|
|
|
$ |
41,948 |
|
||
(1) Includes realized losses from risk management activities, but excludes unrealized gains (losses) from risk management activities. As the underlying customer contracts are not marked-to-market, the unrealized gains (losses) from risk management activities do not offer an accurate indication of the ultimate cash impact to the business, as the ultimate cash impact to the business is not determinable until delivery of natural gas under the customer contracts and the associated gain (loss) on risk management activity is realized.
Additional selected operating data for our business segments is summarized in the following table.
|
|
|
Fiscal Year Ended June 30, |
|
|||||||||||||
|
|
|
2010 |
|
2009 |
|
2008 |
|
2007 |
|
2006 |
|
|||||
|
Natural Gas: |
|
|
|
|
|
|
|
|
|
|
|
|||||
|
RCEs at period end (1) |
|
433,000 |
|
473,000 |
|
553,000 |
|
537,000 |
|
347,000 |
|
|||||
|
Average RCEs during the period (1) |
|
444,000 |
|
534,000 |
|
541,000 |
|
554,000 |
|
380,000 |
|
|||||
|
MMBtus sold during the period |
|
46,034,000 |
|
54,806,000 |
|
54,339,000 |
|
57,064,000 |
|
35,488,000 |
|
|||||
|
Sales per MMBtu sold during the period |
|
$ |
9.95 |
|
$ |
12.24 |
|
$ |
12.32 |
|
$ |
11.93 |
|
$ |
9.74 |
|
|
Gross profit per MMBtu sold during the period (2) |
|
$ |
2.24 |
|
$ |
1.79 |
|
$ |
1.94 |
|
$ |
2.02 |
|
$ |
1.38 |
|
|
Heating degree days |
|
4,384 |
|
4,460 |
|
4,249 |
|
|
(3) |
|
(3) |
|||||
|
|
|
|
|
|
|
|
|
|
|
|
|
|||||
|
Electricity: |
|
|
|
|
|
|
|
|
|
|
|
|||||
|
RCEs at period end |
|
173,000 |
|
82,000 |
|
90,000 |
|
40,000 |
|
11,000 |
|
|||||
|
Average RCEs during the period |
|
108,000 |
|
87,000 |
|
64,000 |
|
21,000 |
|
12,000 |
|
|||||
|
MWhrs sold during the period |
|
946,000 |
|
851,000 |
|
636,000 |
|
193,000 |
|
120,000 |
|
|||||
|
Sales per MWhr sold during the period |
|
$ |
109.19 |
|
$ |
140.07 |
|
$ |
130.13 |
|
$ |
119.77 |
|
$ |
141.10 |
|
|
Gross profit per MWhr sold during the period (2) |
|
$ |
24.07 |
|
$ |
26.14 |
|
$ |
16.08 |
|
$ |
18.54 |
|
$ |
32.58 |
|
|
Cooling degree days |
|
1,318 |
|
1,361 |
|
1,267 |
|
|
(4) |
|
(4) |
|||||
(1) Excludes RCEs to be served in connection with the SSO Program pursuant to a one-year contract that expires March 31, 2011.
(2) Includes fee income and realized losses from risk management activities, but excludes unrealized (gains) losses from risk management activities.
(3) Data not available.
(4) Information is not meaningful due to the relative small size of the electricity customer portfolio and related volumes in relation to consolidated operations.
ITEM 7. MANAGEMENT’S DISCUSSION AND ANALYSIS OF FINANCIAL CONDITION AND RESULTS OF OPERATIONS
Executive Overview
Management uses Adjusted EBITDA for various management purposes, which are described in Item 6 of this Annual Report. Significant activity affecting Adjusted EBITDA is summarized in the following table.
|
|
|
Fiscal Year Ended June 30, |
|
|||||||||||||
|
|
|
2010 |
|
2009 |
|
2008 |
|
2007 |
|
2006 |
|
|||||
|
|
|
(in thousands) |
|
|||||||||||||
|
|
|
|
|
|
|
|
|
|
|
|
|
|||||
|
Adjusted EBITDA for prior fiscal year |
|
$ |
43,524 |
|
$ |
44,941 |
|
$ |
60,113 |
|
$ |
25,729 |
|
$ |
36,283 |
|
|
Increases (decreases) in Adjusted EBITDA resulting from: |
|
|
|
|
|
|
|
|
|
|
|
|||||
|
Changes in gross profit, excluding unrealized (gains) losses from risk management activities, due to: |
|
|
|
|
|
|
|
|
|
|
|
|||||
|
Natural gas |
|
5,326 |
|
(7,335 |
) |
(9,977 |
) |
66,258 |
|
(8,568 |
) |
|||||
|
Electricity |
|
526 |
|
12,014 |
|
6,648 |
|
(331 |
) |
2,420 |
|
|||||
|
Lower (higher) operating expenses, excluding depreciation, amortization and stock compensation expense |
|
9,201 |
|
(6,096 |
) |
(11,843 |
) |
(31,543 |
) |
(4,406 |
) |
|||||
|
Adjusted EBITDA for current fiscal year |
|
$ |
58,577 |
|
$ |
43,524 |
|
$ |
44,941 |
|
$ |
60,113 |
|
$ |
25,729 |
|
Refer to “Results of Operations” below for additional commentary regarding the changes noted in this table.
Balance Sheet Overview
Guaranteed and Non-Guaranteed Customer Accounts Receivable
Accounts receivable, net is summarized in the following table.
|
|
|
Balances at June 30, |
|
||||
|
|
|
2010 |
|
2009 |
|
||
|
|
|
(in thousands) |
|
||||
|
Billed customer accounts receivable: |
|
|
|
|
|
||
|
Guaranteed by LDCs |
|
$ |
11,736 |
|
$ |
7,768 |
|
|
Non-guaranteed by LDCs |
|
21,543 |
|
26,679 |
|
||
|
|
|
33,279 |
|
34,447 |
|
||
|
Unbilled customer accounts receivable (1): |
|
|
|
|
|
||
|
Guaranteed by LDCs |
|
10,206 |
|
5,737 |
|
||
|
Non-guaranteed by LDCs |
|
7,211 |
|
10,547 |
|
||
|
|
|
17,417 |
|
16,284 |
|
||
|
Total customer accounts receivable |
|
50,696 |
|
50,731 |
|
||
|
Less: Allowance for doubtful accounts |
|
(5,074 |
) |
(7,344 |
) |
||
|
Customer accounts receivable, net |
|
45,622 |
|
43,387 |
|
||
|
Imbalance settlements and other receivables, net (2) |
|
3,303 |
|
4,211 |
|
||
|
Accounts receivable, net |
|
$ |
48,925 |
|
$ |
47,598 |
|
(1) Unbilled customer accounts receivable represents estimated revenues associated with natural gas and electricity consumed by customers but not yet billed under the monthly cycle billing method utilized by LDCs.
(2) Cash imbalance settlements represent differences between natural gas delivered to LDCs for consumption by the Company’s customers and actual customer usage. Such imbalances are expected to be settled in cash within the next 12 months in accordance with contractual payment arrangements with the LDCs.
Our credit risk is limited as certain LDCs guarantee billed and unbilled customer accounts receivable or amounts due for delivered gas and electricity. In markets where the LDC guarantees receivables, we are exposed only to the credit risk of the LDC, rather than that of our actual customers. As of June 30, 2010 and 2009, all of our billed and unbilled customer accounts receivable in guaranteed markets were from LDCs with investment grade credit ratings. We periodically review payment history, credit ratings and financial information for LDCs to ensure that we identify and respond to any deteriorating trends.
In the market areas where the LDC does not guarantee customer accounts receivable, we maintain an allowance for doubtful accounts that is based upon the credit risk of our customers, historical trends and other information. The provision for
doubtful accounts associated with non-guaranteed accounts receivable was 1.79%, 2.79% and 1.19% of related sales of natural gas and electricity for fiscal years 2010, 2009 and 2008, respectively. Additional commentary regarding credit risk management and the provision for doubtful accounts is provided in Item 7 of this Annual Report.
Imbalance settlements represent differences between the natural gas or electricity delivered to LDCs or ISOs for consumption by our customers and actual usage by our customers. We expect that such imbalances will be settled with cash within the fiscal year following the balance sheet date. Imbalance settlements will fluctuate from period to period depending on the market price for natural gas and electricity, weather patterns and other factors that affect customer consumption, and the timing of cash remittances from LDCs. These receivables are due from LDCs with investment grade credit ratings. Historically, we have collected 100% of these imbalance settlement receivables. However, as a result of a bankruptcy filing by a retail marketer in Georgia in October 2008, the collection of our imbalance receivable position in Georgia was placed at risk. A preliminary settlement proposal offered in March 2009 for resolution of the imbalance receivable resulted in us recording an incremental provision for bad debt expense of approximately $0.6 million during fiscal year 2009, which is included in our allowance for doubtful accounts at June 30, 2010 and 2009.
We operate in 41 market areas located in 14 U.S. states and 2 Canadian provinces. Our diversified geographic coverage mitigates the credit exposure that could result from concentrations in a single LDC territory, or a single regulatory jurisdiction, from extreme local weather patterns or from an economic downturn in any single geographic region.
Refer to Item 7A of this Annual Report for additional commentary regarding our approach for management of credit risk associated with customer accounts receivable.
Natural Gas Inventories
Natural gas inventories are summarized in the following table.
|
|
|
Balances at June 30, |
|
||||
|
|
|
2010 |
|
2009 |
|
||
|
|
|
(in thousands) |
|
||||
|
|
|
|
|
|
|
|
|
|
Storage inventory for delivery to customers |
|
$ |
9,956 |
|
$ |
24,457 |
|
|
Imbalance settlements in-kind (1) |
|
5,905 |
|
4,958 |
|
||
|
Total |
|
$ |
15,861 |
|
$ |
29,415 |
|
(1) Represents inventory to be transferred to the Company or its customers from LDCs as a result of an excess of natural gas deliveries over amounts used by customers in prior periods. We anticipate that these inventories will be transferred to the Company or its customers within the upcoming twelve-month period.
The volume of natural gas held in storage decreased 63% from 4.9 million MMBtus at June 30, 2009 to 1.8 million MMBtus at June 30, 2010. Prior to the Restructuring, we managed storage capacity for our natural gas inventory. During the months of April through October, we traditionally purchased natural gas to be held in natural gas inventory until such inventory was transferred to LDCs for distribution to our customers during the winter months. Natural gas inventories recorded on the consolidated balance sheet at June 30, 2009 included this activity. In connection with the Commodity Supply Facility, we released a substantial portion of our storage capacity to RBS Sempra during the fiscal year ended June 30, 2010. We enter into physical forward contracts to purchase a similar quantity of natural gas from RBS Sempra during the winter months, at a cost that will approximate our cost had we retained that storage capacity. As of June 30, 2010, the Company had entered into physical forward contracts to purchase approximately 4.3 million MMBtus of natural gas from RBS Sempra.
The weighted-average cost per MMBtu of natural gas held in storage increased 9% from June 30, 2009 to June 30, 2010, which partially offset the impact of lower volume of natural gas held in storage.
Unrealized Gains and Losses from Risk Management Activities, Net
Unrealized gains and losses from risk management activities recorded on the consolidated balance sheets primarily reflect the current market values for commodity derivatives utilized as economic hedges to reduce our exposure to changes in the prices of natural gas and electricity. Changes in such market value during the term of a derivative contract are recorded as unrealized gains and losses from risk management activities on the consolidated statements of operations. As derivative contracts expire and related market values are settled, realized gains and losses are recorded on the consolidated statements of operations.
Total unrealized losses from risk management activities included in current and long-term liabilities decreased to approximately $18.6 million at June 30, 2010 from $48.3 million at June 30, 2009. Additionally, on the consolidated
statements of operations, both realized and unrealized losses from risk management activities decreased significantly for fiscal year 2010, as compared with the prior fiscal year.
Market prices for natural gas decreased sharply during fiscal year 2009, which resulted in lower forward commodity contract prices as compared with the average prices on related open hedge contracts for natural gas entered into to match customer contracts for future sales of natural gas. Such changes in market values of derivative instruments resulted in significant unrealized losses from risk management activities during fiscal year 2009. During fiscal year 2010, we experienced a significantly less volatile market price environment, which resulted in lower unrealized losses from risk management activities on our consolidated balance sheets at June 30, 2010, as compared with June 30, 2009.
Denham Credit Facility
Denham Commodity Partners Fund LP (“Denham”) is a significant stockholder of the Company. As of June 30, 2009, we had borrowed the entire available balance under a $12.0 million line of credit from Denham. In connection with the Restructuring, the entire balance of the Denham Credit Facility, plus accrued interest, was repaid and the Denham Credit Facility was terminated on September 22, 2009.
Bridge Financing Loans
In connection with the Revolving Credit Facility, during fiscal year 2009, Charter Mx LLC, Denham and four members of our senior management team agreed to provide bridge financing in an aggregate amount of $10.4 million (the “Bridge Financing Loans”). The Bridge Financing Loan from Charter Mx LLC was repaid in April 2009. The remaining Bridge Financing Loans were repaid on September 22, 2009, in connection with the Restructuring.
Long-Term Debt
As of June 30, 2009, we had $165.2 million aggregate principal amount of Floating Rate Notes due 2011 outstanding. On September 22, 2009, we consummated an exchange offer pursuant to which we exchanged $158.8 million aggregate principal amount of Floating Rate Notes due 2011 for $26.7 million of cash, $67.8 million aggregate principal amount of Fixed Rate Notes due 2014 and 33,940,683 shares of newly authorized Class A Common Stock. The Fixed Rate Notes due 2014 were issued at a discount of $17.8 million, which was recorded as a reduction from the Fixed Rate Notes due 2014 on our consolidated balance sheet, and which will be amortized over the remaining life of the Fixed Rate Notes due 2014.
Holders of $6.4 million aggregate principal amount of Floating Rate Notes due 2011 did not tender their notes pursuant to the Restructuring. These Floating Rate Notes due 2011 will remain on our consolidated balance sheets until acquired or retired by us or until their maturity date in August 2011.
Redeemable Convertible Preferred Stock
On June 30, 2004, the Company entered into a purchase agreement with Preferred Investors to issue 1,451,310 shares of Preferred Stock at a purchase price of $21.36 per share. As of June 30, 2009, the Preferred Stock was recorded at its estimated redemption value outside of stockholders’ equity on the consolidated balance sheet because it was deemed to be redeemable at the option of the Preferred Investors.
In connection with the Restructuring, on September 22, 2009, all outstanding shares of Preferred Stock were exchanged for 11,862,551 shares of newly authorized Class C Common Stock. The excess of the redemption value over the aggregate fair value of common stock issued to the holders of Preferred Stock was recorded as a reduction of accumulated deficit on the consolidated balance sheets.
Stockholders’ Equity Activity
In connection with the Restructuring, Holdings issued the following shares of common stock:
· 33,940,683 shares of Class A Common Stock were issued to holders of the Fixed Rate Notes due 2014, which represented 62.5% of the aggregate shares of common stock outstanding after the consummation of the Restructuring. The aggregate fair value of Class A Common Stock issued was approximately $82.1 million ($0.3 million par value, recorded as Class A Common Stock; and $81.8 million recorded as additional paid in capital on the consolidated balance sheets).
· 4,002,290 shares of Class B Common Stock were issued to RBS Sempra, as a condition to the entry into the agreements governing the Commodity Supply Facility, which represented 7.37% of the aggregate shares of common stock outstanding after consummation of the Restructuring. The aggregate $9.0 million fair value of Class B
Common Stock issued to RBS Sempra (par value of less than $0.1 million, recorded as Class B Common Stock; and $9.0 million recorded as additional paid in capital on the consolidated balance sheets) was recorded as deferred debt issue costs on the consolidated balance sheets.
· 11,862,551 shares of Class C Common Stock were issued to holders of Preferred Stock, which represented 21.84% of the aggregate shares of the common stock outstanding after consummation of the Restructuring. Prior to the Restructuring, the Preferred Stock was recorded at its estimated redemption value of $54.6 million on the consolidated balance sheets. The aggregate fair value of Class C Common Stock issued to holders of Preferred Stock was $28.7 million ($0.1 million par value, recorded as Class C Common Stock; and $28.6 million recorded as additional paid in capital on the consolidated balance sheets). The $25.9 million excess of redemption value of the Preferred Stock over the fair value of Class C Common Stock issued to the holders of Preferred Stock was recorded as a reduction of accumulated deficit on the consolidated balance sheets.
· 4,499,588 shares of Class C Common Stock to the remaining holders of Holdings’ common stock issued and outstanding prior to the consummation of the Restructuring, which represented 8.29% of the aggregate shares of common stock outstanding after the consummation of the Restructuring. All 4,681,219 shares of Holdings’ common stock issued and outstanding prior to the Restructuring were retired.
In connection with the Restructuring, the Company incurred approximately $0.3 million of legal fees, consulting fees and other costs directly related to the issuance of shares of common stock outlined above, which were recorded as a reduction of additional paid in capital.
Results of Operations
Gross Profit by Business Segment
Gross profit by business segment is summarized in the following table. For purposes of this analysis, gross profit includes fee income and realized losses from risk management activities, but excludes unrealized gains (losses) from risk management activities. As the underlying customer contracts are not marked-to-market, the unrealized gains (losses) from risk management activities do not offer an accurate indication of the ultimate cash impact to the business, as the ultimate cash impact to the business is not determinable until delivery of the respective commodity under the customer contracts and the associated revenue and gain (loss) on risk management activity are realized.
|
|
|
|
|
|
|
|
|
2010 versus 2009 |
|
2009 versus 2008 |
|
|||||||||
|
|
|
Fiscal Year Ended June 30, |
|
Increase (Decrease) |
|
Increase (Decrease) |
|
|||||||||||||
|
Business Segment |
|
2010 |
|
2009 |
|
2008 |
|
Amount |
|
% |
|
Amount |
|
% |
|
|||||
|
|
|
($ in thousands) |
|
|||||||||||||||||
|
|
|
|
|
|
|
|
|
|
|
|
|
|
|
|
|
|||||
|
Natural Gas |
|
$ |
103,294 |
|
$ |
97,968 |
|
$ |
105,303 |
|
$ |
5,326 |
|
5 |
|
$ |
(7,335 |
) |
(7 |
) |
|
Electricity |
|
22,767 |
|
22,241 |
|
10,227 |
|
526 |
|
2 |
|
12,014 |
|
117 |
|
|||||
|
Total gross profit before unrealized (gains) losses from risk management activities, net |
|
$ |
126,061 |
|
$ |
120,209 |
|
$ |
115,530 |
|
$ |
5,852 |
|
5 |
|
$ |
4,679 |
|
4 |
|
Fiscal Year Ended June 30, 2010 Versus 2009
Natural Gas Gross Profit
Over the course of our fiscal year, natural gas gross profit is impacted by several factors, which include but are not limited to:
· The prices we charge our customers in relation to the cost of natural gas delivered to our customers;
· The volume of natural gas delivered to our customers, which is impacted by the number of customers that we serve, weather conditions in our markets, economic conditions and other factors that may affect customer usage;
· Volatility in the market price of natural gas that we purchase for delivery to our customers; and
· Results of our economic hedging policy that is intended to reduce our financial exposure related to changes in the price of natural gas.
Significant activity affecting natural gas gross profit (before unrealized (gains) losses from risk management activities, net) for fiscal years 2010 and 2009 is summarized in the following tables.
|
|
|
Fiscal Year Ended June 30, |
|
||||||||||
|
|
|
2010 |
|
2009 |
|
||||||||
|
|
|
Amount |
|
Amount per |
|
Amount |
|
Amount per |
|
||||
|
|
|
(in thousands) |
|
||||||||||
|
|
|
|
|
|
|
|
|
|
|
||||
|
Gross profit (before unrealized gains (losses) from risk management activities) |
|
$ |
103,294 |
|
$ |
2.24 |
|
$ |
97,968 |
|
$ |
1.79 |
|
|
Add (less) the relative cost (benefit) during the period associated with commodity price volatility and economic hedging activity: |
|
|
|
|
|
|
|
|
|
||||
|
Weighted-average cost of gas methodology |
|
(1,146 |
) |
(0.02 |
) |
794 |
|
0.01 |
|
||||
|
Realized (gains) losses from risk management activities associated with natural gas inventory at end of period |
|
(5,598 |
) |
(0.12 |
) |
13,203 |
|
0.24 |
|
||||
|
|
|
96,550 |
|
2.10 |
|
111,965 |
|
2.04 |
|
||||
|
Fee income |
|
(16,883 |
) |
(0.37 |
) |
(20,796 |
) |
(0.38 |
) |
||||
|
Amount attributable to natural gas delivered to customers |
|
$ |
79,667 |
|
$ |
1.73 |
|
$ |
91,169 |
|
$ |
1.66 |
|
Impact of Weighted Average Cost of Gas Inventory Valuation Methodology on Cost of Sales
Our application of weighted average cost accounting to the valuation of natural gas inventory assumes that all purchases of natural gas are initially capitalized as natural gas inventories in the consolidated balance sheet. The resulting weighted average cost per MMBtu is then utilized to calculate the cost of natural gas subsequently sold. As a result, when the price per MMBtu of natural gas purchased during a reporting period is less than the weighted average cost per MMBtu of storage inventory at the beginning of the period, the weighted average cost per unit of storage inventory will be lower at the end of the period than at the beginning of the period. The reduction in inventory value per MMBtu deferred in the balance sheet between the beginning and end of an operating period is reflected as an increase in cost of natural gas sold in the consolidated statement of operations for the period.
Conversely, for reporting periods during which natural gas prices per MMBtu are greater during the period than the weighted average cost of storage inventory at the beginning of that period, the weighted average cost per unit of storage inventory will be higher at the end of the period than at the beginning of the period, resulting in lower cost of natural gas inventory sold for that period.
The impacts described above on the weighted average cost of gas are more pronounced in periods where we inject storage gas and have an increase in storage volume from the beginning to the end of the period. Offsetting net increases or decreases in gross profit are generally realized in future periods as these inventories are sold.
Realized Gains and Losses from Risk Management Activities, Net, Associated With Natural Gas Inventories Not Yet Sold
Since we do not perform hedge accounting, realized (gains) losses from risk management activities, net includes net gains and losses related to the settlement of risk management activities associated with natural gas inventories not yet sold. Offsetting net increases or decreases in gross profit are generally realized in future periods, between November and March, as these inventories are sold.
Fee Income
Fee income decreased $3.9 million (19%) during fiscal year 2010, as compared with the prior fiscal year, due primarily to a reduction in the number of customers served in markets where we are responsible for billing, and lower credit-related fees due to improved credit quality of the overall customer portfolio.
Gross Profit Attributable to Natural Gas Delivered to Customers
Our participation in the SSO Program, which began on April 1, 2010, resulted in a minimal impact on natural gas gross profit from its inception through June 30, 2010. Excluding the impact of the SSO Program, our gross profit for natural gas sold to customers would have been $1.80 per MMBtu for fiscal year 2010.
Lower gross profit attributable to natural gas delivered to customers was due primarily to a 19% reduction in the volumes of natural gas sold to customers, which was partially offset by a 4% increase in gross profit per MMBtu of natural gas delivered to customers. Lower volumes delivered to customers were due to a lower number of customers served. Higher gross profit per MMBtu sold was due to colder-than-normal weather and a favorable pricing environment in many of our natural gas markets. During fiscal year 2010, as weather-related demand increased, natural gas commodity prices remained uncharacteristically low. This allowed us to realize higher than normal gross profit, particularly on the incremental volumes
of natural gas delivered to customers during the winter.
Electricity Gross Profit
Electricity gross profit was 2% higher for fiscal year 2010, as compared with the prior year. An 11% increase in the volume of MWhrs sold to customers, which was driven by higher average RCEs for fiscal year 2010, was partially offset by an 8% reduction in gross profit per MWhr sold during the period, which resulted from competitive pricing environments in many of our electricity markets, including our new market in Pennsylvania.
Fiscal Year Ended June 30, 2009 Versus 2008
Natural Gas Gross Profit
|
|
|
Fiscal Year Ended June 30, |
|
||||||||||
|
|
|
2009 |
|
2008 |
|
||||||||
|
|
|
|
|
Amount per |
|
|
|
Amount per |
|
||||
|
|
|
Amount |
|
MMBtu Sold |
|
Amount |
|
MMBtu Sold |
|
||||
|
|
|
(in thousands) |
|
||||||||||
|
|
|
|
|
|
|
|
|
|
|
||||
|
Gross profit (before unrealized gains (losses) from risk management activities) |
|
$ |
97,968 |
|
$ |
1.79 |
|
$ |
105,303 |
|
$ |
1.94 |
|
|
Add (less) the relative cost (benefit) during the period associated with commodity price volatility and economic hedging activity: |
|
|
|
|
|
|
|
|
|
||||
|
Weighted-average cost of gas methodology |
|
794 |
|
0.01 |
|
(1,376 |
) |
(0.03 |
) |
||||
|
Realized (gains) losses from risk management activities associated with natural gas inventory at end of period |
|
13,203 |
|
0.24 |
|
(4,826 |
) |
(0.09 |
) |
||||
|
|
|
111,965 |
|
2.04 |
|
99,101 |
|
1.82 |
|
||||
|
Fee income |
|
(20,796 |
) |
(0.38 |
) |
(18,833 |
) |
(0.35 |
) |
||||
|
Amount attributable to natural gas delivered to customers |
|
$ |
91,169 |
|
$ |
1.66 |
|
$ |
80,268 |
|
$ |
1.47 |
|
Fee Income
Our gross margin includes fee income charged to customers, primarily in our Georgia natural gas market, for monthly service, late payment and shut-off/reconnect service. Fee income was $2.0 million higher for fiscal year 2009, as compared with the prior fiscal year, due primarily to increased late payment and service termination fees in these markets.
Gross Profit Attributable to Natural Gas Delivered to Customers
The volume of natural gas MMBtus sold was approximately 1% higher for fiscal year 2009, as compared with the same period in the prior fiscal year. Lower average RCEs were offset by higher heating degree days during fiscal year 2009. Higher volumes of natural gas sold resulted in higher natural gas gross profit of approximately $0.7 million for fiscal year 2009, as compared with the prior fiscal year.
The net impacts described above were partially offset by higher gross profit per MMBtu sold resulting from a favorable pricing environment in many of our markets, particularly for our variable price accounts.
Electricity Gross Profit
Higher electricity sales and gross profit were primarily driven by higher average electricity RCEs, which increased 28% during fiscal year 2009, as compared with the prior fiscal year, resulting in significantly higher volume of MWhrs sold. The main driver for higher average RCEs was significant organic customer growth in our Texas, Connecticut and New York market areas, which was largely due to targeted direct sales marketing activities during fiscal year 2008 and the first three months of fiscal year 2009 and a wider range of products offered to customers. Higher gross profit per MWhr sold also contributed to the overall increase in electricity gross profit.
Operating Expenses
Operating expenses are summarized in the following table.
|
|
|
|
|
|
|
|
|
2010 versus 2009 |
|
2009 versus 2008 |
|
|||||||||
|
|
|
Fiscal Year Ended June 30, |
|
Increase |
|
Increase |
|
|||||||||||||
|
|
|
2010 |
|
2009 |
|
2008 |
|
Amount |
|
% |
|
Amount |
|
% |
|
|||||
|
|
|
($ in thousands) |
|
|||||||||||||||||
|
|
|
|
|
|
|
|
|
|
|
|
|
|
|
|
|
|||||
|
General and administrative expenses |
|
$ |
58,603 |
|
$ |
59,957 |
|
$ |
62,271 |
|
$ |
(1,354 |
) |
(2 |
) |
$ |
(2,314 |
) |
(4 |
) |
|
Advertising and marketing expenses |
|
3,749 |
|
2,117 |
|
4,546 |
|
1,632 |
|
77 |
|
(2,429 |
) |
(53 |
) |
|||||
|
Reserves and discounts |
|
7,495 |
|
15,130 |
|
7,130 |
|
(7,635 |
) |
(50 |
) |
8,000 |
|
112 |
|
|||||
|
Depreciation and amortization |
|
22,174 |
|
37,575 |
|
32,698 |
|
(15,401 |
) |
(41 |
) |
4,877 |
|
15 |
|
|||||
|
Total operating expenses |
|
$ |
92,021 |
|
$ |
114,779 |
|
$ |
106,645 |
|
$ |
(22,758 |
) |
(20 |
) |
$ |
8,134 |
|
8 |
|
General and Administrative Expenses
General and administrative expenses are summarized in the following table.
|
|
|
|
|
|
|
|
|
2010 versus 2009 |
|
2009versus 2008 |
|
|||||||||
|
|
|
Fiscal Year Ended June 30, |
|
Increase |
|
Increase |
|
|||||||||||||
|
|
|
2010 |
|
2009 |
|
2008 |
|
Amount |
|
% |
|
Amount |
|
% |
|
|||||
|
|
|
($ in thousands) |
|
|||||||||||||||||
|
Salaries and employee benefits |
|
$ |
36,648 |
|
$ |
33,644 |
|
$ |
36,007 |
|
$ |
3,004 |
|
9 |
|
$ |
(2,363 |
) |
(7 |
) |
|
Professional fees |
|
6,391 |
|
7,998 |
|
9,360 |
|
(1,607 |
) |
(20 |
) |
(1,362 |
) |
(15 |
) |
|||||
|
Other general and administrative expenses |
|
15,564 |
|
18,315 |
|
16,904 |
|
(2,751 |
) |
(15 |
) |
1,411 |
|
8 |
|
|||||
|
Total general and administrative expenses |
|
$ |
58,603 |
|
$ |
59,957 |
|
$ |
62,271 |
|
$ |
(1,354 |
) |
(2 |
) |
$ |
(2,314 |
) |
(4 |
) |
Fiscal Year Ended June 30, 2010 versus 2009
In connection with the Restructuring, we recorded approximately $2.2 million of non-recurring general and administrative expenses during fiscal year 2010, including:
· $0.8 million of bonuses, included in salaries and employee benefits, which were paid to management in connection with the consummation of the Restructuring;
· $0.2 million of severance costs, included in salaries and employee benefits, which related to certain employees terminated in September 2009 as part of an initiative to streamline our organizational structure and control operating costs; and
· $1.2 million of professional fees incurred in connection with various potential liquidity events considered during fiscal year 2009 and the first three months of fiscal year 2010.
Salaries and employee benefits for fiscal year 2010 also includes the following non-recurring activity:
· In May 2010, we incurred $1.3 million of severance costs when our Executive Vice President left the Company; and
· Also in May 2010, we amended the employment agreement and entered into a relocation agreement with our Executive Vice President and Chief Financial Officer, which resulted in additional compensation cost of $0.9 million during fiscal year 2010.
Excluding these incremental costs, salaries and employee benefits, expenses were slightly lower for fiscal year 2010, as compared with the prior fiscal year, primarily as a result of a reduced number of employees.
Excluding the incremental costs described above, lower professional fees for fiscal year 2010 were primarily due to termination of management consulting agreements in connection with the Restructuring, and, lower consulting fees associated with compliance with the requirements of the Sarbanes-Oxley Act of 2002.
Lower other general and administrative expenses during the fiscal year 2010 were primarily due to lower customer care and billing related expenses as a result of generally lower numbers of customers served in our natural gas business segment.
Fiscal Year Ended June 30, 2009 Versus 2008
Throughout fiscal year 2008, we incurred significant incremental general and administrative expenses related to initiatives to enhance our corporate finance, billing, accounting operations, customer service, information technology, marketing and supply functions in support of business growth. In addition, we increased our staff count and incurred other incremental
costs to enhance our overall internal control environment, including our information technology and financial reporting controls, and to develop a formal internal audit function. A portion of these incremental contracted services and other incremental costs in fiscal year 2008 have not recurred during fiscal year 2009, resulting in generally lower general and administrative expenses.
In March 2008, the Compensation Committee of our Board of Directors approved the issuance of 19,000 total shares of common stock to two of our senior executives. Total compensation expense related to issuance of these shares was approximately $1.7 million, which included the fair value of the common stock issued and additional compensation to offset the taxable nature of the shares to the employees. Excluding the impact of the compensation expense from issuance of these shares in fiscal year 2008, salaries and employee benefits decreased $0.7 million (2%) during fiscal year 2009, as compared with the prior fiscal year. Salaries and employee benefits include the cost of contracted services to supplement our employees in certain departments. Lower salaries and related expenses during fiscal year 2009 are primarily due to lower contracted services costs.
Higher other general and administrative expenses during fiscal year 2009 were primarily due to generally higher customer care and billing related expenses.
Advertising and Marketing Expenses
Fiscal Year Ended June 30, 2010 versus 2009
Higher advertising and marketing expenses for fiscal year 2010, as compared with the prior fiscal year, reflects our return to a more normal marketing environment subsequent to the Restructuring. As part of an overall corporate strategy to manage our liquidity position, and in response to amendments to the Revolving Credit Facility and Hedge Facility that placed limitations on amounts that we could spend on marketing activities and on the products we could offer to our customers, we curtailed our level of sales and marketing activity, resulting in significantly lower advertising and marketing expenses during the second half of fiscal year 2009 and the first three months of fiscal year 2010.
As a result of the Restructuring, we now have the ability to market a wider variety of products to current and potential customers using our traditional marketing channels. During the last nine months of fiscal year 2009, we implemented various elements of our fiscal year 2010 growth and marketing plan, which included strategic marketing initiatives in our current markets as well as incremental marketing expenses related to new markets, particularly a new electricity market in Pennsylvania.
Fiscal Year Ended June 30, 2009 Versus 2008
As part of an overall corporate strategy to manage our liquidity position, and in response to amendments to our Revolving Credit Facility and Hedge Facility that placed limitations on amounts that we could spend on marketing activities and on the products we could offer to our customers, we intentionally curtailed our level of sales and marketing activity, resulting in significantly lower advertising and marketing expenses during fiscal year 2009, as compared with prior fiscal year.
Reserves and Discounts
Reserves and discounts are summarized in the following table.
|
|
|
|
|
|
|
|
|
2010 versus 2009 |
|
2009 versus 2008 |
|
|||||||||
|
|
|
Fiscal Year Ended June 30, |
|
Increase |
|
Increase |
|
|||||||||||||
|
|
|
2010 |
|
2009 |
|
2008 |
|
Amount |
|
% |
|
Amount |
|
% |
|
|||||
|
|
|
($ in thousands) |
|
|||||||||||||||||
|
|
|
|
|
|
|
|
|
|
|
|
|
|
|
|
|
|||||
|
Provision for doubtful accounts |
|
$ |
5,164 |
|
$ |
12,009 |
|
$ |
5,050 |
|
$ |
(6,845 |
) |
(57 |
) |
$ |
6,959 |
|
138 |
|
|
Contractual discounts for LDC guarantees of customer accounts receivable (1) |
|
2,331 |
|
3,121 |
|
2,080 |
|
(790 |
) |
(25 |
) |
1,041 |
|
50 |
|
|||||
|
Total reserves and discounts |
|
$ |
7,495 |
|
$ |
15,130 |
|
$ |
7,130 |
|
$ |
(7,635 |
) |
(50 |
) |
$ |
8,000 |
|
112 |
|
(1) By agreement, certain LDCs guarantee the collection of customer accounts receivable. Contractual discounts charged by various LDCs average approximately 1% of collections, which is effectively the cost to guarantee the customer accounts receivable.
Fiscal Year Ended June 30, 2010 versus 2009
The lower provision for doubtful accounts during fiscal year 2010 was primarily due to the following factors:
· Sales of natural gas and electricity in markets where customer accounts receivable are not guaranteed by LDCs decreased 33% during fiscal year 2010, as compared with the same period in the prior fiscal year;
· The aging of our customer accounts receivable deteriorated in certain of our larger markets in Georgia, Texas and the northeastern U.S. during fiscal year 2009, which resulted in charge-offs of customer accounts receivable and provisions for doubtful accounts for those markets that were higher than our historical levels. Credit environments have generally stabilized in our markets during fiscal year 2010;
· Our acquisition of Catalyst Natural Gas, LLC in October 2008 resulted in higher reserves against customer accounts receivable deemed uncollectible and incremental charge-offs of customer accounts receivable, which contributed to a higher provision for doubtful accounts in our Georgia natural gas market during fiscal year 2009 and the first quarter of fiscal year 2010. There were no purchase acquisitions of customer accounts during fiscal year 2010 that resulted in incremental charge-offs or provisions for doubtful accounts; and
· During fiscal year 2009, we initiated more stringent credit standards for our new and existing customers, which resulted in generally higher credit quality in our customer portfolio during fiscal year 2010.
We continuously monitor economic conditions and collections experience in our markets in order to assess appropriate levels of our allowance for doubtful accounts. Refer to Item 7A of this Annual Report for additional commentary regarding our management of credit risk.
Lower contractual discounts for LDC guarantees of customer accounts receivable during fiscal year 2010 were due to generally lower sales of natural gas and electricity within our LDC-guaranteed markets. The weighted-average contractual discount rates for fiscal year 2010 were comparable to the rates for the same periods in the prior fiscal year.
Fiscal Year Ended June 30, 2009 Versus 2008
Accounts receivable includes cash imbalance settlements that represent the value of excess natural gas delivered to LDCs for consumption by our customers and actual customer usage. Historically, we have collected 100% of these imbalance settlement receivables. However, as a result of a bankruptcy filing by a retail marketer in Georgia in October 2008, the collection of our imbalance receivable position in Georgia was placed at risk. A preliminary settlement proposal offered in March 2009 for resolution of the imbalance receivable resulted in us recording an incremental provision for bad debt expense of approximately $0.6 million during fiscal year 2009.
Excluding the impact of the Georgia imbalance settlement, the higher provision for doubtful accounts for fiscal year 2009 was primarily due to:
· higher revenue during fiscal year 2009 in our largest non-guaranteed natural gas market in Georgia and in our non-guaranteed electricity market in Texas. Total sales of natural gas and electricity for these markets increased a combined 7% during fiscal year 2009; and
· general deterioration in the aging of customer accounts receivable and higher charge off experience in certain markets, including Georgia and Texas. The deterioration in Georgia was primarily related to collections activity related to customers acquired from Catalyst Natural Gas, LLC in October 2008.
We continue to monitor economic conditions and collections experience in our markets in order to assess appropriate levels of our allowance for doubtful accounts.
Higher contractual discounts for LDC guarantees of customer accounts receivable during fiscal year 2009, as compared with the prior fiscal year, are due to generally higher sales of natural gas and electricity within our LDC guaranteed markets and to a higher weighted-average contractual discount rate. Total revenues within these markets decreased approximately 28% during fiscal year 2009, as compared to the prior fiscal year, primarily due to overall organic growth within these markets. The weighted-average contractual discount rate charged by LDCs also increased by approximately 37%, primarily due to changes in customer market concentrations and increases in the discount rates required by LDCs in certain markets.
Depreciation and Amortization
Depreciation and amortization expenses are summarized in the following table.
|
|
|
|
|
|
|
|
|
2010 versus 2009 |
|
2009versus 2008 |
|
|||||||||
|
|
|
Fiscal Year Ended June 30, |
|
Increase |
|
Increase |
|
|||||||||||||
|
|
|
2010 |
|
2009 |
|
2008 |
|
Amount |
|
% |
|
Amount |
|
% |
|
|||||
|
|
|
($ in thousands) |
|
|||||||||||||||||
|
|
|
|
|
|
|
|
|
|
|
|
|
|
|
|
|
|||||
|
Depreciation of fixed assets |
|
$ |
2,358 |
|
$ |
7,787 |
|
$ |
9,274 |
|
$ |
(5,429 |
) |
(70 |
) |
$ |
(1487 |
) |
(16 |
) |
|
Amortization of customer acquisition costs |
|
19,814 |
|
29,777 |
|
23,414 |
|
(9,963 |
) |
(33 |
) |
6,363 |
|
27 |
|
|||||
|
Other amortization expense |
|
2 |
|
11 |
|
10 |
|
(9 |
) |
(82 |
) |
1 |
|
10 |
|
|||||
|
Total depreciation and amortization |
|
$ |
22,174 |
|
$ |
37,575 |
|
$ |
32,698 |
|
$ |
(15,401 |
) |
(41 |
) |
$ |
4,877 |
|
15 |
|
Fiscal Year Ended June 30, 2010 versus 2009
In connection with our purchase of SESCo in August 2006, we acquired software, fixed assets and customer contracts, the aggregate cost of which was depreciated or amortized over a three-year period. Lower depreciation and amortization expenses during fiscal year 2010 was primarily due to these acquired assets being fully depreciated or amortized as of August 2009.
Fiscal Year Ended June 30, 2009 Versus 2008
During fiscal year 2008, we shifted our marketing focus and resources towards direct sales and marketing activities. Much of the cost associated with these direct marketing channels during fiscal years 2009 and 2008 were deferred as customer acquisition costs on our consolidated balance sheet and are being amortized over a three-year estimated benefit period. Higher amortization expense for fiscal year 2009 was primarily due to these higher deferrals of direct marketing costs.
Interest Expense, net
Interest expense is summarized in the following table.
|
|
|
|
|
|
|
|
|
2010 versus 2009 |
|
2009 versus 2008 |
|
|||||||||
|
|
|
Fiscal Year Ended June 30, |
|
Increase |
|
Increase |
|
|||||||||||||
|
|
|
2010 |
|
2009 |
|
2008 |
|
Amount |
|
% |
|
Amount |
|
% |
|
|||||
|
|
|
($ in thousands) |
|
|||||||||||||||||
|
|
|
|
|
|
|
|
|
|
|
|
|
|
|
|
|
|||||
|
Interest related to debt instruments: |
|
|
|
|
|
|
|
|
|
|
|
|
|
|
|
|||||
|
Floating Rate Notes due 2011 |
|
$ |
3,678 |
|
$ |
16,834 |
|
$ |
20,983 |
|
$ |
(13,156 |
) |
(78 |
) |
$ |
(4,149 |
) |
(20 |
) |
|
Fixed Rate Notes due 2014 |
|
6,850 |
|
— |
|
— |
|
6,850 |
|
100 |
|
— |
|
— |
|
|||||
|
Denham Credit Facility |
|
246 |
|
813 |
|
528 |
|
(567 |
) |
(70 |
) |
285 |
|
54 |
|
|||||
|
|
|
|
|
|
|
|
|
|
|
|
|
|
|
|
|
|||||
|
Interest and fees related to supply and hedging facilities: |
|
|
|
|
|
|
|
|
|
|
|
|
|
|
|
|||||
|
Commodity Supply Facility |
|
7,610 |
|
— |
|
— |
|
7,610 |
|
100 |
|
— |
|
— |
|
|||||
|
Revolving Credit Facility |
|
1,185 |
|
7,809 |
|
3,021 |
|
(6,624 |
) |
(85 |
) |
4,788 |
|
158 |
|
|||||
|
Hedge Facility |
|
1,788 |
|
4,133 |
|
2,906 |
|
(2,345 |
) |
(57 |
) |
1,227 |
|
42 |
|
|||||
|
|
|
|
|
|
|
|
|
|
|
|
|
|
|
|
|
|||||
|
Change in value of interest rate swaps (1) |
|
2,095 |
|
4,999 |
|
4,963 |
|
(2,904 |
) |
(58 |
) |
36 |
|
1 |
|
|||||
|
Amortization of deferred financing costs and original debt issue discount |
|
11,608 |
|
10,332 |
|
5,345 |
|
1,276 |
|
12 |
|
4,987 |
|
93 |
|
|||||
|
Other |
|
193 |
|
815 |
|
165 |
|
(622 |
) |
(76 |
) |
650 |
|
394 |
|
|||||
|
Total interest expense |
|
35,253 |
|
45,735 |
|
37,911 |
|
(10,482 |
) |
(23 |
) |
7,824 |
|
21 |
|
|||||
|
Less: interest income |
|
(271 |
) |
(430 |
) |
(3,806 |
) |
159 |
|
(37 |
) |
3,376 |
|
(89 |
) |
|||||
|
Interest expense, net |
|
$ |
34,982 |
|
$ |
45,305 |
|
$ |
34,105 |
|
$ |
(10,323 |
) |
(23 |
) |
$ |
11,200 |
|
33 |
|
(1) Includes mark-to-market adjustments and interest expense associated with interest rate swap agreements utilized to manage exposure to interest rate fluctuations related to the Floating Rate Senior Notes due 2011 and the Commodity Supply Facility.
Fiscal Year Ended June 30, 2010 versus 2009
Interest Related to Debt Instruments
Lower total interest expense associated with debt instruments for fiscal year 2010 is primarily due to decreased total debt balances resulting from the Restructuring. The total aggregate principal balance outstanding under debt instruments decreased from approximately $177.2 million prior to the Restructuring to $74.2 million after the Restructuring.
Lower interest expense associated with the Floating Rate Notes due 2011 for fiscal year 2010 was due to a combination of lower debt balances and lower interest rates. As a result of the Restructuring, the average aggregate outstanding principal balance of Floating Rate Notes due 2011 decreased to approximately $42.5 million for fiscal year 2010, from $165.2 million for the prior fiscal year. The weighted-average interest rate for the Floating Rate Notes due 2011 also decreased to 8.26% for fiscal year 2010 from 10.02% for the prior fiscal year.
The $67.8 million aggregate principal amount of Fixed Rate Notes due 2014 issued in connection with the Restructuring bears interest at 13.25%, which is higher than the average interest rates on outstanding debt instruments prior to the Restructuring. The higher interest rate on the Floating Rate Notes due 2014 partially offset the impact of lower average debt balances for fiscal year 2010.
Interest and Fees Related to Supply and Hedging Facilities
In connection with the Restructuring, the Commodity Supply Facility replaced the Revolving Credit Facility and Hedge Facility effective September 22, 2009. During the three months ended September 30, 2009, we incurred significant fees related to extension and winding down of the Hedge Facility and Revolving Credit Facility prior to the Restructuring. Excluding these incremental fees, fees associated with our supply and hedging activities are generally lower under the Commodity Supply Facility than those under the former Revolving Credit Facility and Hedge Facility.
Amortization of Deferred Financing Costs and Original Debt Issue Discount
Higher amortization of deferred debt issue costs and original issue discount during fiscal year 2010 was due to the net impact of the following activity:
· In connection with the Restructuring, we deferred approximately $16.0 million of costs related to the Commodity Supply Facility and the Fixed Rate Notes due 2014, including cash expenditures of approximately $7.0 million and the aggregate $9.0 million fair value of Class B Common Stock issued to RBS Sempra in a non-cash transaction as a condition to the entry into the ISDA Master Agreements. Amortization of these costs resulted in $3.7 million of incremental interest expense during fiscal year 2010.
· In connection with the Restructuring, approximately $158.8 million aggregate principal amount of Floating Rate Notes due 2011 was exchanged for cash, Fixed Rate Notes due 2014 and Class A Common Stock. As a result, we recorded incremental interest expense of $3.1 million during fiscal year 2010, which represents accelerated amortization equivalent to a pro rata portion of the original issue discount and deferred debt issue costs associated with the Floating Rate Notes due 2011 that were exchanged in connection with the Restructuring.
· During fiscal year 2009 and the first three months of fiscal year 2010, we negotiated several amendments to our Hedge Facility and our Revolving Credit Facility. Approximately $9.1 million of total fees associated with these amendments were deferred during fiscal year 2009 and the first three months of fiscal year 2010, which were amortized through the September 21, 2009 maturity date of the Revolving Credit Facility and Hedge Facility. Incremental interest expense associated with amortization of these costs was approximately $1.6 million for fiscal year 2010 versus $7.5 million for fiscal year 2009.
Fiscal Year Ended June 30, 2009 Versus 2008
Lower interest accrued on the Floating Rate Notes due 2011 was primarily due to a lower average interest rate, which decreased to 10.02% for fiscal year 2009 from 11.95% for fiscal year 2008. The average aggregate balance of Floating Rate Notes due 2011 outstanding also decreased to $165.2 million for fiscal year 2009, as compared to $172.4 million for fiscal year 2008, as a result of our purchases of Floating Rate Notes due 2011 during fiscal year 2008.
Higher interest and fees related to the Revolving Credit Facility were due to the following activity:
· higher interest and fees associated with outstanding obligations under the Revolving Credit Facility, partially due to an increase of approximately 20% in the average balance of cash advances and letters of credit outstanding, and partially due to generally higher letter of credit fees resulting from amendments to the agreement that governed the Revolving Credit Facility during fiscal year 2009; and
· the Bridge Financing Loans from certain shareholders and members of senior management, as required by amendments to the agreement that governed the Revolving Credit Facility, which resulted in approximately $2.7 million of incremental interest expense for fiscal year 2009.
During fiscal year 2009, we negotiated several amendments to our Hedge Facility and our Revolving Credit Facility. Approximately $8.7 million of fees associated with these amendments were deferred during fiscal year 2009 for amortization
over the remaining amended term of the facilities. Incremental interest expense of $7.5 million for fiscal year 2009 was a direct result of amortization of these deferred costs.
Lower interest income was a direct result of lower average cash and cash equivalents and restricted cash balances during fiscal year 2009 as well as a lower average interest rate earned during the year, as compared to the same period in fiscal year 2008.
Income Tax (Expense) Benefit
Fiscal Year Ended June 30, 2010 versus 2009
Our effective tax rate was a charge of 56.1% and a benefit of 21.4% for fiscal year 2010 and 2009, respectively. The higher effective tax rate for fiscal year 2010, as compared to fiscal year 2009, was primarily due to recognition of an additional valuation allowance for deferred income tax assets at June 30, 2010, which resulted from a change in the mix of deferred tax assets.
The significant components of the Company’s deferred tax assets and liabilities are summarized in the following table.
|
|
|
Balance at June 30, |
|
||||
|
|
|
2010 |
|
2009 |
|
||
|
|
|
(in thousands) |
|
||||
|
Deferred tax assets: |
|
|
|
|
|
||
|
Depreciation and amortization |
|
$ |
18,751 |
|
$ |
18,982 |
|
|
Net unrealized losses from risk management activities |
|
3,197 |
|
18,693 |
|
||
|
Allowance for doubtful accounts |
|
1,992 |
|
2,860 |
|
||
|
Tax loss carryforwards |
|
3,652 |
|
2,724 |
|
||
|
Accrued bonuses |
|
1,540 |
|
1,707 |
|
||
|
Stock compensation expense |
|
901 |
|
1,642 |
|
||
|
Novation of interest rate swaps |
|
2,996 |
|
— |
|
||
|
Other reserves |
|
133 |
|
165 |
|
||
|
Valuation allowance |
|
(28,123 |
) |
(22,664 |
) |
||
|
Total deferred tax assets |
|
5,039 |
|
24,109 |
|
||
|
Deferred tax liabilities: |
|
|
|
|
|
||
|
State tax liability |
|
32 |
|
— |
|
||
|
Total deferred tax liabilities |
|
32 |
|
— |
|
||
|
Net deferred tax asset |
|
$ |
5,007 |
|
$ |
24,109 |
|
|
|
|
|
|
|
|
||
|
Balance sheet classification: |
|
|
|
|
|
||
|
Current deferred tax asset |
|
$ |
1,378 |
|
$ |
9,020 |
|
|
Long-term deferred tax asset |
|
3,629 |
|
15,089 |
|
||
|
Current deferred tax liability |
|
— |
|
— |
|
||
|
Net deferred tax asset |
|
$ |
5,007 |
|
$ |
24,109 |
|
Deferred income taxes reflect the net tax effects of temporary differences between the carrying amount of assets and liabilities for financial reporting purposes and the amounts used for income tax purposes. Our policy is to establish a valuation allowance if it is “more likely than not” that the related tax benefits will not be realized.
We have deferred tax assets related to unrealized losses from risk management activities. We anticipate that these deferred tax assets will be realized in future periods when sales of fixed price commodities, to which the unrealized losses from risk management activities relate, occur. Therefore, we did not establish a valuation allowance for these deferred tax assets.
For the remaining deferred tax assets, we determined based on available evidence, including historical financial results for the last three years, that it is “more likely than not” that a portion of these items may not be recoverable in the future. We increased the valuation allowance associated with our U.S. operations by $5.5 million, due to a change in the mix of related deferred tax assets, resulting in a charge to tax expense for fiscal year 2010.
Fiscal Year Ended June 30, 2009 Versus 2008
Our effective tax rate was a tax benefit of 21.4% and tax expense of 40.9% for fiscal years 2009 and 2008, respectively. The change in the effective tax rate was primarily due to the impact of a valuation allowance recorded at June 30, 2009 against deferred tax assets, as described below, and changes in the mix and amounts of permanent differences and to a lower state statutory tax rate as a result of income apportionment for the states in which we do business.
The significant components of the Company’s deferred tax assets and liabilities are summarized in the following table.
|
|
|
Balance at June 30, |
|
||||
|
|
|
2009 |
|
2008 |
|
||
|
|
|
(in thousands) |
|
||||
|
Deferred tax assets: |
|
|
|
|
|
||
|
Depreciation and amortization |
|
$ |
18,982 |
|
$ |
12,877 |
|
|
Net unrealized losses from risk management activities |
|
18,693 |
|
— |
|
||
|
Allowance for doubtful accounts |
|
2,860 |
|
2,035 |
|
||
|
Tax loss carryforwards |
|
2,724 |
|
— |
|
||
|
Accrued bonuses |
|
1,707 |
|
1,090 |
|
||
|
Stock compensation expense |
|
1,642 |
|
1,664 |
|
||
|
Other reserves |
|
165 |
|
122 |
|
||
|
Valuation allowance |
|
(22,664 |
) |
— |
|
||
|
Total deferred tax assets |
|
24,109 |
|
17,788 |
|
||
|
Deferred tax liabilities: |
|
|
|
|
|
||
|
Net unrealized gains from risk management activities |
|
— |
|
(17,085 |
) |
||
|
Total deferred tax liabilities |
|
— |
|
(17,085 |
) |
||
|
Net deferred tax asset |
|
$ |
24,109 |
|
$ |
703 |
|
|
|
|
|
|
|
|
||
|
Balance sheet classification: |
|
|
|
|
|
||
|
Current deferred tax asset |
|
$ |
9,020 |
|
$ |
— |
|
|
Long-term deferred tax asset |
|
15,089 |
|
10,503 |
|
||
|
Current deferred tax liability |
|
— |
|
(9,800 |
) |
||
|
Net deferred tax asset |
|
$ |
24,109 |
|
$ |
703 |
|
Deferred income taxes reflect the net tax effects of temporary differences between the carrying amount of assets and liabilities for financial reporting purposes and the amounts used for income tax purposes. Our policy is to establish a valuation allowance if it is “more likely than not” that the related tax benefits will not be realized.
We have deferred tax assets related to unrealized losses from risk management activities. We anticipate that these deferred tax assets will be realized in future periods when sales of fixed price commodities, to which the unrealized losses from risk management activities relate, occur. Therefore, we did not establish a valuation allowance for these deferred tax assets. For the remaining deferred tax assets reflected in the table above, we determined based on available evidence including historical financial results for the last three years, that it is “more likely than not” that a portion of these items may not be recoverable in the future.
Liquidity and Capital Resources
Our principal sources of liquidity for our ongoing operations are cash collected from sales of natural gas and electricity to customers and borrowings under our credit facilities. Our primary liquidity requirements arise primarily from our seasonal working capital needs, including purchases of natural gas inventories, collateral requirements related to supplier, LDC, transportation and storage arrangements, acquisition of customers and debt service obligations. Because we sell natural gas and electricity, we are subject to material variations in short-term indebtedness under our credit facilities on a seasonal basis, due to the timing and price of commodity purchases to meet customer demands.
Through September 21, 2009, we relied on the following credit and commodity hedging arrangements to provide the liquidity necessary for operation of our natural gas and electricity businesses:
· The Revolving Credit Facility was used primarily to post letters of credit required to effectively operate within the markets that we serve;
· The Hedge Facility was used as our primary facility to economically hedge variability in the cost of natural gas; and
· Commodity derivative arrangements with various counterparties were used to economically hedge variability in the cost of electricity.
A sharp drop in natural gas market prices during the six months ended December 31, 2008 resulted in a significant reduction in the natural gas inventory component of the available borrowing base under the Revolving Credit Facility. The reduced borrowing base strained our ability to post letters of credit as collateral with suppliers and hedge providers, caused defaults of certain financial covenants included in the agreement that governed the Revolving Credit Facility, prompted downgrades in our credit ratings and ultimately resulted in our seeking and obtaining material waivers of debt covenants and defaults and amendments to the agreement that governed the Revolving Credit Facility and the Hedge Facility. Such amendments had significant impacts on our liquidity position and on our operations during fiscal year 2009 and during the first quarter of fiscal year 2010.
As a result of the Restructuring, we significantly decreased our outstanding debt obligations and debt service requirements for fiscal years 2010 and future years. In addition, the Revolving Credit Facility and Hedge Facility were replaced by the Commodity Supply Facility, which provides us with a stable source of liquidity through August 2012 with an investment grade counterparty. Overall, the transactions consummated in the Restructuring improved our liquidity position, improved our financial and operational flexibility and allowed us to compete more effectively within the markets that we serve.
The Commodity Supply Facility provides for cash borrowings of up to $45.0 million that we may access to finance seasonal working capital requirements, provided that we are in compliance with the Collateral Coverage Ratio requirement, as described below. These cash borrowings will accrue interest at the greater of: (1) RBS Sempra’s cost of funds plus 5%; or (2) LIBOR plus 5%. Outstanding credit support (e.g., letters of credit and/or guarantees) provided by RBS Sempra will accrue interest at LIBOR plus 3%, with a minimum rate of 4% except that, if the cash held in certain collateral accounts exceeds all outstanding settlement payments under the Commodity Supply Facility by $27.0 million, interest will accrue at a reduced rate of 1% on the amount of outstanding credit support in excess of $27.0 million.
In accordance with the terms of the ISDA Master Agreements, we are required to maintain a minimum collateral coverage ratio (the “Collateral Coverage Ratio”) of 1.25:1.00 for the months of October through March (inclusive) and 1.40:1.00 for any other calendar month. The Collateral Coverage Ratio is calculated as the ratio of: (1) certain of our assets, primarily cash, amounts due from RBS Sempra representing our operating cash, accounts receivable from our customers and LDCs and natural gas inventories; to (2) certain of our liabilities, primarily arising from exposure and/or amounts due to RBS Sempra as a result of our agreements (including amounts due for the purchase of natural gas and electricity, accrued but unpaid financing fees and settlements arising from derivative contracts).
As of June 30, 2010, we had a Collateral Coverage Ratio of approximately 3.41:1.00. The calculation of the Collateral Coverage Ratio as of June 30, 2010 reflected available liquidity under the Commodity Supply Facility of approximately $62.3 million. At June 30, 2010, we had no outstanding cash advances and had $34.0 million of letters of credit outstanding under the Commodity Supply Facility.
Cash Flow
During fiscal year 2010, our cash and cash equivalents decreased $17.0 million to a balance of $6.2 million at the end of the period. Approximately $36.0 million of cash was provided by operating activities during the period, which reflects an $88.8 million change from the $52.8 million used in operations for fiscal year 2009.
In connection with the Commodity Supply Facility, certain banking relationships that previously belonged to the Company are now under RBS Sempra’s name and control. RBS Sempra releases cash to us as required to meet our ongoing operating cash requirements. The ISDA Master Agreements also include provisions that allow for net settlement of amounts from and due to RBS Sempra. Accordingly, we report amounts due from and due to RBS Sempra net on the consolidated balance sheets. At June 30, 2010, the net $43.1 million amount due from RBS Sempra, which is reported as accounts receivable, net — RBS Sempra on the consolidated balance sheets, represents net cash available to us for working capital needs during future months.
During fiscal year 2009, in connection with amendments to the Revolving Credit Facility, we deposited $75.0 million of our operating cash into a new cash account, which was restricted for use as collateral to provide security for letters of credit outstanding under the Revolving Credit Facility. In connection with the Restructuring, the restrictions on this account were removed, and the cash was returned to us and used for various Restructuring-related transactions.
Cash provided by operating activities during fiscal year 2010 also reflects the following net activity:
· Higher net income (after adjustment for non-cash operating items such as unrealized gains and losses from risk management activities, depreciation and amortization expense, deferred income tax expense, provision for doubtful accounts and stock compensation expense) resulting from higher gross profit (excluding unrealized gains and losses from risk management activities), lower non-cash operating expenses and lower non-cash interest expense; offset by
· Higher use of operating cash for working capital items, mostly as a result of various transactions and activity related to the Restructuring;
· $9.0 million was transferred from cash and cash equivalents to an escrow account (the “Fixed Rate Notes Escrow Account”), which is maintained as security for future interest payments to holders of the Fixed Rate Notes due 2014; and
· Higher use of operating cash for acquisition of customers.
The Restructuring also resulted in the following material uses of cash and cash equivalents for investing and financing activities:
· $26.7 million was paid to bondholders in partial exchange for their Floating Rate Notes due 2011;
· $12.0 million of principal outstanding under the Denham Credit Facility, plus accrued and unpaid interest, was repaid and the Denham Credit Facility was terminated;
· $6.4 million of legal, consulting and other fees directly related to various Restructuring transactions were paid and recorded as deferred debt issuance costs ($6.1 million) and stock issue costs recorded as a reduction of additional paid in capital ($0.3 million). The deferred debt issue costs will be amortized as an increase to interest expense over the remaining terms of the related agreements; and
· $5.4 million of principal outstanding under the Bridge Financing Loans, plus accrued and unpaid interest, were repaid and the Bridge Financing Loans were terminated.
Commodity Supply Facility
As a result of the Restructuring consummated on September 22, 2009, the Revolving Credit Facility, Hedge Facility and various arrangements for the supply of natural gas and electricity were replaced by the Commodity Supply Facility. Under the Commodity Supply Facility, the primary obligors are MXenergy Inc. and MXenergy Electric Inc. and all obligations are guaranteed by Holdings and its other domestic subsidiaries. Obligations under the Commodity Supply Facility are secured by a first priority lien on substantially all of Holdings’ and its domestic subsidiaries’ existing and future assets, other than an interest reserve account held on behalf of the holders of the Fixed Rate Notes due 2014. The maturity date of the Commodity Supply Facility is August 31, 2012. RBS Sempra will have the right to extend such maturity date by one year at its sole discretion, provided that such notice is provided by RBS Sempra no later than April 30, 2011.
The Commodity Supply Facility provides for the exclusive supply of physical (other than as needed for balancing) and financial natural gas and electricity, credit support (including letters of credit and guarantees) for certain collateral needs, payment extension financing and/or storage financing as needed, and associated hedging transactions in order to maintain the Company’s required matched trading book. In addition, the Commodity Supply Facility provides that we release natural gas transportation and storage capacity to RBS Sempra and for RBS Sempra to perform certain natural gas and electricity nominations. The Commodity Supply Facility also will provide for RBS Sempra to act on the Company’s behalf to satisfy the requirements of regional transmission operators for capacity rights and ancillary services.
The Commodity Supply Facility is governed by separate ISDA Master Agreements for natural gas and electricity. During fiscal year 2010, we entered into amendments to the ISDA Master Agreements for natural gas and electricity, respectively, with the Company and certain of its subsidiaries, as guarantors, and RBS Sempra. The following changes to the ISDA Master Agreements resulted from these amendments:
· The definition of Adjusted Consolidated Tangible Net Worth in the ISDA Master Agreements was amended to exclude non-cash charges associated with any deferred tax valuation allowances;
· The date by which we were required to release or arrange for the release of all of our pipeline transportation and storage capacity on interstate and inter provincial pipelines directly to RBS Sempra was extended to April 1, 2010 from December 31, 2009;
· Certain fees related to natural gas supply and hedging activity specifically related to the SSO program were revised; and
· Natural gas purchased by us from RBS Sempra as a result of our participation in the SSO Program was specifically excluded from certain volume limitations and/or minimum purchase requirements under the ISDA Master Agreements.
As of June 30, 2010, we were in compliance with all provisions of the ISDA Master Agreements.
Under the supply terms of the Commodity Supply Facility, the Company has the ability to: (1) seek commodity price quotes from third parties for certain physically or financially settled transactions with respect to gas and electricity; and (2) request that RBS Sempra enter into such transactions with such third parties at such prices and to concurrently enter into back-to-back off-setting transactions with the Company with respect to such third party transactions. RBS Sempra would not be obligated to enter into a transaction with any third party unless RBS Sempra is satisfied with such transaction and the volume of those transactions does not exceed annual limits. In addition to the actual purchase price paid by RBS Sempra and certain related costs and expenses, the Company will be charged a fee for such third-party purchases.
The Commodity Supply Facility also provides for certain volumetric fees for all natural gas and electricity purchases, as well as minimum purchase requirements for both natural gas and electricity over the initial three-year term and over the optional one-year extension term.
Under the hedging terms of the Commodity Supply Facility, the aggregate notional exposure amount of fixed price hedges allowed to be entered into by the Company will be limited to $260.0 million, without adjustment for mark-to-market movements thereafter. Fixed price hedges will be limited to a contract length term of 24 months. In addition, the fixed price
portfolio of hedges will be limited to a weighted-average volumetric tenor not to exceed 14 months in duration. With regards to the Company’s fixed price customer mix, the Company may not, during any 12 month period, enter into any new fixed price contracts with respect to the gas business where the residential customer equivalents of such contracts are greater than 75% of all residential customer equivalents of all new contracts entered into during such period and/or maintain a customer portfolio with more than 325,000 residential customer equivalents operating under fixed price contracts.
The maximum amount of cash borrowings permitted under the storage and/or payment extension financing provisions of the Commodity Supply Facility will be $45.0 million. These cash borrowings will accrue interest at the greater of: (1) RBS Sempra’s cost of funds plus 5%; or (2) LIBOR plus 5%. Outstanding credit support (e.g., letters of credit and/or guarantees) provided by RBS Sempra will accrue interest at the greater of 4% or LIBOR plus 3%, provided however, that, if on any date of determination, no termination event has occurred with respect to Holdings and its affiliates and the cash held in certain collateral accounts exceeds all outstanding settlement payments under the Commodity Supply Facility, interest will accrue at a reduced rate of 1.0% on that portion of the credit support amount that is in excess of $27.0 million.
In connection with the aggregate exposure outstanding under the Commodity Supply Facility, the Company must maintain a Collateral Coverage Ratio greater than 1.25:1.0 during the months of October through March, and greater then 1.4:1.0 during the months of April through September. In addition, the Company must maintain a consolidated tangible net worth, as defined in the agreement that governs the Commodity Supply Facility, of at least $60.0 million.
The ISDA Master Agreements contain customary covenants that restrict certain activities including, among other things, the Company’s ability to:
· incur additional indebtedness;
· create or incur liens;
· guarantee obligations of other parties;
· engage in mergers, consolidations, liquidations and dissolutions;
· create subsidiaries;
· make acquisitions;
· engage in certain asset sales;
· enter into leases or sale-leasebacks;
· make equity distributions;
· make capital expenditures;
· make loans and investments;
· make certain dividend, debt and other restricted payments;
· engage in a different line of business;
· amend, modify or terminate certain material agreements in a manner that is adverse to the lenders; and
· engage in certain transactions with affiliates.
The Commodity Supply Facility also contains customary events of default, including:
· payment defaults;
· breaches of representations and warranties;
· covenant defaults;
· cross defaults to certain other indebtedness in excess of specified amounts;
· certain events of bankruptcy and insolvency;
· ERISA defaults;
· judgments in excess of specified amounts;
· failure of any guaranty or security document supporting the Commodity Supply Facility to be in full force and effect;
· the termination or cancellation of any material contract which termination or cancellation could reasonably be expected to have a material adverse effect on us; or
· a change of control.
Fixed Rate Notes due 2014
Pursuant to the Restructuring consummated on September 22, 2009, the Company issued $67.8 million aggregate principal amount of Fixed Rate Notes due 2014. Interest on the Fixed Rate Notes due 2014 accrues at the rate of 13.25% per annum and is payable semi-annually in cash on February 1 and August 1 of each year, commencing on February 1, 2010, to the holders of record of the Fixed Rate Notes due 2014 on the immediately preceding January 15 and July 15. The Fixed Rate Notes due 2014 will mature on August 1, 2014. The Fixed Rate Notes due 2014 were issued at a discount of $17.8 million, which was recorded as a reduction from the Fixed Rate Notes due 2014 on our consolidated balance sheets during the first
quarter of fiscal year 2010, and which will be amortized as an increase to interest expense over the remaining life of the Fixed Rate Notes due 2014.
On December 30, 2009, we entered into a purchase agreement (the “Stock and Notes Purchase Agreement”) pursuant to which a holder of our Class A Common Stock and Fixed Rate Notes due 2014 (the “Seller”) agreed to sell its holdings to us. Pursuant to the Stock and Notes Purchase Agreement, on January 4, 2010, we acquired approximately $0.5 million aggregate principal amount of Fixed Rate Notes due 2014 from the Seller for approximately $0.3 million. The resulting gain on extinguishment of debt of $0.2 million was recorded as a reduction of interest expense during fiscal year 2010. A pro rata portion of deferred debt issue costs and original debt issue discount associated with the Fixed Rate Notes due 2014 acquired, which approximated an aggregate amount of $0.1 million, was also recorded as additional interest expense during fiscal year 2010.
The Fixed Rate Notes due 2014 are senior subordinated secured obligations of the Company, subordinated in right of payment to obligations of the Company under the Commodity Supply Facility. The Fixed Rate Notes due 2014 are senior in priority to the Company’s unsecured senior obligations, including the Floating Rate Notes due 2011, to the extent of the value of the assets securing the Fixed Rate Notes due 2014 in excess of the aggregate amount of the outstanding Commodity Supply Facility obligations.
The Fixed Rate Notes due 2014 are jointly, severally, fully and unconditionally guaranteed by all domestic subsidiaries of Holdings.
The Fixed Rate Notes due 2014 are secured by a first priority interest in the Fixed Rate Notes Escrow Account and by a second-priority security interest in substantially all other existing and future assets of the Company. The Fixed Rate Notes Escrow Account was funded with approximately $9.0 million in September 2009, which represents the approximate interest payable on the Fixed Rate Notes due 2014 for a twelve-month period.
Floating Rate Notes due 2011
On August 4, 2006, we issued $190.0 million aggregate principal amount of Floating Rate Notes due 2011, which mature on August 1, 2011 and bear interest at a rate equal to LIBOR plus 7.5% per annum. During fiscal years 2008 and 2007, we purchased $12.8 million and $12.0 million, respectively, of aggregate principal amount of Floating Rate Notes due 2011, plus accrued interest, from noteholders for amounts less than face value. As of June 30, 2009, we had $165.2 million aggregate principal amount of Floating Rate Notes due 2011 outstanding.
As a result of the Restructuring, we exchanged $158.8 million aggregate principal amount of Floating Rate Notes due 2011 for $26.7 million of cash, $67.8 million aggregate principal amount of Fixed Rate Notes due 2014 and 33,940,683 shares of newly authorized Class A Common Stock. Holders of $6.4 million aggregate principal amount of Floating Rate Notes due 2011 did not tender their notes pursuant to the Restructuring. These Floating Rate Notes due 2011 will remain on our consolidated balance sheets until their maturity date in August 2011 unless acquired or retired by us at an earlier date. The indenture governing the Floating Rate Notes due 2011 was amended to eliminate substantially all of the restrictive covenants and certain events of default from such indenture.
The weighted-average interest rate for the Floating Rate Notes due 2011 was 8.26% and 10.02% for fiscal years 2010 and 2009, respectively. We have entered into interest rate swap agreements to hedge the floating rate interest expense on the Floating Rate Notes due 2011. Refer to Item 7A of this Annual Report for additional commentary regarding our management of interest rate risk and the interest rate swaps.
Summary of Contractual Obligations
The following table discloses aggregate information about our contractual obligations and commercial commitments as of June 30, 2010:
|
|
|
Contractual Obligation Amounts Maturing In |
|
|||||||||||||
|
|
|
Less Than |
|
1-3 Years |
|
4-5 Years |
|
Thereafter |
|
Total |
|
|||||
|
|
|
(in thousands) |
|
|||||||||||||
|
|
|
|
|
|
|
|
|
|
|
|
|
|||||
|
Fixed Rate Notes due 2014 (1) |
|
$ |
— |
|
$ |
— |
|
$ |
67,293 |
|
$ |
— |
|
$ |
67,293 |
|
|
Floating Rate Notes due 2011 (2) |
|
— |
|
6,413 |
|
— |
|
— |
|
6,413 |
|
|||||
|
Operating leases (3) |
|
590 |
|
916 |
|
472 |
|
605 |
|
2,583 |
|
|||||
|
Capacity charge commitments (4) |
|
7,068 |
|
— |
|
— |
|
— |
|
7,068 |
|
|||||
|
Natural gas physical purchase commitments (5) |
|
38,392 |
|
— |
|
— |
|
— |
|
38,392 |
|
|||||
|
Electricity physical purchase commitments (5) |
|
7,319 |
|
382 |
|
— |
|
— |
|
7,701 |
|
|||||
|
Total |
|
$ |
53,369 |
|
$ |
7,711 |
|
$ |
67,765 |
|
$ |
605 |
|
$ |
129,450 |
|
(1) Includes the aggregate principal amount under the Fixed Rate Notes due 2014. Excludes related unamortized discount of $14.9 million as of June 30, 2010.
(2) Includes the aggregate principal amount under the Floating Rate Notes due 2011. Excludes related unamortized discount of less than $0.1 million as of June 30, 2010.
(3) Includes amounts anticipated to be paid for leased office space under non-cancelable operating leases, which contain escalation clauses, have terms that expire between July 2010 and October 2017 and are subject to extension at the option of the Company. We take into account all escalation clauses when determining the amount of future minimum lease payments. All future minimum lease payments are recognized on a straight-line basis over the minimum lease term.
(4) Includes anticipated fees associated with agreements to transport and store natural gas. These agreements are take-or-pay in that we must pay for the capacity committed even if we do not use the capacity.
(5) Includes both fixed and variable portions of physical forward contracts. The variable portion is indexed as the NYMEX settle price for the corresponding delivery month in which the natural gas is purchased. The estimated contractual obligations are based on the NYMEX forward curve as of June 30, 2010 for all corresponding delivery months.
At June 30, 2010, $34.0 million of letters of credit were outstanding under the Commodity Supply Facility, which were posted as collateral under various transportation and storage agreements. As of June 30, 2010, all outstanding letters of credit were scheduled to mature during fiscal 2011. New letters of credit are expected to be issued as necessary to meet collateral requirements during fiscal year 2011.
Under the Commodity Supply Facility, we are obligated to purchase a minimum of 130,000,000 MMBtus of natural gas from RBS Sempra, for physical delivery in accordance with the following schedule: (1) 39,000,000 MMBtus during the first contract year; (2) 44,000,000 MMBtus during the second contract year; and (3) 47,000,000 MMBtus during the third contract year. In addition, we are obligated to purchase a minimum of 1,850,000 MWhrs of electricity from RBS Sempra, for physical delivery in accordance with the following schedule: (1) 500,000 MWhrs during the first contract year; (2) 650,000 MWhrs during the second contract year; and (3) 700,000 MWhrs during the third contract year. The estimated total value of these purchases will depend upon the market price of natural gas at the time of purchase. During fiscal year 2010, our average price paid for natural gas ranged from a high of approximately $6.40 per MMBtu in January 2010 to a low of approximately $2.80 per MMBtu in September 2009, and our average price paid for electricity ranged from a high of approximately $82.60 per MWhr in January 2010 to a low of approximately $64.60 per MWhr in March 2010.
The Company will be obligated to pay a volumetric fee for any unused balance of the minimum volume purchase requirement for any contract year, or if the agreement is terminated prior to the end of the contract. As of June 30, 2010, commodity that we expect to purchase for delivery to our customers during the first and second contract years of the Commodity Supply Facility is expected to exceed the minimum purchase obligation for natural gas and electricity. The excess of actual commodity purchases from RBS Sempra over the minimum purchase requirement for any contract year, if any, will be deducted from the minimum purchase requirement for the subsequent contract year.
Off-Balance Sheet Arrangements
We did not have any off-balance sheet arrangements as of June 30, 2010 or 2009.
Critical Accounting Policies
The preceding discussion and analysis of our financial condition and results of operating results are based on our consolidated financial statements, which have been prepared in conformity with U.S. GAAP. The significant accounting policies used in the preparation of our consolidated financial statements are more fully described in the consolidated financial statements included in Item 8 of this Annual Report.
Many of our significant accounting policies require complex judgments to estimate values of assets and liabilities. In making these judgments, management must make certain estimates and assumptions that affect the reported amounts of assets, liabilities, revenues and expenses. Because changes in such estimates and assumptions could significantly affect our reported financial position and results of operations, detailed policies and control procedures have been established to ensure that
valuation methods, including judgments made as part of such methods, are well controlled, independently reviewed, and are applied consistently from period to period.
On an on-going basis, we evaluate our estimates, which are based on historical experience, weather data, terms of existing customer contracts, and various other assumptions that we believe to be reasonable under the circumstances. Our actual results may differ from these estimates and assumptions.
Of the significant policies used to prepare our consolidated financial statements, the items discussed below require critical accounting estimates involving a high degree of judgment and complexity. For all of these critical policies, we caution that future events rarely develop exactly as forecasted, and the best estimates routinely require adjustment. This information should be read in conjunction with our consolidated financial statements included herein.
Revenue Recognition
We recognize revenue from the sale of natural gas and electricity in the period in which customers consume the commodity. Our customers are billed monthly on various dates throughout the month. We accrue revenues for natural gas and electricity consumed by customers, but not yet billed, under the cycle billing method. Total unbilled revenue was $17.4 million and $16.3 million at June 30, 2010 and 2009, respectively.
Our estimates of unbilled revenues are determined by considering the following factors:
· estimates of commodity volume consumed by customers during a calendar month;
· the average sales price per unit for each respective market area and customer class;
· commodity volumes delivered to the LDC during the calendar month;
· timing of billings completed under the cycle billing method; and
· impact of previous unbilled accounts receivable accruals.
Unbilled revenue estimates are adjusted to actual billings in subsequent periods when the meters are read and any change in previous estimates is reflected in operations during the period that the change is determined. Unbilled revenue recognition is considered to be a critical accounting policy because estimates of commodity volumes consumed by customers are dependent upon various factors, including:
· Weather conditions and customer usage profiles have a direct impact on the consumption of natural gas and electricity by our customers. The projected impact of current weather conditions on customer usage profiles utilized in our estimates may differ from historical averages.
· Other factors, such as economic conditions in a market area, the prices charged to customers for natural gas and electricity consumed and natural or man-made disasters that can limit the availability of natural gas and electricity, can have a significant impact on customer consumption.
We can never be certain how retail energy customers will respond to weather conditions or other factors that are outside of our control. As a result, actual consumption may differ significantly from our estimates, which could result in significant adjustments to revenue in the month of “true-up.”
Allowance for Doubtful Accounts
We assume the credit risk associated with non-payment by our customers in markets where LDCs do not guarantee customer accounts receivable. In those markets, we record an allowance for doubtful accounts based on the age of accounts receivable, customer payment history, past loss experience and current market conditions. The allowance for doubtful accounts and provision for doubtful accounts are summarized in the following table.
|
|
|
Fiscal Year Ended June 30, |
|
|||||||
|
|
|
2010 |
|
2009 |
|
2008 |
|
|||
|
|
|
(in thousands) |
|
|||||||
|
|
|
|
|
|
|
|
|
|||
|
Non-guaranteed accounts receivable from customers at period-end |
|
$ |
28,754 |
|
$ |
37,226 |
|
$ |
52,871 |
|
|
|
|
|
|
|
|
|
|
|||
|
Allowance for doubtful accounts at period-end |
|
$ |
5,074 |
|
$ |
7,344 |
|
$ |
5,154 |
|
|
|
|
|
|
|
|
|
|
|||
|
Allowance for doubtful accounts as a percentage of non-guaranteed accounts receivable at period end |
|
17.6 |
% |
19.7 |
% |
9.7 |
% |
|||
|
|
|
|
|
|
|
|
|
|||
|
Provision for doubtful accounts for the period |
|
$ |
5,164 |
|
$ |
12,009 |
|
$ |
5,050 |
|
We recognize that there is a high degree of subjectivity and imprecision inherent in the process of estimating future credit losses that are based on historical trends and customer data. Critical factors that could impact the recorded level of allowances for doubtful accounts include:
· the concentration of our business in non-guaranteed markets, such as Georgia and Texas;
· economic conditions in our markets, which may deteriorate and impact the ability of our customers to pay their balances owed to us when due;
· the seasonality of our business; and
· our cost of commodity, which affects our pricing for commodity supplied to customers.
We are also subject to credit risk associated with the creditworthiness of LDCs that guarantee customer accounts receivable balances. Although all of the LDCs that guarantee our customer accounts receivable had investment grade credit ratings as of June 30, 2010, any detrimental change in the creditworthiness of these LDCs could affect their ability to pay us amounts when due, and may result in the need for higher allowances and provisions for doubtful accounts.
In addition, we may bear credit risk related to imbalance settlement receivables from LDCs and ISOs, to the extent that such LDCs and ISOs are unable to collect imbalance settlements payable to them by other retail marketers. We record an allowance for doubtful accounts during the month that full collection of any such imbalance receivable balance becomes doubtful. Therefore, the creditworthiness of other retail marketers, which is difficult to predict and monitor, may also impact our allowance and provision for doubtful accounts.
Goodwill
Goodwill of $3.8 million on our consolidated balance sheet represents the excess of purchase price over the fair value of identifiable net assets acquired from SESCo in August 2006. Goodwill has been assigned entirely to the natural gas business segment since the customers acquired from SESCo were natural gas accounts.
Goodwill is not amortized, but is reviewed for impairment annually at June 30 or more frequently if events, transactions or changes in circumstances indicate that the carrying amount may not be recoverable. We utilize a combination of methods to estimate the fair value of our natural gas reporting unit, including a discounted cash flows methodology for near-term estimable earnings and a discounted multiple of earnings methodology to estimate a terminal value. Critical assumptions used for the fair value model include:
· earnings forecasts for the natural gas business segment, which reflect assumptions for growth in natural gas RCEs (net of attrition), expected gross profit and expense trends;
· a terminal value multiple; and
· the discount rate used to calculate the present value of future cash flows.
Our impairment testing of goodwill is considered to be a critical accounting estimate due to the significant judgment required for certain assumptions utilized in the models to determine fair value. Assumptions used involve a high degree of subjectivity that is based on historical experience and internal forecasts of future results. Actual results in future periods may not necessarily approximate historical experience or forecasts.
We completed our annual goodwill impairment test as of June 30, 2010, and concluded that the goodwill assigned to the natural gas business segment was not at risk for impairment as of that date. As of June 30, 2010, the estimated fair value of the natural gas business segment was more than double its carrying value.
Customer Acquisition Costs, net
The Company capitalizes costs associated with the acquisition of customers to the extent that they are incremental direct costs and that such costs can be recovered from the future economic benefit resulting from the customer relationship. The Company acquires customers as a result of the following activities:
· bulk acquisitions and business combinations;
· payments to third-party contractors for success-based marketing activities;
· payments to third-party contractors for hourly paid direct-response telemarketing activities.
Financial information regarding our customer acquisition costs is summarized in the following table.
|
|
|
Fiscal Year Ended June 30, |
|
|||||||
|
|
|
2010 |
|
2009 |
|
2008 |
|
|||
|
|
|
(in thousands) |
|
|||||||
|
|
|
|
|
|
|
|
|
|||
|
Total customer acquisition costs, net of accumulated amortization, at period-end |
|
$ |
30,425 |
|
$ |
27,950 |
|
$ |
41,693 |
|
|
|
|
|
|
|
|
|
|
|||
|
Customer acquisition costs capitalized during the period (1) |
|
$ |
22,289 |
|
$ |
16,034 |
|
$ |
19,555 |
|
|
|
|
|
|
|
|
|
|
|||
|
Amortization of customer acquisition costs during the period |
|
$ |
19,814 |
|
$ |
29,777 |
|
$ |
23,414 |
|
Customer acquisition costs are capitalized and amortized over the estimated life of a customer, which we generally estimate to be three years. Customer acquisition costs that are subject to amortization are reviewed for recoverability quarterly, or whenever events or changes in circumstances indicate that the carrying amount may not be recoverable.
Our model used to assess the estimated recoverability of customer acquisition costs includes estimates of the future cash flows expected to result from the use of the customer assets and their eventual disposition. The estimated fair value resulting from this model is compared with the carrying amount of the asset. If impairment were to be identified, it could result in additional expense recorded in our consolidated statement of operations. Estimation of future cash flows includes consideration of specific assumptions for customer attrition, per unit gross profit, and operating costs. The estimate of future cash flows is considered to be a critical estimate because the assumptions used involve a high degree of subjectivity and are based on historical experience and internal forecasts of future results. Actual results in future periods may not necessarily approximate historical experience or forecasts. As of June 30, 2010, the estimated future cash flows from our customer relationships significantly exceeded the carrying value of customer acquisition costs. Management believes that the carrying value of customer acquisition costs is not at risk of impairment as of June 30, 2010.
The average three-year life of a customer is also considered to be a critical assumption because it is an estimate of the expected period over which an average customer will provide us with cash flows. If competitive market conditions were to deteriorate for us, customer attrition could increase, which could result in a lower average life of a customer.
As a result of all quarterly reviews conducted for the fiscal year ended June 30, 2009, we have concluded that there was no impairment to the carrying value of customer acquisition costs recorded on our consolidated balance sheets.
Income Taxes
We operate within multiple tax jurisdictions. The calculations of income tax expense or benefit and related balance sheet amounts involve a high degree of management judgment regarding estimates of the timing and probability of recognition of revenue and deductions. The interpretation of tax laws involves uncertainty, since tax authorities may interpret laws differently than we do. We are subject to audit in all of our tax jurisdictions, which may involve complex issues and may require an extended period of time to resolve. Ultimate resolution of tax matters may result in favorable or unfavorable impacts to our net income and/or cash flows. In management’s opinion, adequate reserves have been recorded for any future taxes that may be owed as a result of examination by any taxing authority.
Deferred income taxes reflect the net tax effects of temporary differences between the carrying amount of assets and liabilities for financial reporting purposes and the amounts used for income tax purposes using enacted tax rates expected to be in effect for the year in which the temporary differences are expected to reverse.
Total combined current and long-term deferred income tax assets were $33.2 million and $46.8 million at June 30, 2010 and 2009, respectively. Our policy is to establish a valuation allowance if it is “more likely than not” that the related tax benefits will not be realized. At June 30, 2010, we determined that it was “more likely than not” that a portion of our deferred tax assets would not be realized.
As of June 30, 2010 and 2009, we had $3.2 million and $18.7 million, respectively, of deferred tax assets related to unrealized losses from risk management activities. We anticipate that these deferred tax assets will be realized in future periods when sales of related fixed price commodities occur. Therefore, we did not establish a valuation allowance for these deferred tax assets at June 30, 2010.
For our remaining deferred tax assets, which totaled $30.0 million and $28.1 million at June 30, 2010 and 2009, respectively, we determined based on available evidence, including historical financial results for the last three years, that it is “more likely than not” that a portion of these items may not be recoverable in the future. Accordingly, at June 30, 2010 and 2009, we
recorded total valuation allowances of approximately $28.1 million and $22.7 million, respectively, as a reduction of deferred tax assets. The valuation allowance represented 94% and 81% of related deferred tax assets as of June 30, 2010 and 2009, respectively.
The valuation allowance related to deferred tax assets is considered to be a critical estimate because, in assessing the likelihood of realization of deferred tax assets, management considers taxable income trends and forecasts. Actual income taxes expensed and/or paid could vary from estimated amounts due to the impacts of various factors, including:
· changes to tax laws by taxing authorities;
· final review of filed tax returns by taxing authorities; and
· actual financial condition and results of operations for future periods that could differ from forecasted amounts.
Derivatives
We utilize both physical commodity contracts and financial derivative instruments to reduce our exposure to fluctuations in the price of natural gas and electricity. Settlements of derivative instruments are recognized on a monthly basis, generally based upon the difference between the contract price and the settlement price as quoted on NYMEX, relevant ISO or other published sources. Derivative instruments are carried on the balance sheet at fair value. Any changes in fair value are adjusted through unrealized losses (gains) from risk management activities in the consolidated statements of operations. This accounting results in significant volatility in earnings due to the impact market prices have on the market positions and derivative instruments that we have entered into.
Where available, we use quoted market prices to determine fair value. If quoted market prices are not available, management seeks price information from external sources, including broker quotes and industry publications. When evaluating pricing information provided by brokers and other pricing services, we consider whether the broker is willing and able to enter into transaction at the quoted price, whether the quotes are based on an active market, or, if the quotes are based on an inactive market, the extent to which brokers are utilizing a particular model if pricing is not available.
If pricing information from external sources is not available, or if we believe that observable pricing information is not indicative of fair value, management judgment is required to develop estimates of fair value. In these cases, fair value is determined using internally developed valuation models based on inputs that are either directly observable or derived from and corroborated by market data. These unobservable inputs incorporate market participants’ assumptions about risks in the asset or liability and the risk premium required by market participants in order to bear the risks. Our assets and liabilities that are reported at fair value are measured based on quoted market prices and observable market-based or independently-sourced inputs.
We generally utilize a market approach for our recurring fair value measurements. In forming our fair value estimates, we maximize the use of observable inputs for the respective valuation model. For reporting purposes we classify our fair value measurements according to the hierarchy summarized in Note 15 of the consolidated financial statements located in Item 8 of this Annual Report. If a fair value measurement reflects inputs from different levels within the fair value hierarchy, the measurement is classified based on the lowest level of input that is significant to the fair value measurement. The key inputs and assumptions utilized for the fair value measurements recorded by the Company are summarized as follows:
Financial natural gas derivative contracts — NYMEX-referenced swaps are valued utilizing unadjusted market commodity quotes from a pricing service, which are considered to be quotes from an active market, but are deemed to be Level 2 inputs because the swaps are not an identical instrument to the NYMEX-referenced commodity. Basis swaps and options are generally valued using observable broker quotes. Other inputs and assumptions include contract position volume, price volatility, commodity delivery location, credit quality of the Company and of derivative counterparties, credit enhancements, if any, and time value.
Financial electricity derivative contracts — Electricity swaps are valued utilizing market commodity quotes from a pricing service, which are deemed to be observable inputs. Other inputs and assumptions include contract position volume, price volatility, commodity delivery location, credit quality of the Company and of derivative counterparties, credit enhancements, if any, and time value.
Physical forward natural gas and electricity derivative contracts — The Company utilizes market commodity quotes from a pricing service to value these instruments, which are deemed to be observable inputs. Other inputs and assumptions include contract position volume, commodity delivery location, credit quality of the Company and of derivative counterparties, credit enhancements, if any, and time value.
Interest rate swaps — Interest rate swaps are valued utilizing quotes received directly from swap counterparties. Key inputs and assumptions include interest rate curves, credit quality of the Company and of derivative counterparties, credit
enhancements, if any, and time value.
The assumptions used for these pricing models are considered to be critical estimates due to the high level of management judgment utilized in their development. In particular, imprecision in estimating unobservable market inputs can impact the amount of unrealized gains or losses from risk management activities recorded on our consolidated balance sheets and our consolidated statements of operations for a particular financial instrument. Furthermore, while we believe our valuation methods are appropriate, the use of different methodologies or assumptions to determine the fair value of certain financial assets and liabilities could result in a different estimate of fair value at the reporting date.
We have implemented risk management controls and limits to monitor our risk position related to derivatives, including a VAR analysis to assess potential losses in the fair value of our natural gas portfolio and to ensure that hedging performance is in line with agreed-upon objectives. Refer to Item 7A of this Annual Report for additional information.
Common Stock Valuation
Prior to the Restructuring, we utilized an internal stock valuation model to calculate appropriate values for redeemable preferred stock, stock options and warrants granted under our stock-based compensation plans and common stock issued directly to our executive officers and third parties. In connection with the Restructuring, we utilized our stock valuation model to assign value to all classes of common stock issued to holders of our debt, RBS Sempra, former holders of our redeemable preferred stock and holders of our common stock outstanding prior to the Restructuring. Subsequent to the Restructuring, we utilized our stock valuation model to calculate an appropriate value for RSUs granted to our directors, a former director and certain of our senior executives.
As our common stock is not publicly traded, there is no readily-available market source of information to estimate its fair value. Therefore, we utilize an internal stock valuation model in order to calculate the grant-date fair value for stock-based compensation awards. At a minimum, we complete the stock valuation model on a quarterly basis, as of September 30th, December 31st, March 31st and June 30th of each fiscal year. For the June 30th model, we contract with an independent valuation company to calculate a fair value at that date. For the remaining quarter-end valuation dates, we utilize an internal valuation model that closely resembles the methodology utilized by the independent valuation company as of the previous June 30th valuation date. The grant date stock value assigned to stock compensation awards is generally determined from our most recently completed quarter-end valuation model, unless any matters arose during the time between the most recent quarter-end model and the grant date that would have had a material impact on the stock valuation.
Key estimates and assumptions used in our stock valuation models include:
· revenue and expense forecasts and assumed earnings multiples based on comparable companies; and
· a discount rate applied to the future cash flows assumed to result from future earnings.
The assumptions utilized in the stock valuation model require significant management judgment. Revenue and expense forecasts include assumptions that involve a high degree of subjectivity and are based on historical experience and internal forecasts of future results. There can be no assurance that actual future earnings will approximate these estimates.
New Accounting Pronouncements Adopted During the Fiscal Year Ended June 30, 2010
In June 2009, the Financial Accounting Standards Board (the “FASB”) issued Statement of Financial Accounting Standards No. 168, “The FASB Accounting Standards Codification and the Hierarchy of Generally Accepted Accounting Principles — a replacement of FASB Statement No. 162” (“SFAS No. 168”). Effective for financial statements issued for interim and annual periods ending after September 15, 2009, the Accounting Standards Codification (the “ASC”) supersedes all existing accounting and reporting standards, excluding those issued by the SEC, and is now the single source of authoritative U.S. GAAP for entities that are not SEC registrants. Rules and interpretative releases of the SEC are also sources of U.S. GAAP for SEC registrants. The Company adopted the provisions of SFAS No. 168 effective for the financial statements included in this Form 10-K. The adoption of SFAS No. 168, as codified by ASC Topic 105, “Generally Accepted Accounting Principles,” impacted the Company’s financial statement disclosures, but did not have any effect on its financial position or results of operations.
Effective July 1, 2009, the Company adopted ASC guidelines regarding accounting and reporting for business combinations that are consummated after July 1, 2009. These guidelines include certain changed principles and requirements related to: (1) recognition and measurements of identifiable assets acquired, liabilities assumed, goodwill acquired, any gain from a bargain purchase, and any noncontrolling interest in an acquired company; (2) application issues relating to accounting and disclosures for assets and liabilities arising from contingencies in a business combination; and (3) disclosures regarding business combinations in financial statements. The Company will apply the ASC guidelines prospectively to business
combination transactions consummated after July 1, 2009, if any. The Company did not consummate any business combination transactions during the fiscal year ended June 30, 2010.
In August 2009, the FASB issued Accounting Standards Update No. 2009-05, “Fair Value Measurements and Disclosures” (“ASU 2009-05”). ASU 2009-05 amends ASC Topic 820, “Fair Value Measurements and Disclosures” by providing additional guidance clarifying the measurement of liabilities at fair value. The amendments prescribed by ASU 2009-05 became effective for the Company’s quarterly reporting period ending December 31, 2009 and did not have any impact on the Company’s financial position or results of operations.
In February 2010, the FASB issued Accounting Standards Update No. 2010-09, “Subsequent Events (Topic 855) — Amendments to Certain Recognition and Disclosure Requirements” (“ASU 2010-09”). ASU 2010-09 amends ASC Topic 855, “Subsequent Events,” by clarifying the scope of disclosure requirements related to subsequent events. The amendments prescribed by ASU 2010-09 became effective for the Company’s quarterly reporting period ending March 31, 2010 and did not have any impact on the Company’s financial position or results of operations.
In January 2010, the FASB issued Accounting Standards Update No. 2010-06 (“ASU 2010-06”), which amends FASB ASC Topic 820, “Fair Value Measurements and Disclosures.” The amended guidance in ASU 2010-06 requires entities to disclose additional information regarding assets and liabilities that are transferred between levels of the fair value hierarchy. ASU 2010-06 also requires that required Level 3 disclosures regarding purchases, sales, issuances and settlements be reported on a gross basis. ASU 2010-06 clarifies existing guidance pertaining to the level of disaggregation at which fair value disclosures should be made and the requirements to disclose information about the valuation techniques and inputs used in estimating Level 2 and Level 3 fair value measurements. The amended guidance in ASU 2010-06 pertaining to disclosure of transfers between levels of the fair value hierarchy, the level of disaggregation of disclosures and disclosure of valuation techniques and inputs used in estimating Level 2 and Level 3 measurements became effective and were adopted for the Company’s quarterly reporting period ending March 31, 2010.
The requirement to disclose Level 3 purchases, sales, issuances and settlements on a gross basis will become effective for fiscal years (and for interim periods within those fiscal years) beginning after December 15, 2010. The Company intends to adopt these provisions effective for its quarterly reporting period ending September 30, 2011.
Risk Management
Overview
Some degree of risk is inherent in virtually all of our activities. As a result of our business growth into new markets and increased complexity of our operating infrastructure, we continuously review and, where necessary, upgrade our risk management policies and systems. The objectives of our risk management policies and systems include:
· Timely identification of various risks associated with our business;
· Assessment of potential costs that can be considered in relation to expected rewards from taking such risks;
· Development and/or acquisition of adequate protections against identified risks;
· Appropriate monitoring and disclosure of risks to all concerned parties; and
· Development of adequate staff training programs regarding compliance with relevant laws, regulations, internal policies and procedures and established systems of internal controls.
Risk management oversight begins with our Board of Directors and its committees, principally the Audit Committee and the Risk Oversight Committee. The Audit Committee consists of four members of the Board of Directors and is chaired by an independent director. The Audit Committee meets with our outside auditors shortly after the end of each quarterly and year-end reporting period and reviews and approves all financial reports filed with the SEC.
The Risk Oversight Committee is chaired by an independent director and includes four additional directors. The Risk Oversight Committee meets at least quarterly, and as often as necessary, to ensure that we have adhered to established risk management policies, to review our risk management activities and positions and to address any changes to policies or activities that may be necessary. We also have an independent risk management department that is responsible for monitoring and enforcing risk management policies related to commodities hedging activities.
Market Risk Management
Market risks result primarily from changes in commodity prices and interest rates. In the normal course of business, we also have limited credit risks associated with our ability to collect from derivative counterparties and collect billed accounts receivable from customers and LDCs.
Our primary market risk management objective is to maintain volume and price neutrality by using physical supply, storage and commodity derivatives to mitigate market risks resulting from changes in commodity prices and interest rates. Our risk management policies are reviewed at least annually to ensure that material risks associated with ongoing market risks, new products, asset acquisitions and other changes in our risk profile are adequately addressed.
Refer to Item 7A of this Annual Report for additional commentary regarding market risks.
Liquidity Risk Management
Liquidity risk is the risk that we would be unable to meet our obligations as they become due or unable to fund business growth because of an inability to liquidate assets or obtain adequate funding. Under the oversight of the Audit Committee, liquidity is managed by the CFO to provide the ability to generate cash to fund current operating, investing and financing activities and to manage the cost of purchases of natural gas and electricity at a reasonable cost in a reasonable amount of time, while maintaining routine operations and market confidence. The following strategies and processes are utilized to manage liquidity:
· Utilize our hedging strategy to reduce the impact of volatile commodity prices — We have a risk management policy that is intended to reduce our financial exposure related to changes in the price of natural gas and electricity. Under this policy, we hedge anticipated natural gas and electricity commodity purchases required to meet expected customer demand for all accounts served under fixed price contracts. As of June 30, 2010, we utilized the Commodity Supply Facility as our exclusive natural gas and electricity hedge facility.
· Utilize our credit facilities to provide liquidity for operating requirements — Under the Commodity Supply Facility, we have a ready source of liquidity, primarily in the form of letters of credit used for collateral to be placed with hedge counterparties, commodity suppliers and providers of transportation and storage services. As of June 30, 2010, we believe that the Commodity Supply Facility will be adequate to supplement cash provided by operations for meeting our operational liquidity needs for fiscal year 2011.
· Maximize pricing opportunities within the markets that we serve — We strive to offer products and prices that are competitive within the markets we serve and allow us to realize a reasonable gross profit per MMBtu or MWhr sold. Maximizing our gross profit is crucial to our overall financial success and liquidity position.
· Maximize cash collections from LDCs and customers — During fiscal year 2010, approximately 49% of our total sales of natural gas and electricity were within markets that guarantee customer accounts receivable. The LDCs in these markets have credit ratings that are investment grade. We monitor the payment histories, credit ratings and other financial information for these LDCs in order to identify and address adverse trends, if any. As of June 30, 2010, we do not maintain an allowance for doubtful accounts against receivables from these LDCs as we do not anticipate any material credit losses related to these receivables.
For customer accounts receivable that are not guaranteed by LDCs, we have processes and information systems in place to ensure that appropriate amounts are billed and collected from our customers on a timely basis. We maintain an allowance for doubtful accounts against receivables from these customers, as we do not anticipate any material credit losses related to these receivables. Refer to Item 7A of this Annual Report for additional commentary regarding credit risk.
Operational and Compliance Risk Management
Operational risk is the risk of loss arising from fraud, unauthorized activities, errors, omissions, inefficiency, system failure or other external events. Operational risk is inherent throughout our business organization and covers a wide spectrum of issues.
Compliance risk is the risk arising from failure to comply with relevant laws, regulations and regulatory requirements governing the conduct of our business. Failure to effectively identify and address various compliance risks can result in financial penalties and other regulatory sanctions, litigation, damage to reputation and loss of customers.
Under the general oversight of our Board of Directors, CEO and CFO, operational and compliance risks are directly managed within the following functional areas of the organization:
· Compliance and regulatory affairs;
· Marketing and sales;
· Contract pricing;
· Natural gas and electricity supply;
· Customer operations (including activities related to billing and collections, quality assurance related to various marketing programs and management of customer communications);
· Financial accounting and reporting;
· Tax accounting and reporting;
· Legal counsel; and
· Human Resources and payroll.
Management within each of these areas is directly responsible for identification of risks, development of formal policies and procedures to manage such risks, and reporting any incidents, events or transactions, if any, where risks may not be adequately mitigated. Under the direction of the Audit Committee and the CFO, the Director of Internal Audit is responsible for investigating and addressing any such incidents, events or transactions for their impact on our overall risk management environment, on our internal control framework, and on the planning of internal audits.
Fraud Risk
We have a formal fraud risk assessment program, which is designed to facilitate:
· Identification of potential fraud risks;
· Design of internal controls to address and mitigate the fraud risks identified;
· Periodic reviews of controls for effectiveness; and
· Monitoring of corporate activities and formal reporting of potential incidents, if necessary, to senior management and the Board of Directors.
Under the general oversight of the Audit Committee and the CFO, our Director of Internal Audit is responsible for administering the fraud risk assessment program and reporting the results to the Audit Committee.
Information Systems
We maintain a number of information systems for capturing customer, accounting, supply forecasting and risk management information. The majority of our systems are hosted at an offsite data center in Houston, Texas, which maintains 24/7 security and has stand-alone power generation to keep the data center functional in the case of an extended power outage.
During fiscal year 2008, in conjunction with our hosting provider, we launched an initiative to modernize our key server infrastructure to increase reliability and to increase redundancy. During fiscal 2010, we continued to consolidate our multiple existing customer relationship management tools and multiple billing platforms. As of June 30, 2010, more than 95% of our customers had been consolidated into our primary strategic systems. We are also continuing to convert our demand forecasting and risk management operations to new or enhanced third party software systems. We are currently utilizing these systems and will continue to make enhancements during fiscal year 2011.
We perform daily backup of our key servers and maintain backup tapes for a period of four weeks before they are overwritten. We also perform a month-end backup of key servers and keep such data for a period of six months to one year. All backup tapes are stored offsite at a secure storage facility. We currently replicate our email and various other production servers to ensure availability of our critical systems. We are in the process of increasing this functionality to additional servers.
We have taken a multi-tiered approach to protecting our network from malware and intrusions. We employ endpoint security that includes locked-down routers, dual firewalls, and other security appliances. These are supplemented with anti-spyware and virus protection on all workstations and windows servers. These applications are monitored and updated to respond pro-actively and successfully to changing threats.
Our corporate website has been custom-developed by an outsourced marketing company. We host our corporate website onsite with an employee of the Company serving as our webmaster.
Business Continuity Planning
We are committed to the protection of our employees, customers, shareholders, physical buildings, information systems and corporate records. Our disaster recovery plan and the geographic distance between our offices mitigate the risk of catastrophic interruption of our business.
ITEM 7A. QUANTITATIVE AND QUALITATIVE DISCLOSURES ABOUT MARKET RISK
Commodity Price Risk
Commodity price risk is the risk of exposure to fluctuations in the price of natural gas and electricity. Because our contracts require that we deliver full commodity requirements to our customers and because our customers’ usage is impacted by factors such as weather, we are exposed to fluctuations in customer load requirements. We typically purchase commodity equal to expected customer consumption assuming normal weather patterns. We may purchase additional commodity volumes for the summer in the case of electricity and for the winter in the case of natural gas in order to protect against a potential demand increase in peak seasons. As a result of the natural swing in customer consumption related to weather changes, we may have to buy or sell additional volumes, and therefore may be exposed to price volatility in that event. We utilize various hedging strategies in order to mitigate the risk associated with potential volumetric variability of our monthly deliveries for fixed priced customers.
We utilize the following instruments to offset price risk associated with volume commitments under fixed and variable price contracts where the price to the customer must be established ahead of the index settlement: (1) for natural gas: NYMEX-referenced gas swaps, basis swaps, physical commodity hedges and physical basis hedges; and (2) for electricity: ISO zone specific swaps, basis swaps, physical hedges and physical basis hedges.
Economic hedges are also utilized to cover inventory injection and withdrawal as well as to cover utility over/under delivery obligations. For fixed price customers, both inventory and imbalances caused by utility over/under delivery obligations are hedged using derivatives or physical hedges. For variable price customers, inventory is generally hedged using derivative instruments or physical commodity hedges and utility imbalances are hedged either through the utilization of derivatives, physical hedges, or through a monthly price adjustment as published and billed to the customer each month. The fair values of these hedges, which are recorded in unrealized gains (losses) from risk management activities on the consolidated balance sheet, will settle during each specific month to mirror our planned injections and withdrawals, as well as over/under delivery obligations.
The natural gas swap instruments are generally settled with respect to each delivery month against the final settlement price determined on the last trading day of the Henry Hub futures contract listed for such month on the NYMEX. In the case of electricity swap instruments, settlement is based on ISO settlement prices during the month. Natural gas basis swaps are typically settled against the first of the month published index prices at various trading points that relate to locations where we have customer obligations. Basis swaps are priced based on the NYMEX settlement price on the last trading day of the futures contract delivery month plus or minus an agreed-upon premium or discount. All of the natural gas and electricity swaps have been executed “over-the-counter” on a bilateral basis under the Commodity Supply Facility. We also enter into financial swaps with other counterparties in order to meet electricity requirements. These are settled based on the index price for the appropriate ISO. We only execute financial swaps with entities with investment grade credit ratings. As of June 30, 2010, our hedge positions extended through March 2013.
We have adopted a risk management policy to measure and limit market and credit risk associated with our customer portfolio. The risk policy requires that we maintain a balanced position at all times and does not permit speculative trading. None of our employees are compensated on the basis of his or her trading activities. In marketing products to residential and small commercial customers, we hedge in advance of anticipated contract sales (adjusted to reflect attrition). When marketing to larger commercial accounts, the hedge is executed at the time of the contract sale. Our current risk policy requires that the following exposures be promptly mitigated: (1) for natural gas, any exposure in excess of $1.0 million related to the volumetric difference between commitments to deliver natural gas to customers and the related hedge positions must be brought back in compliance within three business days; and (2) for electricity, any exposure greater than $750,000 related to the volumetric difference between commitments to deliver electricity to customers and related hedge positions must be brought back in compliance within three business days.
In order to address the potential volume variability of future deliveries, we utilize various hedging strategies to mitigate our exposure. For natural gas, hedging tools may include: (i) over-hedging winter volume obligations in certain markets by up to 10% in order to provide price and volume protection resulting from unexpected increases in demand or by purchasing calls; (ii) utilizing gas in storage to offset variability in winter demand; (iii) entering into options settled against daily basis prices published in an industry publication, for each day during some or all of the winter months, that protect against rising prices of additional daily volumes if demand increases; and (iv) purchasing put options to protect against falling prices if unused volume needs to be sold and to protect against customer attrition in excess of that historically experienced. For electricity, hedging tools include: (i) over-hedging summer on-peak volume obligations by up to 10% or purchasing call options in order to provide price and volume protection from unexpected increases in demand during peak or “super-peak” hours; (ii) entering into load shape hedges to cover the inherent imbalance from a normal consumption curve that a block
hedge creates; and (iii) purchasing put options to protect against falling prices if unused volume needs to be sold and to protect against customer attrition in excess of that historically experienced.
We utilize an internally developed modified variance/co-variance value-at-risk “VAR,” model to estimate potential loss in the fair value of our natural gas portfolio. For our VAR model, we utilize the higher of 10-day and 30-day NYMEX volatility on a 2 standard deviation basis (95.45% confidence level). During the three months ended September 30, 2008, volatility in natural gas prices resulted in unusually high potential losses in the fair value of our natural gas portfolio using this VAR model.
The potential losses in the fixed price natural gas portfolio using our actual net open position at the end of each month during the fiscal years ended June 30, 2010, 2009 and 2008 are summarized in the following table. Unusually high volatility in natural gas commodity prices during the final three months of fiscal year 2008 and the first six months of fiscal year 2009 resulted in unusually high potential losses in the fair value of our natural gas portfolio during those periods using this VAR model.
|
|
|
Fiscal Year Ended |
|
|||||||
|
|
|
2010 |
|
2009 |
|
2008 |
|
|||
|
|
|
(in thousands) |
|
|||||||
|
Potential loss during the period: |
|
|
|
|
|
|
|
|||
|
Average |
|
$ |
32 |
|
$ |
120 |
|
$ |
108 |
|
|
Maximum |
|
71 |
|
624 |
|
366 |
|
|||
|
Minimum |
|
4 |
|
25 |
|
13 |
|
|||
There have been no material changes in our methodology or policies regarding commodity price risk management during the fiscal year ended June 30, 2010.
Credit Risk
We are exposed to credit risk in our risk management activities. Credit risk is the risk of loss resulting from the nonperformance by a counterparty of its contractual obligations. Our fixed price positions are executed under agreements that include master netting arrangements, which mitigate outstanding credit exposure. Under the Commodity Supply Facility, our economic hedging activities are with a financial institution that has an investment grade credit rating.
We also are exposed to credit risk in our sales activities. During fiscal year 2010, approximately 51% of our total sales of natural gas and electricity were within markets where LDCs do not guarantee customer accounts receivable while 49% of our total sales were within markets where LDCs guarantee customer accounts receivable at a weighted average discount rate of approximately 1%. Such discount is the cost incurred to guarantee the customer accounts receivable. In cases where the LDC guarantees customer accounts receivable, we are exposed only to the credit risk of the LDC, rather than that of our actual customers. We monitor the credit ratings of LDCs and the parent companies of LDCs that guarantee our customer accounts receivable. As of June 30, 2010, all of our customer accounts receivable in LDC-guaranteed markets were with LDCs with investment grade credit ratings. We also periodically review payment history and financial information for LDCs to ensure that we identify and respond to any deteriorating trends.
The allowance for doubtful accounts represents our estimate of potential credit losses associated with customer accounts receivable in markets where such receivables are not guaranteed by LDCs. We assess the adequacy of our allowance for doubtful accounts through review of the aging of customer accounts receivable and our assessment of the general economic conditions in the markets that we serve. Based upon our review as of June 30, 2010, we believe that the allowance for doubtful accounts is adequate to cover potential credit losses related to customer accounts receivable.
We record a provision for doubtful accounts for the estimated total revenue that is not expected to be collected from customers in non-guaranteed markets. The following table provides a summary of the provision for doubtful accounts as a percentage of total sales of natural gas and electricity within these markets.
|
|
|
Fiscal Year Ended June 30, |
|
||||
|
|
|
2010 |
|
2009 |
|
2008 |
|
|
Provision for doubtful accounts as a percentage of sales of natural gas and electricity in non-guaranteed markets during the period |
|
1.79 |
% |
2.79 |
% |
1.19 |
% |
During fiscal year 2009, we experienced deterioration of the aging of billed customer accounts receivable within certain of our markets, particularly in our largest natural gas market in Georgia, primarily due to:
· generally weak economic conditions; and
· incremental charge offs and reserves associated with customer accounts acquired from Catalyst in October 2008, which were higher than historical levels for previous purchase acquisitions, and which contributed significantly to a higher provision for doubtful accounts in our Georgia market.
Credit environments generally stabilized in many of our markets during fiscal year 2010. Additionally, we initiated more stringent credit standards for our new and existing customers during fiscal year 2009, which resulted in generally higher credit quality in our customer portfolio during fiscal year 2010. We continue to closely monitor economic conditions and actual collections data within all of our markets for signs of any negative long-term trends that could result in higher allowance requirements.
There have been no material changes in our methodology or policies regarding credit risk management during the fiscal year ended June 30, 2010.
Interest Rate Risk
We are exposed to risk from fluctuations in interest rates in connection with the Commodity Supply Facility and the Floating Rate Notes due 2011. We manage our exposure to interest rate fluctuations by utilizing interest rate swaps to effectively convert interest rate exposure from a variable rate to a fixed rate of interest. As of June 30, 2010, an $80.0 million swap was outstanding, which expires on August 1, 2011. The fixed-for-floating swap effectively fixes the six-month LIBOR rate at 5.72% per annum. During fiscal year 2010, the $80.0 million interest rate swap agreement was novated to RBS Sempra from the previous counterparty, as required by the terms of the Commodity Supply Facility. Such novation did not have any impact on our rights, obligations, risks or accounting methodology associated with the interest rate swap agreement.
Under the Commodity Supply Facility, we are subject to variable interest rates in connection with cash borrowings and credit support, primarily in the form of letters of credit, provided by RBS Sempra. As of June 30, 2010, approximately $34.0 million of letters of credit were outstanding under the Commodity Supply Facility, as well as $6.4 million aggregate principal amount of Floating Rate Notes due 2011.
As of June 30, 2010, based on the net exposure resulting from the interest rate swap, the letters of credit outstanding under the Commodity Supply Facility and the outstanding balance of Floating Rate Notes due 2011, the impact of a 1% change in interest rates on interest expense for a twelve-month period is approximately $0.4 million.
We have not designated interest rate swaps as hedges and, accordingly, changes in the market value of the interest rate swaps are charged directly to interest expense. At June 30, 2010, the total unrealized loss from risk management activities recorded on the consolidated balance sheets related to interest rate swaps was approximately $6.0 million. As of June 30, 2010, we posted $6.0 million of cash as collateral against our mark-to-market exposure related to the outstanding interest rate swap agreement.
ITEM 8. FINANCIAL STATEMENTS AND SUPPLEMENTARY DATA
REPORT OF INDEPENDENT REGISTERED PUBLIC ACCOUNTING
FIRM AND CONSOLIDATED
FINANCIAL STATEMENTS
Report of Independent Registered Public Accounting Firm
The
Board of Directors and Stockholders
MXenergy Holdings Inc.
We have audited the accompanying consolidated balance sheets of MXenergy Holdings Inc. as of June 30, 2010 and 2009, and the related consolidated statements of operations, stockholders’ equity, and cash flows for each of the three years in the period ended June 30, 2010. These financial statements are the responsibility of the Company’s management. Our responsibility is to express an opinion on these financial statements based on our audits.
We conducted our audits in accordance with the standards of the Public Company Accounting Oversight Board (United States). Those standards require that we plan and perform the audit to obtain reasonable assurance about whether the financial statements are free of material misstatement. We were not engaged to perform an audit of the Company’s internal control over financial reporting. Our audits included consideration of internal control over financial reporting as a basis for designing audit procedures that are appropriate in the circumstances, but not for the purpose of expressing an opinion on the effectiveness of the Company’s internal control over financial reporting. Accordingly, we express no such opinion. An audit also includes examining, on a test basis, evidence supporting the amounts and disclosures in the financial statements, assessing the accounting principles used and significant estimates made by management, and evaluating the overall financial statement presentation. We believe that our audits provide a reasonable basis for our opinion.
In our opinion, the financial statements referred to above present fairly, in all material respects, the consolidated financial position of MXenergy Holdings Inc. at June 30, 2010, and 2009, and the consolidated results of its operations and its cash flows for each of the three years in the period ended June 30, 2010, in conformity with U.S. generally accepted accounting principles.
/s/ Ernst & Young LLP
Stamford, Connecticut
September 29, 2010
MXENERGY HOLDINGS INC.
(dollars in thousands)
|
|
|
Balance at June 30, |
|
||||
|
|
|
2010 |
|
2009 |
|
||
|
|
|
|
|
|
|
||
|
Assets |
|
|
|
|
|
||
|
Current assets: |
|
|
|
|
|
||
|
Cash and cash equivalents |
|
$ |
6,220 |
|
$ |
23,266 |
|
|
Restricted cash |
|
1,574 |
|
75,368 |
|
||
|
Fixed Rate Notes Escrow Account (Note 17) |
|
8,977 |
|
— |
|
||
|
Accounts receivable from customers and LDCs, net (Note 6) |
|
48,925 |
|
47,598 |
|
||
|
Accounts receivable, net — RBS Sempra (Note 16) |
|
43,054 |
|
— |
|
||
|
Natural gas inventories (Note 7) |
|
15,861 |
|
29,415 |
|
||
|
Current portion of unrealized gains from risk management activities, net (Notes 14 and 15) |
|
— |
|
294 |
|
||
|
Income taxes receivable |
|
6,063 |
|
6,461 |
|
||
|
Deferred income taxes (Note 12) |
|
1,378 |
|
9,020 |
|
||
|
Other current assets (Note 11) |
|
16,272 |
|
12,084 |
|
||
|
Total current assets |
|
148,324 |
|
203,506 |
|
||
|
Goodwill (Note 8) |
|
3,810 |
|
3,810 |
|
||
|
Customer acquisition costs, net (Note 9) |
|
30,425 |
|
27,950 |
|
||
|
Fixed assets, net (Note 10) |
|
2,739 |
|
3,728 |
|
||
|
Deferred income taxes (Note 12) |
|
3,629 |
|
15,089 |
|
||
|
Deferred debt issuance costs (Notes 16 and 17) |
|
12,552 |
|
4,475 |
|
||
|
Other assets |
|
541 |
|
513 |
|
||
|
Total assets |
|
$ |
202,020 |
|
$ |
259,071 |
|
|
|
|
|
|
|
|
||
|
Liabilities and stockholders’ equity |
|
|
|
|
|
||
|
Current liabilities: |
|
|
|
|
|
||
|
Accounts payable and accrued liabilities (Note 13) |
|
$ |
30,302 |
|
$ |
43,147 |
|
|
Current portion of unrealized losses from risk management activities, net (Notes 14 and 15) |
|
16,731 |
|
34,224 |
|
||
|
Deferred revenue |
|
7,457 |
|
4,271 |
|
||
|
Denham Credit Facility (Note 22) |
|
— |
|
12,000 |
|
||
|
Deferred income taxes (Note 12) |
|
— |
|
— |
|
||
|
Bridge Financing Loans payable (Note 20) |
|
— |
|
5,400 |
|
||
|
Total current liabilities |
|
54,490 |
|
99,042 |
|
||
|
Unrealized losses from risk management activities, net (Notes 14 and 15) |
|
1,857 |
|
14,071 |
|
||
|
Long-term debt (Note 16) |
|
58,722 |
|
163,476 |
|
||
|
Total liabilities |
|
115,069 |
|
276,589 |
|
||
|
|
|
|
|
|
|
||
|
Redeemable Convertible Preferred Stock (Note 18) |
|
— |
|
54,632 |
|
||
|
|
|
|
|
|
|
||
|
Commitments and contingencies (Note 22) |
|
— |
|
— |
|
||
|
|
|
|
|
|
|
||
|
Stockholders’ equity: |
|
|
|
|
|
||
|
Common stock (Note 19) |
|
|
|
|
|
||
|
Class A Common Stock (par value $0.01; 50,000,000 shares authorized; 33,940,683 shares issued and 33,710,902 shares outstanding at June 30, 2010) |
|
339 |
|
— |
|
||
|
Class B Common Stock (par value $0.01; 10,000,000 shares authorized; 4,002,290 shares issued and outstanding at June 30, 2010) |
|
40 |
|
— |
|
||
|
Class C Common Stock (par value $0.01; 40,000,000 shares authorized; 16,413,159 shares issued and outstanding at June 30, 2010) |
|
164 |
|
— |
|
||
|
Common stock (par value $0.01; 10,000,000 shares authorized; 4,681,219 shares issued and outstanding at June 30, 2009) |
|
— |
|
47 |
|
||
|
Total common stock |
|
543 |
|
47 |
|
||
|
Additional paid-in capital |
|
139,702 |
|
18,275 |
|
||
|
Class A treasury stock (229,781 shares at June 30, 2010; Note 19) |
|
(99 |
) |
— |
|
||
|
Accumulated other comprehensive loss |
|
(156 |
) |
(3 |
) |
||
|
Accumulated deficit |
|
(53,039 |
) |
(90,469 |
) |
||
|
Total stockholders’ equity |
|
86,951 |
|
(72,150 |
) |
||
|
Total liabilities and stockholders’ equity |
|
$ |
202,020 |
|
$ |
259,071 |
|
The accompanying notes are an integral part of these consolidated financial statements.
MXENERGY HOLDINGS INC.
Consolidated Statements of Operations
(dollars in thousands)
|
|
|
Fiscal Years Ended June 30, |
|
|||||||
|
|
|
2010 |
|
2009 |
|
2008 |
|
|||
|
|
|
|
|
|
|
|
|
|||
|
Sales of natural gas and electricity |
|
$ |
561,206 |
|
$ |
789,780 |
|
$ |
752,283 |
|
|
Cost of goods sold (excluding depreciation and amortization): |
|
|
|
|
|
|
|
|||
|
Cost of natural gas and electricity sold |
|
386,934 |
|
596,747 |
|
630,006 |
|
|||
|
Realized losses from risk management activities, net |
|
48,211 |
|
72,824 |
|
6,747 |
|
|||
|
Unrealized (gains) losses from risk management activities, net |
|
(27,139 |
) |
87,575 |
|
(67,168 |
) |
|||
|
|
|
408,006 |
|
757,146 |
|
569,585 |
|
|||
|
Gross profit |
|
153,200 |
|
32,634 |
|
182,698 |
|
|||
|
|
|
|
|
|
|
|
|
|||
|
Operating expenses: |
|
|
|
|
|
|
|
|||
|
General and administrative expenses |
|
58,603 |
|
59,957 |
|
62,271 |
|
|||
|
Advertising and marketing expenses |
|
3,749 |
|
2,117 |
|
4,546 |
|
|||
|
Reserves and discounts |
|
7,495 |
|
15,130 |
|
7,130 |
|
|||
|
Depreciation and amortization |
|
22,174 |
|
37,575 |
|
32,698 |
|
|||
|
Total operating expenses |
|
92,021 |
|
114,779 |
|
106,645 |
|
|||
|
|
|
|
|
|
|
|
|
|||
|
Operating profit (loss) |
|
61,179 |
|
(82,145 |
) |
76,053 |
|
|||
|
Interest expense (net of interest income of $271, $430 and $3,806, respectively) |
|
34,982 |
|
45,305 |
|
34,105 |
|
|||
|
Income (loss) before income tax (expense) benefit |
|
26,197 |
|
(127,450 |
) |
41,948 |
|
|||
|
Income tax (expense) benefit |
|
(14,692 |
) |
27,249 |
|
(17,155 |
) |
|||
|
Net income (loss) |
|
$ |
11,505 |
|
$ |
(100,201 |
) |
$ |
24,793 |
|
The accompanying notes are an integral part of these consolidated financial statements.
MXENERGY HOLDINGS INC.
Consolidated Statements of Stockholders’ Equity
(dollars in thousands)
|
|
|
Common |
|
Additional |
|
Class A |
|
Unearned |
|
Accumulated |
|
(Accumulated |
|
Total |
|
|||||||
|
|
|
|
|
|
|
|
|
|
|
|
|
|
|
|
|
|||||||
|
Balance at June 30, 2007 |
|
$ |
34 |
|
$ |
21,367 |
|
$ |
— |
|
$ |
(22 |
) |
$ |
(129 |
) |
$ |
4,361 |
|
$ |
25,611 |
|
|
Issuance of common stock |
|
2 |
|
1,337 |
|
— |
|
— |
|
— |
|
— |
|
1,339 |
|
|||||||
|
Revaluation of Redeemable Convertible Preferred Stock |
|
— |
|
— |
|
— |
|
— |
|
— |
|
(19,422 |
) |
(19,422 |
) |
|||||||
|
Unamortized stock compensation |
|
— |
|
(558 |
) |
— |
|
558 |
|
— |
|
— |
|
— |
|
|||||||
|
Purchase and cancellation of treasury shares |
|
— |
|
(1,559 |
) |
— |
|
— |
|
— |
|
— |
|
(1,559 |
) |
|||||||
|
Stock compensation expense |
|
— |
|
2,244 |
|
— |
|
— |
|
— |
|
— |
|
2,244 |
|
|||||||
|
Tax benefit on issuance of common stock from options |
|
— |
|
804 |
|
— |
|
— |
|
— |
|
— |
|
804 |
|
|||||||
|
Amortization of stock compensation |
|
— |
|
— |
|
— |
|
(540 |
) |
— |
|
— |
|
(540 |
) |
|||||||
|
Comprehensive income (loss): |
|
|
|
|
|
|
|
|
|
|
|
|
|
|
|
|||||||
|
Net income |
|
— |
|
— |
|
— |
|
— |
|
— |
|
24,793 |
|
24,793 |
|
|||||||
|
Foreign currency translation |
|
— |
|
— |
|
— |
|
— |
|
(60 |
) |
— |
|
(60 |
) |
|||||||
|
Comprehensive income |
|
— |
|
— |
|
— |
|
— |
|
— |
|
— |
|
24,733 |
|
|||||||
|
|
|
|
|
|
|
|
|
|
|
|
|
|
|
|
|
|||||||
|
Balance at June 30, 2008 |
|
36 |
|
23,635 |
|
— |
|
(4 |
) |
(189 |
) |
9,732 |
|
33,210 |
|
|||||||
|
Issuance of common stock |
|
11 |
|
(11 |
) |
— |
|
— |
|
— |
|
— |
|
— |
|
|||||||
|
Revaluation of Redeemable Convertible Preferred Stock |
|
— |
|
(5,853 |
) |
— |
|
— |
|
— |
|
— |
|
(5,853 |
) |
|||||||
|
Unamortized stock compensation |
|
— |
|
(584 |
) |
— |
|
584 |
|
— |
|
— |
|
— |
|
|||||||
|
Purchase and cancellation of treasury shares |
|
— |
|
(11 |
) |
— |
|
— |
|
— |
|
— |
|
(11 |
) |
|||||||
|
Stock compensation expense |
|
— |
|
1,099 |
|
— |
|
— |
|
— |
|
— |
|
1,099 |
|
|||||||
|
Amortization of stock compensation |
|
— |
|
— |
|
— |
|
(580 |
) |
— |
|
— |
|
(580 |
) |
|||||||
|
Comprehensive income (loss): |
|
|
|
|
|
|
|
|
|
|
|
|
|
|
|
|||||||
|
Net income |
|
— |
|
— |
|
— |
|
— |
|
— |
|
(100,201 |
) |
(100,201 |
) |
|||||||
|
Foreign currency translation |
|
— |
|
— |
|
— |
|
— |
|
186 |
|
— |
|
186 |
|
|||||||
|
Comprehensive income |
|
— |
|
— |
|
— |
|
— |
|
— |
|
— |
|
(100,015 |
) |
|||||||
|
|
|
|
|
|
|
|
|
|
|
|
|
|
|
|
|
|||||||
|
Balance at June 30, 2009 |
|
47 |
|
18,275 |
|
— |
|
— |
|
(3 |
) |
(90,469 |
) |
(72,150 |
) |
|||||||
|
Issuance of Class A Common Stock |
|
339 |
|
81,468 |
|
— |
|
— |
|
— |
|
— |
|
81,807 |
|
|||||||
|
Issuance of Class B Common Stock |
|
40 |
|
9,005 |
|
— |
|
— |
|
|
|
|
|
9,045 |
|
|||||||
|
Issuance of Class C Common Stock |
|
164 |
|
28,591 |
|
— |
|
— |
|
— |
|
— |
|
28,755 |
|
|||||||
|
Acquisition of Class A treasury stock |
|
— |
|
— |
|
(99 |
) |
— |
|
— |
|
— |
|
(99 |
) |
|||||||
|
Cancellation of common stock |
|
(47 |
) |
— |
|
— |
|
— |
|
— |
|
— |
|
(47 |
) |
|||||||
|
Stock compensation expense |
|
— |
|
2,363 |
|
— |
|
— |
|
— |
|
— |
|
2,363 |
|
|||||||
|
Revaluation of redeemable convertible preferred stock |
|
— |
|
— |
|
— |
|
— |
|
— |
|
25,925 |
|
25,925 |
|
|||||||
|
Comprehensive income (loss): |
|
|
|
|
|
|
|
|
|
|
|
|
|
|
|
|||||||
|
Net income |
|
— |
|
— |
|
— |
|
— |
|
— |
|
11,505 |
|
11,505 |
|
|||||||
|
Foreign currency translation |
|
— |
|
— |
|
— |
|
— |
|
(153 |
) |
— |
|
(153 |
) |
|||||||
|
Comprehensive income |
|
— |
|
— |
|
— |
|
— |
|
— |
|
— |
|
11,352 |
|
|||||||
|
|
|
|
|
|
|
|
|
|
|
|
|
|
|
|
|
|||||||
|
Balance at June 30, 2010 |
|
$ |
543 |
|
$ |
139,702 |
|
$ |
(99 |
) |
$ |
— |
|
$ |
(156 |
) |
$ |
(53,039 |
) |
$ |
86,951 |
|
The accompanying notes are an integral part of these consolidated financial statements.
MXENERGY HOLDINGS INC.
Consolidated Statements of Cash Flows
(dollars in thousands)
|
|
|
Fiscal Years Ended June 30, |
|
|||||||
|
|
|
2010 |
|
2009 |
|
2008 |
|
|||
|
Operating activities: |
|
|
|
|
|
|
|
|||
|
Net income (loss) |
|
$ |
11,505 |
|
$ |
(100,201 |
) |
$ |
24,793 |
|
|
Adjustments to reconcile net income (loss) to net cash provided by (used in) operating activities: |
|
|
|
|
|
|
|
|||
|
Unrealized losses (gains) from risk management activities |
|
(27,139 |
) |
87,575 |
|
(67,168 |
) |
|||
|
Stock compensation expense |
|
2,363 |
|
519 |
|
1,704 |
|
|||
|
Provision for doubtful accounts |
|
5,164 |
|
12,009 |
|
5,050 |
|
|||
|
Depreciation and amortization |
|
22,174 |
|
37,575 |
|
32,698 |
|
|||
|
Deferred income tax expense (benefit) |
|
19,102 |
|
(23,406 |
) |
18,187 |
|
|||
|
Non-cash interest expense, primarily unrealized losses on interest rate swaps and amortization of debt issuance costs |
|
10,146 |
|
16,233 |
|
10,836 |
|
|||
|
Amortization of customer contracts acquired |
|
(50 |
) |
(634 |
) |
(762 |
) |
|||
|
Changes in assets and liabilities, net of effects of acquisitions: |
|
|
|
|
|
|
|
|||
|
Restricted cash |
|
73,794 |
|
(74,781 |
) |
463 |
|
|||
|
Fixed Rate Notes Escrow Account |
|
(8,977 |
) |
— |
|
— |
|
|||
|
Accounts receivable |
|
(6,491 |
) |
28,066 |
|
(35,231 |
) |
|||
|
Accounts receivable, RBS Sempra |
|
(43,054 |
) |
— |
|
— |
|
|||
|
Natural gas inventories |
|
13,554 |
|
36,509 |
|
(7,308 |
) |
|||
|
Income taxes receivable |
|
398 |
|
1,063 |
|
(7,173 |
) |
|||
|
Option premiums |
|
(335 |
) |
1,571 |
|
1,191 |
|
|||
|
Other assets |
|
(4,732 |
) |
(10,443 |
) |
1,916 |
|
|||
|
Customer acquisition costs |
|
(21,863 |
) |
(14,786 |
) |
(18,193 |
) |
|||
|
Accounts payable and accrued liabilities |
|
(12,795 |
) |
(46,553 |
) |
17,882 |
|
|||
|
Deferred revenue |
|
3,186 |
|
(3,164 |
) |
(4,352 |
) |
|||
|
Net cash provided by (used in) operating activities |
|
35,950 |
|
(52,848 |
) |
(25,467 |
) |
|||
|
|
|
|
|
|
|
|
|
|||
|
Investing activities: |
|
|
|
|
|
|
|
|||
|
Purchases of fixed assets |
|
(1,328 |
) |
(1,001 |
) |
(1,959 |
) |
|||
|
Purchase of assets of Catalyst Natural Gas LLC assets |
|
— |
|
(1,609 |
) |
— |
|
|||
|
Loan to PS Energy Group, Inc. related to purchase of GasKey assets |
|
— |
|
— |
|
(8,983 |
) |
|||
|
Cash received from PS Energy Group, Inc. for repayment of loan |
|
— |
|
— |
|
8,983 |
|
|||
|
Purchase of GasKey assets of PS Energy Group, Inc. |
|
(433 |
) |
(500 |
) |
(13,011 |
) |
|||
|
Purchase of assets of Vantage Power Services L.P. |
|
(36 |
) |
(57 |
) |
(778 |
) |
|||
|
Net cash used in investing activities |
|
(1,797 |
) |
(3,167 |
) |
(15,748 |
) |
|||
|
|
|
|
|
|
|
|
|
|||
|
Financing activities: |
|
|
|
|
|
|
|
|||
|
Repayment of Floating Rate Notes due 2011 |
|
(26,700 |
) |
— |
|
— |
|
|||
|
Repurchase of Floating Rate Notes due 2011 |
|
— |
|
— |
|
(12,006 |
) |
|||
|
Repayment of Fixed Rate Notes due 2014 |
|
(423 |
) |
— |
|
— |
|
|||
|
Proceeds from Denham Credit Facility |
|
— |
|
12,000 |
|
— |
|
|||
|
Repayments of Denham Credit Facility |
|
(12,000 |
) |
— |
|
(11,040 |
) |
|||
|
Proceeds from Bridge Financing under the Revolving Credit Facility |
|
— |
|
10,400 |
|
— |
|
|||
|
Repayment of Bridge Financing under the Revolving Credit Facility |
|
(5,400 |
) |
(5,000 |
) |
— |
|
|||
|
Proceeds from cash advanced under the Revolving Credit Facility |
|
— |
|
30,000 |
|
— |
|
|||
|
Repayment of cash advances under the Revolving Credit Facility |
|
— |
|
(30,000 |
) |
— |
|
|||
|
Debt issuance costs |
|
(6,248 |
) |
(10,066 |
) |
(1,307 |
) |
|||
|
Issuance of common stock from exercise of warrants and options |
|
— |
|
— |
|
387 |
|
|||
|
Issuance of common stock from other executive compensation |
|
— |
|
— |
|
952 |
|
|||
|
Purchase and cancellation of treasury shares, net of tax benefit |
|
(99 |
) |
(11 |
) |
(755 |
) |
|||
|
Stock issuance costs |
|
(329 |
) |
— |
|
— |
|
|||
|
Net cash (used in) provided by financing activities |
|
(51,199 |
) |
7,323 |
|
(23,769 |
) |
|||
|
Net decrease in cash |
|
(17,046 |
) |
(48,692 |
) |
(64,984 |
) |
|||
|
Cash and cash equivalents at beginning of year |
|
23,266 |
|
71,958 |
|
136,942 |
|
|||
|
Cash and cash equivalents at end of year |
|
$ |
6,220 |
|
$ |
23,266 |
|
$ |
71,958 |
|
|
|
|
|
|
|
|
|
|
|||
|
Supplemental cash flow information: |
|
|
|
|
|
|
|
|||
|
Income taxes paid |
|
$ |
1,847 |
|
$ |
431 |
|
$ |
5,405 |
|
|
Interest paid |
|
20,072 |
|
31,616 |
|
29,426 |
|
|||
The accompanying notes are an integral part of these consolidated financial statements.
MXENERGY HOLDINGS INC.
Notes to Consolidated Financial Statements
Note 1. Organization
MXenergy Holdings Inc. (“Holdings”), originally founded in 1999 as a retail energy marketer, was incorporated as a Delaware corporation on January 24, 2005 as part of a corporate reorganization. The two principal operating subsidiaries of Holdings, MXenergy Inc. and MXenergy Electric Inc., are engaged in the marketing and supply of natural gas and electricity, respectively. Holdings and its subsidiaries (collectively, the “Company”) operate in 41 market areas located in 14 states in the United States (the “U.S.”) and two Canadian provinces.
Note 2. Significant Accounting Policies
Basis of Presentation
The accounting and reporting policies of the Company conform to accounting principles generally accepted in the United States of America (“U.S. GAAP”). Certain reclassifications have been made to prior year amounts to conform to the current year’s presentation. Customer acquisition costs of $22.3 million, $15.3 million and $19.6 million were reclassified from investing activities to operating activities on the consolidated statements of cash flows for the fiscal years ended June 30, 2010, 2009 and 2008, respectively.
Principles of Consolidation
The Company owns 100% of all of its subsidiaries. Accordingly, the consolidated financial statements include the accounts of Holdings and all of its subsidiaries. Intercompany accounts and transactions have been eliminated in consolidation.
Use of Estimates and Assumptions
The preparation of financial statements in accordance with U.S. GAAP requires management to make estimates and assumptions that affect amounts reported in the consolidated financial statements and accompanying notes. Estimates used in connection with revenue recognition, fair value measurements, allowance for doubtful accounts, valuation of goodwill and other intangible assets, tax-related reserves and share-based compensation are often complex and may significantly impact the amounts reported for those items. Although management uses its best judgment based on information available at the time such judgments are made, actual results could differ from estimated amounts.
Revenue Recognition
Sales of Natural Gas and Electricity
Revenues from the sale of natural gas and electricity are recognized in the period in which customers consume the commodity. Sales of natural gas and electricity are generally billed by the local distribution companies (“LDCs”), acting as the Company’s agent, on a monthly cycle basis, although the Company performs its own billing for certain of its market areas. The billing cycles for customers do not coincide with the accounting periods used for financial reporting purposes. The Company follows the accrual method of accounting for revenues whereby revenues applicable to natural gas and electricity consumed by customers, but not yet billed under the cycle billing method, are estimated and accrued along with the related costs, and included in operations. Such estimates are refined in subsequent periods upon obtaining final information from the LDC. Changes in these estimates are reflected in operations in the period in which they are refined.
Passthrough Revenues
Revenues include certain “passthrough” revenues, which represent transportation charges billed to customers by certain LDCs. These revenues are offset by corresponding amounts in cost of goods sold for amounts billed to the Company by the LDC.
Fees Charged to Customers
Various fees charged to customers, such as late payment fees, early contract termination fees, service shut-off fees and fees charged to customers for providing copies of bills, are generally recorded as revenue when collection is deemed to be reasonably assured. Late payment fees charged in all markets, and various other fees charged in certain markets are recorded as revenue when billed to the customer. Certain other fees are recorded as revenue when actually collected from the customer.
Deferred Revenue
Customers who are on budget-billed plans pay for their natural gas or electricity at ratable monthly amounts, based on estimated annual usage, while the Company records revenue when the customer consumes the commodity. The cumulative difference between actual usage for these customers and the budget-billed amount actually invoiced, net of cash payments made by the customers, is equal to the net budget-billed variance. If the net budget-billed variance is a receivable from the customer at the balance sheet date, indicating that the customer’s actual usage has exceeded amounts billed to the customer, the amount is reported as accounts receivable in the consolidated balance sheets. If the net budget-billed variance is a liability to the customer, indicating that amounts billed have exceeded actual usage, the amount is reported as deferred revenue in the consolidated balance sheets.
Sales Incentives
Cash rebates paid to customers under the terms of certain product agreements are recorded as a reduction of sales revenue. Non-cash incentives, such as free products or services, are recorded as marketing expenses.
Collections of Sales Tax
Sales tax is added to customer bills for many of the markets served by the Company. Sales tax collected from customers on behalf of governmental entities is recorded on a net basis. Such amounts are excluded from the Company’s revenues and are recorded in accounts payable and accrued liabilities on the consolidated balance sheets until they are remitted to the appropriate governmental entities.
Fair Value of Financial Instruments
The fair value of a financial instrument is the amount at which the instrument could be exchanged in a current transaction between willing parties, other than in a forced or liquidation sale. Where available, the Company uses quoted market prices as estimates of the fair value of financial instruments. For financial instruments without quoted market prices, fair value represents management’s best estimate based on a range of methods and assumptions, which are described below. The use of different assumptions could significantly affect the estimates of fair value. Accordingly, the net values realized upon liquidation of the financial instruments could be materially different from the estimated fair values presented.
Short-term Financial Assets and Liabilities
The carrying value of certain financial assets and liabilities carried at cost is considered to approximate fair value because they are short-term in nature, bear interest rates that approximate market rates and generally have minimal credit risk. These items include cash and cash equivalents, restricted cash, accounts receivable, accounts payable and accrued liabilities, deferred revenue and short-term financing arrangements.
The Company had $0 and $22.1 million invested in money market funds at June 30, 2010 and 2009, respectively. Each share of the money market funds was valued at $1.00 at June 30, 2009.
Derivatives
Derivatives are recorded at fair value. Since the Company has not elected to designate any derivatives as accounting hedges, any changes in fair value are adjusted through unrealized losses (gains) from risk management activities, net (for commodity derivatives) or interest expense, net of interest income (for interest rate swaps) in the consolidated statements of operations, with related outstanding settlement amounts recorded in unrealized gains asset accounts and unrealized losses liability accounts in the consolidated balance sheets.
As of June 30, 2010, natural gas, electricity and interest rate derivative instruments are generally with a single counterparty under the Company’s Commodity Supply Facility. The Company generally enters into master netting agreements with hedge counterparties for settlement of derivative fair value assets and liabilities. The Company records such fair value assets and liabilities net on the consolidated balance sheets.
The Company generally utilizes a market approach for its recurring fair value measurements. In forming its fair value estimates, the Company utilizes the most observable inputs available for the respective valuation technique. If a fair value measurement reflects inputs from different levels within the fair value hierarchy, the measurement is classified based on the lowest level of input that is significant to the fair value measurement. The key inputs and assumptions utilized for the fair value measurements recorded by the Company are summarized as follows:
Financial natural gas derivative contracts — NYMEX-referenced swaps are valued utilizing unadjusted market commodity quotes from a pricing service, which are considered to be quotes from an active market, but are deemed to be Level 2 inputs because the swaps are not an identical instrument to the NYMEX-referenced commodity. Basis swaps and options are generally valued using observable broker quotes. Other inputs and assumptions include contract position volume, price volatility, commodity delivery location, credit quality of the Company and of derivative counterparties, credit enhancements, if any, and time value.
Financial electricity derivative contracts — Electricity swaps are valued utilizing market commodity quotes from a pricing service, which are deemed to be observable inputs. Other inputs and assumptions include contract position volume, price volatility, commodity delivery location, credit quality of the Company and of derivative counterparties, credit enhancements, if any, and time value.
Physical forward natural gas and electricity derivative contracts — The Company utilizes market commodity quotes from a pricing service to value these instruments, which are deemed to be observable inputs. Other inputs and assumptions include contract position volume, commodity delivery location, credit quality of the Company and of derivative counterparties, credit enhancements, if any, and time value.
Interest rate swaps — Interest rate swaps are valued utilizing quotes received directly from swap counterparties. Key inputs and assumptions include interest rate curves, credit quality of the Company and of derivative counterparties, credit enhancements, if any, and time value.
Refer to Note 15 of these consolidated financial statements for additional information regarding the fair value of financial instruments.
Long-term Debt
At June 30, 2010, long-term debt includes the aggregate outstanding principal amount of Fixed Rate Notes due 2014 and Floating Rate Notes due 2011. The carrying values of long-term debt instruments are not necessarily indicative of fair value due to changing market conditions and terms for similar unsecured instruments. The Company has elected not to record these financial instruments at fair value at June 30, 2010. Refer to Note 15 of the consolidated financial statement for additional information regarding the fair value of financial instruments.
Foreign Currency Translation
The Company has Canadian operations that are measured using Canadian dollars as the functional currency. Assets and liabilities are translated into U.S. dollars at the rate of exchange in effect on the balance sheet date. Income and expenses are translated at the average daily exchange rate for the month of activity. Net exchange gains or losses resulting from such translation are included in common stockholders’ equity as a component of accumulated other comprehensive loss.
Cash and Cash Equivalents
The Company’s cash and cash equivalents consist primarily of cash on deposit and money market accounts.
Restricted Cash
Restricted cash consists of: (1) cash and money market funds required as security for surety bonds required by LDCs, utility commissions and pipeline tariffs and regulations at June 30, 2010 and 2009; (2) cash deposits received from customers as of June 30, 2010 and 2009; (3) cash and money market funds required as security for letters of credit issued under the Company’s Revolving Credit Facility as of June 30, 2009; and (4) money market funds held in escrow as contingent consideration related to acquisitions as of June 30, 2009.
Accounts Receivable and Allowance for Doubtful Accounts
The Company delivers natural gas and electricity to its customers through LDCs, many of which guarantee amounts due from customers for consumed natural gas and electricity. Accounts receivable, net primarily represents amounts due for commodity consumed by customers, net of an allowance for estimated amounts that will not be collected from customers. For those markets where accounts receivable are guaranteed by LDCs, the Company pays guarantee discounts that average approximately 1% of billed accounts receivable, which are charged to reserves and discounts in the consolidated statements of operations as revenue is billed. The Company does not maintain an allowance for doubtful accounts related to accounts receivable in guaranteed markets, as it does not expect to incur material credit losses from any of the respective LDCs.
In markets where no LDC guarantees exist, the Company calculates and records an allowance for doubtful accounts based on aging of accounts receivable balances, collections history, past loss experience and other current economic or other trends. Charge offs of accounts receivable balances are recorded as reductions of the allowance for doubtful accounts during the month when the accounts are transferred to outside collection agencies. Delinquency status for customer accounts is based on the number of days an account balance is outstanding past an invoice due date. Accounts are generally reviewed for transfer to collection agencies by 120 days from the initial invoice date. Recoveries of accounts receivable balances previously charged off are recorded when received as reductions from reserves and discounts in the consolidated statements of operations. Adjustments to the allowance for doubtful accounts are recorded in reserves and discounts in the consolidated statements of operations.
Accounts receivable also includes cash imbalance settlements that represent the value of excess natural gas delivered to LDCs for consumption by our customers and actual customer usage. The Company expects such imbalances to be settled in cash in accordance with contractual payment arrangements. The Company bears credit risk related to imbalance settlement receivables to the extent that such LDCs are unable to collect imbalance settlements payable to them by other retail marketers. The Company records an allowance for doubtful accounts during the month that full collection of any such imbalance receivable balance becomes doubtful, with a corresponding charge to reserves and discounts.
Natural Gas Inventories
Natural gas inventories are valued at the lower of cost or market value on a weighted-average cost basis. The weighted-average cost of inventory includes related transportation and storage costs. Natural gas inventories also include estimated commodity delivery/usage imbalance settlement amounts that represent natural gas to be transferred to the Company from various third parties within the upcoming twelve-month period.
Adjustments to the value of natural gas inventories on the consolidated balance sheets result in corresponding adjustments to cost of goods sold on the consolidated statements of operations. Such adjustments result from changes in inventory storage levels as natural gas is delivered to customers as well as changes in the weighted average cost of natural gas in storage.
Other Current Assets
Other current assets primarily include: (1) security deposits placed with commodity and other suppliers as collateral for future purchases in lieu of letters of credit or other credit enhancements; and (2) prepaid expenses and deferred charges, which include costs incurred that pertain to future benefit periods not exceeding twelve months. These costs are amortized to appropriate expense lines on the consolidated statement of operations over their estimated benefit period.
Business Combinations and Goodwill
Since its organization in 1999 and through June 30, 2009, the Company acquired the natural gas and electricity operations of numerous energy companies, each of which was recorded as a purchase business combination. For all purchase business combinations recorded through June 30, 2009, the purchase price was allocated to the net assets acquired based on their estimated fair values at the acquisition date. Costs incurred to effect the purchase business combination transaction (e.g., legal, accounting, valuation and other professional or consulting fees) were added to the costs of the acquisition and allocated accordingly to the net assets acquired. Certain intangible assets, such as customer acquisition costs and goodwill, were recorded as a result of purchase business combinations to the extent that the purchase price exceeded the values assigned to identifiable net assets. The initial purchase price allocation was reviewed and adjusted for a period of twelve months subsequent to the acquisition date as new or revised information became available.
The Company has determined that its natural gas and electricity reporting units correspond with its business segments for management and financial reporting purposes.
Effective July 1, 2009, assets acquired and liabilities assumed for purchase business combinations, if any, are recorded at their estimated fair values, regardless of their cost. Costs incurred to effect such transactions are recognized separately from the acquisition transaction and generally are expensed during the periods in which the costs are incurred and the services are received. Restructuring costs that the Company was not obligated to incur are also recognized separately from the purchase business combination transaction.
As of June 30, 2009, goodwill of $3.8 million represents the excess of purchase price over the fair value of identifiable natural gas net assets acquired from Shell Energy Services Company L.L.C. (“SESCo”) in August 2006. The Company assigned this goodwill to its natural gas business segment. Goodwill is not amortized, but rather is reviewed for impairment at least annually or more frequently if events or changes in circumstances indicate that the carrying amount may not be recoverable. Goodwill is tested for impairment annually at June 30. The Company utilizes a combination of methods to estimate the fair value of its natural gas reporting unit, including a discounted cash flows methodology for near-term
estimable earnings and a discounted multiple of earnings methodology to estimate a terminal value. Critical assumptions used for the fair value model include:
· earnings forecasts for the natural gas business segment for fiscal years 2011 through 2014, which reflect assumptions for growth in natural gas RCEs (net of attrition), expected gross profit and expense trends;
· a terminal value multiple; and
· the discount rate used to calculate the present value of future cash flows.
Customer Acquisition Costs, Net
The Company capitalizes costs associated with the acquisition of customers to the extent that they are incremental direct costs and that such costs can be recovered from the future economic benefit resulting from the customer relationship. The Company acquires customers as a result of the following activities:
· bulk acquisitions and business combinations;
· payments to third-party contractors for success-based marketing activities;
· payments to third-party contractors for hourly paid direct-response telemarketing activities.
Customer portfolios acquired through asset purchase acquisitions and business combinations are recorded at their allocated purchase price and amortized on a straight-line basis over the estimated life of the customers acquired. The Company currently estimates a three-year life for these assets. For customer portfolios acquired prior to July 1, 2009, the Company adjusts the acquisition cost for contingent consideration paid subsequent to the acquisition date in accordance with the terms of the respective acquisition agreement. The Company last acquired a customer portfolio in October 2008.
Success-based marketing costs are incremental direct costs incurred and paid by the Company in connection with arrangements with third-party contractors. These costs represent customer contract origination fees paid to third party contractors for each customer that is approved and confirmed as a new customer. The Company currently amortizes these assets over their estimated three-year life.
Hourly paid direct-response telemarketing costs are incremental direct costs incurred and paid by the Company in connection with arrangements with third-party contractors. These contractors are paid on an hourly basis with the expectation that they originate an agreed-upon minimum average number of new customers for every hour worked. Hourly paid direct-response telemarketing costs are capitalized by the Company to the extent that:
· there is a direct relationship between the acquisition of a customer and the cost being deferred;
· the purpose of the hourly paid telemarketing program is to elicit direct responses from customers in the form of sales in connection with customer contracts; and
· it is probable the deferred costs will be recovered from the future economic benefit resulting from the customer relationship.
Hourly paid direct-response telemarketing costs are amortized over the period during which the future economic benefits are expected to be realized. The Company currently estimates a three-year benefit period for these assets.
Amortization of customer acquisition costs is included in depreciation and amortization on the consolidated statement of operations.
The following costs are expensed as incurred by the Company, and are included in advertising and marketing expenses on the consolidated statement of operations:
· administrative costs, occupancy costs or the cost of various advertising media, such as radio advertising, print advertising and billboards, that can not be associated directly with customer generation;
· fees paid for lead generation or any other activity that does not result in generation of confirmed customers; and
· costs incurred to renew or extend the term of customer contracts.
Fixed Assets, Net
Fixed assets consist primarily of computer hardware and software, office equipment and furniture. Fixed assets are stated at cost on the consolidated balance sheets, less accumulated depreciation. Depreciation is recorded on a straight-line basis over the estimated useful lives of the related assets, which generally range from three to five years. Depreciation expense is reported in depreciation and amortization on the consolidated statements of operations. Costs of maintenance and repairs to
fixed assets are generally expensed as incurred, and reported in general and administrative expenses on the consolidated statements of operations.
Capitalized Software Costs
The Company capitalizes costs of software acquisition and development projects, including costs related to software design, configuration, coding, installation, testing and parallel processing. Capitalized software costs are recorded in fixed assets, net of accumulated amortization, on the consolidated balance sheets. Capitalized software development costs generally include:
· external direct costs of materials and services consumed to obtain or develop software for internal use;
· payroll and payroll-related costs for employees who are directly associated with and who devote time to the project, to the extent of time spent directly on the project;
· costs to obtain or develop software that allows for access or conversion of old data by new systems;
· costs of upgrades and/or enhancements that result in additional functionality for existing software; and
· interest costs incurred while developing internal-use software that could have been avoided if the expenditures had not been made.
The following software-related costs are generally expensed as incurred and recorded in general and administrative expenses on the consolidated statements of operations:
· research costs, such as costs related to the determination of needed technology and the formulation, evaluation and selection of alternatives;
· costs to determine system performance requirements for a proposed software project;
· costs of selecting a vendor for acquired software;
· costs of selecting a consultant to assist in the development or installation of new software;
· internal or external training costs related to software;
· internal or external maintenance costs related to software;
· costs associated with the process of converting data from old to new systems, including purging or cleansing existing data, reconciling or balancing of data in the old and new systems and creation of new data;
· updates and minor modifications; and
· fees paid for general systems consulting and overall control reviews that are not directly associated with the development of software.
The costs of computer software obtained or developed for internal use is amortized on a straight-line basis over the estimated useful life of the software. Amortization begins when the software and all related software modules on which it is functionally dependant are ready for their intended use. Amortization expense is recorded in depreciation and amortization in the consolidated statements of operations. The Company’s amortization period does not exceed five years for any capitalized software project.
Capitalized software costs are evaluated for recoverability whenever events or changes in circumstances indicate that its carrying amount may not be recoverable, including when:
· existing software is not expected to provide future service potential;
· it is no longer probable that software under development will be completed and placed in service; and
· costs of developing or modifying internal-use software significantly exceed expected development costs or costs of comparable third-party software.
Income Taxes
The Company files a consolidated federal U.S. income tax return that includes all of its consolidated subsidiaries, as well as various U.S. state returns. For operations in Canada, a Canadian federal tax return is filed, as well as an Ontario provincial return.
Deferred income taxes reflect the net tax effects of temporary differences between the carrying amount of assets and liabilities for financial reporting purposes and the amounts used for income tax purposes using enacted tax rates expected to be in effect for the year in which the temporary differences are expected to reverse. The Company records a valuation allowance if it is “more likely than not” that the related tax benefits will not be realized.
Derivatives and Hedging Activities
Commodity Derivatives
The Company utilizes physical and financial derivative instruments to reduce its exposure to fluctuations in the price of natural gas and electricity. Commodity derivatives utilized typically include, swaps, forwards and options that are bilateral contracts with counterparties. In addition, certain contracts with customers are also accounted for as derivatives. The Company has not elected to designate any derivative instruments as hedges under U.S. GAAP guidelines. Accordingly, any changes in fair value during the term of a derivative contract are adjusted through unrealized losses (gains) from risk management activities in the consolidated statements of operations with offsetting adjustments to unrealized gains or unrealized losses from risk management activities in the consolidated balance sheets. Unrealized gains from risk management activities on the consolidated balance sheets represent receivables from various derivative counterparties, net of amounts due to the same counterparties when master netting agreements exist. Unrealized losses from risk management activities represent liabilities to various derivative counterparties, net of receivables from the same counterparties when master netting agreements exist. Settlements on the derivative instruments are realized monthly and are generally based upon the difference between the contract price and the settlement price as quoted on the New York Mercantile Exchange (“NYMEX”) or other published index.
The recorded fair values of derivative instruments reflect management’s best estimate of market value, which takes into account various factors including closing exchange and over-the-counter quotations, parity differentials and volatility factors underlying the commitments. In addition, the recorded fair values are discounted to reflect counterparty credit risk and time value of settlement.
As of June 30, 2009, the Company had forward physical contracts to purchase natural gas and electricity. Based on the terms of these agreements, the Company had elected to treat all such contracts as “normal purchases” under U.S. GAAP, and therefore the contracts were not reported on the consolidated balance sheets at June 30, 2009.
Under the terms of the Commodity Supply Facility, most of the outstanding physical forward agreements for the purchase of natural gas, and all physical forward agreements for the purchase of electricity, were novated to RBS Sempra during the fiscal year ended June 30, 2010. Based upon the terms of the ISDA Master Agreements, certain of these novated agreements no longer qualify as “normal purchases.” Since the novation dates of these agreements, changes in fair value have been reflected in earnings and recorded in unrealized gains and/or unrealized losses from risk management activities on the consolidated balance sheets at June 30, 2010. These agreements are included in the June 30, 2010 fair value measurements reported in Note 15.
Interest Rate Swaps
The Company utilizes interest rate swaps to reduce its exposure to interest rate fluctuations related to its credit facility and floating rate debt. The swaps are fixed-for-floating and settle against the six-month LIBOR rate. None of the interest rate swaps has been designated as a hedge, and accordingly, these instruments are carried at fair value on the consolidated balance sheets with changes in fair value recorded as adjustments to interest expense.
Debt
Debt instruments are recorded at their face amounts on the consolidated balance sheets, less any discount or plus any premium. Debt that the Company expects to repay within one year is classified as a current liability.
Debt Issue Discounts and Debt Issuance Costs
Debt issue discounts are recorded as decreases to recorded debt balances and are amortized to interest expense over the remaining life of the related debt instrument. Certain costs that are directly related to the issuance of debt, such as financing transaction fees, underwriting fees, legal fees and other professional services, are deferred and recorded in other assets on the Company’s consolidated balance sheets and amortized to interest expense over the remaining life of the related debt instrument. In the event that debt instruments are partially or entirely repaid by the Company, a pro rata portion of related discount and debt issue costs are recorded as an increase to interest expense.
Early Extinguishment of Debt
During the period from August 2006 through June 30, 2009, the Company purchased approximately $24.8 million in aggregate principal amount of Floating Rate Notes due 2011 from the holders of the notes. These transactions were recorded
as early extinguishments of debt. Gains from these transactions, which result from the discounts paid by the Company for outstanding Floating Rate Notes due 2011, were recorded as adjustments to interest expense.
Interest Expense
Interest expense includes:
· interest incurred for various debt instruments;
· fees incurred for issuance of letters of credit and other transactions related to the Company’s supply, hedging and credit agreements;
· amortization of debt issue discount and deferred debt issue costs; and
· changes in the fair market value of interest rate swaps entered into by the Company to economically hedge its floating rate interest exposure.
Interest expense on the consolidated statements of operations is presented net of interest income earned from cash and cash equivalents and restricted investments.
Redeemable Convertible Preferred Stock
At June 30, 2009, redeemable convertible preferred stock (the “Preferred Stock”) was recorded at its estimated redemption value outside of stockholders’ equity on the consolidated balance sheets since it was redeemable at the option of the holders of the Preferred Stock and it was probable that the Preferred Stock became redeemable at June 30, 2009. On September 22, 2009, in connection with the Restructuring, the Preferred Stock was converted into the newly authorized Class C Common Stock. Refer to Notes 3 and 18 for additional information regarding Preferred Stock.
Adjustments to the carrying value of the Preferred Stock to its estimated redemption value were recorded as a charge against retained earnings or, in the absence of retained earnings, by charges against additional paid-in capital. The $25.9 million excess of the redemption value over the aggregate fair value of common stock issued to the preferred shareholders in connection with the Restructuring was reclassified to stockholders’ equity on the consolidated balance sheets.
Stock Based Compensation
Through September 22, 2009, the Company had three stock-based compensation plans in effect, under which stock options to acquire the Company’s common stock were granted to employees, directors and other non-employees of the Company. In addition, the Company issued warrants to purchase its common stock to certain employees and non-employees that were not issued under any of its three approved stock-based compensation plans.
For stock option awards granted after June 30, 2006, the Company recognized compensation expense prospectively over the vesting period. Compensation expense for option awards subject to graded vesting was recognized based on the accelerated attribution method as specified under U.S. GAAP guidelines. The fair value of each option award granted subsequent to June 30, 2006 was estimated on the grant date using a Black-Scholes-Merton option valuation model. Certain key assumptions used in the model included share price volatility, expected term, risk-free interest rate and expected forfeiture rate. Total compensation expense to be recognized over the vesting period was based on: (1) the fair value of the Company’s common stock at the quarterly reporting date immediately prior to the grant date; and (2) the total number of options expected to be exercised, net of expected forfeitures. The cumulative effect on current and prior periods of a change in the number of options expected to be exercised, net of forfeitures, was recognized in compensation expense in the period of the change.
For stock option awards granted to employees prior to June 30, 2006, compensation expense was measured based on the intrinsic value of the stock or stock option at the grant date. For options granted to employees prior to June 30, 2006, the Company was not required to recognize compensation expense during the fiscal years ended June 30, 2009, 2008 or 2007 because the exercise price for all such awards equaled or exceeded the estimated fair value of the Company’s common stock at the grant date.
Prior to June 30, 2006, the Company issued warrants to certain employees and non-employees that permitted the warrant holder the option to: (1) exercise such warrant for cash; or (2) exercise by withholding that number of common shares having a total fair value equal to the warrant exercise amount from the total number of common shares that would otherwise have been issued upon exercise of the warrant (a “cashless exercise”). Compensation cost was recorded as expense over the vesting period of such warrants using the accelerated expense attribution method. For these awards, it was presumed that the employee would elect the cashless exercise and compensation expense was adjusted periodically to reflect the amount by which the estimated current fair value of the Company’s common shares exceeded the exercise price of the warrant (known as “variable plan accounting”). Increases or decreases in the estimated fair value of the Company’s common stock between
the grant date and the exercise date resulted in corresponding increases or decreases, respectively, in compensation expense in the period in which the change in estimated fair value of common stock occurred. Accrued compensation for an award that was subsequently forfeited or cancelled was adjusted by decreasing compensation expense in the period of forfeiture or cancellation.
In connection with the Company’s debt and equity restructuring that was completed in September 2009 (the “Restructuring”), the Company terminated its three existing stock-based compensation plans and offered cash settlements to holders of options and warrants in exchange for their agreement to cancel and terminate such options and warrants. Compensation expense associated with awards under these plans was recorded through September 22, 2009. All outstanding options and warrants as of June 30, 2009 were cancelled and terminated as of September 22, 2009. Cash settlement payments of approximately $0.2 million were recorded as general and administrative expense during the fiscal year ended June 30, 2010.
In January 2010, Holdings’ Board of Directors authorized the creation of the MXenergy Holdings Inc. 2010 Stock Incentive Plan (the “2010 SIP”), pursuant to which the Company may issue Class C Common Stock not to exceed 10% of Holdings’ outstanding common stock (on a fully diluted basis) after giving effect to the Restructuring. Also in January 2010, Holdings’ Board of Directors approved grants of restricted stock units (“RSUs”) to certain senior officers, directors and a former director, pursuant to which the Company may issue approximately 2.9 million shares of Class C Common Stock, representing 5% of Holdings’ outstanding common stock (on a fully diluted basis), subject to prescribed vesting requirements. The grant date fair value of the RSUs is based on: (1) the number of RSUs granted; (2) the estimated fair value of the Company’s Class C Common Stock on the grant date; and the estimated forfeiture rate over the term of the award vesting periods.
Since the Company’s common stock is not publicly traded, there is no readily-available market source of information to estimate its fair value. Therefore, the Company utilizes an internal stock valuation model in order to calculate the grant-date fair value for stock-based compensation awards. At a minimum, the Company completes the stock valuation model on a quarterly basis, as of September 30th, December 31st, March 31st and June 30th of each fiscal year. For the June 30th model, the Company contracts with an independent valuation company to calculate a fair value at that date. For the remaining quarter-end valuation dates, the Company utilizes an internal valuation model that closely resembles the methodology utilized by the independent valuation company as of the previous June 30th valuation date. The grant date stock value assigned to stock-based compensation awards is generally determined from the most recently completed quarter-end valuation model, unless any matters arose during the time between the most recent quarter-end model and the grant date that would have had a material impact on the stock valuation.
Key estimates and assumptions used in the Company’s stock valuation models include:
· revenue and expense forecasts and assumed earnings multiples based on comparable companies; and
· a discount rate applied to the future cash flows assumed to result from future earnings.
The Company did not assume any forfeitures of RSUs in its calculation of compensation expense for the fiscal year ended June 30, 2010, since it expects no forfeitures by directors prior to October 1, 2010, which is the date on which the RSUs granted to directors will be completely vested without limitations, and no forfeitures by senior managers prior to September 22, 2010, which is the date on which the first third of the RSUs granted to senior managers will be completely vested without limitations. The forfeiture rate will be re-evaluated on each annual vesting date, or if any of the senior managers are terminated.
The RSUs granted in January 2010 are subject to a graded vesting schedule. Compensation expense is recognized based on the accelerated attribution method and is recorded in general and administrative expenses in the consolidated statements of operations.
Transactions with Related Parties
From time to time in the normal course of business, the Company enters into transactions with various non-employee related parties for financing arrangements, legal services, financial advisory services and management services. The Company utilizes accounting practices for these transactions that are consistent with similar transactions with unrelated third parties. Refer to Note 20 of the consolidated financial statements for a summary of the Company’s related party transactions.
Note 3. New Accounting Pronouncements
Accounting Pronouncements Adopted During the Fiscal Year Ended June 30, 2010
In June 2009, the Financial Accounting Standards Board (the “FASB”) issued Statement of Financial Accounting Standards No. 168, “The FASB Accounting Standards Codification and the Hierarchy of Generally Accepted Accounting Principles — a replacement of FASB Statement No. 162” (“SFAS No. 168”). Effective for financial statements issued for interim and
annual periods ending after September 15, 2009, the Accounting Standards Codification (the “ASC”) supersedes all existing accounting and reporting standards, excluding those issued by the SEC, and is now the single source of authoritative U.S. GAAP for entities that are not SEC registrants. Rules and interpretative releases of the SEC are also sources of U.S. GAAP for SEC registrants. The Company adopted the provisions of SFAS No. 168 effective for the financial statements included in this Form 10-K. The adoption of SFAS No. 168, as codified by ASC Topic 105, “Generally Accepted Accounting Principles,” impacted the Company’s financial statement disclosures, but did not have any effect on its financial position or results of operations.
Effective July 1, 2009, the Company adopted ASC guidelines regarding accounting and reporting for business combinations that are consummated after July 1, 2009. These guidelines include certain changed principles and requirements related to: (1) recognition and measurements of identifiable assets acquired, liabilities assumed, goodwill acquired, any gain from a bargain purchase, and any noncontrolling interest in an acquired company; (2) application issues relating to accounting and disclosures for assets and liabilities arising from contingencies in a business combination; and (3) disclosures regarding business combinations in financial statements. The Company will apply the ASC guidelines prospectively to business combination transactions consummated after July 1, 2009, if any. The Company did not consummate any business combination transactions during the fiscal year ended June 30, 2010.
In August 2009, the FASB issued Accounting Standards Update No. 2009-05, “Fair Value Measurements and Disclosures” (“ASU 2009-05”). ASU 2009-05 amends ASC Topic 820, “Fair Value Measurements and Disclosures” by providing additional guidance clarifying the measurement of liabilities at fair value. The amendments prescribed by ASU 2009-05 became effective for the Company’s quarterly reporting period ending December 31, 2009 and did not have any impact on the Company’s financial position or results of operations.
In February 2010, the FASB issued Accounting Standards Update No. 2010-09, “Subsequent Events (Topic 855) — Amendments to Certain Recognition and Disclosure Requirements” (“ASU 2010-09”). ASU 2010-09 amends ASC Topic 855, “Subsequent Events,” by clarifying the scope of disclosure requirements related to subsequent events. The amendments prescribed by ASU 2010-09 became effective for the Company’s quarterly reporting period ending March 31, 2010 and did not have any impact on the Company’s financial position or results of operations. Refer to Note 25 for disclosures regarding subsequent events.
In January 2010, the FASB issued Accounting Standards Update No. 2010-06 (“ASU 2010-06”), which amends FASB ASC Topic 820, “Fair Value Measurements and Disclosures.” The amended guidance in ASU 2010-06 requires entities to disclose additional information regarding assets and liabilities that are transferred between levels of the fair value hierarchy. ASU 2010-06 also requires that required Level 3 disclosures regarding purchases, sales, issuances and settlements be reported on a gross basis. ASU 2010-06 clarifies existing guidance pertaining to the level of disaggregation at which fair value disclosures should be made and the requirements to disclose information about the valuation techniques and inputs used in estimating Level 2 and Level 3 fair value measurements. The amended guidance in ASU 2010-06 pertaining to disclosure of transfers between levels of the fair value hierarchy, the level of disaggregation of disclosures and disclosure of valuation techniques and inputs used in estimating Level 2 and Level 3 measurements became effective and were adopted for the Company’s quarterly reporting period ending March 31, 2010.
The requirement to disclose Level 3 purchases, sales, issuances and settlements on a gross basis will become effective for fiscal years (and for interim periods within those fiscal years) beginning after December 15, 2010. The Company intends to adopt these provisions effective for its quarterly reporting period ending September 30, 2011.
Note 4. Debt and Equity Restructuring
On September 22, 2009, the Company completed the Restructuring, which included a number of transactions and amendments to corporate documents.
Amendment and Restatement of Corporate Documents
On September 22, 2009, the Company’s Certificate of Incorporation and Bylaws were amended and restated, and the Company entered into new stockholder agreements with holders of various classes of newly authorized common stock. Effective July 27, 2010, the Company’s Certificate of Incorporation and Bylaws were further amended and restated and the stockholders agreement among holders of all classes of common stock dated September 22, 2009 (the “Stockholders Agreement”) was amended. The amended and restated Certificate of Incorporation dated September 22, 2009 authorized issuance of new classes of common stock and changed the size and composition of the Company’s board of directors (the “Board of Directors”). The amended and restated Certificate of Incorporation dated July 27, 2010 adjusts director and committee member compensation, reduces the number of committees of the board of directors and revises the definitions of “Financial Expert” and “Independent Director.” Refer to Note 19 for additional information regarding the Company’s common stock and Board of Directors.
Exchange of Floating Rate Notes due 2011 for Cash, Fixed Rate Notes due 2014 and Class A Common Stock
The Restructuring included a debt exchange transaction that was accounted for as a troubled-debt restructuring in accordance with U.S. GAAP, and therefore did not result in any gain or loss recorded in the consolidated statements of operations.
On September 22, 2009, the Company exchanged $158.8 million aggregate principal amount of outstanding Floating Rate Notes due 2011 for $26.7 million of cash, $67.8 million aggregate principal amount of 13.25% Senior Subordinated Secured Notes due 2014 (the “Fixed Rate Notes due 2014”) and 33,940,683 shares of newly authorized Class A Common Stock. In addition, $9.0 million was transferred from unrestricted cash to an escrow account (the “Fixed Rate Notes Escrow Account”), which is maintained as security for future interest payments to holders of the Fixed Rate Notes due 2014.
Refer to Note 17 for additional information regarding the Fixed Rate Notes due 2014 and the Floating Rate Notes due 2011.
New Master Supply and Hedge Facility
As of June 30, 2009, the Company relied on the following credit, commodity hedging and commodity supply arrangements for operation of its natural gas and electricity businesses:
· A credit facility (the “Revolving Credit Facility”) that was used primarily to post letters of credit required to effectively operate within the markets that the Company serves;
· A hedge facility (the “Hedge Facility”) that was used as the Company’s primary facility to economically hedge variability in the cost of natural gas;
· Commodity derivative arrangements with various counterparties were used to economically hedge variability in the cost of electricity; and
· Arrangements with numerous commodity suppliers to supply the natural gas and electricity necessary for customer consumption in the markets that the Company serves.
Effective September 22, 2009 the Revolving Credit Facility and Hedge Facility were replaced by a new exclusive credit, supply and commodity hedging agreement (the “Commodity Supply Facility”) with Sempra Energy Trading LLC (“RBS Sempra”), which replaced the separate credit, hedging and supply arrangements described above. As a result of termination of the Revolving Credit Facility, $75.0 million of restricted cash held as collateral for obligations under the Revolving Credit Facility was released to unrestricted cash, which was used by the Company to fund various cash outlays in connection with the Restructuring.
Refer to Note 16 for additional information regarding the Commodity Supply Facility.
Conversion of Redeemable Convertible Preferred Stock to Class C Common Stock
As of June 30, 2009, the Company had 1,451,310 shares of Preferred Stock outstanding, which was recorded at its estimated redemption value of $54.6 million on the consolidated balance sheets. On September 22, 2009, all outstanding shares of Preferred Stock were exchanged for 11,862,551 shares of newly authorized Class C Common Stock. Refer to Note 18 for additional information regarding the Preferred Stock.
Repayment and Termination of the Credit Agreement with Denham Commodity Partners Fund LP
As of June 30, 2009, the Company had a $12.0 million outstanding balance under a credit agreement with Denham Commodity Partners LP (the “Denham Credit Facility”). On September 22, 2009, all amounts previously borrowed were repaid and the Denham Credit Facility was terminated. Refer to Note 20 for additional information regarding the Denham Credit Facility.
Repayment and Termination of Bridge Financing Loans
In connection with the Revolving Credit Agreement, Charter Mx LLC, Denham and four members of the Company’s senior management team agreed to provide Bridge Financing Loans in an aggregate amount of $10.4 million by becoming lenders in a new bridge loan tranche under the Revolving Credit Agreement. The Bridge Financing Loan from Charter Mx LLC was repaid, with accrued interest, in April 2009. The Bridge Financing Loans from all other lenders were repaid, with accrued interest, in connection with the Restructuring. Refer to Note 20 for additional information regarding the Bridge Financing Loans.
Settlement and Cancellation of Outstanding Stock Options and Warrants
As of June 30, 2009, the Company had options and warrants outstanding which were, or may be, exercisable for 1,008,770 shares of common stock. The vast majority of these options and all of the warrants were “out of the money” as of the consummation date of the Restructuring (e.g., the agreed-upon price for which the option/warrant holder may purchase the Company’s common stock exceeded the current fair value of the common stock). In connection with the Restructuring, the Company terminated its existing share-based compensation plans and offered a cash settlement to holders of options and warrants to cancel and terminate such options and warrants. Refer to Note 19 for additional information regarding equity-based incentive plans.
New Equity Incentive Plan and Bonuses
In connection with the Restructuring, the shareholders agreed to create a new equity-based incentive plan, pursuant to which the Company may issue Class C Common Stock not to exceed 10% of Holdings’ outstanding common stock (on a fully diluted basis) after giving effect to the Restructuring. In January 2010, Holdings’ Board of Directors authorized a new plan and approved grants of RSUs to certain senior officers, directors and a former director. Refer to Note 19 for additional information regarding equity-based incentive plans.
Other Restructuring Activity
In connection with various Restructuring transactions, the Company incurred $6.4 million of legal, consulting and other fees that were recorded as deferred debt issuance costs ($6.1 million) and stock issuance costs that were recorded as a reduction of additional paid in capital ($0.3 million). The deferred debt issue costs will be amortized as an increase to interest expense over the remaining terms of the related agreements.
The Company also recorded approximately $2.2 million of incremental, non-recurring expenses, including:
· Upon completion of the Restructuring, the Compensation Committee of the Board of Directors approved a total bonus pool of approximately $0.8 million, which was paid to 19 of the Company’s executive officers and employees, including the Company’s chief executive officer and chief financial officer. These bonuses were included in general and administrative expenses during fiscal year 2010.
· The Company incurred approximately $0.2 million of severance costs, included in general and administrative expenses during fiscal year 2010, which related to certain employees terminated in September 2009 as part of an initiative to streamline the Company’s organizational structure and control operating costs; and
· The Company incurred approximately $1.2 million of professional fees, included in general and administrative expenses during fiscal year 2010, in connection with various potential liquidity events considered during fiscal year 2009 and the first three months of fiscal year 2010.
Note 5. Seasonality of Operations
Natural gas and electricity sales accounted for approximately 82% and 18%, respectively, of the Company’s total sales for the fiscal year ended June 30, 2010. The majority of natural gas customer consumption occurs during the months of November through March. By contrast, electricity customer consumption peaks during the months of June through September. Because the natural gas business segment comprises such a large component of the Company’s overall business operations, operating results for the second and third fiscal quarters represent the vast majority of operating results for the Company’s full fiscal year.
Cash collections from the Company’s natural gas customers peak in the spring of each calendar year, while cash collections from electricity customers peak in late summer and early fall. The Company utilizes a considerable amount of cash from operations to meet working capital requirements during the months of November through March of each fiscal year. In addition, the Company utilizes considerable cash to purchase natural gas inventories during the months of April through October.
Weather conditions have a significant impact on customer demand and market prices for natural gas and electricity. Customer demand exposes the Company to a high degree of seasonality in sales, cost of sales, billing and collection of customer accounts receivable, inventory requirements and cash flows. In addition, budget billing programs and payment terms of LDCs can cause timing differences between the billing and collection of accounts receivable and the recording of revenues.
The impact of rapidly rising or falling commodity prices also varies greatly depending on the period of time in which they occur during the Company’s fiscal year. Although commodity price movements can have material short-term impacts on monthly and quarterly operating results, the Company’s economic hedging and contract pricing strategies are designed to reduce the impact of such trends on operating results for a full fiscal year. Therefore, the short-term impacts of changing commodity prices should be considered in the context of the Company’s entire annual operating cycle.
Note 6. Accounts Receivable, Net
Accounts receivable, net is summarized in the following table.
|
|
|
Balances at June 30, |
|
||||
|
|
|
2010 |
|
2009 |
|
||
|
|
|
(in thousands) |
|
||||
|
Billed customer accounts receivable: |
|
|
|
|
|
||
|
Guaranteed by LDCs |
|
$ |
11,736 |
|
$ |
7,768 |
|
|
Non-guaranteed by LDCs |
|
21,543 |
|
26,679 |
|
||
|
|
|
33,279 |
|
34,447 |
|
||
|
Unbilled customer accounts receivable (1): |
|
|
|
|
|
||
|
Guaranteed by LDCs |
|
10,206 |
|
5,737 |
|
||
|
Non-guaranteed by LDCs |
|
7,211 |
|
10,547 |
|
||
|
|
|
17,417 |
|
16,284 |
|
||
|
Total customer accounts receivable |
|
50,696 |
|
50,731 |
|
||
|
Less: Allowance for doubtful accounts |
|
(5,074 |
) |
(7,344 |
) |
||
|
Customer accounts receivable, net |
|
45,622 |
|
43,387 |
|
||
|
Cash imbalance settlements and other receivables, net (2) |
|
3,303 |
|
4,211 |
|
||
|
Accounts receivable, net |
|
$ |
48,925 |
|
$ |
47,598 |
|
(1) Unbilled customer accounts receivable represents estimated revenues associated with natural gas and electricity consumed by customers but not yet billed under the monthly cycle billing method utilized by LDCs.
(2) Cash imbalance settlements represent differences between natural gas delivered to LDCs for consumption by the Company’s customers and actual customer usage. The Company expects such imbalances to be settled in cash within the next 12 months in accordance with contractual payment arrangements with the LDCs.
The Company operates in 41 market areas located in 14 U.S. states and two Canadian provinces. The Company’s diversified geographic coverage mitigates the credit exposure that could result from concentrations in a single LDC territory or a single regulatory jurisdiction, from extreme local weather patterns or from an economic downturn in any single geographic region.
The Company has limited exposure to risk associated with high concentrations of sales volumes with individual customers. In April 2010, the Company began delivering natural gas to an LDC in Ohio as part of a new Standard Service Offer program (the “SSO Program”; refer to Note 22 for additional information). As a result of the Company’s participation in the SSO Program, the LDC in Ohio became the Company’s largest single customer during fiscal year 2010, accounting for approximately 3.6% of the Company’s natural gas sales volume.
The allowance for doubtful accounts represents the Company’s estimate of potential credit losses associated with customer accounts receivable in markets where such receivables are not guaranteed by LDCs. The Company assesses the adequacy of its allowance for doubtful accounts through review of the aging of customer accounts receivable and general economic conditions in the markets that it serves. Based upon this review as of June 30, 2010, and for the fiscal year then ended, the Company believes that its allowance for doubtful accounts is adequate to cover potential credit losses related to customer accounts receivable. An analysis of the allowance for doubtful accounts is provided in the following table.
|
|
|
Fiscal Year Ended June 30, |
|
|||||||
|
|
|
2010 |
|
2009 |
|
2008 |
|
|||
|
|
|
(in thousands) |
|
|||||||
|
Allowance for doubtful accounts: |
|
|
|
|
|
|
|
|||
|
Balance at beginning of period |
|
$ |
7,344 |
|
$ |
5,154 |
|
$ |
5,259 |
|
|
Add: Provision for doubtful accounts |
|
5,164 |
|
12,009 |
|
5,050 |
|
|||
|
Less: Net charge offs of customer accounts receivable |
|
(7,434 |
) |
(9,819 |
) |
(5,155 |
) |
|||
|
Balance at end of period |
|
$ |
5,074 |
|
$ |
7,344 |
|
$ |
5,154 |
|
|
|
|
|
|
|
|
|
|
|||
|
Allowance for doubtful accounts as a percentage of total customer accounts receivable in non-guaranteed markets |
|
17.6 |
% |
19.7 |
% |
9.7 |
% |
|||
|
Provision for doubtful accounts as a percentage of sales of natural gas and electricity in non-guaranteed markets |
|
1.79 |
% |
2.79 |
% |
1.19 |
% |
|||
Reserves and discounts in the consolidated statements of operations includes the provision for doubtful accounts related to
customer accounts receivable within markets where such receivables are not guaranteed by LDCs as well as discounts related to customer accounts receivable that are guaranteed by LDCs. For the fiscal year ended June 30, 2010, approximately 51% of the Company’s total sales of natural gas and electricity were within markets where LDCs do not guarantee customer accounts receivable while 49% of total sales were within markets where LDCs guarantee customer accounts receivable at a weighted average discount rate of approximately 1%. Such discount is the cost to guarantee the customer accounts receivable. In markets where the LDC guarantees customer accounts receivable, the Company is exposed to the credit risk of the LDC, rather than that of its customers. The Company monitors the credit ratings of LDCs and the parent companies of LDCs that guarantee customer accounts receivable. The Company also periodically reviews payment history and financial information for LDCs to ensure that it identifies and responds to any deteriorating trends. As of June 30, 2010, all of the Company’s customer accounts receivable in LDC-guaranteed markets were with LDCs with investment grade credit ratings.
The lower provision for doubtful accounts during fiscal year 2010 was primarily due to the following factors:
· Sales of natural gas and electricity in markets where customer accounts receivable are not guaranteed by LDCs decreased 33% during fiscal year 2010, as compared with the same period in the prior fiscal year;
· The aging of the Company’s customer accounts receivable deteriorated in certain of its larger markets in Georgia, Texas and the northeastern U.S. during fiscal year 2009, which resulted in charge-offs of customer accounts receivable and provisions for doubtful accounts for those markets that were higher than historical levels. Credit environments have generally stabilized in these markets during fiscal year 2010;
· The company’s acquisition of Catalyst Natural Gas, LLC in October 2008 resulted in higher reserves against customer accounts receivable deemed uncollectible and incremental charge-offs of customer accounts receivable, which contributed to a higher provision for doubtful accounts in the Company’s Georgia natural gas market during fiscal year 2009 and the first quarter of fiscal year 2010. There were no purchase acquisitions of customer accounts during fiscal year 2010 that resulted in incremental charge-offs or provisions for doubtful accounts; and
· During fiscal year 2009, the Company initiated more stringent credit standards for its new and existing customers, which resulted in generally higher credit quality in its customer portfolio during fiscal year 2010.
Note 7. Natural Gas Inventories
Natural gas inventories are summarized in the following table.
|
|
|
Balances at June 30, |
|
||||
|
|
|
2010 |
|
2009 |
|
||
|
|
|
(in thousands) |
|
||||
|
|
|
|
|
|
|
||
|
Storage inventory for delivery to customers |
|
$ |
9,956 |
|
$ |
24,457 |
|
|
Imbalance settlements in-kind (1) |
|
5,905 |
|
4,958 |
|
||
|
Total |
|
$ |
15,861 |
|
$ |
29,415 |
|
(1) Represents inventory to be transferred to the Company or its customers from LDCs as a result of an excess of natural gas deliveries over amounts used by customers in prior periods. The company expects these inventories to be transferred to the Company or its customers within the upcoming twelve-month period.
The volume of natural gas held in storage decreased 63% from 4,900,000 million British thermal units (“MMBtus”) at June 30, 2009 to 1.8 million MMBtus at June 30, 2010. Prior to the Restructuring, the Company managed storage capacity for its natural gas inventory. During the months of April through October, the Company traditionally purchased natural gas to be held in natural gas inventory until such inventory was transported to LDCs for distribution to the Company’s customers during the winter months. Natural gas inventories recorded on the consolidated balance sheets at June 30, 2009 included this activity.
In connection with the Commodity Supply Facility, the Company released a substantial portion of its storage capacity to RBS Sempra during the fiscal year ended June 30, 2010. The Company enters into physical forward contracts to purchase a similar quantity of natural gas from RBS Sempra during the winter months, at a cost that will approximate the cost to the Company had it retained that storage capacity. As of June 30, 2010, the Company had entered into physical forward contracts to purchase approximately 4.3 million MMBtus of natural gas from RBS Sempra.
The weighted-average cost per MMBtu of natural gas held in storage increased 9% from June 30, 2009 to June 30, 2010, which partially offset the impact of lower volume of natural gas held in storage by the Company.
Note 8. Goodwill
All of the Company’s goodwill is assigned to the natural gas business segment. The Company tests its goodwill for impairment annually at June 30. Material events, transactions and changes in circumstances are also evaluated for their
impact on the fair value of the natural gas business segment and the recorded value of goodwill. During the fiscal year ended June 30, 2010, the Company evaluated the impacts of various transactions consummated in connection with the Restructuring and concluded that they did not have any impact on the recorded carrying value assigned to goodwill.
The Company completed its annual impairment test of goodwill as of June 30, 2010 and determined that the fair value of the natural gas reporting unit exceeded its carrying value. As a result, no impairment loss was required to be recognized. Since the testing date, there were no material events, transactions or changes in circumstances that warranted consideration for their impact on the recorded carrying value assigned to goodwill.
Note 9. Customer Acquisition Costs, Net
Customer acquisition costs and related accumulated amortization are summarized in the following tables.
|
|
|
Balance at June 30, 2010 |
|
|||||||
|
|
|
Gross |
|
Accumulated |
|
Net Book Value |
|
|||
|
|
|
(in thousands) |
|
|||||||
|
Customer contracts acquired from: |
|
|
|
|
|
|
|
|||
|
Asset acquisitions and business combinations (1) |
|
$ |
8,196 |
|
$ |
6,424 |
|
$ |
1,772 |
|
|
Success-based third-party marketing activities |
|
42,010 |
|
17,237 |
|
24,773 |
|
|||
|
Hourly-paid, third-party direct-response telemarketing activities |
|
13,261 |
|
9,381 |
|
3,880 |
|
|||
|
Totals |
|
$ |
63,467 |
|
$ |
33,042 |
|
$ |
30,425 |
|
|
|
|
Balance at June 30, 2009 |
|
|||||||
|
|
|
Gross |
|
Accumulated |
|
Net Book |
|
|||
|
|
|
(in thousands) |
|
|||||||
|
Customer contracts acquired from: |
|
|
|
|
|
|
|
|||
|
Asset acquisitions and business combinations (1) |
|
$ |
48,832 |
|
$ |
42,553 |
|
$ |
6,279 |
|
|
Success-based third-party marketing activities |
|
24,438 |
|
8,620 |
|
15,818 |
|
|||
|
Hourly-paid third-party direct-response telemarketing activities |
|
16,306 |
|
10,453 |
|
5,853 |
|
|||
|
Totals |
|
$ |
89,576 |
|
$ |
61,626 |
|
$ |
27,950 |
|
(1) Includes the fair value of customer portfolios acquired in transactions accounted for as asset acquisitions or business combinations. Also includes contingent consideration paid by the Company subsequent to the acquisition date in accordance with the respective acquisition agreements.
Amortization expense relating to capitalized customer acquisition costs was approximately $19.8 million, $29.8 million and $23.4 million for the fiscal years ended June 30, 2010, 2009 and 2008, respectively. Amortization expense associated with customer acquisition costs capitalized as of June 30, 2010 is expected to approximate $17.0 million, $9.0 million and $4.4 million for the fiscal years ending June 30, 2011, 2012 and 2013, respectively.
The value and recoverability of customer acquisition costs are evaluated quarterly by comparing their carrying value to their projected future cash flows on an undiscounted basis. During the fiscal year ended June 30, 2010, no impairment was indicated as a result of these comparisons. Additionally, the Company evaluated the impacts of various transactions consummated in connection with the Restructuring and concluded that they did not have any impact on the recorded carrying value assigned to customer acquisition costs.
As of June 30, 2010, the weighted-average remaining amortization period for customer acquisition costs is approximately 1.6 years.
Note 10. Fixed Assets, Net
Fixed assets, net are summarized in the following table.
|
|
|
Balance at June 30, |
|
Estimated |
|
||||
|
Fixed Asset Category |
|
2010 |
|
2009 |
|
Lives |
|
||
|
|
|
(in thousands) |
|
|
|
||||
|
|
|
|
|
|
|
|
|
||
|
Computer equipment |
|
$ |
6,381 |
|
$ |
6,080 |
|
3 years |
|
|
Computer software and development |
|
22,273 |
|
25,607 |
|
3-5 years |
|
||
|
Office furniture and equipment |
|
1513 |
|
1,502 |
|
3-5 years |
|
||
|
|
|
30,167 |
|
33,189 |
|
|
|
||
|
Less: accumulated depreciation and amortization |
|
(27,428 |
) |
(29,461 |
) |
|
|
||
|
Fixed assets, net |
|
$ |
2,739 |
|
$ |
3,728 |
|
|
|
The Company capitalized approximately $1.0 million of software development costs during the fiscal years ended June 30, 2010 and 2009. Capitalized software costs related to various project designed to reduce the number of software systems utilized to service customer accounts and to enhance the overall capabilities of existing software. Amortization expense relating to capitalized computer software costs was approximately $1.8 million, $6.4 million and $7.7 million for the fiscal years ended June 30, 2010, 2009 and 2008, respectively.
Depreciation expense relating to computer equipment, office furniture and other equipment was approximately $0.6 million, $1.4 million and $1.6 million for the fiscal years ended June 30, 2010, 2009 and 2008, respectively.
Note 11. Other Current Assets
Other current assets are summarized in the following table.
|
|
|
Balance at |
|
||||
|
|
|
June 30, |
|
June 30, |
|
||
|
|
|
(in thousands) |
|
||||
|
Security deposits: |
|
|
|
|
|
||
|
Collateral required by hedging counterparties |
|
$ |
6,180 |
|
$ |
4,157 |
|
|
Collateral posted in connection with the SSO Program |
|
4,569 |
|
— |
|
||
|
Collateral required by transmission, pipeline and transportation counterparties |
|
3,295 |
|
5,202 |
|
||
|
Prepaid expenses |
|
1,448 |
|
1,332 |
|
||
|
Other |
|
780 |
|
1,393 |
|
||
|
Total other current assets |
|
$ |
16,272 |
|
$ |
12,084 |
|
Note 12. Income Taxes
Income tax benefit (expense) is summarized in the following table:
|
|
|
Fiscal Years ended June 30, |
|
|||||||
|
|
|
2010 |
|
2009 |
|
2008 |
|
|||
|
|
|
(in thousands) |
|
|||||||
|
Current: |
|
|
|
|
|
|
|
|||
|
Federal |
|
$ |
5,054 |
|
$ |
4,666 |
|
$ |
599 |
|
|
State |
|
(645 |
) |
(823 |
) |
434 |
|
|||
|
|
|
4,409 |
|
3,843 |
|
1,033 |
|
|||
|
Deferred: |
|
|
|
|
|
|
|
|||
|
Federal |
|
(16,312 |
) |
18,892 |
|
(15,000 |
) |
|||
|
State |
|
(2,789 |
) |
4,514 |
|
(3,188 |
) |
|||
|
|
|
(19,101 |
) |
23,406 |
|
(18,188 |
) |
|||
|
Total income tax (expense) benefit |
|
$ |
(14,692 |
) |
$ |
27,249 |
|
$ |
(17,155 |
) |
As of June 30, 2010, the Company has net operating loss carryforwards of approximately $2.6 million and $0.6 million related to its U.S. and Canadian operations, respectively. The net operating loss carryforwards related to U.S. operations will expire in fiscal year 2029. The net operating loss carryforwards related to Canadian operations will expire during fiscal years 2014 through 2030.
As a result of the Restructuring, the U.S. net operating loss carryforward that relates to operations prior to the Restructuring is subject to limitations that may affect the Company’s ability to utilize them in future periods. As of June 30, 2010, the Company is evaluating the potential impact of such limitations.
The provision for income taxes varied from income taxes computed at the statutory U.S. federal income tax rate as a result of the following:
|
|
|
Fiscal Years ended June 30, |
|
||||
|
|
|
2010 |
|
2009 |
|
2008 |
|
|
|
|
|
|
|
|
|
|
|
Federal statutory rate |
|
35.0 |
% |
35.0 |
% |
35.0 |
% |
|
State statutory rate, net of federal benefit |
|
4.0 |
|
3.9 |
|
4.5 |
|
|
Total statutory rate |
|
39.0 |
|
38.9 |
|
39.5 |
|
|
Impact of prior year adjustments on current and deferred income taxes |
|
2.2 |
|
— |
|
(0.6 |
) |
|
Impact of changing tax rates on prior year deferred balances |
|
(1.3 |
) |
— |
|
1.0 |
|
|
Impact of reversal of deferred tax asset for stock compensation expense |
|
6.3 |
|
— |
|
— |
|
|
Impact of permanent differences |
|
(0.4 |
) |
(0.2 |
) |
1.0 |
|
|
Impact of novated interest rate swaps |
|
(11.4 |
) |
|
|
|
|
|
Impact of recording valuation allowance |
|
20.8 |
|
(17.3 |
) |
— |
|
|
Other |
|
0.9 |
|
— |
|
— |
|
|
Effective tax rate |
|
56.1 |
% |
21.4 |
% |
40.9 |
% |
Major taxing jurisdictions for the Company and tax years for each that remain subject to examination are as follows:
|
Taxing Jurisdiction |
|
Open Fiscal Years |
|
|
|
|
|
|
|
U.S. Federal |
|
2007 and later |
|
|
U.S. states and cities |
|
2002 and later |
|
|
Canada |
|
2004 and later |
|
The significant components of the Company’s deferred tax assets and liabilities are summarized in the following table.
|
|
|
Balance at June 30, |
|
||||
|
|
|
2010 |
|
2009 |
|
||
|
|
|
(in thousands) |
|
||||
|
Deferred tax assets: |
|
|
|
|
|
||
|
Depreciation and amortization |
|
$ |
18,751 |
|
$ |
18,982 |
|
|
Net unrealized losses from risk management activities |
|
3,197 |
|
18,693 |
|
||
|
Allowance for doubtful accounts |
|
1,992 |
|
2,860 |
|
||
|
Tax loss carryforwards |
|
3,652 |
|
2,724 |
|
||
|
Accrued bonuses |
|
1,540 |
|
1,707 |
|
||
|
Stock compensation expense |
|
901 |
|
1,642 |
|
||
|
Novation of interest rate swaps |
|
2,996 |
|
— |
|
||
|
Other reserves |
|
133 |
|
165 |
|
||
|
Valuation allowance |
|
(28,123 |
) |
(22,664 |
) |
||
|
Total deferred tax assets |
|
5,039 |
|
24,109 |
|
||
|
Deferred tax liabilities: |
|
|
|
|
|
||
|
State tax liability |
|
32 |
|
— |
|
||
|
Total deferred tax liabilities |
|
32 |
|
— |
|
||
|
Net deferred tax asset |
|
$ |
5,007 |
|
$ |
24,109 |
|
|
|
|
|
|
|
|
||
|
Balance sheet classification: |
|
|
|
|
|
||
|
Current deferred tax asset |
|
$ |
1,378 |
|
$ |
9,020 |
|
|
Long-term deferred tax asset |
|
3,629 |
|
15,089 |
|
||
|
Current deferred tax liability |
|
— |
|
— |
|
||
|
Net deferred tax asset |
|
$ |
5,007 |
|
$ |
24,109 |
|
Deferred income taxes reflect the net tax effects of temporary differences between the carrying amount of assets and liabilities for financial reporting purposes and the amounts used for income tax purposes. The Company’s policy is to establish a valuation allowance if it is “more likely than not” that the related tax benefits will not be realized. At June 30, 2010 and 2009, the Company determined that it was “more likely than not” that a portion of its deferred tax assets would not be realized.
An analysis of the valuation allowance is provided in the following table.
|
|
|
Fiscal Year Ended June 30, |
|
|||||||
|
|
|
2010 |
|
2009 |
|
2008 |
|
|||
|
|
|
(in thousands) |
|
|||||||
|
|
|
|
|
|
|
|
|
|||
|
Balance at beginning of period |
|
$ |
22,664 |
|
$ |
— |
|
$ |
— |
|
|
Net increase (decrease) during the period |
|
5,459 |
|
22,664 |
|
— |
|
|||
|
Balance at end of period |
|
$ |
28,123 |
|
$ |
22,664 |
|
$ |
— |
|
The Company has deferred tax assets related to unrealized losses from risk management activities. The Company anticipates that these deferred tax assets will be realized in future periods when sales of fixed price commodities, to which the unrealized losses from risk management activities relate, occur. Therefore, the Company did not establish a valuation allowance for these deferred tax assets.
For the remaining deferred tax assets, the Company determined based on available evidence, including historical financial results for the last three years, that it is “more likely than not” that a portion of these items may not be recoverable in the future. The Company increased its valuation allowance by $5.5. million related to its U.S. operations, due to a change in the mix of related deferred tax assets, resulting in a charge to tax expense recorded for fiscal year 2010.
At June 30, 2010, the Company had an uncertain tax position of $0.9 million for a timing issue related to compensation expense. There was no change in the effective tax rate as a result of this item during the fiscal year ended June 30, 2010, and the Company expects this item to be settled within the next twelve months.
The Company recognizes accrued interest and penalties related to income tax liabilities in accrued liabilities in the consolidated balance sheet and interest expense in the consolidated statement of operations. As of June 30, 2010, the Company accrued less than $0.1 million for potential interest and penalties for the compensation-related timing issue described above. There was no material change in this amount during the fiscal year ended June 30, 2010.
The Worker, Homeownership and Business Assistance Act of 2009 (the “WHBA Act”), which was signed into law on November 6, 2009, contains a number of tax law changes, including a provision that permits companies to elect to carry back certain net operating losses for up to five years. As of June 30, 2010, the Company expects to carry back approximately $15.7 million of current year tax losses to tax years ending June 30, 2005 and 2006 under the provisions of the WHBA Act, which is expected to result in approximately $5.5 million of tax refunds.
Note 13. Accounts Payable and Accrued Liabilities
Accounts payable and accrued liabilities are summarized in the following table.
|
|
|
Balance at |
|
||||
|
|
|
June 30, |
|
June 30, |
|
||
|
|
|
(in thousands) |
|
||||
|
|
|
|
|
|
|
||
|
Trade accounts payable and accrued liabilities (1) |
|
$ |
16,069 |
|
$ |
13,952 |
|
|
Accrued commodity purchases |
|
2,083 |
|
9,847 |
|
||
|
Interest payable (2) |
|
3,951 |
|
8,946 |
|
||
|
Payroll and related expenses |
|
4,301 |
|
4,761 |
|
||
|
Sales and other taxes |
|
— |
|
2,193 |
|
||
|
Other |
|
3,898 |
|
3,448 |
|
||
|
Total accounts payable and accrued liabilities |
|
$ |
30,302 |
|
$ |
43,147 |
|
(1) Includes $0.2 and $1.9 million due to related parties at June 30, 2010 and 2009, respectively, for legal services, financial advisory services and management fees. Refer to Note 20 for additional information regarding related party transactions.
(2) Includes $1.0 million of accrued interest at June 30, 2009 related to Bridge Financing Loans and the Denham Credit Facility. All amounts due to the Bridge Financing Loans lenders and Denham were repaid in September 2009 in connection with the Restructuring. Refer to Note 20 for additional information regarding related party transactions.
Trade accounts payable and accrued expenses include amounts accrued for transportation and distribution charges, imbalances, other utility-related expenses and general operating expenses. Interest payable primarily includes accrued and unpaid interest associated with the Fixed Rate Notes due 2014 and the Floating Rate Notes due 2011.
Note 14. Derivatives and Hedging Activities
The Company is exposed to certain risks relating to its ongoing business operations. The primary risks managed by using derivative instruments are commodity price risk and interest rate risk. The Company has a risk management policy that is intended to reduce its financial exposure related to changes in the price of natural gas and electricity and to changes in the interest rates associated with its Commodity Supply Facility and Floating Rate Notes due 2011. The Company’s risk management policy defines various risk management controls and limits that are designed to monitor its commodity price risk position and ensure that hedging performance is in line with objectives established by its Board of Directors and management. Speculative trading activities are explicitly prohibited under the Company’s risk management policy.
The Company utilizes derivative financial instruments to reduce its exposure to fluctuations in the price of natural gas and electricity. Commodity derivatives utilized typically include swaps, forwards and options that are bilateral contracts with counterparties. In addition, certain contracts with customers are also accounted for as derivatives. The Company has not elected to designate any derivative instruments as hedges under U.S. GAAP guidelines. Accordingly, any changes in fair value during the term of a derivative contract are adjusted through unrealized losses (gains) from risk management activities in the consolidated statements of operations with offsetting adjustments to unrealized gains or unrealized losses from risk management activities in the consolidated balance sheets. Unrealized gains from risk management activities on the consolidated balance sheets represent receivables from various derivative counterparties, net of amounts due to the same counterparties when master netting agreements exist. Unrealized losses from risk management activities represent liabilities to various derivative counterparties, net of receivables from the same counterparties when master netting agreements exist. Settlements on the derivative instruments are realized monthly and are generally based upon the difference between the contract price and the settlement price as quoted on NYMEX or other published index.
The recorded values of derivative instruments reflect management’s best estimate of fair value, which takes into account various factors including closing exchange and over-the-counter quotations, parity differentials and volatility factors underlying the commitments. In addition, the recorded fair values are discounted to reflect counterparty credit risk and time value of settlement.
Gross volumes associated with commodity and interest rate derivative contracts that are recorded at fair value on the consolidated balance sheets, which expire at various times through March 2013, are summarized in the following table. The volumes in the table do not quantify risk or represent assets or liabilities of the Company, but are used in the calculations of fair value and cash settlements under the contracts.
|
|
|
Open Positions as of |
|
||||
|
|
|
2010 |
|
2009 |
|
||
|
Natural gas instruments (amounts reflected in MMBtus) (1): |
|
|
|
|
|
||
|
Financial forward derivative contracts: |
|
|
|
|
|
||
|
NYMEX-referenced over the counter contracts |
|
21,358,000 |
|
32,298,000 |
|
||
|
Basis contracts |
|
18,794,000 |
|
22,172,000 |
|
||
|
Option contracts |
|
550,000 |
|
2,015,000 |
|
||
|
Physical forward contracts (2): |
|
|
|
|
|
||
|
Physical fixed contracts |
|
4,218,000 |
|
— |
|
||
|
Physical basis contracts |
|
276,000 |
|
— |
|
||
|
Physical index contracts |
|
1,375,000 |
|
— |
|
||
|
|
|
|
|
|
|
||
|
Electricity instruments (amounts reflected in MWhrs) (3): |
|
|
|
|
|
||
|
Financial forward derivative contracts: |
|
|
|
|
|
||
|
Swaps and fixed price contracts |
|
677,000 |
|
168,000 |
|
||
|
Physical forward contracts (2) |
|
139,000 |
|
— |
|
||
|
|
|
|
|
|
|
||
|
Interest rate swaps (in millions) |
|
$ |
80.0 |
|
$ |
110.0 |
|
(1) Million British thermal units, a standard unit of heating equivalent measure for natural gas. A unit of heat equal to 1,000,000 Btus, or 1 MMBtu, is the thermal equivalent of approximately 1,000 cubic feet of natural gas.
(2) Represents agreements for the purchase and sale of natural gas or electricity that are accounted for as derivatives because they did not qualify for the “normal purchases and sales” exclusion under U.S. GAAP as of the respective period-end date.
(3) Megawatt Hours, each representing 1 million watt hours or a thousand kilowatt hours, which is the amount of electric energy produced or consumed in a period of time.
The fair value of these derivative instruments recorded on the Company’s consolidated balance sheets is summarized in the following table.
|
Type of Derivative |
|
Location on the Consolidated Balance Sheet |
|
Prior to |
|
Impact of |
|
After Netting |
|
|||
|
|
|
|
|
|
|
(in thousands) |
|
|
|
|||
|
Fair value as of June 30, 2010: |
|
|
|
|
|
|
|
|
|
|||
|
Asset derivatives: |
|
|
|
|
|
|
|
|
|
|||
|
Commodity derivatives |
|
Unrealized gains from risk management activities, net |
|
$ |
13,756 |
|
$ |
(13,756 |
) |
$ |
— |
|
|
Total |
|
|
|
$ |
13,756 |
|
$ |
(13,756 |
) |
$ |
— |
|
|
|
|
|
|
|
|
|
|
|
|
|||
|
Liability Derivatives: |
|
|
|
|
|
|
|
|
|
|||
|
Commodity derivatives |
|
Unrealized losses from risk management activities, net |
|
$ |
26,315 |
|
$ |
(13,756 |
) |
$ |
12,559 |
|
|
Interest rate derivatives |
|
Unrealized losses from risk management activities, net |
|
6,029 |
|
— |
|
6,029 |
|
|||
|
Total |
|
|
|
$ |
32,344 |
|
$ |
(13,756 |
) |
$ |
18,588 |
|
|
|
|
|
|
|
|
|
|
|
|
|||
|
Fair value as of June 30, 2009: |
|
|
|
|
|
|
|
|
|
|||
|
Asset derivatives: |
|
|
|
|
|
|
|
|
|
|||
|
Commodity derivatives |
|
Unrealized gains from risk management activities, net |
|
$ |
24,649 |
|
$ |
(24,355 |
) |
$ |
294 |
|
|
Total |
|
|
|
$ |
24,649 |
|
$ |
(24,355 |
) |
$ |
294 |
|
|
|
|
|
|
|
|
|
|
|
|
|||
|
Liability Derivatives: |
|
|
|
|
|
|
|
|
|
|||
|
Commodity derivatives |
|
Unrealized losses from risk management activities, net |
|
$ |
64,347 |
|
$ |
(24,355 |
) |
$ |
39,992 |
|
|
Interest rate derivatives |
|
Unrealized losses from risk management activities, net |
|
8,303 |
|
— |
|
8,303 |
|
|||
|
Total |
|
|
|
$ |
72,650 |
|
$ |
(24,355 |
) |
$ |
48,295 |
|
The effect of derivative instruments on the Company’s consolidated statements of operations is summarized in the following table.
|
Type of Derivative |
|
Location of (Gains) Losses Recognized on the |
|
Amount of (Gains) Losses Recognized for |
|
|||||||
|
Instrument |
|
Consolidated Statement of Operations |
|
2010 |
|
2009 |
|
2008 |
|
|||
|
|
|
|
|
|
|
(in thousands) |
|
|
|
|||
|
Commodity |
|
Cost of goods sold — realized (gains) losses from risk management activities, net |
|
$ |
48,211 |
|
$ |
72,824 |
|
$ |
6,747 |
|
|
Commodity |
|
Cost of goods sold — unrealized (gains) losses from risk management activities, net |
|
(27,139 |
) |
87,575 |
|
(67,168 |
) |
|||
|
Interest rate |
|
Interest expense, net of interest income |
|
(2,274 |
) |
3,693 |
|
3,290 |
|
|||
|
Total |
|
|
|
$ |
18,798 |
|
$ |
164,092 |
|
$ |
(57,131 |
) |
Commodity Price Risk Management Activities
The Company utilizes swap instruments and, to a lesser extent, option instruments to economically hedge the anticipated natural gas and electricity commodity purchases required to meet expected customer demand for all accounts served under fixed price contracts (up to 110% in the winter months with respect to customer demand in certain natural gas utility service areas with daily balancing requirements and up to 110% in the summer months with respect to customer demand in certain electricity utility service areas).
Financial Natural Gas Derivative Contracts
The Company utilizes the Commodity Supply Facility to enter into NYMEX-referenced over-the-counter swaps, basis swaps and options to economically hedge the risk of variability in the cost of natural gas. Under the Commodity Supply Facility, as of June 30, 2010, the Company has the ability to enter into NYMEX and basis swaps through March 2013.
In connection with the Commodity Supply Facility, during the fiscal year ended June 30, 2010, certain of the Company’s natural gas hedge agreements under the former Hedge Facility were novated to RBS Sempra from the previous counterparty. Such novations did not have any impact on the Company’s rights, obligations, risks or accounting methodology associated with the agreements.
Physical Forward Natural Gas Derivative Contracts
As of June 30, 2009, the Company had forward physical contracts to purchase natural gas beginning in July 2009 and ending in November 2010. Based on the terms of these purchases, the Company had elected to treat all such contracts as “normal purchases” under U.S. GAAP, and therefore the contracts were not reported on the consolidated balance sheets at June 30,
2009.
Under the terms of the Commodity Supply Facility, most of the outstanding physical forward agreements for the purchase of natural gas were novated to RBS Sempra during the fiscal year ended June 30, 2010. Based upon the terms of the ISDA Master Agreements, certain of these novated agreements no longer qualify as “normal purchases.” Since the novation dates of these agreements, changes in fair value have been reflected in earnings and recorded in unrealized gains and/or unrealized losses from risk management activities on the consolidated balance sheets at June 30, 2010. These agreements are included in the June 30, 2010 fair value measurements reported in Note 15.
Financial Electricity Derivative Contracts
As of June 30, 2009, the Company did not have an exclusive agreement with any single hedge provider for electricity. The Company managed its exposure to risk associated with its electricity hedge providers through a formal credit risk management process and through daily review of exposures from open positions. As of June 30, 2009, all of the Company’s electricity hedge positions were with counterparties with investment grade credit ratings. The Company generally was required to post letters of credit to cover its liability positions with various counterparties in accordance with electricity hedging agreements.
Effective September 22, 2009, under the Commodity Supply Facility, the Company has an exclusive agreement with RBS Sempra for electricity economic hedging activities. Subsequent to the Restructuring, the Company’s existing electricity swap agreements with other counterparties were novated to RBS Sempra. Such novations did not have any impact on the Company’s rights, obligations, risks or accounting methodology associated with the agreements.
Physical Forward Electricity Derivative Contracts
As of June 30, 2009, the Company had physical forward contracts to purchase electricity beginning in July 2009 and ending in September 2011. Based on the terms of these purchases, the Company had elected to treat all such contracts as “normal purchases” under U.S. GAAP, and therefore the contracts were not reported on the consolidated balance sheets at June 30, 2009.
Under the terms of the Commodity Supply Facility, all physical forward agreements for the purchase of electricity were novated to RBS Sempra during the second quarter of fiscal year 2010. Based upon the terms of the ISDA Master Agreements, certain of these novated agreements no longer qualify as “normal purchases.” Since the novation dates of these agreements, changes in fair value have been reflected in earnings and recorded in unrealized gains and/or unrealized losses from risk management activities on the consolidated balance sheets at June 30, 2010. These agreements are included in the June 30, 2010 fair value measurements reported in Note 15.
Interest Rate Risk Management Activities
The Company utilizes interest rate swaps to manage its exposure to interest rate fluctuations by utilizing interest rate swaps to effectively convert the interest rate exposure from a variable rate to a fixed rate of interest. Under the Commodity Supply Facility, the Company is subject to variable interest rates in connection with cash borrowings and credit support, primarily in the form of letters of credit, provided by RBS Sempra. The total amount of letters of credit outstanding under the Commodity Supply Facility will fluctuate throughout the Company’s fiscal year due to the seasonality of its business. As of June 30, 2010, approximately $34.0 million of letters of credit were outstanding under the Commodity Supply Facility. The Company is also exposed to interest rate fluctuations in connection with the $6.4 million aggregate principal amount of Floating Rate Notes due 2011 that was outstanding at June 30, 2010.
As of June 30, 2010, an $80.0 million swap was outstanding, which expires on August 1, 2011. The fixed-for-floating swap effectively fixes the six-month LIBOR rate at 5.72% per annum. During the fiscal year ended June 30, 2010, the $80.0 million interest rate swap agreement was novated to RBS Sempra from the previous counterparty, as required by the terms of the Commodity Supply Facility. Such novation did not have any impact on the Company’s rights, obligations, risks or accounting methodology associated with the interest rate swap agreement.
At June 30, 2010, the Company posted $6.0 million of cash as collateral against its mark-to-market exposure related to the outstanding interest rate swap agreement, which is recorded in other current assets on the consolidated balance sheets.
The Company has not designated interest rate swaps as hedges and, accordingly, changes in the market value of the interest rate swaps are charged directly to interest expense. Changes in the market value of interest rate swaps resulted in increases (decreases) to interest expense of $2.3 million, $(3.7) million and $(3.3) million for the fiscal years ended June 30, 2010, 2009 and 2008.
Credit Risk Associated with Derivative Financial Instruments
The Company is exposed to credit risk associated with its economic hedging program and derivative financial instruments. Credit risk relates to the potential loss resulting from the nonperformance of a contractual obligation by a derivative counterparty. Historically, the Company has executed its fixed price derivative positions to include a master netting agreement that mitigates the outstanding credit exposure. Under the Commodity Supply Facility, the Company’s risk management activities are with a financial institution that has an investment grade credit rating. The Company’s risk management policy sets forth guidelines for monitoring, managing and mitigating credit risk exposures, establishes credit limits and requires ongoing financial reviews of counterparties.
Note 15. Fair Value of Financial Instruments
The Company measures assets and liabilities associated with various financial forward derivative instruments and physical forward purchase and sale agreements at fair value on a recurring basis, and categorizes these fair value measurements in accordance with a fair value hierarchy that prioritizes the assumptions, or “inputs,” used in applying valuation techniques. The three levels of inputs within the fair value hierarchy are:
· Level 1 — Observable inputs that reflect unadjusted quoted prices for identical assets and liabilities in active markets as of the reporting date.
· Level 2 — Inputs other than quoted prices included in Level 1 that represent observable market-based inputs, such as quoted market prices for similar assets or liabilities in active markets or quoted market prices for identical assets or liabilities in markets that are not considered to be active. Level 2 also includes unobservable inputs that are corroborated by market data.
· Level 3 — Inputs that are not observable from objective sources and therefore cannot be corroborated by market data.
The fair value of the Company’s assets and liabilities that are measured at fair value on a recurring basis is summarized by level within the fair value hierarchy in the following tables.
|
|
|
Balance at June 30, 2010 |
|
||||||||||
|
|
|
Level 1 |
|
Level 2 |
|
Level 3 |
|
Total |
|
||||
|
|
|
(in thousands) |
|
||||||||||
|
Liabilities: |
|
|
|
|
|
|
|
|
|
||||
|
Commodity derivatives |
|
$ |
— |
|
$ |
12,559 |
|
$ |
— |
|
$ |
12,559 |
|
|
Interest rate derivatives |
|
— |
|
6,029 |
|
— |
|
6,029 |
|
||||
|
Total |
|
$ |
— |
|
$ |
18,588 |
|
$ |
— |
|
$ |
18,588 |
|
|
|
|
Balance at June 30, 2009 |
|
||||||||||
|
|
|
Level 1 |
|
Level 2 |
|
Level 3 |
|
Total |
|
||||
|
|
|
(in thousands) |
|
||||||||||
|
Assets: |
|
|
|
|
|
|
|
|
|
||||
|
Commodity derivatives |
|
$ |
— |
|
$ |
294 |
|
$ |
— |
|
$ |
294 |
|
|
Total |
|
$ |
— |
|
$ |
294 |
|
$ |
— |
|
$ |
294 |
|
|
|
|
|
|
|
|
|
|
|
|
||||
|
Liabilities: |
|
|
|
|
|
|
|
|
|
||||
|
Commodity derivatives |
|
$ |
— |
|
$ |
39,992 |
|
$ |
— |
|
$ |
39,992 |
|
|
Interest rate derivatives |
|
— |
|
8,303 |
|
— |
|
8,303 |
|
||||
|
Total |
|
$ |
— |
|
$ |
48,295 |
|
$ |
— |
|
$ |
48,295 |
|
The Company has elected not to record the Fixed Rate Notes due 2014 or the Floating Rate Notes due 2011 at fair value. The aggregate principal amount of long-term debt recorded on the consolidated balance sheets, before original issue discount, is $73.7 million at June 30, 2010. Utilizing observable market data, the aggregate fair value of the Fixed Rate Notes due 2014 and the Floating Rate Notes due 2011 was approximately $66.0 million as of June 30, 2010.
Note 16. Commodity Supply Facility and Revolving Credit Facility
Commodity Supply Facility
In connection with the Restructuring consummated on September 22, 2009, the Revolving Credit Facility, Hedge Facility and various arrangements for the supply of natural gas and electricity were replaced by the Commodity Supply Facility. Under the Commodity Supply Facility, the primary obligors are Holdings’ two significant operating subsidiaries, MXenergy Inc.
and MXenergy Electric Inc. All obligations under the Commodity Supply Facility are guaranteed by Holdings and its other domestic subsidiaries and are secured by a first priority lien on substantially all existing and future assets of Holdings and its domestic subsidiaries other than the Fixed Rate Notes Escrow Account described in Note 17. The maturity date of the Commodity Supply Facility is August 31, 2012. RBS Sempra has the right to extend such maturity date by one year in its sole discretion, if RBS Sempra provides notice no later than April 30, 2011.
The Commodity Supply Facility provides for the exclusive supply of physical (other than as needed for balancing) and financial natural gas and electricity, credit support (including letters of credit and guarantees) for certain collateral needs, cash advances for natural gas inventory and seasonal financing as needed, and associated hedging transactions in order to maintain the balanced trading book required by the Company’s risk management policies. The Commodity Supply Facility provides for certain volumetric fees for all natural gas and electricity purchases.
The Commodity Supply Facility is governed by the separate ISDA Master Agreements for natural gas and electricity. During fiscal year 2010, the Company entered into amendments to the ISDA Master Agreements for natural gas and electricity, respectively, with the Company and certain of its subsidiaries, as guarantors, and RBS Sempra. These amendments resulted in the following material changes to the ISDA Master Agreements:
· The definition of Adjusted Consolidated Tangible Net Worth in the ISDA Master Agreements was amended to exclude non-cash charges associated with any deferred tax valuation allowances;
· The date by which the Company was required to release or arrange for the release of all of its pipeline transportation and storage capacity on interstate and inter provincial pipelines directly to RBS Sempra was extended to April 1, 2010 from December 31, 2009;
· Certain fees related to natural gas supply and hedging activity specifically related to the SSO program were revised; and
· Natural gas purchased by the Company from RBS Sempra under the SSO Program was specifically excluded from certain volume limitations and/or minimum purchase requirements under the ISDA Master Agreements.
As of June 30, 2010, the Company was in compliance with all provisions of the ISDA Master Agreements.
In accordance with the terms of the ISDA Master Agreements, the Company is required to maintain a minimum collateral coverage ratio (the “Collateral Coverage Ratio”) of 1.25:1.00 for the months of October through March (inclusive) and 1.40:1.00 for any other calendar month. The Collateral Coverage Ratio is calculated as the ratio of: (1) certain assets of the Company, primarily including cash, amounts due from RBS Sempra representing the Company’s operating cash, accounts receivable from customers and LDCs and natural gas inventories; to (2) certain liabilities of the Company, primarily arising from exposure and/or amounts due to RBS Sempra (including amounts due for the purchase of natural gas and electricity, accrued but unpaid financing fees and settlements arising from derivative contracts).
As of June 30, 2010, the Company had a Collateral Coverage Ratio of approximately 3.41:1.00. The calculation of the Collateral Coverage Ratio as of June 30, 2010 resulted in available liquidity of approximately $62.3 million. At June 30, 2010, the Company had no outstanding cash advances and had $34.0 million of letters of credit outstanding under the Commodity Supply Facility.
In connection with the Commodity Supply Facility, the Company must maintain a consolidated tangible net worth, as defined in the ISDA Master Agreements, of at least $60.0 million. As of June 30, 2010, the Company’s consolidated tangible net worth exceeded $60.0 million.
Provided that the Company is in compliance with the Collateral Coverage Ratio requirement, as described above, the Commodity Supply Facility provides for cash advances of up to $45.0 million to finance seasonal working capital requirements. These cash borrowings will accrue interest at the greater of: (1) RBS Sempra’s cost of funds plus 5%; or (2) LIBOR plus 5%. Outstanding credit support (e.g., letters of credit and/or guarantees) provided by RBS Sempra will accrue interest at LIBOR plus 3%, with a minimum rate of 4%, except that, if the cash held in certain collateral accounts exceeds all outstanding settlement payments under the Commodity Supply Facility by $27.0 million, interest will accrue at a reduced rate of 1% on the amount of outstanding credit support in excess of $27.0 million.
Under the supply terms of the Commodity Supply Facility, the Company has the ability to: (1) seek commodity price quotes from third parties for certain physically or financially settled transactions with respect to gas and electricity; and (2) request that RBS Sempra enter into such transactions with such third parties at such prices and to concurrently enter into back-to-back off-setting transactions with the Company with respect to such third party transactions. Such transactions with third parties are subject to RBS Sempra approval, and to a requirement that the volumes of those transactions do not exceed certain annual limits specified in the agreements that govern the Commodity Supply Facility. In addition to the actual purchase price paid by RBS Sempra and certain related costs and expenses, the Company is charged a fee for such purchases.
Under the Commodity Supply Facility, the Company is obligated to purchase a minimum of 130,000,000 MMBtus of natural gas from RBS Sempra, for physical delivery in accordance with the following schedule: (1) 39,000,000 MMBtus during the first contract year; (2) 44,000,000 MMBtus during the second contract year; and (3) 47,000,000 MMBtus during the third contract year. In addition, the Company is obligated to purchase a minimum of 1,850,000 MWhrs of electricity from RBS Sempra, for physical delivery in accordance with the following schedule: (1) 500,000 MWhrs during the first contract year; (2) 650,000 MWhrs during the second contract year; and (3) 700,000 MWhrs during the third contract year. The estimated total value of these purchases will depend upon the market price of natural gas at the time of purchase. The Company will be obligated to pay a volumetric fee for any unused balance of the minimum volume purchase requirement for any contract year, or if the agreement is terminated prior to the end of the contract. The excess of actual commodity purchases from RBS Sempra over the minimum purchase requirement for any contract year, if any, will be deducted from the minimum purchase requirement for the subsequent contract year. As of June 30, 2010, the commodity to be purchased for delivery to the Company’s customers during the first and second contract years of the Commodity Supply Facility is expected to exceed the minimum purchase obligation for natural gas and electricity for those years.
The Commodity Supply Facility provides that the Company will release natural gas transportation and delivery capacity to RBS Sempra and for RBS Sempra to perform certain transportation and storage nominations. The Commodity Supply Facility also provides for RBS Sempra to act on the Company’s behalf to satisfy the requirements of regional electricity transmission operators for capacity rights and ancillary services.
Under the hedging terms of the Commodity Supply Facility, the Company’s aggregate outstanding notional amount of fixed price physical and/or financial hedges is limited to $260.0 million. Fixed price hedges are limited to a contract term of 24 months. In addition, the fixed price portfolio of hedges is limited to a weighted-average volume tenor not to exceed 14 months in duration. As of June 30, 2010, the Company was in compliance with each of these requirements.
With regards to the Company’s fixed price customer mix, the Company may not enter into any fixed price contracts, excluding renewals of existing fixed price contracts, if:
· During any twelve-month period, more than 75% of all residential customer equivalents (“RCEs”) have been added under fixed price contracts;
· During any twelve-month period, more than 235,000 RCEs have been added under fixed price contracts; and
· The Company’s fixed price RCEs exceeds 325,000 at any time.
In connection with the Commodity Supply Facility, during the fiscal year ended June 30, 2010, certain of the Company’s natural gas hedge agreements under the former Hedge Facility and all of the Company’s existing electricity swap agreements with other counterparties were novated to RBS Sempra. Additionally, certain of the Company’s forward physical agreements for the purchase of natural gas and all of the Company’s forward physical agreements for the purchase of electricity were novated to RBS Sempra. Such novations did not have any impact on the Company’s rights, obligations, risks or accounting methodology associated with the agreements.
During fiscal years 2009 and 2010, the Company incurred approximately $10.7 million of legal fees, consulting fees and other costs directly related to the Commodity Supply Facility, which were deferred on the consolidated balance sheet and are being amortized as an increase to interest expense over the remaining term of the Commodity Supply Facility. These deferred costs include the value of 4,002,290 shares of Class B Common Stock issued to RBS Sempra in connection with the Restructuring. Amortization expense associated with these deferred costs was approximately $2.8 million for the fiscal year ended June 30, 2010, respectively.
The ISDA Master Agreements contain customary covenants that restrict certain activities including, among other things, the Company’s ability to:
· incur additional indebtedness;
· create or incur liens;
· guarantee obligations of other parties;
· engage in mergers, consolidations, liquidations and dissolutions;
· create subsidiaries;
· make acquisitions;
· engage in certain asset sales;
· enter into leases or sale-leasebacks;
· make equity distributions;
· make capital expenditures;
· make loans and investments;
· make certain dividend, debt and other restricted payments;
· engage in a different line of business;
· amend, modify or terminate certain material agreements in a manner that is adverse to the lenders; and
· engage in certain transactions with affiliates.
The ISDA Master Agreements also contain customary events of default, including:
· payment defaults;
· breaches of representations and warranties;
· covenant defaults;
· cross defaults to certain other indebtedness (including the Fixed Rate Notes due 2014) in excess of specified amounts;
· certain events of bankruptcy and insolvency;
· ERISA defaults;
· judgments in excess of specified amounts;
· failure of any guaranty or security document supporting the Commodity Supply Facility to be in full force and effect;
· the termination or cancellation of any material contract which termination or cancellation could reasonably be expected to have a material adverse effect on us; or
· the occurrence of a change of control.
Net Accounts Receivable from or Payable to RBS Sempra
The agreements that govern the Commodity Supply Facility include provisions that allow for net settlement of amounts due from and due to RBS Sempra. Accordingly, the Company reports amounts due from and due to RBS Sempra net on the consolidated balance sheets. At June 30, 2010, the net $43.1 million amount due from RBS Sempra is reported as accounts receivable, net — RBS Sempra on the consolidated balance sheets.
Revolving Credit Facility
As of June 30, 2009, and through September 21, 2009, MXenergy Inc. and MXenergy Electric Inc. were borrowers under the Revolving Credit Facility. During the fiscal year ended June 30, 2009 and through September 30, 2009, the Company incurred approximately $9.1 million of amendment fees, legal fees, consulting fees and other costs directly related to amendments to the Revolving Credit Facility and Hedge Facility, which were deferred on the consolidated balance sheet and amortized as an increase in interest expense over the remaining terms of the facilities. Amortization expense associated with these deferred costs was approximately $1.6 million and $7.5 million during the fiscal years ended June 30, 2010 and 2009, respectively.
Note 17. Long-Term Debt
Long-term debt is summarized in the following table.
|
|
|
Balance at June 30, |
|
||||
|
|
|
2010 |
|
2009 |
|
||
|
|
|
(in thousands) |
|
||||
|
|
|
|
|
|
|
||
|
Fixed Rate Notes due 2014 (net of unamortized original issue discount of $14,949) |
|
$ |
52,344 |
|
$ |
— |
|
|
Floating Rate Notes due 2011 (net of unamortized original issue discount of $35 and $1,724, respectively) |
|
6,378 |
|
163,476 |
|
||
|
Total long-term debt |
|
$ |
58,722 |
|
$ |
163,476 |
|
Fixed Rate Notes due 2014
In connection with the Restructuring, the Company issued $67.8 million aggregate principal amount of the Fixed Rate Notes due 2014. Interest on the Fixed Rate Notes due 2014 accrues at the rate of 13.25% per annum and is payable semi-annually in cash on February 1 and August 1 of each year. The Fixed Rate Notes due 2014 will mature on August 1, 2014. Interest expense associated with the Fixed Rate Notes due 2014 was approximately $6.9 million for the fiscal year ended June 30, 2010.
The Fixed Rate Notes due 2014 were issued at a discount of approximately $17.8 million, which was recorded as a reduction from the Fixed Rate Notes due 2014 balance on the Company’s consolidated balance sheets, and which is being amortized as
an increase to interest expense over the remaining life of the Fixed Rate Notes due 2014. Total interest expense associated with amortization of this discount was approximately $2.9 million for the fiscal year ended June 30, 2010.
The Company incurred approximately $5.3 million of legal fees, consulting fees and other costs directly related to issuance of the Fixed Rate Notes due 2014, which were recorded as deferred debt issue costs on the consolidated balance sheets and are being amortized as an increase to interest expense over the remaining term of the Fixed Rate Notes due 2014. Total interest expense associated with amortization of these deferred debt issue costs was approximately $0.9 million for the fiscal year ended June 30, 2010.
On December 30, 2009, the Company entered into a purchase agreement (the “Stock and Notes Purchase Agreement”) pursuant to which a holder of the Company’s Class A Common Stock and Fixed Rate Notes due 2014 (the “Seller”) agreed to sell its holdings to the Company. Pursuant to the Stock and Notes Purchase Agreement, on January 4, 2010, the Company acquired approximately $0.5 million aggregate principal amount of Fixed Rate Notes due 2014 from the Seller for approximately $0.3 million. The resulting gain on extinguishment of debt of $0.2 million was recorded as a reduction of interest expense. A pro rata portion of deferred debt issue costs and original debt issue discount associated with the Fixed Rate Notes due 2014 acquired, which approximated an aggregate amount of $0.1 million, was also recorded as additional interest expense during the fiscal year ended June 30, 2010.
The Fixed Rate Notes due 2014 are senior subordinated secured obligations of the Company, subordinated in right of payment to obligations of the Company under the Commodity Supply Facility. The Fixed Rate Notes due 2014 are senior in priority to the Company’s unsecured senior obligations, including the Floating Rate Notes due 2011, to the extent of the aggregate value of the assets securing the Fixed Rate Notes due 2014 that is in excess of the aggregate amount of the outstanding Commodity Supply Facility obligations.
The Fixed Rate Notes due 2014 are jointly, severally, fully and unconditionally guaranteed by all domestic subsidiaries of Holdings.
The Fixed Rate Notes due 2014 are secured by a first priority security interest in the Fixed Rate Notes Escrow Account, which is maintained as security for future interest payments to holders of the Fixed Rate Notes due 2014, and by a second priority security interest in substantially all other existing and future assets of the Company. The Fixed Rate Notes Escrow Account was funded with approximately $9.0 million in September 2009, which approximates the interest payable by the Company on the Fixed Rate Notes due 2014 for a twelve-month period.
At any time on or prior to August 1, 2011, the Company may, at its option, use the net cash proceeds of equity offerings, if any, to redeem either: (1) 100% of the aggregate principal amount of outstanding Fixed Rate Notes due 2014; or (2) up to 35% of the aggregate principal amount of outstanding Fixed Rate Notes due 2014, in each case at a redemption price of 113.250% of the principal amount thereof, plus accrued and unpaid interest thereon, if any, to the date of redemption, provided that:
· if the Company redeems less than all of the Fixed Rate Notes due 2014, at least 65% of the principal amount of the Fixed Rate Notes due 2014 issued under the indenture governing them remains outstanding immediately after any such redemption; and
· the Company makes such redemption not more than 90 days after the consummation of any such equity offering.
After August 1, 2011, the Company may redeem the Fixed Rate Notes due 2014 at its option, in whole or in part, upon not less than 30 days’ or more than 60 days’ notice, at the redemption prices specified in the indenture that governs the Fixed Rate Notes due 2014.
Upon a change of control of the Company, the Company would be required to make an offer to purchase each holder’s Fixed Rate Notes due 2014 at a price of 101% of the then outstanding principal amount thereof, plus accrued and unpaid interest.
The indenture that governs the Fixed Rate Notes due 2014 contains restrictions on Holdings and its subsidiaries with regard to declaring or paying any dividend or distribution on Holdings capital stock. As of June 30, 2010, the Company was in compliance with all provisions of the indenture governing the Fixed Rate Notes due 2014.
Holdings has no significant independent operations. Each of Holdings’ domestic subsidiaries jointly and severally, fully and unconditionally guarantees the Fixed Rate Notes due 2014. Refer to Note 24 for consolidating financial statements of Holdings and its guarantor and non-guarantor subsidiaries.
Floating Rate Notes due 2011
On August 4, 2006, Holdings issued $190.0 million aggregate principal amount of Floating Rate Notes due 2011, which
mature on August 1, 2011. The notes were issued at 97.5% of par value and bear interest at LIBOR plus 7.5% per annum. Interest is reset and payable semi-annually on February 1 and August 1 of each year.
During fiscal years 2007 and 2008, the Company purchased $24.8 million aggregate principal amount of outstanding Floating Rate Notes due 2011, plus accrued interest, from noteholders for amounts less than face value. On September 22, 2009, in connection with the Restructuring, the Company consummated an exchange offer of $158.8 million aggregate principal amount of outstanding Floating Rate Notes due 2011 for $26.7 million of cash, $67.8 million aggregate principal amount of Fixed Rate Notes due 2014 and 33,940,683 shares of newly authorized Class A Common Stock.
Holders of approximately $6.4 million aggregate principal amount of Floating Rate Notes due 2011 did not tender their notes pursuant to the Restructuring. These Floating Rate Notes due 2011 will remain outstanding until their maturity date in August 2011 unless acquired or retired by the Company sooner. The indenture governing the Floating Rate Notes due 2011 was amended to eliminate substantially all of the restrictive covenants and certain events of default from such indenture.
The interest rate on the Floating Rate Notes due 2011 was 7.88% and 9.13% at June 30, 2010 and June 30, 2009, respectively. The weighted-average interest rate was 8.26%, 10.02% and 11.95% for the fiscal years ended June 30, 2010, 2009 and 2008, respectively. Interest expense associated with the Floating Rate Notes due 2011 was $3.7 million, $16.8 million and $21.0 million for the fiscal years ended June 30, 2010, 2009 and 2008, respectively.
Interest expense associated with amortization of original issue discount was $1.7 million, $0.8 million and $1.1 million for the fiscal years ended June 30, 2010, 2009 and 2008, respectively. Interest expense associated with amortization of deferred debt issue costs was $1.9 million, $0.9 million and $1.3 million for the fiscal years ended June 30, 2010, 2009 and 2008, respectively.
We have entered into interest rate swap agreements to economically hedge the floating rate interest expense on the Floating Rate Notes due 2011. Refer to Note 14 for additional information regarding the Company’s use of interest rate swaps.
Holdings has no significant independent operations. Each of Holdings’ domestic subsidiaries jointly and severally, fully and unconditionally guarantees the Floating Rate Notes due 2011. Refer to Note 24 for consolidating financial statements of Holdings and its guarantor and non-guarantor subsidiaries.
Note 18. Redeemable Convertible Preferred Stock
Prior to the Restructuring, Holdings was authorized to issue 5,000,000 shares of Preferred Stock. On June 30, 2004, MXenergy Inc. entered into a purchase agreement (the “Preferred Stock Purchase Agreement”) with affiliates of Charterhouse Group Inc. and Greenhill Capital Partners LLC (collectively, the “Preferred Investors”) to issue 1,451,310 shares of Preferred Stock at a purchase price of $21.36 per share. During the fiscal year ended June 30, 2005, as part of a corporate reorganization, MXenergy Inc. merged with a subsidiary of Holdings to become a wholly owned subsidiary of Holdings and stockholders of MXenergy Inc. became stockholders of Holdings. Total related offering expenses of approximately $1.6 million were deducted from the carrying value of the Preferred Stock, which resulted in a net carrying value of approximately $29.4 million at June 30, 2007.
The Company determined that the Preferred Stock was redeemable at the option of the Preferred Investors as a result of the redemption provisions included in the Preferred Stock Purchase Agreement. Additionally, the Company determined that it was probable that the Preferred Stock became redeemable at June 30, 2009, which was the earliest possible date that the Preferred Investors could have caused the Company to make the redemption election described under the redemption provisions of the Preferred Stock Purchase Agreement. Therefore, as of June 30, 2009, the Preferred Stock was recorded outside of stockholders’ equity on the consolidated balance sheets at its estimated redemption value.
On September 22, 2009, in connection with the Restructuring, all outstanding shares of Preferred Stock were exchanged for 11,862,551 shares of newly authorized Class C Common Stock, which represented 21.84% of the aggregate total shares of the Company’s common stock outstanding as of the consummation date of the Restructuring. The $25.9 million excess of the redemption value over the aggregate fair value of common stock issued to the preferred shareholders was reclassified to stockholders’ equity on the consolidated balance sheets. In connection with the Restructuring, Holdings filed an amended and restated Certificate of Incorporation that did not authorize any Preferred Stock.
Note 19. Common Stock
Amendment and Restatement of Corporate Documents and Issuance of Common Stock
In connection with the Restructuring, on September 22, 2009, Holdings’ Certificate of Incorporation and Bylaws were amended and restated, and certain holders of common stock entered into the Stockholders Agreement. These documents
contain customary provisions, including, but not limited to, provisions relating to certain approval rights, preemptive rights, share transfer restrictions and rights of first refusal.
The amended and restated Certificate of Incorporation authorized 200,000,000 shares of $0.01 par value common stock. The number of authorized shares and significant rights, as provided in the Stockholders Agreement, of each class of common stock include:
· 50,000,000 shares of Class A Common Stock. Holders of the Class A Common Stock are not subject to any transfer restrictions and are entitled to designate five directors to the Board of Directors, at least two of whom shall be independent and qualify as “financial experts.”
· 10,000,000 shares of Class B Common Stock. Shares of Class B Common Stock will convert to shares of Class C Common Stock if RBS Sempra sells any of its shares (subject to certain exceptions defined in the amended and restated Certificate of Incorporation) or if all of the Company’s obligations under the Commodity Supply Facility have been paid in full and all commitments pursuant to the Commodity Supply Facility have been terminated. RBS Sempra is entitled to designate one director to the Board of Directors.
· 40,000,000 shares of Class C Common Stock. Holders of Class C Common Stock who are current or former employees of the Company or any of its subsidiaries may not transfer their shares (except by will or in connection with customary estate planning) until the third anniversary of the closing date of the Restructuring and, in the case of shares acquired pursuant to the management incentive plan to be implemented by the Company (the “Management Incentive Plan”), as otherwise provided in the Management Incentive Plan. Transfers of shares of Class C Common Stock are subject to a right of first refusal in favor of the holders of shares of Class A Common Stock and holders of shares of Class B Common Stock. Holders of Class C Common Stock are entitled to nominate and elect two directors to the Board of Directors.
· 100,000,000 shares of Class D Common Stock, which will only be issued by Holdings if certain transactions specified in the amended and restated Certificate of Incorporation occur.
Effective July 27, 2010, the amended and restated Certificate of Incorporation and Bylaws were further amended and restated and, on July 26, 2010, an amendment to the Stockholders Agreement became effective. Refer to Note 4 for additional information regarding the restated Certificate of Incorporation and Bylaws.
In connection with the Restructuring, Holdings issued the following shares of common stock:
· 33,940,683 shares of Class A Common Stock to holders of the Fixed Rate Notes due 2014, which represented 62.5% of the aggregate shares of common stock outstanding after the consummation of the Restructuring. The aggregate fair value of Class A Common Stock issued was approximately $82.1 million ($0.3 million par value, recorded as Class A Common Stock; and $81.8 million recorded as additional paid in capital on the consolidated balance sheets).
· 4,002,290 shares of Class B Common Stock to RBS Sempra, as a condition to the entry into the agreements governing the Commodity Supply Facility, which represented 7.37% of the aggregate shares of common stock outstanding after consummation of the Restructuring. The aggregate $9.0 million fair value of Class B Common Stock issued to RBS Sempra (par value of less than $0.1 million, recorded as Class B Common Stock; and $9.0 million recorded as additional paid in capital on the consolidated balance sheets) was recorded as deferred debt issuance costs on the consolidated balance sheets.
· 11,862,551 shares of Class C Common Stock to holders of Preferred Stock, which represented 21.84% of the aggregate shares of the common stock outstanding after consummation of the Restructuring. Prior to the Restructuring, the Preferred Stock was recorded at its estimated redemption value of $54.6 million on the consolidated balance sheets. The aggregate fair value of Class C Common Stock issued to holders of Preferred Stock was $28.7 million ($0.1 million par value, recorded as Class C Common Stock; and $28.6 million recorded as additional paid in capital on the consolidated balance sheets). The $25.9 million excess of redemption value of the Preferred Stock over the fair value of Class C Common Stock issued to the holders of Preferred Stock was recorded as a reduction of accumulated deficit on the consolidated balance sheets.
· 4,499,588 shares of Class C Common Stock to the remaining holders of Holdings’ common stock issued and outstanding prior to the consummation of the Restructuring, which represented 8.29% of the aggregate shares of common stock outstanding after the consummation of the Restructuring. All 4,681,219 shares of Holdings’ common stock issued and outstanding prior to the Restructuring were retired.
In connection with the Restructuring, the Company incurred approximately $0.3 million of legal fees, consulting fees and other costs directly related to the issuance of shares of common stock outlined above, which were recorded as a reduction of additional paid in capital.
Class A Treasury Stock
Pursuant to the Stock and Notes Purchase Agreement, on December 30, 2009, the Company acquired 229,781 shares of its Class A Common Stock from the Seller for approximately $0.1 million. As of June 30, 2010, the Company does not intend to retire the outstanding shares of Class A Treasury Stock.
Post-Restructuring Stock-Based Compensation Activity
The purpose of the Company’s stock-based compensation program is to attract and retain qualified employees, consultants and other service providers by providing them with additional incentives and opportunities to participate in the Company’s ownership, and to create interest in the success and increased value of the Company. Approved stock-based compensation plans are administered by the Compensation Committee of the Board of Directors. The Compensation Committee has the authority to: (1) interpret the plans and to create or amend its rules; (2) establish award guidelines under the plans; and (3) determine, or delegate the determination to management, the persons to whom awards are to be granted, the time at which awards will be granted, the number of shares to be represented by each award, and the consideration to be received, if any. Stock-based awards under the plans generally are granted with an exercise price equal to the fair value of Holdings’ common stock on the grant date, vest ratably based on three years of continuous service and have ten-year contractual terms.
In connection with the Restructuring, the Company terminated its three existing stock-based compensation plans and offered cash settlements to holders of options and warrants in exchange for their agreement to cancel and terminate such options and warrants. As a result, all outstanding options and warrants as of June 30, 2009 were cancelled and terminated in connection with the Restructuring. Cash settlement payments of approximately $0.2 million were recorded as general and administrative expense during the fiscal year ended June 30, 2010.
In connection with the Restructuring, as agreed to by the shareholders, in January 2010, Holdings’ Board of Directors authorized the creation of the 2010 SIP, pursuant to which the Company may issue Class C Common Stock not to exceed 10% of Holdings’ outstanding common stock (on a fully diluted basis) after giving effect to the Restructuring. Also in January 2010, Holdings’ Board of Directors approved grants of RSUs to certain senior officers, directors and a former director, pursuant to which the Company may issue 2,960,204 shares of Class C Common Stock, representing 5% of Holdings’ outstanding common stock (on a fully-diluted basis), as follows:
· 2,858,164 RSUs, with a grant date fair value of approximately $6.3 million, were granted to certain senior officers of the Company, subject to vesting according to the following schedule: (i) one-third will vest in September 2010; (ii) one-third will vest in September 2011; and (iii) one-third will vest in September 2012.
· 102,040 RSUs, with a grant date fair value of approximately $0.2 million, were granted to directors and a former director of Holdings, subject to vesting according to the following schedule: (i) 25% vested in January 2010; (ii) 25% vested in April 2010; (iii) 25% vested in July 2010; and (iv) 25% will vest in October 2010.
During the fiscal year ended June 30, 2010, the Company recorded approximately $2.4 million of non-cash compensation expense in connection with the RSUs, for which the Company recorded a related tax benefit of approximately $0.9 million. The Company issued 51,020 shares of Class C Common Stock, which had a grant date fair value of approximately $0.1 million, to directors when a portion of their RSUs vested without restrictions. The Company expects to record approximately $2.8 million, $1.1 million and $0.2 million of compensation expense related to outstanding RSU awards during the fiscal years ended June 30, 2011, 2012 and 2013, respectively.
Pre-Restructuring Stock-Based Compensation Activity
As of June 30, 2009, the Company had three active stock-based compensation plans under which warrants and options (collectively referred to as “awards”) have been granted to employees, directors and other non-employees. As of June 30, 2009, the Company had options and warrants outstanding which were, or may have been, exercisable for 1,008,770 shares of common stock. The weighted average exercise price of awards exercisable as of June 30, 2009 was $26.69 per share. The Company recorded approximately $0.1 million, $0.5 million and $1.7 million of non-cash compensation expense in general and administrative expenses during the fiscal years ended June 30, 2010, 2009 and 2008, respectively, related to these outstanding awards. The tax benefit associated with this expense was $0, less than $0.1 million and approximately $0.4 million for the fiscal years ended June 30, 2010, 2009 and 2008, respectively.
The vast majority of these options and all of the warrants were “out of the money” as of the consummation date of the Restructuring (i.e., the agreed-upon price for which the option/warrant holder may purchase the Company’s common stock
exceeded the current fair value of the common stock). In connection with the Restructuring, the Company terminated its three existing stock-based compensation plans and paid approximately $0.2 million of cash settlements to holders of options and warrants in exchange for their agreement to cancel and terminate such options and warrants.
There were no options or warrants exercised and the Company did not grant any stock-based compensation awards from any of these stock-based compensation plans during the fiscal year ended June 30, 2010.
Dividend Policy and Restrictions
Holdings’ Board of Directors, at its discretion, has the authority to declare and pay dividends on the Company’s common stock provided there were funds available to do so. The Company is restricted in its ability to pay dividends by various provisions of agreements that govern the Commodity Supply Facility, the Fixed Rate Notes due 2014 and the Floating Rate Notes due 2011. The Company has never declared or paid any cash dividends on its common stock and, as of June 30, 2010, does not intend to pay any cash dividends in the foreseeable future. The Company intends to retain any future earnings to finance the expansion of its business and for general corporate purposes.
Common Stock Issued to Senior Executives
In March 2008, the Compensation Committee of the Company’s Board of Directors approved the issuance of a combined total of 19,000 fully vested shares of Holdings’ common stock to the Company’s Chief Executive Officer and Executive Vice President. Total compensation expense related to issuance of these shares was approximately $1.7 million, which included the fair value of the common stock issued and additional compensation to offset the taxable nature of the shares to the employees.
Note 20. Related Party Transactions
Amounts paid or accrued to related parties are summarized in the following table.
|
|
|
Fiscal Year Ended June 30, |
|
|||||||
|
|
|
2010 |
|
2009 |
|
2008 |
|
|||
|
|
|
(in thousands) |
|
|||||||
|
Amount paid or accrued for: |
|
|
|
|
|
|
|
|||
|
Legal services: |
|
|
|
|
|
|
|
|||
|
General and administrative expense |
|
$ |
1,114 |
|
$ |
1,169 |
|
$ |
593 |
|
|
Deferred debt issuance costs and stock issuance costs |
|
1,676 |
|
773 |
|
— |
|
|||
|
Financial advisory services recorded in general and administrative expenses |
|
32 |
|
300 |
|
322 |
|
|||
|
Management fees recorded in general and administrative expenses |
|
104 |
|
904 |
|
— |
|
|||
|
Interest expense — Denham Credit Facility |
|
246 |
|
813 |
|
528 |
|
|||
|
Interest expense — Bridge Financing Loans |
|
197 |
|
2,673 |
|
— |
|
|||
|
|
|
$ |
3,369 |
|
$ |
6,632 |
|
$ |
1,443 |
|
Legal Services
A former director and current stockholder of the Company is senior counsel to Paul, Hastings, Janofsky & Walker LLP (“Paul Hastings”), a law firm that provides legal services to the Company. Paul Hastings provides the Company with general legal services, which are recorded in general and administrative expenses, and has provided legal services associated with the Restructuring and amendments to the Revolving Credit Facility and Hedge Facility, which were deferred on the consolidated balance sheets, to be amortized over the estimated useful lives associated with the related agreements. Paul Hastings is expected to continue to provide legal services to the Company in future periods.
Financial Advisory Services
Prior to the consummation of the Restructuring, the Company had a financial advisory services agreement with Greenhill & Co., LLC (“Greenhill”), an affiliate of Greenhill Capital Partners, a significant stockholder of the Company (the “Greenhill Agreement”). Under the Greenhill Agreement, Greenhill provided advisory services in connection with liquidity options considered during the Restructuring, which were recorded in general and administrative expenses during the respective periods. The Greenhill Agreement was terminated effective September 22, 2009.
Management Fees
Prior to the consummation of the Restructuring, the Company had agreed to pay Denham, Daniel Bergstein, a former director of Holdings, and Charter Mx LLC, another significant stockholder of the Company, aggregate annual fees of $0.9 million, for management consulting services provided to the Company. Approximately $0.1 million, $0.9 million and $0 million of fees associated with these arrangements were recorded in general and administrative expenses for the fiscal years ended June 30, 2010, 2009 and 2008, respectively. These management consulting services arrangements were terminated on September 22, 2009.
Effective September 23, 2009, the Company agreed to pay Daniel Bergstein annual fees of $50,000 for management consulting services provided to the Company. Less than $0.1 million of fees associated with this arrangement were recorded in general and administrative expenses for the fiscal year ended June 30, 2010. In addition, the Company granted RSUs to Mr. Bergstein in January 2010, pursuant to which the Company will record $22,000 of compensation expense ratably from January 15, 2010 through October 1, 2010.
Interest Expense — Denham Credit Facility
Denham is a significant stockholder of the Company. As of June 30, 2009, the Company had borrowed the entire $12.0 million available line under the Denham Credit Facility, which bore interest at 9% per annum. In connection with the Restructuring, the entire outstanding balance under the Denham Credit Facility was repaid, including accrued interest, and the facility was terminated on September 22, 2009.
Interest Expense — Bridge Financing Loans
Pursuant to the Revolving Credit Agreement, in November 2008, Charter Mx LLC, Denham and four members of the Company’s senior management team agreed to provide Bridge Financing Loans in an aggregate amount of $10.4 million by becoming lenders in a new bridge loan tranche under the Amended Revolving Credit Agreement. Bridge Financing Loan amounts were as follows: (1) $5.0 million each from Charter Mx LLC and Denham; and (2) $0.1 million each from the Company’s Chief Executive Officer, Chief Financial Officer, former Chief Operating Officer and former Executive Vice President. An upfront fee of 2% of the respective loan amount was paid to each lender of the Bridge Financing Loans upon closing. Interest accrued to such Bridge Financing Loans was as follows: (1) 16% per annum from the closing date through April 6, 2009; (2) 18% per annum from April 7, 2009 through July 6, 2009; and (3) 20% per annum from July 7, 2009 through October 6, 2009.
The Bridge Financing Loan from Charter Mx LLC was repaid, with accrued interest, in April 2009. The remaining Bridge Financing Loans from all other lenders were repaid, with accrued interest, in connection with the Restructuring.
Note 21. Employee Benefits
The Company sponsors an employee savings plan under Section 401(k) of the Internal Revenue Code for all full-time employees and part-time employees (who work at least 1,000 hours annually) with at least three months of continuous service. Eligible employees may make pre-tax contributions up to 20% of their annual compensation, not to exceed the annual limitation set forth in Section 402 (g) for any plan year. The Company makes a matching contribution of up to 10% of each participating employee’s compensation up to the maximum allowable under the plan. Employees whose employment date is prior to July 1, 2007, are immediately 100% vested in all contributions. Employer contributions for employees whose employment date is on or after July 1, 2007 vest in increments of 25% per year. The Company made contributions of $1.3 million, $1.4 million and $1.3 million for the fiscal years ended June 30, 2010, 2009 and 2008, respectively.
Note 22. Commitments and Contingencies
Operating Leases
The Company leases office space under non-cancelable operating leases, which contain escalation clauses, have terms that expire between July 2010 and October 2017 and are subject to extension at the option of the Company. The Company takes into account all escalation clauses when determining the amount of future minimum lease payments. All future minimum lease payments are recognized on a straight-line basis over the minimum lease term. Total rental expense associated with leased spaces, which includes minimum lease payments and maintenance costs, was $1.3 million, $1.3 million and $1.6 million for the fiscal years ended June 30, 2010, 2009 and 2008, respectively. Future annual minimum lease payments under operating leases are summarized in the following table.
|
Fiscal year |
|
Amount |
|
|
|
|
|
(in thousands) |
|
|
|
|
|
|
|
|
|
2011 |
|
$ |
590 |
|
|
2012 |
|
564 |
|
|
|
2013 |
|
352 |
|
|
|
2014 |
|
234 |
|
|
|
2015 |
|
238 |
|
|
|
Thereafter |
|
605 |
|
|
|
Total |
|
$ |
2,583 |
|
Capacity Commitments
As of June 30, 2010, the Company had entered into agreements to transport and store natural gas. Since the demand for natural gas in the winter is high, the Company agreed to pay for certain capacity on the transportation systems utilized for up to a twelve-month period. These take-or-pay agreements obligate the Company to pay for the capacity committed even if it does not use that capacity. For contracts outstanding as of June 30, 2010, the total committed capacity charges were approximately $7.1 million. These agreements generally were due to expire during various months during the fiscal year ending June 30, 2011, and would have been replaced with new contracts as necessary.
The terms of the ISDA Master Agreements require that the Company release natural gas transportation and delivery capacity to RBS Sempra and for RBS Sempra to perform certain transportation and storage nominations. During fiscal year 2010, the Company released transportation and storage capacity in several markets to RBS Sempra according to a mutually acceptable schedule and in a manner intended to ensure an effective transition of these functions. Under the terms of the ISDA Master Agreements, the Company is obligated to reimburse RBS Sempra for various direct costs associated with transportation and storage capacity that RBS Sempra is managing on the Company’s behalf.
Physical Commodity Purchase Commitments
The Commodity Supply Facility provides for the exclusive supply of physical natural gas and electricity, other than as needed for balancing purposes for the Company’s required balanced book of commodity and related hedging activity. Under the Commodity Supply Facility, the Company is obligated to purchase a minimum of 130,000,000 MMBtus of natural gas from RBS Sempra, for physical delivery in accordance with the following schedule: (1) 39,000,000 MMBtus during the first contract year; (2) 44,000,000 MMBtus during the second contract year; and (3) 47,000,000 MMBtus during the third contract year. In addition, the Company is obligated to purchase a minimum of 1,850,000 MWhrs of electricity from RBS Sempra, for physical delivery in accordance with the following schedule: (1) 500,000 MWhrs during the first contract year; (2) 650,000 MWhrs during the second contract year; and (3) 700,000 MWhrs during the third contract year. The Company will be obligated to pay a volumetric fee for any unused balance of the minimum volume purchase requirement for any contract year, or if the agreement is terminated prior to the end of the contract. The excess of actual commodity purchases from RBS Sempra over the minimum purchase requirement for any contract year, if any, will be deducted from the minimum purchase requirement for the subsequent contract year. As of June 30, 2010, commodity purchases by the Company for delivery to its customers during the first and second contract years of the Commodity Supply Facility are expected to exceed the minimum purchase obligations for both natural gas and electricity.
Legal Proceedings and Environmental Matters
From time to time, the Company is a party to claims and legal proceedings that arise in the ordinary course of business, including investigations of product marketing, pricing and billing practices and employment matters. The Company does not believe that any such proceedings to which it is a party as of June 30, 2010 will have a material adverse impact on its results of operations, financial position or cash flows.
The Company does not have physical custody or control of the natural gas provided to our customers, or any facilities used to produce or transport natural gas or electricity. In addition, title to the natural gas sold to customers is passed at the same point at which the Company accepts title from its natural gas suppliers. Therefore, the Company does not believe that it has significant exposure to legal claims or other liabilities associated with environmental concerns.
Note 23. Business Segments
The Company’s core business is the retail sale of natural gas and electricity to end-use customers in deregulated markets. Accordingly, the Company’s business is classified into two business segments: natural gas and electricity. Through these business segments, natural gas and electricity are sold at fixed and variable contracted prices based on the demand or usage of customers.
The Company’s principal operations are located in the U.S. Its foreign operations, which are located in Canada, comprised less than 1% of the Company’s consolidated total assets at June 30, 2010 and 2009 and less than 1% of consolidated sales of natural gas and electricity for the fiscal years ended June 30, 2010, 2009 and 2008.
Financial information for the Company’s business segments is summarized in the following tables.
|
|
|
Natural Gas |
|
Electricity |
|
Total |
|
|||
|
|
|
(in thousands) |
|
|||||||
|
Fiscal year ended June 30, 2010: |
|
|
|
|
|
|
|
|||
|
|
|
|
|
|
|
|
|
|||
|
Sales |
|
$ |
457,909 |
|
$ |
103,297 |
|
$ |
561,206 |
|
|
Cost of goods sold (excluding unrealized gains (losses) from risk management activities, net) (1) |
|
(354,615 |
) |
(80,530 |
) |
(435,145 |
) |
|||
|
Gross profit (excluding unrealized gains (losses) from risk management activities, net) (1) |
|
$ |
103,294 |
|
$ |
22,767 |
|
126,061 |
|
|
|
|
|
|
|
|
|
|
|
|||
|
Items to reconcile total segment gross profit to income before income tax expense: |
|
|
|
|
|
|
|
|||
|
Unrealized gains (losses) from risk management activities, net |
|
|
|
|
|
27,139 |
|
|||
|
Operating expenses |
|
|
|
|
|
(92,021 |
) |
|||
|
Interest expense, net of interest income |
|
|
|
|
|
(34,982 |
) |
|||
|
|
|
|
|
|
|
|
|
|||
|
Income before income tax expense |
|
|
|
|
|
$ |
26,197 |
|
||
|
|
|
|
|
|
|
|
|
|||
|
Assets allocated to business segments at period end: |
|
|
|
|
|
|
|
|||
|
Accounts receivable, net |
|
$ |
29,303 |
|
$ |
19,622 |
|
$ |
48,925 |
|
|
Natural gas inventories |
|
15,861 |
|
— |
|
15,861 |
|
|||
|
Goodwill |
|
3,810 |
|
— |
|
3,810 |
|
|||
|
Customer acquisition costs, net |
|
17,911 |
|
12,514 |
|
30,425 |
|
|||
|
Total assets allocated to business segments |
|
$ |
66,885 |
|
$ |
32,136 |
|
$ |
99,021 |
|
|
|
|
|
|
|
|
|
|
|||
|
Customer acquisition costs capitalized during the period |
|
$ |
11,443 |
|
$ |
10,889 |
|
$ |
22,332 |
|
|
|
|
|
|
|
|
|
|
|||
|
Fiscal year ended June 30, 2009: |
|
|
|
|
|
|
|
|||
|
|
|
|
|
|
|
|
|
|||
|
Sales |
|
$ |
670,584 |
|
$ |
119,196 |
|
$ |
789,780 |
|
|
Cost of goods sold (excluding unrealized gains (losses) from risk management activities, net) (1) |
|
(572,616 |
) |
(96,955 |
) |
(669, 571 |
) |
|||
|
Gross profit (excluding unrealized gains (losses) from risk management activities, net) (1) |
|
$ |
97,968 |
|
$ |
22,241 |
|
120,209 |
|
|
|
|
|
|
|
|
|
|
|
|||
|
Items to reconcile total segment gross profit to income before income tax expense: |
|
|
|
|
|
|
|
|||
|
Unrealized gains (losses) from risk management activities, net |
|
|
|
|
|
(87,575 |
) |
|||
|
Operating expenses |
|
|
|
|
|
(114,779 |
) |
|||
|
Interest expense, net of interest income |
|
|
|
|
|
(45,305 |
) |
|||
|
|
|
|
|
|
|
|
|
|||
|
Loss before income tax benefit |
|
|
|
|
|
$ |
(127,450 |
) |
||
|
|
|
|
|
|
|
|
|
|||
|
Assets allocated to business segments at period end: |
|
|
|
|
|
|
|
|||
|
Accounts receivable |
|
$ |
36,006 |
|
$ |
11,592 |
|
$ |
47,598 |
|
|
Natural gas inventories |
|
29,415 |
|
— |
|
29,415 |
|
|||
|
Goodwill |
|
3,810 |
|
— |
|
3,810 |
|
|||
|
Customer acquisition costs, net |
|
20,882 |
|
7,068 |
|
27,950 |
|
|||
|
Total assets allocated to business segments |
|
$ |
90,113 |
|
$ |
18,660 |
|
$ |
108,773 |
|
|
|
|
|
|
|
|
|
|
|||
|
Customer acquisition costs capitalized during the period |
|
$ |
11,606 |
|
$ |
3,737 |
|
$ |
15,343 |
|
|
|
|
|
|
|
|
|
|
|||
|
Fiscal year ended June 30, 2008: |
|
|
|
|
|
|
|
|||
|
|
|
|
|
|
|
|
|
|||
|
Sales |
|
$ |
669,522 |
|
$ |
82,761 |
|
$ |
752,283 |
|
|
Cost of goods sold (excluding unrealized gains (losses) from risk management activities, net) (1) |
|
(564,219 |
) |
(72,534 |
) |
(636,753 |
) |
|||
|
Gross profit (excluding unrealized gains (losses) from risk management activities, net) (1) |
|
$ |
105,303 |
|
$ |
10,227 |
|
115,530 |
|
|
|
|
|
|
|
|
|
|
|
|||
|
Items to reconcile total segment gross profit to loss before income tax benefit: |
|
|
|
|
|
|
|
|||
|
Unrealized gains (losses) from risk management activities, net |
|
|
|
|
|
67,168 |
|
|||
|
Operating expenses |
|
|
|
|
|
(106,645 |
) |
|||
|
Interest expense, net of interest income |
|
|
|
|
|
(34,105 |
) |
|||
|
|
|
|
|
|
|
|
|
|||
|
Income before income tax expense |
|
|
|
|
|
$ |
41,948 |
|
||
|
|
|
|
|
|
|
|
|
|||
|
Customer acquisition costs capitalized during the period |
|
$ |
14,072 |
|
$ |
5,483 |
|
$ |
19,555 |
|
(1) Includes realized losses from risk management activities, but excludes unrealized gains (losses) from risk management activities. As the underlying customer contracts are not marked to market, the unrealized gains (losses) from risk management activities do not offer an accurate indication of the ultimate cash impact to the business, as the ultimate cash impact to the business is not determinable until delivery of natural gas under the customer contracts and the associated gain (loss) on risk management activity is realized.
Note 24. Condensed Consolidating Financial Information
Each of the following wholly owned domestic subsidiaries of Holdings (the “Guarantor Subsidiaries”) jointly, severally and unconditionally guarantee the Fixed Rate Notes due 2014 on a senior secured basis and the Floating Rate Notes due 2011 on a senior unsecured basis:
· MXenergy Capital Holdings Corp.
· MXenergy Capital Corp.
· Online Choice Inc.
· MXenergy Gas Capital Holdings Corp.
· MXenergy Gas Capital Corp.
· MXenergy Inc.
· MXenergy Electric Capital Holdings Corp.
· MXenergy Electric Capital Corp.
· MXenergy Electric Inc.
· MXenergy Services Inc.
· Infometer.com Inc.
The only wholly owned subsidiary of Holdings that is not a guarantor for the Fixed Rate Notes due 2014 and Floating Rate Notes due 2011 (the “Non-guarantor Subsidiary”) is MXenergy (Canada) Ltd.
Consolidating balance sheets, consolidating statements of operations and consolidating statements of cash flows for Holdings, the combined Guarantor Subsidiaries and the Non-guarantor Subsidiary are provided in the following tables. Elimination entries necessary to consolidate the entities are also presented.
MXENERGY HOLDINGS INC.
Consolidating Balance Sheet
June 30, 2010
(in thousands)
|
|
|
MXenergy |
|
Non-guarantor |
|
Guarantor |
|
Eliminations |
|
Consolidated |
|
|||||
|
|
|
|
|
|
|
|
|
|
|
|
|
|||||
|
Assets |
|
|
|
|
|
|
|
|
|
|
|
|||||
|
Current assets: |
|
|
|
|
|
|
|
|
|
|
|
|||||
|
Cash and cash equivalents |
|
$ |
22 |
|
$ |
384 |
|
$ |
5,814 |
|
$ |
— |
|
$ |
6,220 |
|
|
Restricted cash |
|
— |
|
— |
|
1,574 |
|
— |
|
1,574 |
|
|||||
|
Intercompany accounts receivable |
|
111,769 |
|
— |
|
— |
|
(111,769 |
) |
— |
|
|||||
|
Accounts receivable, net |
|
— |
|
44 |
|
48,881 |
|
— |
|
48,925 |
|
|||||
|
Accounts receivable, net – RBS Sempra |
|
— |
|
— |
|
43,054 |
|
— |
|
43,054 |
|
|||||
|
Natural gas inventories |
|
— |
|
— |
|
15,861 |
|
— |
|
15,861 |
|
|||||
|
Income taxes receivable |
|
— |
|
— |
|
6,063 |
|
— |
|
6,063 |
|
|||||
|
Deferred income taxes |
|
— |
|
— |
|
1,378 |
|
— |
|
1,378 |
|
|||||
|
Fixed Rate Notes Escrow Account |
|
8,977 |
|
— |
|
— |
|
— |
|
8,977 |
|
|||||
|
Other current assets |
|
29 |
|
11 |
|
16,232 |
|
— |
|
16,272 |
|
|||||
|
Total current assets |
|
120,797 |
|
439 |
|
138,857 |
|
(111,769 |
) |
148,324 |
|
|||||
|
Goodwill |
|
— |
|
— |
|
3,810 |
|
— |
|
3,810 |
|
|||||
|
Customer acquisition costs, net |
|
— |
|
— |
|
30,425 |
|
— |
|
30,425 |
|
|||||
|
Fixed assets, net |
|
— |
|
1 |
|
2,738 |
|
— |
|
2,739 |
|
|||||
|
Deferred income taxes |
|
— |
|
— |
|
3,629 |
|
— |
|
3,629 |
|
|||||
|
Deferred debt issue costs |
|
— |
|
— |
|
12,552 |
|
— |
|
12,552 |
|
|||||
|
Intercompany notes receivable |
|
73,706 |
|
— |
|
— |
|
(73,706 |
) |
— |
|
|||||
|
Investment in subsidiaries |
|
(48,826 |
) |
— |
|
— |
|
48,826 |
|
— |
|
|||||
|
Other assets |
|
— |
|
50 |
|
491 |
|
— |
|
541 |
|
|||||
|
Total assets |
|
$ |
145,677 |
|
$ |
490 |
|
$ |
192,502 |
|
$ |
(136,649 |
) |
$ |
202,020 |
|
|
|
|
|
|
|
|
|
|
|
|
|
|
|||||
|
Liabilities and stockholders’ equity |
|
|
|
|
|
|
|
|
|
|
|
|||||
|
Current liabilities: |
|
|
|
|
|
|
|
|
|
|
|
|||||
|
Accounts payable and accrued liabilities |
|
$ |
4 |
|
$ |
125 |
|
$ |
30,173 |
|
$ |
— |
|
$ |
30,302 |
|
|
Intercompany accounts payable |
|
— |
|
1,799 |
|
109,970 |
|
(111,769 |
) |
— |
|
|||||
|
Current portion of unrealized losses from risk management activities, net |
|
— |
|
— |
|
16,731 |
|
— |
|
16,731 |
|
|||||
|
Deferred revenue |
|
— |
|
— |
|
7,457 |
|
— |
|
7,457 |
|
|||||
|
Total current liabilities |
|
4 |
|
1,924 |
|
164,331 |
|
(111,769 |
) |
54,490 |
|
|||||
|
Unrealized losses from risk management activities, net |
|
— |
|
— |
|
1,857 |
|
— |
|
1,857 |
|
|||||
|
Long-term debt |
|
58,722 |
|
— |
|
— |
|
— |
|
58,722 |
|
|||||
|
Intercompany notes payable |
|
— |
|
— |
|
73,706 |
|
(73,706 |
) |
— |
|
|||||
|
Total liabilities |
|
58,726 |
|
1,924 |
|
239,894 |
|
(185,475 |
) |
115,069 |
|
|||||
|
|
|
|
|
|
|
|
|
|
|
|
|
|||||
|
Commitments and contingencies |
|
— |
|
— |
|
— |
|
— |
|
— |
|
|||||
|
|
|
|
|
|
|
|
|
|
|
|
|
|||||
|
Stockholders’ equity (deficit): |
|
|
|
|
|
|
|
|
|
|
|
|||||
|
Class A Common Stock |
|
339 |
|
— |
|
— |
|
— |
|
339 |
|
|||||
|
Class B Common Stock |
|
40 |
|
— |
|
— |
|
— |
|
40 |
|
|||||
|
Class C Common Stock |
|
164 |
|
— |
|
— |
|
— |
|
164 |
|
|||||
|
Common stock |
|
— |
|
1 |
|
— |
|
(1 |
) |
— |
|
|||||
|
Additional paid-in-capital |
|
139,702 |
|
— |
|
— |
|
— |
|
139,702 |
|
|||||
|
Class A Treasury stock |
|
(99 |
) |
— |
|
— |
|
— |
|
(99 |
) |
|||||
|
Accumulated other comprehensive loss |
|
(156 |
) |
(156 |
) |
— |
|
156 |
|
(156 |
) |
|||||
|
Accumulative deficit |
|
(53,039 |
) |
(1,279 |
) |
(47,392 |
) |
48,671 |
|
(53,039 |
) |
|||||
|
Total stockholders’ equity |
|
86,951 |
|
(1,434 |
) |
(47,392 |
) |
48,826 |
|
86,951 |
|
|||||
|
Total liabilities and stockholders’ equity |
|
$ |
145,677 |
|
$ |
490 |
|
$ |
192,502 |
|
$ |
(136,649 |
) |
$ |
202,020 |
|
MXENERGY HOLDINGS INC.
Consolidating Balance Sheet
June 30, 2009
(in thousands)
|
|
|
MXenergy |
|
Non-guarantor |
|
Guarantor |
|
Eliminations |
|
Consolidated |
|
|||||
|
|
|
|
|
|
|
|
|
|
|
|
|
|||||
|
Assets: |
|
|
|
|
|
|
|
|
|
|
|
|||||
|
Current assets: |
|
|
|
|
|
|
|
|
|
|
|
|||||
|
Cash and cash equivalents |
|
$ |
— |
|
$ |
262 |
|
$ |
23,004 |
|
$ |
— |
|
$ |
23,266 |
|
|
Restricted cash |
|
— |
|
— |
|
75,368 |
|
— |
|
75,368 |
|
|||||
|
Intercompany accounts receivable |
|
20,939 |
|
— |
|
— |
|
(20,939 |
) |
— |
|
|||||
|
Accounts receivable, net |
|
— |
|
56 |
|
47,542 |
|
— |
|
47,598 |
|
|||||
|
Natural gas inventories |
|
— |
|
— |
|
29,415 |
|
— |
|
29,415 |
|
|||||
|
Current portion of unrealized gains from risk management activities, net |
|
— |
|
— |
|
294 |
|
— |
|
294 |
|
|||||
|
Income taxes receivable |
|
— |
|
— |
|
6,461 |
|
— |
|
6,461 |
|
|||||
|
Deferred income taxes |
|
— |
|
— |
|
9,020 |
|
— |
|
9,020 |
|
|||||
|
Other current assets |
|
— |
|
87 |
|
11,997 |
|
— |
|
12,084 |
|
|||||
|
Total current assets |
|
20,939 |
|
405 |
|
203,101 |
|
(20,939 |
) |
203,506 |
|
|||||
|
|
|
|
|
|
|
|
|
|
|
|
|
|||||
|
Goodwill |
|
— |
|
— |
|
3,810 |
|
— |
|
3,810 |
|
|||||
|
Customer acquisition costs, net |
|
— |
|
28 |
|
27,922 |
|
— |
|
27,950 |
|
|||||
|
Fixed assets, net |
|
— |
|
1 |
|
3,727 |
|
— |
|
3,728 |
|
|||||
|
Deferred income taxes |
|
— |
|
— |
|
15,089 |
|
— |
|
15,089 |
|
|||||
|
Deferred debt issue costs |
|
— |
|
— |
|
4,475 |
|
— |
|
4,475 |
|
|||||
|
Intercompany notes receivable |
|
165,200 |
|
— |
|
— |
|
(165,200 |
) |
— |
|
|||||
|
Investment in subsidiaries |
|
(40,169 |
) |
— |
|
— |
|
40,169 |
|
— |
|
|||||
|
Other assets |
|
— |
|
— |
|
513 |
|
— |
|
513 |
|
|||||
|
Total assets |
|
$ |
145,970 |
|
$ |
434 |
|
$ |
258,637 |
|
$ |
(145,970 |
) |
$ |
259,071 |
|
|
|
|
|
|
|
|
|
|
|
|
|
|
|||||
|
Liabilities and stockholders’ equity: |
|
|
|
|
|
|
|
|
|
|
|
|||||
|
Current liabilities: |
|
|
|
|
|
|
|
|
|
|
|
|||||
|
Accounts payable and accrued liabilities |
|
$ |
12 |
|
$ |
160 |
|
$ |
42,975 |
|
$ |
— |
|
$ |
43,147 |
|
|
Intercompany accounts payable |
|
— |
|
1,845 |
|
19,094 |
|
(20,939 |
) |
— |
|
|||||
|
Current portion of unrealized losses from risk management activities, net |
|
— |
|
— |
|
34,224 |
|
— |
|
34,224 |
|
|||||
|
Deferred revenue |
|
— |
|
— |
|
4,271 |
|
— |
|
4,271 |
|
|||||
|
Bridge Financing loans payable |
|
— |
|
— |
|
5,400 |
|
— |
|
5,400 |
|
|||||
|
Denham Credit Facility |
|
— |
|
— |
|
12,000 |
|
— |
|
12,000 |
|
|||||
|
Total current liabilities |
|
12 |
|
2,005 |
|
117,964 |
|
(20,939 |
) |
99,042 |
|
|||||
|
Unrealized losses from risk management activities, net |
|
— |
|
— |
|
14,071 |
|
— |
|
14,071 |
|
|||||
|
Long-term debt |
|
163,476 |
|
— |
|
— |
|
— |
|
163,476 |
|
|||||
|
Intercompany notes payable |
|
— |
|
— |
|
165,200 |
|
(165,200 |
) |
— |
|
|||||
|
Total liabilities |
|
163,488 |
|
2,005 |
|
297,235 |
|
(186,139 |
) |
276,589 |
|
|||||
|
|
|
|
|
|
|
|
|
|
|
|
|
|||||
|
Commitments and contingencies |
|
— |
|
— |
|
— |
|
— |
|
— |
|
|||||
|
|
|
|
|
|
|
|
|
|
|
|
|
|||||
|
Redeemable convertible preferred stock |
|
54,632 |
|
— |
|
— |
|
— |
|
54,632 |
|
|||||
|
|
|
|
|
|
|
|
|
|
|
|
|
|||||
|
Stockholders’ equity: |
|
|
|
|
|
|
|
|
|
|
|
|||||
|
Common stock |
|
47 |
|
1 |
|
— |
|
(1 |
) |
47 |
|
|||||
|
Additional paid-in-capital |
|
18,275 |
|
— |
|
— |
|
— |
|
18,275 |
|
|||||
|
Contributed capital |
|
— |
|
(1 |
) |
24,386 |
|
(24,385 |
) |
— |
|
|||||
|
Accumulated other comprehensive loss |
|
(3 |
) |
(3 |
) |
— |
|
3 |
|
(3 |
) |
|||||
|
Accumulated deficit |
|
(90,469 |
) |
(1,568 |
) |
(62,984 |
) |
64,552 |
|
(90,469 |
) |
|||||
|
Total stockholders’ equity |
|
(72,150 |
) |
(1,571 |
) |
(38,598 |
) |
40,169 |
|
(72,150 |
) |
|||||
|
Total liabilities and stockholders’ equity |
|
$ |
145,970 |
|
$ |
434 |
|
$ |
258,637 |
|
$ |
(145,970 |
) |
$ |
259,071 |
|
MXENERGY HOLDINGS INC.
Consolidating Statement of Operations
Fiscal Year Ended June 30, 2010
(in thousands)
|
|
|
MXenergy |
|
Non-guarantor |
|
Guarantor |
|
Eliminations |
|
Consolidated |
|
|||||
|
|
|
|
|
|
|
|
|
|
|
|
|
|||||
|
Sales of natural gas and electricity |
|
$ |
— |
|
$ |
553 |
|
$ |
560,653 |
|
$ |
— |
|
$ |
561,206 |
|
|
Cost of goods sold (excluding depreciation and amortization): |
|
|
|
|
|
|
|
|
|
|
|
|||||
|
Cost of natural gas and electricity sold |
|
— |
|
345 |
|
386,589 |
|
— |
|
386,934 |
|
|||||
|
Realized losses from risk management activities |
|
— |
|
— |
|
48,211 |
|
— |
|
48,211 |
|
|||||
|
Unrealized losses from risk management activities |
|
— |
|
— |
|
(27,139 |
) |
— |
|
(27,139 |
) |
|||||
|
|
|
— |
|
345 |
|
407,661 |
|
— |
|
408,006 |
|
|||||
|
Gross profit |
|
— |
|
208 |
|
152,992 |
|
— |
|
153,200 |
|
|||||
|
|
|
|
|
|
|
|
|
|
|
|
|
|||||
|
Operating expenses: |
|
|
|
|
|
|
|
|
|
|
|
|||||
|
General and administrative expenses |
|
2,364 |
|
(113 |
) |
56,352 |
|
— |
|
58,603 |
|
|||||
|
Advertising and marketing expenses |
|
— |
|
— |
|
3,749 |
|
— |
|
3,749 |
|
|||||
|
Reserves and discounts |
|
— |
|
— |
|
7,495 |
|
— |
|
7,495 |
|
|||||
|
Depreciation and amortization |
|
— |
|
31 |
|
22,143 |
|
— |
|
22,174 |
|
|||||
|
Equity in operations of consolidated subsidiaries |
|
(13,869 |
) |
— |
|
— |
|
13,869 |
|
— |
|
|||||
|
Total operating expenses |
|
(11,505 |
) |
(82 |
) |
89,739 |
|
13,869 |
|
92,021 |
|
|||||
|
|
|
|
|
|
|
|
|
|
|
|
|
|||||
|
Operating profit |
|
11,505 |
|
290 |
|
63,253 |
|
(13,869 |
) |
61,179 |
|
|||||
|
Interest expense, net |
|
— |
|
— |
|
34,982 |
|
— |
|
34,982 |
|
|||||
|
Income before income tax expense |
|
11,505 |
|
290 |
|
28,271 |
|
(13,869 |
) |
26,197 |
|
|||||
|
Income tax expense |
|
— |
|
— |
|
(14,692 |
) |
— |
|
(14,692 |
) |
|||||
|
Net income |
|
$ |
11,505 |
|
$ |
290 |
|
$ |
13,579 |
|
$ |
(13,869 |
) |
$ |
11,505 |
|
MXENERGY HOLDINGS INC.
Consolidating Statement of Operations
Fiscal Year Ended June 30, 2009
(in thousands)
|
|
|
MXenergy |
|
Non-guarantor |
|
Guarantor |
|
Eliminations |
|
Consolidated |
|
|||||
|
|
|
|
|
|
|
|
|
|
|
|
|
|||||
|
Sales of natural gas and electricity |
|
$ |
— |
|
$ |
358 |
|
$ |
789,422 |
|
$ |
— |
|
$ |
789,780 |
|
|
Cost of goods sold (excluding depreciation and amortization): |
|
|
|
|
|
|
|
|
|
|
|
|||||
|
Cost of natural gas and electricity sold |
|
— |
|
348 |
|
596,399 |
|
— |
|
596,747 |
|
|||||
|
Realized losses from risk management activities |
|
— |
|
— |
|
72,824 |
|
— |
|
72,824 |
|
|||||
|
Unrealized losses from risk management activities |
|
— |
|
— |
|
87,575 |
|
|
|
87,575 |
|
|||||
|
|
|
— |
|
348 |
|
756,798 |
|
— |
|
757,146 |
|
|||||
|
Gross profit |
|
— |
|
10 |
|
32,624 |
|
— |
|
32,634 |
|
|||||
|
Operating expenses: |
|
|
|
|
|
|
|
|
|
|
|
|||||
|
General and administrative expenses |
|
519 |
|
733 |
|
58,705 |
|
— |
|
59,957 |
|
|||||
|
Advertising and marketing expenses |
|
— |
|
(454 |
) |
2,571 |
|
— |
|
2,117 |
|
|||||
|
Reserves and discounts |
|
— |
|
— |
|
15,130 |
|
— |
|
15,130 |
|
|||||
|
Depreciation and amortization |
|
— |
|
31 |
|
37,544 |
|
— |
|
37,575 |
|
|||||
|
Equity in operations of consolidated subsidiaries |
|
99,682 |
|
— |
|
— |
|
(99,682 |
) |
— |
|
|||||
|
Total operating expenses |
|
100,201 |
|
310 |
|
113,950 |
|
(99,682 |
) |
114,779 |
|
|||||
|
|
|
|
|
|
|
|
|
|
|
|
|
|||||
|
Operating (loss) profit |
|
(100,201 |
) |
(300 |
) |
(81,326 |
) |
99,682 |
|
(82,145 |
) |
|||||
|
Interest expense, net |
|
— |
|
— |
|
45,305 |
|
— |
|
45,305 |
|
|||||
|
(Loss) income before income tax benefit (expense) |
|
(100,201 |
) |
(300 |
) |
(126,631 |
) |
99,682 |
|
(127,450 |
) |
|||||
|
Income tax benefit (expense) |
|
— |
|
— |
|
27,249 |
|
— |
|
27,249 |
|
|||||
|
Net (loss) income |
|
$ |
(100,201 |
) |
$ |
(300 |
) |
$ |
(99,382 |
) |
$ |
99,682 |
|
$ |
(100,201 |
) |
MXENERGY HOLDINGS INC.
Consolidating Statement of Operations
Fiscal Year Ended June 30, 2008
(dollars in thousands)
|
|
|
MXenergy |
|
Non-guarantor |
|
Guarantor |
|
Eliminations |
|
Consolidated |
|
|||||
|
|
|
|
|
|
|
|
|
|
|
|
|
|||||
|
Sales of natural gas and electricity |
|
$ |
— |
|
$ |
1,481 |
|
$ |
750,802 |
|
$ |
— |
|
$ |
752,283 |
|
|
Cost of goods sold (excluding depreciation and amortization): |
|
|
|
|
|
|
|
|
|
|
|
|||||
|
Cost of natural gas and electricity sold |
|
— |
|
1,402 |
|
628,604 |
|
— |
|
630,006 |
|
|||||
|
Realized losses from risk management activities |
|
— |
|
— |
|
6,747 |
|
— |
|
6,747 |
|
|||||
|
Unrealized losses from risk management activities |
|
— |
|
— |
|
(67,168 |
) |
|
|
(67,168 |
) |
|||||
|
|
|
— |
|
1,402 |
|
568,183 |
|
— |
|
569,585 |
|
|||||
|
Gross profit |
|
— |
|
79 |
|
182,619 |
|
— |
|
182,698 |
|
|||||
|
Operating expenses: |
|
|
|
|
|
|
|
|
|
|
|
|||||
|
General and administrative expenses |
|
1,704 |
|
505 |
|
60,062 |
|
— |
|
62,271 |
|
|||||
|
Advertising and marketing expenses |
|
— |
|
(426 |
) |
4,972 |
|
— |
|
4,546 |
|
|||||
|
Reserves and discounts |
|
— |
|
— |
|
7,130 |
|
— |
|
7,130 |
|
|||||
|
Depreciation and amortization |
|
— |
|
36 |
|
32,662 |
|
— |
|
32,698 |
|
|||||
|
Equity in operations of consolidated subsidiaries |
|
(26,497 |
) |
— |
|
— |
|
26,497 |
|
— |
|
|||||
|
Total operating expenses |
|
(24,793 |
) |
115 |
|
104,826 |
|
26,497 |
|
106,645 |
|
|||||
|
|
|
|
|
|
|
|
|
|
|
|
|
|||||
|
Operating (loss) profit |
|
24,793 |
|
(36 |
) |
77,793 |
|
(26,497 |
) |
76,053 |
|
|||||
|
Interest expense, net |
|
— |
|
— |
|
34,105 |
|
— |
|
34,105 |
|
|||||
|
(Loss) income before income tax benefit (expense) |
|
24,793 |
|
(36 |
) |
43,688 |
|
(26,497 |
) |
41,948 |
|
|||||
|
Income tax benefit (expense) |
|
— |
|
— |
|
(17,155 |
) |
— |
|
(17,155 |
) |
|||||
|
Net (loss) income |
|
$ |
24,793 |
|
$ |
(36 |
) |
$ |
26,533 |
|
$ |
(26,497 |
) |
$ |
24,793 |
|
MXENERGY HOLDINGS INC.
Consolidating Statement of Cash Flows
Fiscal Year Ended June 30, 2010
(in thousands)
|
|
|
MXenergy |
|
Non-guarantor |
|
Guarantor |
|
Eliminations |
|
Consolidated |
|
|||||
|
Operating activities: |
|
|
|
|
|
|
|
|
|
|
|
|||||
|
Net income |
|
$ |
11,505 |
|
$ |
290 |
|
$ |
13,579 |
|
$ |
(13,869 |
) |
$ |
11,505 |
|
|
Adjustments to reconcile net income to net cash provided by operating activities: |
|
|
|
|
|
|
|
|
|
|
|
|||||
|
Unrealized gains from risk management activities |
|
— |
|
— |
|
(27,139 |
) |
— |
|
(27,139 |
) |
|||||
|
Stock compensation expense |
|
2,363 |
|
— |
|
— |
|
— |
|
2,363 |
|
|||||
|
Provision for doubtful accounts |
|
— |
|
— |
|
5,164 |
|
— |
|
5,164 |
|
|||||
|
Depreciation and amortization |
|
— |
|
31 |
|
22,143 |
|
— |
|
22,174 |
|
|||||
|
Deferred tax expense (benefit) |
|
— |
|
— |
|
19,102 |
|
— |
|
19,102 |
|
|||||
|
Non-cash interest expense, primarily unrealized (gains) losses on interest rate swaps and amortization of debt issuance costs |
|
— |
|
— |
|
10,146 |
|
— |
|
10,146 |
|
|||||
|
Amortization of customer contracts acquired |
|
— |
|
— |
|
(50 |
) |
— |
|
(50 |
) |
|||||
|
Equity in operations of consolidated subsidiaries |
|
(13,869 |
) |
— |
|
— |
|
13,869 |
|
— |
|
|||||
|
Changes in assets and liabilities: |
|
|
|
|
|
|
|
|
|
|
|
|||||
|
Restricted cash |
|
— |
|
— |
|
73,794 |
|
— |
|
73,794 |
|
|||||
|
Accounts receivable |
|
— |
|
12 |
|
(6,503 |
) |
— |
|
(6,491 |
) |
|||||
|
Due from Sempra |
|
— |
|
— |
|
(43,054 |
) |
— |
|
(43,054 |
) |
|||||
|
Natural gas inventories |
|
— |
|
— |
|
13,554 |
|
— |
|
13,554 |
|
|||||
|
Income taxes receivable |
|
— |
|
— |
|
398 |
|
— |
|
398 |
|
|||||
|
Fixed Rate Notes Escrow Account |
|
(8,977 |
) |
— |
|
— |
|
— |
|
(8,977 |
) |
|||||
|
Other assets |
|
(29 |
) |
26 |
|
(5,064 |
) |
— |
|
(5,067 |
) |
|||||
|
Customer acquisition costs |
|
— |
|
— |
|
(21,863 |
) |
— |
|
(21,863 |
) |
|||||
|
Accounts payable and accrued liabilities |
|
(8 |
) |
(36 |
) |
(12,751 |
) |
— |
|
(12,795 |
) |
|||||
|
Deferred revenue |
|
— |
|
— |
|
3,186 |
|
— |
|
3,186 |
|
|||||
|
Net cash (used in) provided by operating activities |
|
(9,015 |
) |
323 |
|
44,642 |
|
— |
|
35,950 |
|
|||||
|
|
|
|
|
|
|
|
|
|
|
|
|
|||||
|
Investing activities: |
|
|
|
|
|
|
|
|
|
|
|
|||||
|
Purchases of fixed assets |
|
— |
|
— |
|
(1,328 |
) |
— |
|
(1,328 |
) |
|||||
|
Purchase of GasKey assets of PS Energy Group, Inc. |
|
— |
|
— |
|
(433 |
) |
— |
|
(433 |
) |
|||||
|
Purchase of assets of Vantage Power Services L.P. |
|
|
|
|
|
(36 |
) |
|
|
(36 |
) |
|||||
|
Net cash used in investing activities |
|
— |
|
— |
|
(1,797 |
) |
— |
|
(1,797 |
) |
|||||
|
|
|
|
|
|
|
|
|
|
|
|
|
|||||
|
Financing activities: |
|
|
|
|
|
|
|
|
|
|
|
|||||
|
Repayment of Floating Rate Notes due 2011 |
|
(26,700 |
) |
— |
|
— |
|
— |
|
(26,700 |
) |
|||||
|
Repayment of Floating Rate Notes due 2014 |
|
(423 |
) |
— |
|
— |
|
— |
|
(423 |
) |
|||||
|
Repayment of Denham Credit Facility |
|
— |
|
— |
|
(12,000 |
) |
— |
|
(12,000 |
) |
|||||
|
Repayment of Bridge Financing under the Revolving Credit Facility |
|
— |
|
— |
|
(5,400 |
) |
— |
|
(5,400 |
) |
|||||
|
Net intercompany transfers |
|
36,588 |
|
(201 |
) |
(36,387 |
) |
— |
|
— |
|
|||||
|
Debt issuance costs |
|
— |
|
— |
|
(6,248 |
) |
— |
|
(6,248 |
) |
|||||
|
Acquisition of Class A treasury stock |
|
(99 |
) |
— |
|
— |
|
— |
|
(99 |
) |
|||||
|
Stock issuance costs |
|
(329 |
) |
— |
|
— |
|
— |
|
(329 |
) |
|||||
|
Net cash provided by (used in) financing activities |
|
9,037 |
|
(201 |
) |
(60,035 |
) |
— |
|
(51,199 |
) |
|||||
|
|
|
|
|
|
|
|
|
|
|
|
|
|||||
|
Net increase (decrease) in cash and cash equivalents |
|
22 |
|
122 |
|
(17,190 |
) |
— |
|
(17,046 |
) |
|||||
|
Cash and cash equivalents at beginning of period |
|
— |
|
262 |
|
23,004 |
|
— |
|
23,266 |
|
|||||
|
Cash and cash equivalents at end of period |
|
$ |
22 |
|
$ |
384 |
|
$ |
5,814 |
|
$ |
— |
|
$ |
6,220 |
|
MXENERGY HOLDINGS INC.
Consolidating Statement of Cash Flows
Fiscal Year Ended June 30, 2009
(in thousands)
|
|
|
MXenergy |
|
Non-guarantor |
|
Guarantor |
|
Eliminations |
|
Consolidated |
|
|||||
|
Operating activities: |
|
|
|
|
|
|
|
|
|
|
|
|||||
|
Net loss |
|
$ |
(100,201 |
) |
$ |
(300 |
) |
$ |
(99,382 |
) |
$ |
99,682 |
|
$ |
(100,201 |
) |
|
Adjustments to reconcile net loss to net cash used in operating activities: |
|
|
|
|
|
|
|
|
|
|
|
|||||
|
Unrealized losses from risk management activities, net |
|
— |
|
— |
|
87,575 |
|
— |
|
87,575 |
|
|||||
|
Stock compensation expense |
|
519 |
|
— |
|
— |
|
— |
|
519 |
|
|||||
|
Provision for doubtful accounts |
|
— |
|
— |
|
12,009 |
|
— |
|
12,009 |
|
|||||
|
Depreciation and amortization |
|
— |
|
31 |
|
37,544 |
|
— |
|
37,575 |
|
|||||
|
Deferred tax expense (benefit) |
|
— |
|
— |
|
(23,406 |
) |
— |
|
(23,406 |
) |
|||||
|
Non-cash interest expense, primarily unrealized (gains) losses on interest rate swaps and amortization of debt issuance costs |
|
— |
|
— |
|
16,233 |
|
— |
|
16,233 |
|
|||||
|
Amortization of customer contracts acquired |
|
— |
|
— |
|
(634 |
) |
— |
|
(634 |
) |
|||||
|
Equity in operations of consolidated subsidiaries |
|
99,682 |
|
— |
|
— |
|
(99,682 |
) |
— |
|
|||||
|
Changes in assets and liabilities: |
|
|
|
|
|
|
|
|
|
|
|
|||||
|
Restricted cash |
|
— |
|
— |
|
(74,781 |
) |
— |
|
(74,781 |
) |
|||||
|
Accounts receivable |
|
— |
|
(28 |
) |
28,094 |
|
— |
|
28,066 |
|
|||||
|
Natural gas inventories |
|
— |
|
— |
|
36,509 |
|
— |
|
36,509 |
|
|||||
|
Income taxes receivable |
|
— |
|
— |
|
1,063 |
|
— |
|
1,063 |
|
|||||
|
Other assets |
|
(1,278 |
) |
350 |
|
(7,944 |
) |
— |
|
(8,872 |
) |
|||||
|
Customer acquisition costs |
|
— |
|
59 |
|
(14,845 |
) |
— |
|
(14,786 |
) |
|||||
|
Accounts payable and accrued liabilities |
|
— |
|
(820 |
) |
(45,733 |
) |
— |
|
(46,553 |
) |
|||||
|
Deferred revenue |
|
— |
|
— |
|
(3,164 |
) |
— |
|
(3,164 |
) |
|||||
|
Net cash used in operating activities |
|
(1,278 |
) |
(708 |
) |
(50,862 |
) |
— |
|
(52,848 |
) |
|||||
|
|
|
|
|
|
|
|
|
|
|
|
|
|||||
|
Investing activities: |
|
|
|
|
|
|
|
|
|
|
|
|||||
|
Purchases of fixed assets |
|
— |
|
— |
|
(1,001 |
) |
— |
|
(1,001 |
) |
|||||
|
Purchase of assets of Catalyst Natural Gas LLC |
|
— |
|
— |
|
(1,609 |
) |
— |
|
(1,609 |
) |
|||||
|
Purchase of GasKey assets of PS Energy Group, Inc. |
|
— |
|
— |
|
(500 |
) |
— |
|
(500 |
) |
|||||
|
Purchase of assets of Vantage Power Services L.P. |
|
|
|
|
|
(57 |
) |
|
|
(57 |
) |
|||||
|
Net cash used in investing activities |
|
— |
|
— |
|
(3,167 |
) |
— |
|
(3,167 |
) |
|||||
|
|
|
|
|
|
|
|
|
|
|
|
|
|||||
|
Financing activities: |
|
|
|
|
|
|
|
|
|
|
|
|||||
|
Proceeds from Denham Credit Facility |
|
— |
|
— |
|
12,000 |
|
— |
|
12,000 |
|
|||||
|
Proceeds from Bridge Financing Loans under the Revolving Credit Facility |
|
— |
|
— |
|
10,400 |
|
— |
|
10,400 |
|
|||||
|
Repayment of Bridge Financing Loans under the Revolving Credit Facility |
|
|
|
|
|
(5,000 |
) |
— |
|
(5,000 |
) |
|||||
|
Proceeds from cash advances under the Revolving Credit Facility |
|
— |
|
— |
|
30,000 |
|
— |
|
30,000 |
|
|||||
|
Repayment of cash advances under the Revolving Credit Facility |
|
— |
|
— |
|
(30,000 |
) |
— |
|
(30,000 |
) |
|||||
|
Net intercompany transfers |
|
1,289 |
|
|
|
(1,289 |
) |
— |
|
— |
|
|||||
|
Debt issuance costs |
|
— |
|
— |
|
(10,066 |
) |
— |
|
(10,066 |
) |
|||||
|
Purchase and cancellation of treasury shares |
|
(11 |
) |
— |
|
— |
|
— |
|
(11 |
) |
|||||
|
Net cash provided by financing activities |
|
1,278 |
|
— |
|
6,045 |
|
— |
|
7,323 |
|
|||||
|
|
|
|
|
|
|
|
|
|
|
|
|
|||||
|
Net decrease in cash and cash equivalents |
|
— |
|
(708 |
) |
(47,984 |
) |
— |
|
(48,692 |
) |
|||||
|
Cash and cash equivalents at beginning of period |
|
— |
|
970 |
|
70,988 |
|
— |
|
71,958 |
|
|||||
|
Cash and cash equivalents at end of period |
|
$ |
— |
|
$ |
262 |
|
$ |
23,004 |
|
$ |
— |
|
$ |
23,266 |
|
MXENERGY HOLDINGS INC.
Consolidating Statement of Cash Flows
Fiscal Year Ended June 30, 2008
(in thousands)
|
|
|
MXenergy |
|
Non-guarantor |
|
Guarantor |
|
Eliminations |
|
Consolidated |
|
|||||
|
Operating activities: |
|
|
|
|
|
|
|
|
|
|
|
|||||
|
Net loss |
|
$ |
24,793 |
|
$ |
(36 |
) |
$ |
26,533 |
|
$ |
(26,497 |
) |
$ |
24,793 |
|
|
Adjustments to reconcile net loss to net cash used in operating activities: |
|
|
|
|
|
|
|
|
|
|
|
|||||
|
Unrealized losses from risk management activities, net |
|
— |
|
— |
|
(67,168 |
) |
— |
|
(67,168 |
) |
|||||
|
Stock compensation expense |
|
1,704 |
|
— |
|
— |
|
— |
|
1,704 |
|
|||||
|
Provision for doubtful accounts |
|
— |
|
— |
|
5,050 |
|
— |
|
5,050 |
|
|||||
|
Depreciation and amortization |
|
— |
|
36 |
|
32,662 |
|
— |
|
32,698 |
|
|||||
|
Deferred tax expense (benefit) |
|
— |
|
— |
|
18,187 |
|
— |
|
18,187 |
|
|||||
|
Non-cash interest expense, primarily unrealized (gains) losses on interest rate swaps and amortization of debt issuance costs |
|
— |
|
— |
|
10,836 |
|
— |
|
10,836 |
|
|||||
|
Amortization of customer contracts acquired |
|
— |
|
— |
|
(762 |
) |
— |
|
(762 |
) |
|||||
|
Equity in operations of consolidated subsidiaries |
|
(26,497 |
) |
— |
|
— |
|
26,497 |
|
— |
|
|||||
|
Changes in assets and liabilities: |
|
|
|
|
|
|
|
|
|
|
|
|||||
|
Restricted cash |
|
— |
|
— |
|
463 |
|
— |
|
463 |
|
|||||
|
Accounts receivable |
|
— |
|
93 |
|
(35,324 |
) |
— |
|
(35,231 |
) |
|||||
|
Natural gas inventories |
|
— |
|
— |
|
(7,308 |
) |
— |
|
(7,308 |
) |
|||||
|
Income taxes receivable |
|
— |
|
— |
|
(7,173 |
) |
— |
|
(7,173 |
) |
|||||
|
Other assets |
|
1,343 |
|
(194 |
) |
1,958 |
|
— |
|
3,107 |
|
|||||
|
Customer acquisition costs |
|
— |
|
(47 |
) |
(18,146 |
) |
— |
|
(18,193 |
) |
|||||
|
Accounts payable and accrued liabilities |
|
— |
|
981 |
|
16,901 |
|
— |
|
17,882 |
|
|||||
|
Deferred revenue |
|
— |
|
— |
|
(4,352 |
) |
— |
|
(4,352 |
) |
|||||
|
Net cash provided by (used in) operating activities |
|
1,343 |
|
833 |
|
(27,643 |
) |
— |
|
(25,467 |
) |
|||||
|
|
|
|
|
|
|
|
|
|
|
|
|
|||||
|
Investing activities: |
|
|
|
|
|
|
|
|
|
|
|
|||||
|
Purchases of fixed assets |
|
— |
|
— |
|
(1,959 |
) |
— |
|
(1,959 |
) |
|||||
|
Loan to PS Energy Group, Inc. related to purchase of GasKey assets |
|
— |
|
— |
|
(8,983 |
) |
— |
|
(8,983 |
) |
|||||
|
Cash received from PS Energy Group, Inc. for repayment of loan |
|
— |
|
— |
|
8,983 |
|
— |
|
8,983 |
|
|||||
|
Purchase of GasKey assets from PS Energy Group, Inc. |
|
— |
|
— |
|
(13,011 |
) |
— |
|
(13,011 |
) |
|||||
|
Purchase of assets of Vantage Power Services L.P. |
|
|
|
|
|
(778 |
) |
|
|
(778 |
) |
|||||
|
Net cash used in investing activities |
|
— |
|
— |
|
(15,748 |
) |
— |
|
(15,748 |
) |
|||||
|
|
|
|
|
|
|
|
|
|
|
|
|
|||||
|
Financing activities: |
|
|
|
|
|
|
|
|
|
|
|
|||||
|
Repayment of Denham Credit Facility |
|
(11,040 |
) |
— |
|
— |
|
— |
|
(11,040 |
) |
|||||
|
Repurchase of Floating Rate Notes due 2011 |
|
(12,006 |
) |
— |
|
— |
|
— |
|
(12,006 |
) |
|||||
|
Issuance of common stock from exercise of warrants and options |
|
387 |
|
— |
|
— |
|
— |
|
387 |
|
|||||
|
Issuance of common stock from other executive compensation |
|
952 |
|
— |
|
— |
|
— |
|
952 |
|
|||||
|
Net intercompany transfers |
|
21,119 |
|
|
|
(21,119 |
) |
|
|
|
|
|||||
|
Debt issuance costs |
|
— |
|
— |
|
(1,307 |
) |
— |
|
(1,307 |
) |
|||||
|
Purchase and cancellation of treasury shares |
|
(755 |
) |
— |
|
— |
|
— |
|
(755 |
) |
|||||
|
Net cash used in financing activities |
|
(1,343 |
) |
— |
|
(22,426 |
) |
— |
|
(23,769 |
) |
|||||
|
|
|
|
|
|
|
|
|
|
|
|
|
|||||
|
Net decrease in cash and cash equivalents |
|
— |
|
833 |
|
(65,817 |
) |
— |
|
(64,984 |
) |
|||||
|
Cash and cash equivalents at beginning of period |
|
— |
|
137 |
|
136,805 |
|
— |
|
136,942 |
|
|||||
|
Cash and cash equivalents at end of period |
|
$ |
— |
|
$ |
970 |
|
$ |
70,988 |
|
$ |
— |
|
$ |
71,958 |
|
Note 25. Subsequent Events
The Company has evaluated subsequent events for the period from July 1, 2010 through the date on which these consolidated financial statements were issued. Based upon this evaluation, there were no material events or transactions during this period that required recognition or disclosure in these consolidated financial statements.
ITEM 9. CHANGES IN AND
DISAGREEMENTS WITH ACCOUNTANTS
ON ACCOUNTING AND FINANCIAL DISCLOSURE
None.
ITEM 9A(T). CONTROLS AND PROCEDURES
Disclosure Controls
We maintain a system of internal control over financial reporting and disclosure controls and procedures designed to ensure that information required to be disclosed in reports filed or submitted under the Exchange Act is recorded, processed, summarized and reported within the time periods specified in the Securities and Exchange Commission’s rules and forms, and accumulated and communicated to our management, including our Chief Executive Officer and our Chief Financial Officer, to allow timely decisions regarding required disclosure. Our Board of Directors, operating through its Audit Committee, also provides oversight to the financial reporting process.
An evaluation was conducted, with the participation of the Chief Executive Officer and Chief Financial Officer, of the effectiveness of our disclosure controls and procedures as of the end of the period covered by this Annual Report. Based on that evaluation, the Chief Executive Officer and Chief Financial Officer have concluded that our disclosure controls and procedures were not effective, as of the end of the period covered by this report, due to the material weakness in our internal control over financial reporting described below.
In designing and evaluating our disclosure controls and procedures, our management recognizes that any controls and procedures, no matter how well designed and operated, can provide only reasonable assurance of achieving the desired control objectives, and management necessarily is required to apply its judgment in designing and evaluating the controls and procedures. We regularly review our disclosure controls and procedures, and our internal control over financial reporting, and may from time to time make appropriate changes aimed at enhancing their effectiveness and ensure that our systems evolve with our business.
Management’s Annual Report on Internal Control Over Financial Reporting
Our management is responsible for establishing and maintaining an adequate system of internal control over financial reporting, as such term is defined in Rules 13a-15(f) and 15d-15(f) of the Exchange Act. Because of its inherent limitations, internal control over financial reporting cannot provide absolute assurance of achieving financial reporting objectives. Internal control over financial reporting is a process that involves human diligence and compliance and is subject to lapses in judgment and breakdowns resulting from human failures. Internal control over financial reporting also can be circumvented by collusion or improper management override. Because of such limitations, there is a risk that material misstatements may not be prevented or detected on a timely basis by internal control over financial reporting. Also, projections of any evaluation of effectiveness to future periods are subject to the risk that controls may become inadequate because of changes in conditions or that the degree of compliance with established policies or procedures may deteriorate.
Our management carried out an evaluation of the effectiveness of our internal control over financial reporting as of the end of the period covered by this Annual Report, with the participation of our Chief Executive Officer and Chief Financial Officer, using the criteria as required by Section 404 of the Sarbanes-Oxley Act, management, including testing using the criteria in Internal Control — Integrated Framework, issued by the Committee of Sponsoring Organizations of the Treadway Commission (“COSO”). Based upon their evaluation, our Chief Executive Officer and Chief Financial Officer concluded that there is a material weakness in our internal control over financial reporting. A material weakness is a deficiency, or a combination of deficiencies, in internal control over financial reporting such that there is a reasonable possibility that a material misstatement of the Company’s annual or interim financial statements will not be prevented or detected on a timely basis.
In our Annual Report on Form 10-K for the fiscal year ended June 30, 2009, we reported our conclusion that a combination of significant deficiencies, when considered in the aggregate, constituted a material weakness in our internal control over financial reporting. For certain of the deficiencies noted as of June 30, 2009, we instituted and tested new controls and processes, which we concluded were effective during fiscal year 2010.
Certain prior deficiencies still exist as of June 30, 2010, resulting in adjustments to our accounting records at June 30, 2010 for amounts that related to quarterly and annual periods previously reported. These adjustments were not deemed by management to be material, individually or in the aggregate, in relation to our financial position or results of operations, taken as a whole, for any annual or quarterly reporting period during fiscal years 2010 or 2009. However, we concluded that
the deficiency continues to be a material weakness in the design and operation of our internal controls over financial reporting as of June 30, 2010 such that there was a reasonable possibility that a material misstatement of our interim or annual financial statements would not have been prevented or detected on a timely basis. As of June 30, 2010, we have instituted enhanced processes and controls to remediate the outstanding deficiencies. However, as some of the new controls were completed late in our fiscal year, we have not yet adequately tested the effectiveness of the controls for all markets.
The Company’s management based its evaluation on criteria set forth in the framework in Internal Control—Integrated Framework issued by the COSO. Based on that assessment, management has concluded that the Company’s internal control over financial reporting was not effective as of June 30, 2010.
This Annual Report does not include an attestation report of our registered public accounting firm regarding internal control over financial reporting. Management’s report was not subject to attestation by our registered public accounting firm pursuant to rules of the Securities and Exchange Commission that permit the company to provide only management’s report in this Annual Report.
Changes in Internal Controls over Financial Reporting
Other than the remediation steps described above, there have been no changes in our system of internal control over financial reporting during the year ended June 30, 2010, that have materially affected, or are reasonably likely to materially affect, our internal control over financial reporting.
ITEM 10. DIRECTORS, EXECUTIVE OFFICERS AND CORPORATE GOVERNANCE
Executive Officers and Directors
As of July 27, 2010, our Board of Directors consists of nine members. All of our executive officers serve at the discretion of our Board of Directors, subject to their employment agreements described under “Item 11. Executive Compensation.”
The names and positions of our executive officers as of July 27, 2010 are presented in the following table. Descriptions of the business experience of our executive officers and directors follow the table.
|
Name |
|
Age |
|
Position |
|
|
|
|
|
|
|
Jeffrey A. Mayer |
|
58 |
|
President, CEO and Director |
|
Chaitu Parikh |
|
41 |
|
Executive Vice President and CFO |
|
Robert Blake |
|
54 |
|
Senior Vice President, Regulatory Affairs |
|
Gina Goldberg |
|
52 |
|
Senior Vice President, Marketing |
|
Ronnie V. Shields |
|
47 |
|
Vice President and Controller |
|
Robert Werner |
|
54 |
|
Senior Vice President, Supply |
|
Mark Bernstein |
|
40 |
|
Director |
|
Carl Adam Carte |
|
40 |
|
Director |
|
James N. Chapman |
|
48 |
|
Director |
|
Michael J. Hamilton |
|
63 |
|
Director |
|
William Landuyt |
|
54 |
|
Director |
|
Randal T. Maffett |
|
49 |
|
Director |
|
Jacqueline Mitchell |
|
49 |
|
Director |
|
Jonathan Moore |
|
50 |
|
Director |
Jeffrey A. Mayer is a co-founder of the Company and has been President and CEO since 1999. He has served as a director of Holdings since 2005. From 1992 to 1999, Mr. Mayer worked for Sempra Trading Corporation, a subsidiary of Sempra Energy (prior to 1997, known as AIG Trading Corporation, a subsidiary of AIG), and served as its Managing Director in charge of natural gas derivatives marketing. Mr. Mayer also served as Chairman of AIG Clearing Corporation, the futures clearing arm of AIG Trading and Chairman of AIG Securities Corporation, the securities affiliate of AIG Trading. Prior to joining AIG, Mr. Mayer worked at Goldman, Sachs & Co. where he managed the Energy Futures Department from 1989 to 1992, worked in the Futures Services Department from 1987 to 1989 and served as Chief Counsel of its J. Aron Commodities Division from 1984 to 1987. From 1978 to 1983, Mr. Mayer was an associate with the New York law firm of Barrett, Smith, Shapiro & Armstrong. Mr. Mayer served as a member (from 1997 to 2009) and as Chairman (from 2005 to 2009) of the Board of Finance of Westport, CT.
Chaitu Parikh currently serves as Executive Vice President and has been CFO of the Company since July 2004. Mr. Parikh also serves as the Company’s Principal Financial Officer. Mr. Parikh served as Vice President of Finance of the Company from December 2002 to July 2004. Prior to joining the Company, Mr. Parikh served as Vice President and Controller of The New Power Company from October 2001 to December 2002 and as the Chief Financial Officer of Alliance Energy Services from December 1996 to July 2001. Previously, Mr. Parikh served in public accounting with KPMG from 1991 to 1996. Mr. Parikh holds a Chartered Accountant designation from the Canadian Institute of Chartered Accountants.
Robert Blake currently serves as the Company’s Senior Vice President of Regulatory Affairs. Mr. Blake served as the Company’s Vice President of Electricity Operations and Regulatory Affairs from 2004 to May 2010 and as Vice President of Customer Operations from April 2001 to May 2004. Prior to joining the Company, Mr. Blake served as Manager of United Energy from January 2000 to March 2001, and served as Regional Sales Director for Conectiv Energy from April 1998 to January 2000. From 1980 to March 1998, Mr. Blake worked for United Illuminating, an electric utility in Connecticut, where he served as Director of Commercial & Industrial Energy Services. He has been involved with numerous national and regional electricity and energy committees and has held leadership positions with several regional energy groups, including chairing a NEPOOL task force.
Gina Goldberg has been Senior Vice President of Sales and Marketing of the Company since May 2010 and was Vice President of Sales and Marketing from 2004 to 2010. Prior to joining the Company as a consultant in November 2003, Ms. Goldberg held various marketing positions at Showtime Networks Inc. from 1984 to 2003, including the position of Senior Vice President of Marketing from 1998 to 2003. Ms. Goldberg also served as a member of the Viacom Inc. Marketing Board Council from 1998 to 2003. Previously, Ms. Goldberg worked in the Marketing Department of The Dallas Morning News from 1981 to 1984.
Ronnie V. Shields currently serves as the Company’s Vice President and Controller. He has served as Controller of the Company since August 2006. Mr. Shields also serves as the Company’s Principal Accounting Officer. Prior to joining the Company, Mr. Shields served as Controller for Shell Energy Services from 2003 to 2006 and Assistant Controller of The New Power Company from 2000 to 2003. Mr. Shields was Treasurer for Henley Healthcare, Inc., a publicly registered manufacturer of medical devices, from 1998 to 2000 and Vice President of Finance for Wilson Financial Group, a privately held company that acquired and managed funeral homes and cemeteries, from 1996 to 1998. From 1988 to 1996 Mr. Shields worked in the audit and business advisory practice of Arthur Andersen LLP, where he served a variety of clients across several industries.
Robert Werner has been Senior Vice President of Supply of the Company since May 2010 and was Vice President of Supply from 2006 to 2010. Prior to joining the Company, Mr. Werner had a 28-year career with Royal Dutch Shell in energy trading, supply chain management, and pipeline engineering and operations. From 2002 to 2006, Mr. Werner served as Vice President of Supply for SESCo, responsible for natural gas supply, commodity price exposure management and pricing. Prior to completing a two-year assignment in trading process and systems redesign in 2002, Mr. Werner spent 14 years in a variety of roles trading crude oil in the United States, Africa, Europe and South America. Mr. Werner is a retired professional engineer in the State of California.
Mark Bernstein has served as a director of Holdings since September 2009 and currently serves on the Audit Committee and the Executive, Compensation and Governance Committee. He is Chief Investment Officer of Private Investment X, LLC, a Houston-based private equity firm he founded in 2009 to acquire assets in the oil and gas industry. From 2006 until 2008, Mr. Bernstein served as Vice President of Constellation Energy Group, Inc., where he focused on upstream principal investments. In 2005, Mr. Bernstein consulted for Davis Petroleum Corp. regarding the establishment of the company’s risk management operations and recapitalization efforts. From 2002 until 2004, Mr. Bernstein was a founding principal of National Bank of Canada’s global risk management group in Houston. From 1996 until 2001, Mr. Bernstein was a Director at Enron Corp., working in the wholesale power division until 2001 when his focus changed to Enron Energy Services, a retail electricity provider. In 1995, Mr. Bernstein worked for Banc One Corp. Mr. Bernstein’s experience in the oil and gas industry, including his experience in retail energy, and his experience and leadership with risk management activities at various organizations, make him well-qualified to serve on the Company’s Board of Directors.
Carl Adam Carte was appointed as a director of Holdings in May 2010 and currently serves on the Audit Committee and the Risk Oversight Committee. Mr. Carte is a founding member and currently a partner of Fairlead Advisors LLC, where he provides strategic, commercial, valuation and financial expertise to private equity clients. From 2008 to 2010, Mr. Carte provided similar strategic, valuation and financial expertise to clients of Alea Management LLC, which he also co-founded. Mr. Carte was the chief financial officer of The Trigen Companies from 2006 to 2008. From 2008 to 2005, Mr. Carte was the Vice President and Treasurer for Texas-New Mexico Power/First Choice Power, an electric utility and retail electric provider serving approximately 275,000 customers based in Fort Worth, Texas. From 1993 to 2003, Mr. Carte worked at NRG Energy, Inc., where he served in various financial positions, including Vice President and Treasurer. Mr. Carte holds the Chartered Financial Analyst (CFA) designation and is a Certified Treasury Professional (CTP). He also serves on the board of directors of Euro Bioenergy Holdings S.a.r.l., a privately held biomass energy company that operates in Germany. Mr. Carte’s extensive experience in the energy industry and experience in various finance and treasury roles makes him well qualified to serve on the Company’s Board of Directors.
James N. Chapman has served as a director of Holdings since September 2009 and currently serves as Chairman of the Executive, Compensation and Governance Committee and as a member of the Risk
Oversight Committee. He is non-executive Vice Chairman of SkyWorks Leasing, LLC, an aircraft management services company based in Greenwich, Connecticut, which he joined in December 2004. From 2003 until 2004, Mr. Chapman was associated with Regiment Capital Advisors, LP, an investment advisor based in Boston specializing in high yield investments. From 2001 until 2003, Mr. Chapman acted as a capital markets and strategic planning consultant with private and public companies, as well as investment advisers and hedge funds, across a range of industries. Mr. Chapman presently serves as a member of the board of directors of AerCap Holdings NV, American Media, Inc., Hayes-Lemmerz International, Inc., Scottish Re Group Limited, Tembec Inc. and Neenah Enterprises, Inc. Mr. Chapman served as a director of LNR Property Corporation from November 2008 until July 2010. Mr. Chapman also serves on the Finance Committee of The Whitby School in Greenwich, CT. Mr. Chapman’s extensive experience in the capital markets and strategic planning, coupled with his board experience for many companies, makes him well-qualified to serve on the Company’s Board of Directors.
Michael J. Hamilton was elected as a director of Holdings in March 2008, and currently serves as Chairman of the Board of Directors, Chairman of the Audit Committee and as a member of the Executive, Compensation and Governance Committee. Mr. Hamilton served as Chairman and Chief Executive Officer of MMC Energy, Inc., a publicly traded merchant electricity generator that owned several generating units in California, until September 2009. Previously, Mr. Hamilton was the partner in charge of utility audit and tax at PricewaterhouseCoopers until he retired in 2003. He then served as a senior managing director at FTI Consulting where he specialized in bankruptcy and restructuring work, primarily in the merchant power industry. Mr. Hamilton is a certified public accountant with additional certifications in business valuation and financial forensics and is a certified turnaround professional. Mr. Hamilton is also a director of MMC Energy, Inc., Seven Arts Entertainment, Inc. and Gradient Resources (formerly Vulcan Power Company). Mr. Hamilton’s extensive experience in the energy industry and in public accounting makes him well-qualified to serve on the Company’s Board of Directors.
William Landuyt currently serves as a director of Holdings and has served as a director of the Company since 2004. Mr. Landuyt currently serves on the Executive, Compensation and Governance Committee. Mr. Landuyt is currently a managing director at Charterhouse Group, Inc., where he was also Senior Partner from 2003 to 2009. From 1996 to 2003, Mr. Landuyt served as the Chief Executive Officer and Chairman of the Board of Millennium Chemicals, Inc. Mr. Landuyt was previously employed by Hanson Industries where he served as President and Chief Executive Officer from June 1995 to October 1996. Mr. Landuyt held the positions of Finance Director of Hanson Plc from 1992 to May 1995 and Director of Hanson Plc from 1992 to October 1996. Mr. Landuyt served as Vice President and Chief Financial Officer of Hanson Industries from 1988 to 1992. Mr. Landuyt has served as a director of various Charterhouse portfolio companies since 2005, including Charter Lason, Inc., Top Image Systems, Ltd., Cellu Tissue Holdings, Inc., Charter Towne, Inc., Charter NewPath, LLC and AAT Communications Corp. Mr. Landuyt’s extensive experience in CEO and CFO roles with various companies, and his long-standing position as a director of the Company, makes him well-qualified to serve as a director of the Company.
Randal T. Maffett has served as a director of Holdings since September 2009 and currently serves as Chairman of the Risk Oversight Committee and as a member of the Audit Committee. In 2004, he founded Sendero Capital Partners, Inc., a private equity firm focused on investments, acquisitions and operations in the upstream and midstream sectors of the oil and gas industry, renewable energy and power generation industries, and is currently serving as its President and CEO. From 2002 until 2004, Mr. Maffett was head of the newly formed North American business development group of RWE AG. From 1993 until 2002, Mr. Maffett was responsible for multiple business units, including Enron North America, Enron International, Enron Strategic Ventures and Enron Global Markets, as well as for Enron’s corporate restructuring group where he focused on restructuring under-performing assets and companies, both public and private. From 1989 until 1993, Mr. Maffett managed fuel requirements, long-term supply contract negotiations and power marketing for Altresco Financial, Inc., a cogeneration development company. From 1987 until 1989, Mr. Maffett built and managed the deregulated gas marketing and trading business of Ladd Petroleum. During the past five years Mr. Maffett has held board seats at Sendero Capital Partners, Inc. (and its affiliates), Southern Missouri Natural Gas and Nexus Resources, LLC. Mr. Maffett’s extensive experience with various companies in the energy industry makes him well-qualified to serve on the Company’s Board of Directors.
Jacqueline (“Jackie”) Mitchell was appointed as a director of Holdings in March 2010 and currently serves on the Risk Oversight Committee and the Executive, Compensation and Governance Committee. Ms. Mitchell has been Senior Managing Director at RBS Sempra since 1992, where she oversees the North American natural gas trading and marketing operations. Ms. Mitchell also serves as Chief Executive Officer and a director of Sempra Energy Trading Mexico. Prior to 1992, Ms. Mitchell worked for EnTrade Corporation. Ms. Mitchell’s in-depth understanding of natural gas commodity markets and related risk management activities makes her well-qualified to serve on the Company’s Board of Directors.
Jonathan Moore has served as a director of Holdings since September 2009 and currently serves on the Risk Oversight Committee. He has served as Executive Vice President at Beowulf Energy LLC since 2008. In 2006, Mr. Moore founded Juice Energy, Inc., a green-focused energy retailer, where he served as CEO from 2006 to 2008 and currently serves as a director. From 2002 until 2006, Mr. Moore was COO of Constellation NewEnergy. From 1994 until 2002, Mr. Moore worked for The AES Corporation, where he was part of the senior management team responsible for AES’ acquisition of NewEnergy Ventures, one of the first competitive suppliers of retail electricity. Mr. Moore worked as a transactional attorney with O’Melveny & Myers in Washington, D.C. from 1988 to 1994. Mr. Moore’s extensive experience in the energy industry, including his experience in retail energy, makes him well-qualified to serve as a director of the Company.
Committees of the Board of Directors
As of July 27, 2010, our Board of Directors had appointed three committees to help carry out its duties: the Audit Committee, the Executive, Compensation and Governance Committee (the “ECG Committee”) and the Risk Oversight Committee.
The Audit Committee makes recommendations to the Board of Directors regarding the selection of independent auditors, reviews the results and scope of audit and other services provided by our independent auditors and reviews and evaluates our internal audit and control functions. The Audit Committee also meets with our outside auditors shortly after the end of each quarterly and year-end reporting period, reviews financial reports prepared in accordance with U.S. GAAP and SEC regulations and recommends that the Board of Directors approve such reports for filing with the SEC.
As of July 27, 2010, the Audit Committee consists of Messrs. Hamilton (Chair), Bernstein, Carte and Maffett. The Board of Directors has determined that all current members of the Audit Committee, as well as Messrs. Chapman and Landuyt and Ms. Mitchell, qualify as financial experts within the meaning of the SEC rules. The Board of Directors has further determined that all current members of the Audit Committee are independent.
The ECG Committee: (i) administers our employee stock and other benefit plans and makes decisions concerning salaries and incentive compensation for our employees, and (ii) identifies and recommends qualified individuals to serve as board and committee members, monitors the effectiveness of the Board of Directors and its committees and establishes the corporate governance guidelines for the Company. As of July 27, the ECG Committee consists of Messrs. Chapman (Chair), Bernstein, Hamilton and Landuyt and Ms. Mitchell.
The Risk Oversight Committee establishes and provides oversight of the Company’s risk management policies. As of July 27, the Risk Oversight Committee includes Messrs. Maffett (Chair), Carte, Chapman and Moore, and Ms. Mitchell.
Board Leadership Structure and Role in Risk Oversight
We separate the roles of CEO and Chairman of the Board of Directors in recognition of the differences between the two roles. The CEO is responsible for setting the strategic direction for the Company and the day-to-day leadership and performance of the Company, while the Chairman of the Board of Directors provides guidance to the CEO, sets the agenda for Board of Directors meetings and presides over meetings of the full Board of Directors. In connection with the Restructuring, the shareholders of the Company voted to appoint Mr. Hamilton, an independent director who is not otherwise employed in any capacity by the Company, as Chairman of the Board of Directors. One executive officer of the Company, the CEO, also serves as a director.
As discussed in “Management’s Discussion and Analysis of Financial Condition and Results of Operations—Risk Management,” the Risk Oversight Committee is primarily responsible for establishing risk management policies and overseeing compliance therewith. Risk management policies are reviewed at least annually to ensure that material risks associated with new products, asset acquisitions, current market and other changes in our risk profile are adequately addressed. The Risk Oversight Committee meets at least twice annually, and as often as necessary, to address the Company’s risk management activities and positions. The Risk Oversight Committee is chaired by an independent director, and includes five additional directors, including our CEO, as well as our CFO. We also have an independent risk management department that is responsible for monitoring and enforcing risk management policies related to commodities hedging activities.
Code of Ethics
We have adopted a Code of Business Conduct and Ethics (the “Code of Ethics”), which applies to our directors, officers and employees that meets the definition of a code of ethics required by Item 406 of Regulation S-K promulgated under the Exchange Act. The purpose of the Code of Ethics is to promote a culture of honesty, integrity and respect for the law and the people who work at and with the Company. A copy of the Code of Ethics is available on our website at www.mxholdings.com under the Corporate Governance link. We intend to timely disclose any amendments to or waivers of certain provisions of the Code of Ethics applicable to our directors, executive officers, including our principal executive officer, principal financial officer and principal accounting officer on our website.
ITEM 11. EXECUTIVE COMPENSATION
Compensation Committee Report
The ECG Committee has reviewed and discussed with management the following “Compensation Discussion and Analysis,” (“CD&A”) section required by Item 402(b) of Regulation S-K promulgated under the Exchange Act. Based on such review and discussion with management, the ECG Committee recommended to the Board of Directors that the CD&A be included in the Company’s Annual Report.
The Executive, Compensation and Governance Committee
James Chapman (Chair)
Mark Bernstein
Michael J. Hamilton
William Landuyt
Jacqueline Mitchell
The information contained in the ECG Committee Report shall not be deemed to be “soliciting material” or to be “filed” with the SEC, nor shall such information be incorporated by reference into any future filings under the Securities Act or the Exchange Act, except to the extent that we specifically incorporate it by reference in such filing.
Compensation Discussion and Analysis for Named Executive Officers
As used herein, “named executive officers” refers to our CEO, our CFO and the three executive officers, other than the CEO and CFO, who were our most highly compensated executive officers for the fiscal year ended June 30, 2010.
Overview of Our Compensation Philosophy and Objectives
The compensation of our named executive officers is based in part on the terms of our employment agreements with them and in part on our “pay-for-performance” philosophy on both an individual and corporate level. We have adopted an approach to compensation that includes a mix of short-term and long-term components that are designed to provide proper incentives and to reward our senior management team for individual and corporate performance.
Our intent regarding the compensation of our executive officers is to provide salary and incentives that:
· motivate executive officers to increase shareholder value;
· attract and retain talented and experienced executive officers;
· motivate executive officers to manage our business to meet our short-term and long-term business objectives; and
· align compensation with the achievement of certain short-term and long-term individual and corporate objectives.
Role of Our ECG Committee
Our ECG Committee is responsible for administering our compensation practices. Our ECG Committee consists of up to five directors who are “outside directors” for purposes of Section 162(m) of the Internal Revenue Code, as amended (the “Code”). The ECG Committee has been charged by the Board of Directors with the following overall responsibilities, among others:
· Approval and evaluation of executive officer compensation policies, plans, and programs;
· Approval, oversight and evaluation of equity-based compensation plans, including without limitation, stock-based compensation plans, in which officers or employees may participate;
· Approve arrangements with executive officers relating to their employment relationships with the Company, including, without limitation, employment agreements and restrictive covenants;
· Setting annual performance goals for the Company, which are used to establish performance goals for the named executive officers and other senior officers; and
· Review and approval of ERISA and other significant employee benefit plans.
The ECG Committee considers compensation recommendations from our CEO in determining executive compensation for all of the named executive officers, except in the case of the CEO. The ECG Committee, at its sole discretion, may accept or deny, in whole or in part, the recommendations of the CEO. The activities of the ECG Committee are formally reported to the Board of Directors, and board members are encouraged to ask questions and review specific details regarding the decisions of the ECG Committee. The Board of Directors is not required to approve the decisions of the ECG Committee.
Elements of Executive Compensation
The compensation of our named executive officers consists primarily of the following components:
· Annual base salary;
· Participation in incentive-based compensation plans;
· Participation in equity-based compensation plans;
· Awards of any special or supplemental benefits; and
· Awards of severance and other termination benefits.
We use a mix of short-term compensation (annual base salaries and incentive-based compensation) and long-term compensation (equity-based compensation) to provide a total compensation structure that is designed to achieve our pay-for-performance philosophy and other compensation objectives. Although the ECG Committee has not adopted any formal guidelines for allocating total compensation between short-term and long-term portions, we believe it is important for our executive officers to have some actual or potential equity ownership to provide them with long-term incentives to improve corporate performance.
The members of our ECG Committee are involved with a portfolio of companies of various sizes from which they can assess the appropriateness of executive compensation levels. In addition, they are provided with performance data on named executives and the Company’s performance both of which enable thorough decision-making.
Annual Cash Compensation
Annual Base Salary
We believe that a competitive base salary is a necessary element of any compensation program designed to attract and retain talented and experienced executives, and to motivate and reward executives for their overall performance. In general, the base salaries of our named executive officers reflect:
· the initial base salaries that we negotiated with each of them at the time of their initial employment or promotion;
· consideration of individual performance and increased experience;
· any changes in their appointed roles and responsibilities;
· consideration of the individual’s contribution toward overall business performance;
· annual cost of living adjustment factors;
· results of any benchmarking initiatives to compare executive salaries to peer group companies;
· experience of the members of the ECG Committee with executive salaries at other companies; and
· recommendations of the CEO, except in the case of the CEO.
The base salaries of our executive officers are reviewed and evaluated for possible adjustment annually after their performance evaluations are completed.
Base salaries for our named executive officers are summarized in the following table:
|
|
|
Salary as of June 30, |
|
||||
|
Name |
|
2010 |
|
2009 |
|
||
|
|
|
|
|
|
|
||
|
Jeffrey Mayer |
|
$ |
594,825 |
|
$ |
594,825 |
|
|
Chaitu Parikh |
|
450,000 |
|
421,785 |
|
||
|
Robert Blake |
|
225,000 |
|
225,000 |
|
||
|
Gina Goldberg |
|
281,865 |
|
281,865 |
|
||
|
Robert Werner |
|
300,000 |
|
250,000 |
|
||
|
Carole R. Artman-Hodge (1) |
|
— |
|
390,000 |
|
||
(1) Effective May 14, 2010, Ms. Artman-Hodge, the Company’s former EVP, was no longer employed by the Company.
After considering fiscal year 2009 financial and operating results, including the impacts of the Restructuring, the Board of Directors did not approve any salary increases for any of the named executive officers for the beginning of fiscal year 2010. However, in May 2010, the Company entered into an amendment to the employment agreement with Chaitu Parikh, which provided for an increase in Mr. Parikh’s annual base salary to $450,000 due to his increased responsibilities and authority. In April 2010, the Company entered into an agreement with Robert Werner, which provided for an increase in Mr. Werner’s annual base salary to $300,000 due to his increased responsibilities and authority.
Annual Incentive-Based Compensation
Our named executive officers have the opportunity to receive cash incentive awards tied to our company’s overall performance and their individual performance.
Specific performance goals for the named executive officers are established for the payment of annual incentive-based compensation, which are based on the specific individual and business performance factors described below. The establishment of business and individual goals for each named executive officer reinforces three of our compensation goals: (1) to increase shareholder value; (2) to motivate our named executive officers toward even higher achievement and business results; and (3) to enable us to attract and retain highly qualified individuals.
Individual Performance Factors (“IPFs”) represent ratings assigned to the named executive officers that are based on several performance factors and accomplishment of individual goals. IPFs are calculated after a systematic review of each named executive officer, which results in assessment of specific accomplishments and job skills that generally fall within the following categories: (1) leadership, team management and organizational skills; (2) primary job responsibilities; (3) judgment and decision-making; (4) individual accomplishments; (5) peer relationships; and (6) industry, departmental and company knowledge. Mr. Mayer is evaluated by the ECG Committee, while the other named executive officers are evaluated by the CEO. For all named executive officers, the overall IPF rating is applied to 25% of their target bonus. The ECG Committee reviews and approves IPFs for the named executive officers.
Business Performance Factors (“BPFs”) represent corporate operational goals that are considered to be essential to our success for the fiscal year. BPFs are used to assess corporate performance and result in a weighted resultant business factor, which is generally assigned to all employees. For all named executive officers, the BPF rating is applied to 75% of their target bonus. The BPFs for the fiscal year ended June 30, 2009 were as follows:
· 34% weighting for achievement of targeted levels of RCEs at June 30, 2010;
· 33% weighting for operational excellence, which is measured by accomplishment of key business performance factors; and
· 33% weighting for achievement of Adjusted EBITDA for fiscal year 2010.
The weighted resultant business factor is applied to that portion of the named executive officer’s bonus that is subject to the BPF weighting. That cumulative result is then further adjusted for the named executive officer’s IPF rating.
Incentive-based compensation accrued for the named executive officers for the fiscal year ended June 30, 2010, and paid by the Company during fiscal year 2011, is summarized in the following table.
|
|
|
Target % of |
|
Actual Payout |
|
|||
|
Name |
|
(1) |
|
% of Salary |
|
Amount |
|
|
|
|
|
|
|
|
|
|
|
|
|
Jeffrey Mayer |
|
100 |
% |
76 |
% |
$ |
450,000 |
|
|
Chaitu Parikh |
|
100 |
% |
94 |
% |
425,000 |
|
|
|
Robert Blake |
|
50 |
% |
78 |
% |
175,000 |
|
|
|
Gina Goldberg |
|
50 |
% |
106 |
% |
300,000 |
|
|
|
Robert Werner |
|
100 |
% |
133 |
% |
400,000 |
|
|
|
Carole R. Artman-Hodge (2) |
|
— |
|
— |
|
— |
|
|
(1) Based upon employment agreements in place as of June 30, 2010.
(2) Effective May 14, 2010, Ms. Artman-Hodge, the Company’s former EVP, was no longer employed by the Company. Her severance payment included a prorated bonus for fiscal year 2010.
Equity-Based Compensation
Stock-based awards provide our executive officers, employees and other individuals who have provided services to us with the opportunity to own an equity interest in the Company. Stock-based awards are an important component in our executive compensation program because we benefit from dedicated employees who take ownership pride in its business. Decisions regarding the amount and timing of stock option awards are made: (1) at the time of the executive’s employment; (2) upon periodic review; or (3) on rare occasions, following a significant event such as an acquisition.
The CEO makes recommendations to the ECG Committee regarding stock-based awards to all named executive officers, which are based on the following considerations: (1) the officer’s past performance; (2) future responsibilities and expectations of the officer during the vesting period for the awards; (3) retention concerns, if any; (4) rating of the officer as a “top performer”; (5) comparisons with peers within the Company; and (6) expectations for contributions toward increasing shareholder value. The ECG Committee approves any grants after consideration of the CEO recommendations, its members’ knowledge of market practice, our actual performance for the current fiscal year and expectations of our future performance. We do not make decisions regarding stock-based awards based on the gains or losses from prior equity awards. In addition, we do not require our named executive officers to own the Company’s common stock. Generally, stock-based awards granted to the named executive officers vest over a three-year period with the first vesting period ending on the first anniversary of the date of grant.
As of June 30, 2009, the Company had three active stock-based compensation plans under which warrants and options (collectively referred to as “awards”) had been granted to employees, directors and other non-employees. As of June 30, 2009, the Company had options and warrants outstanding which were, or may have been, exercisable for 1,008,770 shares of common stock. The vast majority of these options and all of the warrants were “out of the money” as of the consummation date of the Restructuring (i.e., the agreed-upon price for which the option/warrant holder may purchase the Company’s common stock exceeded the current fair value of the common stock). In connection with the Restructuring, the Company terminated its three existing stock-based compensation plans and paid approximately $0.2 million of cash settlements to holders of options and warrants in exchange for their agreement to cancel and terminate such options and warrants.
As previously approved by the stockholders in connection with the Restructuring, in January 2010, Holdings’ Board of Directors authorized the creation of the MXenergy Holdings Inc. 2010 Stock Incentive Plan, pursuant to which the Company may issue Class C Common Stock not to exceed 10% of Holdings’ outstanding common stock (on a fully diluted basis) after giving effect to the Restructuring. Also in January 2010, Holdings’ Board of Directors approved grants of RSUs to certain senior executive officers, directors and a former director, pursuant to which the Company may issue approximately 2.9 million shares of Class C Common Stock, representing 5% of Holdings’ outstanding common stock (on a fully diluted basis), subject to prescribed vesting requirements. Refer to Notes 2 and 19 of the consolidated financial statements included in Item 8 of this Annual Report for additional information regarding RSUs granted
during fiscal year 2010. In connection with the Restructuring, the Company’s bondholders authorized grants of RSUs in fiscal year 2010, rather than stock options as in prior years, principally because it is now widely recognized that RSUs are generally preferable because they more directly align the interests of award recipients with those of stockholders.
Other Compensation
All of our executive officers are eligible for benefits generally offered to all employees, including, but not limited to; life, health, disability and dental insurance and participation in our 401(k) plan. We intend to continue to maintain our current benefits for our executive officers, as well as for all of our employees. The ECG Committee may, in its sole discretion revise, amend or add to the named executive officer’s benefits and perquisites if deemed advisable. We do not believe it is necessary for the attraction or retention of management talent to provide the officers with a substantial amount of compensation in the form of perquisites. During fiscal year 2010, in addition to matching the 401(k) contributions of all of the named executive officers, we made reimbursement payments to Messrs. Mayer and Blake and to Ms. Goldberg for professional association and club membership fees.
Additionally, our executive officers may be awarded special compensation, at the sole discretion of the ECG Committee, in recognition of extraordinary initiative or efforts related to purchase acquisitions or other transactions. In September 2009, the Company paid approximately $0.8 million of bonuses to its executive officers and certain other employees related to consummation of the Restructuring, of which the following amounts were paid to named executive officers: Mr. Mayer: $240,000; Mr. Parikh: $240,000; Mr. Blake: $15,000; Mr. Werner: $25,000; and Ms. Artman-Hodge: $30,000. The Compensation Committee of the Board of Directors that existed prior to the creation of the current ECG Committee determined these bonus amounts, at its sole discretion, after seeking the CEO’s recommendation with respect to executive officers other than himself.
Accounting and Tax Considerations
In accordance with U.S. GAAP, the estimated fair value of RSUs granted, net of forfeitures expected to occur, is amortized as compensation expense over the vesting period of the RSUs based on the accelerated attribution method. For additional information, see Notes 2 and 19 of our audited consolidated financial statements included elsewhere herein.
Generally, the granting of RSUs does not trigger any recognition of income or gain to the holder. When the holder receives unrestricted shares (either at vesting or a later date selected in a deferred compensation election, if allowed), the fair market value of the unrestricted shares will be ordinary income to the recipient, and we will receive a corresponding tax deduction.
Summary Compensation Table
Annual compensation for the named executive officers is summarized in the following table.
|
Name and Principal |
|
Year |
|
Salary |
|
Bonus |
|
Stock |
|
Option |
|
Non- |
|
All Other |
|
Total |
|
|||||||
|
|
|
|
|
|
|
|
|
|
|
|
|
|
|
|
|
|
|
|||||||
|
Jeffrey Mayer |
|
2010 |
|
$ |
594,825 |
|
$ |
240,000 |
|
$ |
2,955,341 |
|
$ |
— |
|
$ |
481,256 |
|
$ |
45,280 |
|
$ |
4,316,702 |
|
|
President and Chief |
|
2009 |
|
594,825 |
|
— |
|
— |
|
— |
|
519,240 |
|
53,859 |
|
1,167,924 |
|
|||||||
|
Executive Officer |
|
2008 |
|
566,183 |
|
— |
|
475,950 |
|
— |
|
236,115 |
|
366,564 |
|
1,644,812 |
|
|||||||
|
|
|
|
|
|
|
|
|
|
|
|
|
|
|
|
|
|
|
|||||||
|
Chaitu Parikh |
|
2010 |
|
425,366 |
|
240,000 |
|
2,452,305 |
|
— |
|
449,178 |
|
994,460 |
|
4,561,309 |
|
|||||||
|
Executive Vice President |
|
2009 |
|
421,785 |
|
— |
|
— |
|
— |
|
403,768 |
|
16,936 |
|
842,489 |
|
|||||||
|
and Chief Financial Officer |
|
2008 |
|
401,475 |
|
— |
|
— |
|
— |
|
202,859 |
|
16,189 |
|
620,523 |
|
|||||||
|
|
|
|
|
|
|
|
|
|
|
|
|
|
|
|
|
|
|
|||||||
|
Robert Blake |
|
2010 |
|
225,000 |
|
15,000 |
|
251,519 |
|
— |
|
179,407 |
|
50,994 |
|
721,920 |
|
|||||||
|
Senior Vice President, |
|
2009 |
|
— |
|
— |
|
— |
|
— |
|
— |
|
— |
|
— |
|
|||||||
|
Regulatory Affairs |
|
2008 |
|
— |
|
— |
|
— |
|
— |
|
— |
|
— |
|
— |
|
|||||||
|
|
|
|
|
|
|
|
|
|
|
|
|
|
|
|
|
|
|
|||||||
|
Gina Goldberg |
|
2010 |
|
281,865 |
|
— |
|
251,519 |
|
— |
|
309,210 |
|
28,336 |
|
870,930 |
|
|||||||
|
Senior Vice President, |
|
2009 |
|
281,865 |
|
— |
|
— |
|
— |
|
158,408 |
|
15,739 |
|
456,012 |
|
|||||||
|
Marketing |
|
2008 |
|
244,963 |
|
— |
|
— |
|
— |
|
117,574 |
|
12,255 |
|
374,792 |
|
|||||||
|
|
|
|
|
|
|
|
|
|
|
|
|
|
|
|
|
|
|
|||||||
|
Robert Werner |
|
2010 |
|
293,561 |
|
25,000 |
|
251,519 |
|
— |
|
405,971 |
|
32,871 |
|
1,008,922 |
|
|||||||
|
Senior Vice President, |
|
2009 |
|
250,000 |
|
— |
|
— |
|
— |
|
99,750 |
|
19,731 |
|
369,481 |
|
|||||||
|
Supply |
|
2008 |
|
250,000 |
|
— |
|
— |
|
— |
|
47,050 |
|
— |
|
297,050 |
|
|||||||
|
|
|
|
|
|
|
|
|
|
|
|
|
|
|
|
|
|
|
|||||||
|
Carole R. Artman-Hodge (6) |
|
2010 |
|
342,000 |
|
30,000 |
|
— |
|
— |
|
11,923 |
|
1,364,717 |
|
1,748,640 |
|
|||||||
|
Executive Vice President |
|
2009 |
|
390,000 |
|
— |
|
— |
|
— |
|
207,032 |
|
20,962 |
|
617,994 |
|
|||||||
|
|
|
2008 |
|
390,000 |
|
— |
|
475,950 |
|
— |
|
180,925 |
|
390,086 |
|
1,436,961 |
|
|||||||
(1) For fiscal year 2010, includes bonuses related to consummation of the Restructuring.
(2) For fiscal year 2010, includes the aggregate grant date fair value of RSUs granted in January 2010. Refer to Notes 2 and 19 of the consolidated financial statements included in Item 8 of this Annual Report for information regarding these grants, including the assumptions used to calculate the grant date fair value.
(3) There were no stock option awards granted to any of the named executive officers during fiscal year 2010.
(4) Includes: (i) annual incentive-based compensation awards accrued by the Company for the fiscal years noted; and (ii) adjustments to prior year awards that were paid during the fiscal years noted. Amounts reflected are exclusively cash awards.
(5) For fiscal year 2010, amounts include: (i) contributions to the Company-sponsored employee savings plan under Section 401(k) of the Code (Mr. Mayer: $22,000; Mr. Parikh: $16,500; Mr. Blake: $19,904; Ms. Goldberg: $20,916; Mr. Werner: $20,423; and Ms. Artman-Hodge: $21,762); (ii) club membership and professional association fees (Mr. Mayer: $12,480); (iii) reimbursement of legal expenses in connection with preparation of employment agreements (Mr. Werner: $7,448); (iv) compensation paid in connection with severance agreements: (Ms. Artman-Hodge: $1,330,500); (v) compensation paid in connection with relocation agreements: (Mr. Parikh: $966,140); and (vi) settlement payments resulting from termination of stock-based compensation plans in connection with the Restructuring (Mr. Mayer: $10,800; Mr. Parikh: $11,820; Mr. Blake: $31,090; Ms. Goldberg: $7,420; Mr. Werner: $5,000; and Ms. Artman-Hodge: $12,455).
(6) Effective May 14, 2010, Ms. Artman-Hodge was no longer employed by the Company.
2010 Grants of Plan-Based Awards
In January 2010, Holdings’ Board of Directors approved grants of RSUs to certain senior officers, pursuant to which the Company may issue shares of Class C Common Stock, subject to prescribed vesting requirements. Information with respect to incentive-based compensation awards for fiscal year 2010, in accordance with the employment agreements executed with the named executive officers, are summarized in the following table. Refer to Note 19 of the consolidated financial statements included in Item 8 of this Annual Report for additional information regarding RSUs granted during fiscal year 2010.
|
|
|
Estimated Future Payouts Under |
|
All Other |
|
Grant |
|
||||||||
|
Name |
|
Threshold |
|
Target |
|
Maximum |
|
of Stock (2) |
|
Awards (2) |
|
||||
|
|
|
|
|
|
|
|
|
|
|
|
|
||||
|
Jeffrey Mayer |
|
$ |
0 |
|
$ |
594,825 |
|
$ |
713,790 |
|
1,343,337 |
|
$ |
2,955,341 |
|
|
Chaitu Parikh |
|
0 |
|
450,000 |
|
540,000 |
|
1,114,684 |
|
2,452,305 |
|
||||
|
Robert Blake |
|
0 |
|
112,500 |
|
225,000 |
|
114,327 |
|
251,519 |
|
||||
|
Gina Goldberg |
|
0 |
|
140,933 |
|
281,865 |
|
114,327 |
|
251,519 |
|
||||
|
Robert Werner |
|
0 |
|
300,000 |
|
450,000 |
|
114,327 |
|
251,519 |
|
||||
|
Carole R. Artman-Hodge (3) |
|
— |
|
— |
|
— |
|
— |
|
— |
|
||||
(1) Amounts reflect the range of potential short-term incentive payouts under the Company’s incentive compensation program. If a named executive officer’s IPF and/or the Company’s BPF exceed targets for any fiscal year, the ECG Committee may, at its discretion, approve incentive plan awards that exceed the maximum amounts noted in the table. Actual payouts to named executive officers for fiscal year 2010 performance, as well as the business objectives and percentage of target achieved, are disclosed above under “Annual Incentive-Based Compensation.”
(2) Includes the aggregate grant date fair value of RSUs granted in January 2010. Refer to Notes 2 and 19 of the consolidated financial statements included in Item 8 of this Annual Report for information regarding these grants, including the assumptions used to calculate the grant date fair value.
(3) Effective May 14, 2010, Ms. Artman-Hodge, the Company’s former EVP, was no longer employed by the Company.
Outstanding Equity Awards at June 30, 2010
In September 2009, in connection with the Restructuring, we terminated our three existing stock-based compensation plans and offered cash settlements to holders of options and warrants in exchange for their agreement to cancel and terminate such options and warrants. Total cash settlement amounts were approximately $0.2 million. As a result, all options and warrants that were outstanding as of June 30, 2009 were cancelled and terminated in connection with the Restructuring. There were no options or warrants exercised by named executive officers during the fiscal year ended June 30, 2010. The Company did not award any options or warrants under stock-based compensation plans during the fiscal year ended June 30, 2010, but instead awarded RSUs.
Options Exercised and Stock Vested
During fiscal year 2010, none of the named executive officers acquired any shares of any class of common stock from exercise of options or from vesting of RSUs.
Pension Benefits
We do not provide any post-retirement pension benefits to any of our named executive officers.
Nonqualified Deferred Compensation Plans
We do not provide any nonqualified deferred compensation programs for any of our named executive officers.
Agreements with Named Executive Officers
Jeffrey Mayer Employment Agreement
On February 13, 2008, we entered into a new employment agreement with Mr. Mayer (the “Mayer Agreement”). The Mayer Agreement replaces a previous employment agreement dated April 1, 1999. The material differences in the Mayer Agreement include the following: (i) reducing both the initial and automatic renewal terms of the agreement; (ii) providing increased severance upon a termination without business reasons (and including the concept of a constructive termination); (iii) providing for severance upon a change in control in connection with a qualifying termination; and (iv) including a Code Section 280G provision, which provides for either a reduction of payments or a tax gross-up. In each case, we included these revised terms to reflect market practices.
The initial term of the Mayer Agreement is four years and is automatically renewed for successive one-year terms unless either party gives the other 180 days’ notice that the Mayer Agreement will not be extended or if the Mayer Agreement is otherwise terminated. Pursuant to the Mayer Agreement, Mr. Mayer’s office will be located in our headquarters in Stamford, Connecticut, and he will report to our Board of Directors. In addition to his position as CEO, we agree to use our best efforts to ensure that Mr. Mayer will continue to serve as a member of the Board of Directors.
Pursuant to the Mayer Agreement, Mr. Mayer will receive an annual base salary of $566,500 as of the effective date of the Mayer Agreement, which may be increased from time to time by the ECG Committee, at its discretion. In addition, Mr. Mayer’s annual target bonus shall be equal to 100% of his then current base salary, 75% of which is payable based on achievement of Company and/or individual objectives specified by the ECG Committee and 25% of which may be awarded solely at the discretion of the ECG Committee. In addition, the ECG Committee may, in its sole discretion, award Mr. Mayer an additional bonus of up to 20% of his base salary then in effect for extraordinary performance in connection with a “significant business event,” as defined in the Mayer Agreement.
In the event that Mr. Mayer is terminated involuntarily and without “business reasons” (as such term is defined in the Mayer Agreement, which generally includes “cause” events such as felony conviction, fraud or insubordination) or a “constructive termination” (as such term is defined in the Mayer Agreement, such as a material reduction in salary or authority or an attempt to relocate Mr. Mayer without his approval) occurs, Mr. Mayer will be entitled to receive (i) his then current base salary, any paid time off and any earned and unpaid target bonus accrued through the date of termination; (ii) a lump sum payment equal to the greater of (a) his then current base salary for a period of twelve months following the date of termination, or (b) his then current base salary for the remainder of the then current employment term; and (iii) a lump sum payment equal to (a) 100% of the target bonus for the fiscal year in which the date of termination occurs, (b) 100% of the target bonus for any full fiscal year remaining during the then applicable employment term, and (c) a pro rata portion of 100% of the target bonus being paid for the final fiscal year that begins during the then applicable employment term. In addition, all of Mr. Mayer’s unvested stock options, restricted stock, and other equity awards shall become fully vested and all stock options that are vested and outstanding (but unexercised) on the date of termination will be cancelled and we will pay to Mr. Mayer, with respect to each option, an amount equal to the excess of the fair market value per share of the shares underlying such option over the exercise price of such option multiplied by the number of shares underlying such option. In addition, Mr. Mayer’s benefits and certain perquisites will continue for the duration of the then current employment term.
If there is a change in control (as such term is defined in the Mayer Agreement) and either a constructive termination occurs or we terminate Mr. Mayer’s employment without business reasons prior to the expiration of the then current employment term, Mr. Mayer will be entitled to receive (i) his then current base salary, any paid time off, and any earned and unpaid target bonus accrued through the date of termination; (ii) a lump sum payment equal to the greater of (a) two times his then current base salary or (b) his then current base salary for the remainder of the then current employment term; (iii) a lump sum payment equal to the greater of (a) 200% of the target bonus for the fiscal year in which the termination occurs, or (b) 100% of the target bonus for the fiscal year in which the termination occurs times the number of years for the remainder of the then current employment term. In addition, all of Mr. Mayer’s unvested stock options, restricted stock, and other equity awards shall become fully vested.
If Mr. Mayer is terminated as a result of death or disability (as such term is defined in the Mayer Agreement), he or his representative, as the case may be, is entitled to receive (i) any accrued and unpaid salary; (ii) any accrued and unpaid target bonus for the prior fiscal year; (iii) a pro rata portion of any target bonus that he would have otherwise earned during the fiscal year in which the termination occurs; and (iv) any accrued and unpaid time off. Mr. Mayer’s outstanding stock options, restricted stock, and other equity arrangements shall expire in accordance with the terms of the applicable award agreements.
If Mr. Mayer voluntarily terminates his employment (other than in the case of a constructive termination), or he is terminated involuntarily for business reasons, he will be entitled to receive (i) all accrued and unpaid salary, all accrued and unpaid target bonus for the prior fiscal year, and a pro rata portion of any target bonus that he would have otherwise earned during the fiscal year in which such termination occurs and (ii) all accrued but unpaid time off and other benefits due to him through his termination date under any
Company-provided or paid plans, policies, and arrangements. Mr. Mayer’s stock options, restricted stock, and other equity arrangements will cease vesting immediately and such awards will expire in accordance with the terms of the applicable award agreements.
If Mr. Mayer’s employment is terminated for any reason, we have the initial right to purchase all (but not less than all) of the common stock of the Company held by Mr. Mayer by making a written offer within 60 days of termination. If Mr. Mayer is involuntarily terminated for any reason (including a constructive termination) other than for business reasons, but we do not offer to purchase his shares of common stock within 60 days of termination, Mr. Mayer has the right to cause us to repurchase all (but not less than all) of his common stock. The foregoing rights terminate upon an initial public offering of our common stock.
The Mayer Agreement provides that in the event that Mr. Mayer becomes entitled to payments or benefits that would constitute an “excess parachute payment” within the meaning of Section 280G of the Code, the payment and/or benefits will be reduced to the extent that such payments will not be subject to the excise tax or any interest or penalties imposed by Section 4999 of the Code, referred to herein as the 280G Reduction. The 280G Reduction will only take place if Mr. Mayer’s “net after tax benefit” (as defined in the Mayer Agreement) exceeds the net after tax benefit he would realize if the 280G Reduction were not made. To the extent, the 280G Reduction is unavailable because Mr. Mayer’s net after tax benefit would be greater if the 280G Reduction were not made, we will pay Mr. Mayer a gross up payment in an amount such that after the payment by Mr. Mayer of all taxes (including any income taxes, interest, penalties or any excise taxes), Mr. Mayer would retain an amount of the gross-up payment equal to seventy-five (75%) of any excise tax imposed upon the payments received by Mr. Mayer.
The Mayer Agreement also contains restrictive covenants, which apply for the remainder of the then-current agreement term. Pursuant to the restrictive covenants, Mr. Mayer is generally prohibited from (1) owning or providing services for any business competing against us for the remainder of the agreement term; (2) inducing employees to leave our employ or hiring them (unless the employee contacts Mr. Mayer on an unsolicited basis); (3) soliciting any of our customers, suppliers, licensees or other business relations; or (4) disparaging us, our executive officers, or our directors. In the event that Mr. Mayer violates the provisions of the restrictive covenants, he will not be entitled to any severance benefits upon a termination without business reasons or upon a constructive termination. Additionally, upon any such violation, all of Mr. Mayer’s unexercised options, whether vested or unvested, shall be cancelled.
Chaitu Parikh Employment Agreement
On May 14, 2010, the Company entered into an amendment (the “Amendment”), effective as of May 17, 2010 (the “Effective Date”), to the employment agreement effective February 13, 2008 with Mr. Parikh (the “Parikh Agreement”), the Company’s CFO. The Amendment (i) provides that Mr. Parikh shall be relocated from the Company’s headquarters in Stamford, Connecticut to Houston, Texas on a mutually agreeable date in 2010, (ii) extends the term of Mr. Parikh’s employment with the Company for a period of three years beginning on the Effective Date and (iii) increases Mr. Parikh’s annual base salary to $450,000. The Amendment also provides that if Mr. Parikh is terminated within the eighteen month period following the substantial completion of his relocation to Houston either (i) involuntarily and without Business Reasons or a Constructive Termination (as such terms are defined in the Parikh Agreement), or (ii) following a Change of Control (as such term is defined in the Parikh Agreement), then he shall receive a relocation package with terms, conditions and dollar value substantially the same as those provided in connection with his 2010 relocation to Houston in addition to any other compensation to which he is entitled pursuant to his Employment Agreement.
In addition, on May 10, 2010, Mr. Parikh and the Company entered into a relocation agreement (the “Relocation Agreement”) pursuant to which Mr. Parikh agreed to relocate from Stamford, Connecticut to Houston, Texas. The Relocation Agreement provides that the Company shall engage a relocation firm that will purchase Mr. Parikh’s residence for its fair market value, and pay Mr. Parikh an amount equal to the difference between $1,725,000 and the purchase price paid. Pursuant to the terms of the Relocation Agreement, Mr. Parikh shall also be reimbursed by the Company for (i) all reasonable sales expenses related to his residence in Connecticut including, among other things, fees, taxes, attorneys’ fees, inspection and closing costs, (ii) reasonable expenses incurred in connection with the purchase of a home in Houston including, among other things, temporary housing costs for up to six months, attorneys’ fees, inspection
and closing costs, and (iii) reasonable moving and travel costs incurred therewith. The Company shall “gross up” Mr. Parikh for any taxes owed as a result of any payments received pursuant to the terms of the Relocation Agreement. Mr. Parikh shall also receive a lump sum payment of $15,000.
The Parikh Agreement replaces a previous employment agreement dated November 1, 2002. The material differences in the Parikh Agreement include the following: (i) providing for a specified term; (ii) providing increased severance upon a termination without business reasons (and including the concept of a constructive termination), or upon a change in control in connection with a qualifying termination; and (iii) including a Code Section 280G provision, which provides for either a reduction of payments or a tax gross-up. In each case, we included these revised terms to reflect market practices, and Mr. Parikh’s increased responsibilities and authority.
The initial term of the Parikh Agreement is three years and is automatically renewed for successive one-year terms unless either party gives the other 180 days’ notice that the Parikh Agreement will not be extended or if the Parikh Agreement is otherwise terminated.
Pursuant to the Parikh Agreement, Mr. Parikh will receive an annual base salary of $401,700 as of the Effective Date, which may be increased from time to time by the ECG Committee, at its discretion. In addition, Mr. Parikh’s annual target bonus shall be equal to 100% of his then current base salary, 75% of which is payable based on achievement of Company and/or individual objectives specified by the ECG Committee and 25% of which may be awarded solely at the discretion of the ECG Committee. In addition, the ECG Committee may, in its sole discretion, award Mr. Parikh an additional bonus of up to 20% of his base salary then in effect for extraordinary performance in connection with a “significant business event,” as defined in the Parikh Agreement.
In the event that Mr. Parikh is terminated involuntarily and without “business reasons” (as such term is defined in the Parikh Agreement, which generally includes “cause” events such as felony conviction, fraud or insubordination) or a “constructively termination” (as such term is defined in the Parikh Agreement, such as a material reduction in salary or authority or an attempt to relocate Mr. Parikh without his approval) occurs, Mr. Parikh will be entitled to receive (i) his then current base salary, any unpaid time off and any earned and unpaid target bonus accrued through the date of termination; (ii) a lump sum payment equal to the greater of (a) his then current base salary for a period of twelve months following the date of termination, or (b) his then current base salary for the remainder of the then current employment term; and (iii) a lump sum payment equal to (a) 100% of the target bonus for the fiscal year in which the date of termination occurs, (b) 100% of the target bonus for any full fiscal year remaining during the then applicable employment term, and (c) a pro rata portion of 100% of the target bonus being paid for the final fiscal year that begins during the then applicable employment term. In addition, all of Mr. Parikh’s unvested stock options, restricted stock, and other equity awards shall become fully vested and all stock options that are vested and outstanding (but unexercised) on the date of termination will be cancelled and we will pay to Mr. Parikh, with respect to each option, an amount equal to the excess of the fair market value per share of the shares underlying such option over the exercise price of such option multiplied by the number of shares underlying such option. In addition, Mr. Parikh’s benefits will continue for the duration of the then current employment term.
If there is a change in control (as such term is defined in the employment agreement) and either a constructive termination occurs or we terminate Mr. Parikh’s employment without business reasons prior to the expiration of the then current employment term, he will be entitled to receive (i) his then current base salary, any paid time off, and any earned and unpaid target bonus accrued through the date of termination; (ii) a lump sum payment equal to the greater of (a) two times his then current base salary or (b) his then current base salary for the remainder of the then current employment term; (iii) a lump sum payment equal to the greater of (a) 200% of the target bonus for the fiscal year in which the termination occurs, or (b) 100% of the target bonus for the fiscal year in which the termination occurs times the number of years for the remainder of the then current employment term. In addition, all of Mr. Parikh’s unvested stock options, restricted stock, and other equity awards shall become fully vested.
If Mr. Parikh is terminated as a result of death or disability (as such term is defined in the Parikh Agreement), he or his representative, as the case may be, will be entitled to receive (i) any accrued and unpaid salary; (ii) any accrued and unpaid target bonus for a prior fiscal year; (iii) a pro rata portion of any
target bonus that he would have otherwise earned during the fiscal year in which the termination occurs; and (iv) any accrued and unpaid paid time off. Mr. Parikh’s outstanding stock options, restricted stock, and other equity arrangements shall expire in accordance with the terms of the applicable award agreements.
If Mr. Parikh voluntarily terminates his employment (other than in the case of a constructive termination), or he is terminated involuntarily for business reasons, he will be entitled to receive (i) all accrued and unpaid salary, all accrued and unpaid target bonus for a prior fiscal year, and a pro rata portion of any target bonus that he would have otherwise earned during the fiscal year in which such termination occurs and (ii) all accrued but unpaid paid time off and other benefits due to him through his termination date under any Company-provided or paid plans, policies, and arrangements. Mr. Parikh’s stock options, restricted stock, and other equity arrangements will cease vesting immediately and such awards will expire in accordance with the terms of the applicable award agreements.
If Mr. Parikh’s employment is terminated for any reason, we have the initial right to purchase all (but not less than all) of the common stock of the Company held by Mr. Parikh by making a written offer within 60 days of termination. If Mr. Parikh is involuntarily terminated for any reason (including a constructive termination) other than for business reasons, but we do not offer to purchase his shares of common stock of the Company within 60 days of termination, Mr. Parikh has the right to cause us to repurchase all (but not less than all) of his common stock of the Company. The foregoing rights terminate upon an initial public offering of our common stock.
The Parikh Agreement provides that in the event that Mr. Parikh becomes entitled to payments or benefits that would constitute an “excess parachute payment” within the meaning of Section 280G of the Code, the payment and/or benefits will be reduced to the extent that such payments will not be subject to the excise tax or any interest or penalties imposed by Section 4999 of the Code, referred to herein as the 280G Reduction. The 280G Reduction will only take place if Mr. Parikh’s “net after tax benefit” (as defined in the Parikh Agreement) exceeds the net after tax benefit he would realize if the 280G Reduction were not made. To the extent, the 280G Reduction is unavailable because Mr. Parikh’s net after tax benefit would be greater if the 280G Reduction were not made, we will pay Mr. Parikh a gross up payment in an amount such that after the payment by Mr. Parikh of all taxes (including any income taxes, interest, penalties or any excise taxes), Mr. Parikh would retain an amount of the gross-up payment equal to seventy-five (75%) of any excise tax imposed upon the payments received by Mr. Parikh.
The Parikh Agreement also contains restrictive covenants, which apply for the remainder of the then-current agreement term. Pursuant to the restrictive covenants, Mr. Parikh is generally prohibited from (1) owning or providing services for any business competing with us for the remainder of the agreement term; (2) inducing employees to leave our employ or hiring them (unless the employee contacts Mr. Parikh on an unsolicited basis); (3) soliciting any of our customers, suppliers, licensees or other business relations; or (4) disparaging us, our executive officers, or our directors. In the event that Mr. Parikh violates the provisions of the restrictive covenants, he will not be entitled to any severance benefits upon a termination without business reasons or upon a constructive termination. Additionally, upon any such violation, all of Mr. Parikh’s unexercised options, whether vested or unvested, shall be cancelled.
Carole R. Artman-Hodge Employment Agreement
Effective May 14, 2010, Ms. Artman-Hodge, the Company’s EVP, was no longer employed by the Company. In connection with her departure, we paid Ms. Artman-Hodge approximately $1.3 million, which includes a severance payment described in her employment agreement with the Company, dated as of April 1, 1999, and a pro rated bonus for fiscal year 2010.
Robert Blake Employment Agreement
We entered into an employment letter agreement with Mr. Blake dated March 21, 2001 (the “Blake Agreement”) in connection with Mr. Blake’s employment as our Director of Customer Operations. Mr. Blake’s office will be located in the Company’s Maryland offices.
The Blake Agreement provides that Mr. Blake will receive an annual base salary of $90,000 and will be eligible for a bonus, which may be paid from time to time to senior management of the Company, at the
discretion of the Board of Directors. Mr. Blake is also entitled to participate in any future stock option plans and any other equity based incentive plans as may be approved by the Board of Directors from time to time.
In the event that the Company terminates the Blake Agreement for “cause,” (as such term is defined in the Blake Agreement, which generally includes events such as felony conviction, fraud or insubordination), the Company may terminate the Blake Agreement immediately and without advance notice to Mr. Blake, and the Company will pay to Mr. Blake all compensation due for base salary and paid time off for services performed to the date of termination, less applicable withholding taxes, plus any unreimbursed business expenses or other amounts owing to Mr. Blake in accordance with Company policies.
In the event that the Company terminates the Blake Agreement without cause, the Company will provide Mr. Blake with at least 30 days advance written notice. In the event of such termination, the Company may set an earlier date for cessation of Mr. Blake’s duties, provided that the Company shall continue to pay Mr. Blake’s base salary for a period of 30 days following receipt of the termination notice. In addition, the Company will pay Mr. Blake, as severance, an amount equal to one month of his base salary, as well as all compensation due for base salary and paid time off for services performed to the date of termination, less applicable withholding taxes, plus any unreimbursed business expenses or other amounts owing to Mr. Blake in accordance with Company policies.
In the event of Mr. Blake’s death or disability, the Blake Agreement will be terminated immediately and the Company will pay to Mr. Blake all compensation due for base salary and paid time off for services performed to the date of termination, less applicable withholding taxes, plus any unreimbursed business expenses or other amounts owing to Mr. Blake in accordance with Company policies. For the purposes of the Blake Agreement “disability” shall mean an illness, injury or condition that renders Mr. Blake incapable of performing his duties on a full-time basis for a period of at least 3 months.
The Blake Agreement also contains a non-compete provision, which applies during the term of the Blake Agreement and for a period of one year following Mr. Blake’s termination for any reason. Pursuant to the non-compete provision, Mr. Blake is prohibited from: (1) directly or indirectly soliciting business of the type performed by the Company from, or working in any capacity for, any person or entity that was a client of the Company or that was contacted as a client prospect by any representative of the Company within ninety (90) days prior to such date of termination; (ii) soliciting or inducing any employee of the Company; or (iii) hiring or attempt to hire any such employee of the Company.
On December 30, 2008, the Company entered into an amendment (the “Blake Agreement Amendment”), effective as of January 1, 2009, to the Blake Agreement. The Blake Agreement Amendment amended certain provisions of the Blake Agreement in order to reduce the risk of potential adverse tax consequences to Mr. Blake under Section 409A of the Internal Revenue Code of 1986, as amended.
Gina Goldberg Employment Agreement
We entered into an employment agreement with Ms. Goldberg dated June 13, 2007, referred to herein as the Goldberg Agreement, in connection with Ms. Goldberg’s employment as our Vice President of Sales and Marketing. Under the Goldberg Agreement, the parties may terminate the Goldberg Agreement at any time provided either party gives the other at least 60 days’ advance notice of termination. Ms. Goldberg will report to the Chief Operating Officer or the Chief Executive Officer of the Company.
The Goldberg Agreement provides that Ms. Goldberg will receive an annual base salary of $238,000. The Goldberg Agreement also provides that Mr. Goldberg is eligible for a bonus, which is expected to range from 50 to 100% of Ms. Goldberg’s base salary.
Because the Company had already granted warrants and options to Ms. Goldberg prior to June 13, 2007, the Goldberg Agreement provides that the terms of the warrants and options would not be impacted by the Goldberg Agreement. If the Company terminates Ms. Goldberg’s employment for business reasons (as defined below) all unvested stock options will be forfeited.
Additionally, if Ms. Goldberg’s employment is terminated for any reason, the Company shall have the right to purchase all of the common stock owned by Ms. Goldberg, provided that if the amount payable to Ms. Goldberg exceeds $200,000, the Company may pay the excess to Ms. Goldberg in quarterly installments with 5% interest over a period of three years and the Company’s obligation to make such payment shall be suspended during any period that the payment would cause the Company to violate a loan or similar financial covenant.
In the event that the Company terminates Ms. Goldberg’s employment without a “business reason” (as defined below) or Ms. Goldberg terminates her employment for any reason that constitutes a constructive termination (as defined below), Ms. Goldberg will be entitled to (i) a lump sum payment equal to the greater of her base salary for the remainder of the employment term or (ii) her base salary for a period of 12 months. For purposes of severance, Ms. Goldberg’s employment term will be deemed to be two years. If the Company terminates Ms. Goldberg’s employment for business reasons or Ms. Goldberg terminates her employment for any reason that does not constitute a constructive termination, she will be entitled to any accrued and unpaid salary.
For purposes of the Goldberg Agreement, “business reasons” means: (i) gross negligence, willful misconduct or other willful malfeasance in the performance of her duties; (ii) conviction of, or plea of nolo contendere to, or written admission of the commission of a felony, or any other criminal offense involving moral turpitude; (iii) any act by Ms. Goldberg involving moral turpitude, fraud or misrepresentation with respect to her duties for the Company or its affiliates; (iv) any act by Ms. Goldberg constituting a failure to follow the directions of the Chief Executive Officer, the Chief Operating Officer, or the Board of Directors, provided written notice of such failure is provided to Ms. Goldberg and the failure continues for five days after receipt of such notice; and (v) subject to certain conditions, Ms. Goldberg’s material breach of the Goldberg Agreement that has not been cured within 30 days after written notice of such breach by the Board of Directors.
For purposes of the Goldberg Agreement, “constructive termination” occurs if Ms. Goldberg gives the Company written notice of the existence of any of the following: (i) Ms. Goldberg is required to relocate her place of employment without her approval, other than a relocation that is within 30 miles of the Company’s Stamford offices; (ii) there is an intentional and material reduction in Ms. Goldberg’s base salary (other than a reduction that is consistent with a general reduction for the executive staff as a group); (iii) there occurs any other material breach of the Goldberg Agreement by the Company provided Ms. Goldberg provides a written demand for substantial performance to the Company. Constructive termination will only be deemed to occur if the Company fails to cure the event within 31 days following the date such notice is given.
The Goldberg Agreement also contains a non-compete provision, which applies during the term of the Goldberg Agreement and, provided Ms. Goldberg has received a severance payment for a period of one year after she has received such payment. Pursuant to the non-compete provision, Ms. Goldberg is prohibited from (1) inducing or attempting to induce any employee of the Company or such subsidiary (other than her own assistant) to leave the employ of the Company, or in any way interfere with the relationship between the Company or any subsidiary and any employee thereof; (2) hiring or attempt to hire an employee of the Company or any subsidiary at any time during the preceding 12 months (unless the employee contacts Ms. Goldberg on an unsolicited basis); (3) directly or indirectly inducing or attempting to induce any customer, supplier, licensee or other business relation of the Company or (4) disparaging the Company, its executive officers, or its directors.
Robert Werner Employment Agreement
We entered into an employment agreement with Mr. Werner, effective April 1, 2010 (the “Werner Agreement”), in connection with Mr. Werner’s employment as our Vice President of Supply. The Werner Agreement replaces a previous employment agreement dated August 14, 2006. The term of the Werner Agreement is three years from its effective date.
Pursuant to the Werner Agreement, Mr. Werner will report to the CEO or, at the discretion of the CEO, to someone serving as the Company’s Chief Operating Officer or Executive Vice President. Mr. Werner’s office will be located in the Company’s Houston offices.
The Werner Agreement provides that Mr. Werner will receive an annual base salary of $300,000, which was paid retroactively to August 13, 2009. Mr. Werner is also entitled to receive other employee benefits provided to executive employees of the Company generally from time to time, including health, life insurance, disability, retirement, welfare, vacation, sick leave, holidays and sabbatical, so long as Mr. Werner is eligible for such benefits in accordance with the terms of such plans and with the policies of the Company.
Mr. Werner will be eligible for a bonus, which may be paid from time to time to senior management of the Company, at the discretion of the Board of Directors. Mr. Werner’s target bonus shall be 100% of his base salary for performance that the Board of Directors determines to be satisfactory. If performance goals are exceeded, Mr. Werner’s annual bonus may exceed the target bonus, provided however that in no event shall the annual bonus exceed 150% of his base salary.
The Werner Agreement also entitles Mr. Werner to participate, on the same basis as other similarly situated employees of the Company, in any future stock option plans and any other equity based incentive plans as may be approved by the Board of Directors from time to time.
In the event of Mr. Werner’s resignation or death, or if the Company terminates the Werner Agreement for “business reasons” (as such term is defined in the Werner Agreement, which generally includes “cause” events such as felony conviction, fraud or insubordination), the Company may terminate the Werner Agreement immediately and without advance notice to Mr. Werner, and the Company will pay to Mr. Werner: (i) all compensation due for base salary and paid time off for services performed to the date of termination; (ii) any unreimbursed business expenses; and (iii) any other amounts due to Mr. Werner under any Company-provided or paid plans, policies or arrangements.
In the event that the Company terminates the Werner Agreement without business reasons, or if Mr. Werner terminates his employment as a result of a “constructive termination,” (as such term is defined in the Werner Agreement, such as a material reduction in salary or authority or a relocation), then within thirty (30) days of such termination date, the Company shall pay Mr. Werner: (i) all compensation due for base salary and paid time off for services performed to the date of termination; (ii) any unreimbursed business expenses; (iii) any other amounts due to Mr. Werner under any Company-provided or paid plans, policies or arrangements; and (iv) any accrued and unpaid annual bonus for a previous fiscal year. In addition, subject to certain requirements stipulated in the Werner Agreement, the Company shall pay to Mr. Werner a lump sum equal to: (i) the amount of his base salary for the greater of twelve (12) months or the remainder of the term of the Werner Agreement; and (ii) the amount of Mr. Werner’s target bonus.
If there is a change in control (as such term is defined in the Werner Agreement) and either: (i) a constructive termination occurs; (ii) the Company terminates Mr. Werner’s employment without business reasons within twelve (12) months following the change in control; or (iii) the Company elects not to extend the Werner Agreement for a renewal term within the twelve (12) months that follow the change in control, then, subject to certain requirements stipulated in the Werner Agreement, he will be entitled to receive a lump sum equal to his base salary.
The Werner Agreement provides that in the event that Mr. Werner becomes entitled to payments or benefits that would constitute an “excess parachute payment” within the meaning of Section 280G of the Code, the payment and/or benefits will be reduced to the extent that such payments will not be subject to the excise tax or any interest or penalties imposed by Section 4999 of the Code, referred to herein as the 280G Reduction. The 280G Reduction will only take place if Mr. Werner’s “net after tax benefit” (as defined in the Parikh Agreement) exceeds the net after tax benefit he would realize if the 280G Reduction were not made. To the extent the 280G Reduction is unavailable because Mr. Werner’s net after tax benefit would be greater if the 280G Reduction were not made, we will pay Mr. Werner a gross up payment in an amount such that after the payment by Mr. Werner of all taxes (including any income taxes, interest, penalties or any excise taxes), Mr. Werner would retain an amount of the gross-up payment equal to seventy-five (75%) of any excise tax imposed upon the payments received by Mr. Werner. The Werner Agreement also includes a Code Section 409A provision to reduce the risk of potential adverse tax consequences to Mr. Werner.
The Werner Agreement also contains non-compete provisions, which apply during the term of the Werner Agreement and, if a severance payment is made by the Company to Mr. Werner, for a period of one year following Mr. Werner’s termination for any reason. Pursuant to the non-compete provision, Mr. Werner is prohibited from: (i) directly or indirectly owning, managing, controlling, participating in, consulting with, rendering certain specified services for, or in any manner engaging in an business that competes with the Company or its subsidiaries; (ii) soliciting or inducing any employee of the Company; (iii) hiring or attempting to hire any such employee of the Company; (iv) directly or indirectly inducing or attempting to induce any customer, supplier, licensee or other business relation of the Company or its subsidiaries to cease doing business with the Company or such subsidiary or in any way interfering with the relationship between any such customer, supplier, licensee or business relation and the Company or any subsidiary; and (v) disparaging the Company, its executive officers or its directors.
Post-Employment Payments
The following table summarizes the payments that we would have been required to make to the named executive officers as of June 30, 2010 as a result of their termination, retirement, disability or death or a change in control of the Company as of that date. The specific circumstances identified in the table that would trigger such payments are described in the employment agreement for each executive.
|
|
|
Termination Event |
|
|||||||||||||
|
|
|
Involuntary |
|
Involuntary |
|
Change in |
|
Disability |
|
Death |
|
|||||
|
|
|
|
|
|
|
|
|
|
|
|
|
|||||
|
Jeffrey Mayer: |
|
|
|
|
|
|
|
|
|
|
|
|||||
|
Cash severance payment |
|
$ |
2,984,975 |
|
$ |
460,635 |
|
$ |
2,390,150 |
|
$ |
460,635 |
|
$ |
460,635 |
|
|
Health and life insurance |
|
22,999 |
|
— |
|
— |
|
— |
|
— |
|
|||||
|
Continuation of perquisites |
|
36,000 |
|
— |
|
— |
|
— |
|
— |
|
|||||
|
Total termination benefits |
|
$ |
3,043,974 |
|
$ |
460,635 |
|
$ |
2,390,150 |
|
$ |
460,635 |
|
$ |
460,635 |
|
|
|
|
|
|
|
|
|
|
|
|
|
|
|||||
|
Chaitu Parikh: |
|
|
|
|
|
|
|
|
|
|
|
|||||
|
Cash severance payment |
|
$ |
3,499,649 |
|
$ |
458,142 |
|
$ |
3,049,649 |
|
$ |
458,142 |
|
$ |
458,142 |
|
|
Health and life insurance |
|
40,832 |
|
— |
|
— |
|
— |
|
— |
|
|||||
|
Total termination benefits |
|
$ |
3,540,481 |
|
$ |
458,142 |
|
$ |
3,049,649 |
|
$ |
458,142 |
|
$ |
458,142 |
|
|
|
|
|
|
|
|
|
|
|
|
|
|
|||||
|
Robert Blake: |
|
|
|
|
|
|
|
|
|
|
|
|||||
|
Cash severance payment |
|
$ |
223,013 |
|
$ |
185,513 |
|
$ |
223,013 |
|
$ |
185,513 |
|
$ |
185,513 |
|
|
Total termination benefits |
|
$ |
223,013 |
|
$ |
185,513 |
|
$ |
223,013 |
|
$ |
185,513 |
|
$ |
185,513 |
|
|
|
|
|
|
|
|
|
|
|
|
|
|
|||||
|
Gina Goldberg: |
|
|
|
|
|
|
|
|
|
|
|
|||||
|
Cash severance payment |
|
$ |
600,456 |
|
$ |
318,591 |
|
$ |
318,591 |
|
$ |
318,591 |
|
$ |
318,591 |
|
|
Total Termination benefits |
|
$ |
600,456 |
|
$ |
318,591 |
|
$ |
318,591 |
|
$ |
318,591 |
|
$ |
318,591 |
|
|
|
|
|
|
|
|
|
|
|
|
|
|
|||||
|
Robert Werner: |
|
|
|
|
|
|
|
|
|
|
|
|||||
|
Cash severance payment |
|
$ |
1,238,891 |
|
$ |
12,864 |
|
$ |
712,864 |
|
$ |
12,864 |
|
$ |
12,864 |
|
|
Total Termination benefits |
|
$ |
1,238,891 |
|
$ |
12,864 |
|
$ |
712,864 |
|
$ |
12,864 |
|
$ |
12,864 |
|
Director Compensation
The following table provides summary compensation information for each non-employee director during the fiscal year ended June 30, 2010:
|
Name |
|
Fees |
|
Stock |
|
Option |
|
Total |
|
||||
|
|
|
|
|
|
|
|
|
|
|
||||
|
Mark Bernstein |
|
$ |
82,000 |
|
$ |
25,000 |
|
$ |
— |
|
$ |
107,000 |
|
|
Denham Commodity Partners Fund LP (1) |
|
37,500 |
|
12,500 |
|
— |
|
50,000 |
|
||||
|
Carl Adam Carte (1) |
|
24,500 |
|
12,500 |
|
— |
|
37,000 |
|
||||
|
James N. Chapman |
|
92,250 |
|
25,000 |
|
— |
|
117,250 |
|
||||
|
Michael J. Hamilton |
|
103,000 |
|
50,000 |
|
— |
|
153,000 |
|
||||
|
Charter Mx LLC (2) |
|
73,000 |
|
25,000 |
|
— |
|
98,000 |
|
||||
|
Randal T. Maffett |
|
83,750 |
|
25,000 |
|
— |
|
108,750 |
|
||||
|
RBS Sempra (2) |
|
66,500 |
|
25,000 |
|
— |
|
91,500 |
|
||||
|
Jonathan Moore |
|
69,000 |
|
25,000 |
|
— |
|
94,000 |
|
||||
(1) Prior to May 2011, a former director, who was also an executive officer of Denham, was appointed to represent Denham on Holdings’ Board of Directors and all committee and attendance fees associated with the activities of the former director were paid directly to Denham. Effective in May 2010, Mr. Carte became the appointed director to represent Denham. Because Mr. Carte is considered to be independent of Denham, all committee and attendance fees associated with Mr. Carte’s activites are paid directly to him.
(2) Mr. Landuyt and Ms. Mitchell are the appointed directors to represent Charter Mx LLC and RBS Sempra, respectively on Holdings’ Board of Directors. Committee and attendance fees associated with the activities of Mr. Landuyt and Ms. Mitchell are paid directly to those entities.
(3) The aggregate number of RSUs outstanding for directors at June 30, 2010 were as follows: 5,102 RSUs each for Messrs. Bernstein, Carte, Chapman, Maffett, and Moore; 5,102 RSUs each for Charter Mx LLC and RBS Sempra; and 10,204 RSUs for Mr. Hamilton.
Effective as of January 1, 2010, pursuant to an amendment to the certificate of incorporation, the Company will pay each independent director a retainer of $50,000 per year, a retainer of $10,000 per year for serving on the Executive, Compensation and Governance Committee, a retainer of $10,000 per year for serving on the Risk Oversight Committee and a retainer of $12,000 per year for serving on the Audit Committee. The chairman of each of the Executive, Compensation and Governance Committee and the Risk Oversight Committee will receive an additional retainer of $5,000 per year, and the chairman of the Audit Committee will receive an additional retainer of $3,000 per year. The Chairman of the Board of Directors, if he or she is an independent director, will receive an additional retainer of $25,000 per year. In addition, the Company will issue equity securities to directors, pursuant to a management equity plan, as follows: (i) each independent director will receive equity securities with a value of $25,000 per year; and (ii) the Chairman of the Board of Directors, if the Chairman is an independent director, will receive an additional annual issuance of equity securities with a value of $25,000 per year. The Company also will pay each independent director $2,000 for attendance in person at each regular or special board meeting or committee meeting and $500 for attendance by telephone at each regular or special board or committee meeting.
In January 2010, Holdings’ directors were granted RSUs, pursuant to which we may issue shares of Class C Common Stock, subject to prescribed vesting requirements. Refer to Notes 2 and 19 of the consolidated financial statements included in Item 8 of this Annual Report for additional information regarding RSUs granted during fiscal year 2010. During fiscal year 2010, we did not grant any non-equity incentive compensation or other deferred compensation to any of our directors. We do not provide any defined benefit or defined contribution plan benefits to any of our directors.
Compensation Committee and ECG Committee Interlocks and Insider Participation
Messrs. Chapman (Chair), Bernstein, Hamilton and Landuyt and Ms. Mitchell serve on the ECG Committee as of July 27, 2010. None of these directors has a material relationship with the Company or has a current or prior relationship with the Company, or is a holder of shares of common stock or is a
member of management of the Company that might cause such director to act other than in an entirely independent manner with respect to all issues that come before the Board of Directors. The Board of Directors has determined that Ms. Mitchell is not an independent director as a result of her affiliation with RBS Sempra, a significant stockholder of the Company and the lender and counterparty under the Commodity Supply Facility.
During fiscal year 2010, we had no Compensation Committee or ECG Committee “interlocks,” meaning that no executive officer of the Company served as a director or member of the Compensation Committee of another entity of which an executive officer served as a director or a member of the Compensation Committee of the Company.
ITEM 12. SECURITY OWNERSHIP OF CERTAIN BENEFICIAL OWNERS AND MANAGEMENT AND RELATED STOCKHOLDER MATTERS
The following table sets forth, as of August 31, 2010, information with respect to shares of common stock beneficially owned by: (1) each of the named executive officers; (2) each director; (3) all executive officers and directors as a group; and (4) each person known to be the beneficial owner of more than five percent of our outstanding shares of common stock.
The percentages of common stock and beneficially owned are reported on the basis of SEC regulations governing the determination of beneficial ownership of securities. Under the rules of the SEC, a person is deemed to be a “beneficial owner” of a security if that person has or shares “voting power,” which includes the power to vote or to direct the voting of such security, or “investment power,” which includes the power to dispose of or to direct the disposition of such security. A person is also deemed to be a beneficial owner of any securities for which that person has a right to acquire beneficial ownership within 60 days. All persons listed have sole voting and investment power with respect to their shares (subject to community property laws where applicable) unless otherwise indicated.
|
|
|
Common Stock (1) |
|
||||||||
|
|
|
Total |
|
Percentage of |
|
||||||
|
Name or Description |
|
Owned |
|
Class A |
|
Class B |
|
Class C |
|
Total |
|
|
|
|
|
|
|
|
|
|
|
|
|
|
|
Executive Officers and Directors: |
|
|
|
|
|
|
|
|
|
|
|
|
Jeffrey Mayer (2) |
|
1,308,609 |
|
0.8 |
% |
— |
% |
6.0 |
% |
2.4 |
% |
|
Chaitu Parikh (3) |
|
649,869 |
|
0.8 |
|
— |
|
2.2 |
|
1.2 |
|
|
Robert Blake (4) |
|
39,070 |
|
— |
|
— |
|
0.2 |
|
0.1 |
|
|
Gina Goldberg (5) |
|
38,885 |
|
— |
|
— |
|
0.2 |
|
0.1 |
|
|
Robert Werner (6) |
|
38,109 |
|
— |
|
— |
|
0.2 |
|
0.1 |
|
|
Mark Bernstein (7) |
|
10,204 |
|
— |
|
— |
|
— |
|
— |
|
|
Carl Adam Carte (8) |
|
5,102 |
|
— |
|
— |
|
— |
|
— |
|
|
James N. Chapman (7) |
|
10,204 |
|
— |
|
— |
|
— |
|
— |
|
|
Michael J. Hamilton (9) |
|
20,408 |
|
— |
|
— |
|
— |
|
— |
|
|
William Landuyt (10) |
|
10,014,909 |
|
— |
|
— |
|
57.5 |
|
18.2 |
|
|
Randal T. Maffett (7) |
|
10,204 |
|
— |
|
— |
|
— |
|
— |
|
|
Jacqueline Mitchell |
|
— |
|
— |
|
— |
|
— |
|
— |
|
|
Jonathan Moore (7) |
|
10,204 |
|
— |
|
— |
|
— |
|
— |
|
|
All directors and executive officers as a group (13 persons) (11) |
|
12,169,729 |
|
1.5 |
|
— |
|
66.9 |
|
22.1 |
|
|
|
|
|
|
|
|
|
|
|
|
|
|
|
5% Stockholders: |
|
|
|
|
|
|
|
|
|
|
|
|
Charter
Mx LLC (10) |
|
10,014,909 |
|
— |
|
— |
|
57.5 |
|
18.2 |
|
|
|
|
|
|
|
|
|
|
|
|
|
|
|
Camulos
Capital LP (12) |
|
6,476,179 |
|
19.2 |
|
— |
|
— |
|
11.7 |
|
|
|
|
|
|
|
|
|
|
|
|
|
|
|
Denham
Commodity Partners Fund LP (13) |
|
8,437,630 |
|
18.3 |
|
— |
|
13.0 |
|
15.3 |
|
|
|
|
|
|
|
|
|
|
|
|
|
|
|
Rose
Point Partners LLC (14) |
|
4,274,570 |
|
12.7 |
|
— |
|
— |
|
7.8 |
|
|
|
|
|
|
|
|
|
|
|
|
|
|
|
Sempra
Energy Trading LLC (15) |
|
4,012,494 |
|
— |
|
100.0 |
|
0.1 |
|
7.3 |
|
|
|
|
|
|
|
|
|
|
|
|
|
|
|
Morgan
Stanley & Co. on behalf of certain funds and accounts, as holders
(16) |
|
3,756,228 |
|
11.1 |
|
— |
|
— |
|
6.8 |
|
|
|
|
|
|
|
|
|
|
|
|
|
|
|
Deutsche
Bank Securities, Inc. and affiliated entities (17) |
|
3,420,000 |
|
10.1 |
|
— |
|
— |
|
6.2 |
|
|
|
|
|
|
|
|
|
|
|
|
|
|
|
AIG
Asset Management Group on behalf of certain funds and accounts, as holders
(18) |
|
3,111,126 |
|
9.2 |
|
— |
|
— |
|
5.6 |
|
|
|
|
|
|
|
|
|
|
|
|
|
|
|
Whippoorwill
Associates, Inc., including shares voted on behalf of certain funds and
accounts, as holders (19) |
|
2,500,000 |
|
7.4 |
|
— |
|
— |
|
4.5 |
|
|
|
|
|
|
|
|
|
|
|
|
|
|
|
Greenhill
Capital Partners, L.P. and its affiliated funds(20) |
|
1,923,979 |
|
— |
|
— |
|
11.0 |
|
3.5 |
|
|
(1) |
|
The total number of shares beneficially owned includes the following outstanding shares of Holdings’ common stock as of August 31, 2010: 33,710,902 shares of Class A Common Stock; 4,002,290 shares of Class B Common Stock; 16,438,669 shares of Class C Common Stock; and an aggregate total of 54,151,861 shares of common stock. The total number of shares beneficially owned also includes an aggregate total of 978,231 shares of Class C Common Stock expected to be issued within |
|
|
|
|
|
|
|
60 days subsequent to August 31, 2010 in connection with outstanding awards of RSUs. |
|
(2) |
|
Includes: (1) 258,339 shares of Class A Common Stock and 31,538 shares of Class C Common Stock issued and outstanding as of August 31, 2010; (2) 570,953 shares of Class C Common Stock issued to Pequot Enterprises LLC, a limited liability company owned 23% by Mr. Mayer and for which Mr. Mayer, as manager, has both voting and dispositive power; and (3) 447,779 shares of Class C Common Stock expected to be issued on September 22, 2010 in connection with outstanding awards of RSUs. |
|
(3) |
|
Includes: (1) 258,339 shares of Class A Common Stock and 19,969 shares of Class C Common Stock issued and outstanding as of August 31, 2010; and (2) 371,561 shares of Class C Common Stock expected to be issued on September 22, 2010 in connection with outstanding awards of RSUs. |
|
(4) |
|
Includes: (1) 961 shares of Class C Common Stock issued and outstanding as of August 31, 2010; and (2) 38,109 shares of Class C Common Stock expected to be issued on September 22, 2010 in connection with outstanding awards of RSUs. |
|
(5) |
|
Includes: (1) 776 shares of Class C Common Stock issued and outstanding as of August 31, 2010; and (2) 38,109 shares of Class C Common Stock expected to be issued on September 22, 2010 in connection with outstanding awards of RSUs. |
|
(6) |
|
Includes 38,109 shares of Class C Common Stock expected to be issued on September 22, 2010 in connection with outstanding awards of RSUs. |
|
(7) |
|
Includes: (1) 7,653 shares of Class C Common Stock issued and outstanding as of August 31, 2010; and (2) 2,551 shares of Class C Common Stock expected to be issued on October 1, 2010 in connection with outstanding awards of RSUs. |
|
(8) |
|
Includes: (1) 2,551 shares of Class C Common Stock issued and outstanding as of August 31, 2010; and (2) 2,551 shares of Class C Common Stock expected to be issued on October 1, 2010 in connection with outstanding awards of RSUs. |
|
(9) |
|
Includes: (1) 15,306 shares of Class C Common Stock issued and outstanding as of August 31, 2010; and (2) 5,102 shares of Class C Common Stock expected to be issued on October 1, 2010 in connection with outstanding awards of RSUs. |
|
(10) |
|
Includes: (1) 10,012,358 shares of Class C Common Stock issued and outstanding as of August 31, 2010; and (2) 2,551 shares of Class C Common Stock expected to be issued on October 1, 2010 in connection with outstanding awards of RSUs. All of the shares of Class C Common Stock are held, or will be held, by Charter Mx LLC. Charter Mx LLC is wholly-owned by Charterhouse Equity Partners IV, L.P. The general partner of Charterhouse Equity Partners IV, L.P. is CHUSA Equity Investors IV, L.P., whose general partner is Charterhouse Equity IV, LLC, a wholly owned subsidiary of Charterhouse Group, Inc. As a result of the foregoing, all of the shares held by Charter Mx LLC would be deemed to be beneficially owned by Charterhouse Group, Inc. We have been advised by Charterhouse Group, Inc. that all decisions regarding investments by Charterhouse Equity Partners IV, L.P. (the “Fund”) are made by an investment committee whose composition may change. No individual has authority to make any such decisions without the approval of the Fund’s investment committee. William Landuyt is an executive officer of Charterhouse Group, Inc. and a member of the Fund’s investment committee, the members of which, including Mr. Landuyt, each disclaim beneficial ownership of the shares held by Charter Mx LLC except to the extent of his or her pecuniary interest therein. |
|
(11) |
|
Represents beneficial ownership as a group for all directors and executive officers listed in the table under “Directors, Executive Officers and Corporate Governance—Directors and Executive Officers.” Includes: (1) 516,678 shares of Class A Common Stock and 10,682,473 shares of Class C Common Stock issued and outstanding as of August 31, 2010; and (2) 970,578 shares of Class C Common Stock expected to be issued within 60 days subsequent to August 31, 2010 in connection with outstanding awards of RSUs. |
|
(12) |
|
Includes 6,476,179 shares of Class A Common Stock issued and outstanding as of August 31, 2010. |
|
(13) |
|
Includes: (1) 6,166,712 shares of Class A Common Stock and 2,268,367 shares of Class C Common Stock issued and outstanding as of August 31, 2010; and (2) 2,551 shares of Class C Common Stock expected to be issued on October 1, 2010 in connection with outstanding awards of RSUs. |
|
(14) |
|
Includes 4,274,570 shares of Class A Common Stock issued and outstanding as of August 31, 2010. |
|
(15) |
|
Includes: (1) 4,002,290 shares of Class B Common Stock and 7,653 shares of Class C Common Stock issued and outstanding as of August 31, 2010; and (2) 2,551 shares of Class C Common Stock expected to be issued on October 1, 2010 in connection with outstanding awards of RSUs. |
|
(16) |
|
Includes 3,756,228 shares of Class A Common Stock issued and outstanding as of August 31, 2010. |
|
(17) |
|
Includes 3,420,000 shares of Class A Common Stock issued and outstanding as of August 31, 2010. |
|
(18) |
|
Includes 3,111,126 shares of Class A Common Stock issued and outstanding as of August 31, 2010. |
|
(19) |
|
Includes: (1) 1,619,962 shares of Class A Common Stock issued and outstanding as of August 31, 2010 held by entities affiliated with Whippoorwill Associates, Inc.; and (2) and 880,038 shares of Class A Common Stock issued and outstanding as of August 31, 2010 held by certain funds and accounts, as holders, over which Whippoorwill Associates, Inc. exercises voting control. |
|
(20) |
|
Includes 1,923,979 shares of Class C Common Stock issued and outstanding as of August 31, 2010. |
Equity compensation plan information is summarized in the following table.
|
Plan Category |
|
Number of |
|
Weighted- |
|
Number of |
|
|
|
|
|
|
|
|
|
|
|
Equity compensation plans approved by security holders |
|
— |
|
— |
|
3,175,738 |
|
|
Equity compensation plans not approved by security holders |
|
— |
|
— |
|
— |
|
|
Total |
|
— |
|
— |
|
3,175,738 |
|
ITEM 13. CERTAIN RELATIONSHIPS AND RELATED TRANSACTIONS, AND DIRECTOR INDEPENDENCE
Our Code of Ethics, which is posted on our website at www.mxholdings.com, prohibits directors and executive officers from engaging in transactions on behalf of the Company with a family member, or with a company with which they or any family member are a significant owner or associated or employed in a significant role. Our Audit Committee must review and approve in advance all related party transactions or business or professional relationships. All instances involving potential related party transactions or business or professional relationships must be reported to the Company’s in-house legal counsel, who is responsible to assess the materiality of the transaction or relationship and elevate the matter to the Audit Committee as appropriate.
Stockholders Agreement
On September 22, 2009, in connection with the consummation of our Restructuring, we entered into a new stockholders agreement, which we amended as of July 27, 2010 (the “Stockholders Agreement”). Pursuant to the Stockholders Agreement, holders of Class A Common Stock are not subject to any restrictions on the transfer of their shares while holders of Class B Common Stock and certain holders of Class C Common Stock are subject to certain restrictions. Moreover, transfers of all shares of Class C Common Stock are subject to a right of first refusal in favor of the holders of shares of Class A Common Stock and holders of shares of Class B Common Stock. No shares of Common Stock may be transferred to competitors of the Company or in any transaction that, among other things, violates or causes a default, “change in control” or similar event under any of the Company’s or any of its subsidiaries’ material debt agreements, indentures and other agreements or instruments evidencing material indebtedness of the Company or any of its subsidiaries (with certain exceptions), violates applicable securities laws or certain other laws, or results in certain other specified consequences, unless such transaction has been approved by (i) a majority of the authorized Class A directors (the “Class A Directors”), (ii) a majority of all authorized directors and (iii) in the case of certain specified actions, for so long as holders of shares of Class B Common Stock have the exclusive right to nominate and elect the Class B director (the “Class B Director”), the Class B Director.
All shares of common stock will have preemptive rights, subject to certain exceptions, and information rights. If a party that did not acquire shares of common stock on September 22, 2009 (a “New Shareholder”) acquires, together with its affiliates, or proposes to acquire, from any person (such person, a “Selling Shareholder”), whether through one or a series of transactions, such number of shares of common stock as would result in the New Shareholder (together with its affiliates) holding a majority of the then-issued and outstanding shares of common stock, then such New Shareholder, prior to consummating the proposed acquisition, must make a mandatory offer (a “Mandatory Offer”) to purchase the remaining shares of common stock that it does not own at a price equal to the higher of (a) the highest price per share paid by the New Shareholder and its affiliates for any shares of common stock acquired by the New Shareholder and its affiliates during the preceding nine months and (b) the purchase price per share to be paid by the New Shareholder to the Selling Shareholder for the shares of common stock to be acquired by the New Shareholder from the Selling Shareholder.
Customary tag-along rights are provided to all shareholders under the Stockholders Agreement with respect to sales of shares of common stock representing in the aggregate a majority of the then-issued and outstanding shares of all classes of common stock, on a fully diluted basis, to a single purchaser, or group of related purchasers, in any transaction or series of related transactions, including where the conditions of a tag-along transfer are satisfied as a result of a Mandatory Offer, subject to certain exceptions.
Customary drag-along rights are provided under the Stockholders Agreement if holders of shares representing at least 75% of all classes of common stock and holders of shares representing at least 70% of the Class B Common Stock (until shares of Class B Common Stock are converted into shares of Class C Common Stock or Class D Common Stock in connection with an IPO) determine to sell all of the shares of common stock to a person or persons (other than a person that (i) has among its shareholders, members, partners or other equity holders, holders of common stock that collectively hold more than 20% of the outstanding shares of common stock, or any affiliates of such holders, or (ii) is more than 20% owned or controlled, directly or indirectly, by holders of common stock, and other than an affiliate of any of the
selling stockholders or a group including one or more affiliates of any of the selling stockholders) in any transaction, or series of related transactions, that is proposed to be effected on an arms-length basis. The Company will have the right (but not the obligation) to purchase all (but not less than all) of the shares of Class A Common Stock or Class C Common Stock held by any holder who has not executed the Stockholders Agreement and who fails to sell its shares of Common Stock to the purchaser in a drag-along transaction following a valid exercise of the drag-along rights contained in the Stockholders Agreement.
The following matters require approval of (a) holders of at least 70% of the issued and outstanding shares of Class A Common Stock, (b) holders of at least 70% of the issued and outstanding shares of Class B Common Stock (provided, with respect to clause (ii) below only, that such amendment affects the rights of holders of the Class B Common Stock or increases the number of authorized shares of Class B Common Stock), (c) in the case of clause (ii) below only, and solely to the extent that such amendment affects the rights of the Class C Common Stock or increases the number of authorized shares of Class C Common Stock, holders of at least 70% of the issued and outstanding shares of Class C Common Stock, and (d) holders of at least 75% of all issued and outstanding shares of common stock:
|
(i) |
|
commencement of a voluntary liquidation, winding up or dissolution of the Company or any of its subsidiaries, filing of any petition in bankruptcy or insolvency or entering into any arrangement for the benefit of creditors, commencing any other proceeding for the reorganization, recapitalization or adjustment or marshalling of the assets or liabilities of the Company or any of its subsidiaries, or the adoption by the Company or any of its subsidiaries of a plan with respect to any of the foregoing, or acquiescence or agreement by the Company or any of its subsidiaries to any of the foregoing commenced or petitioned for on an involuntary basis; |
|
(ii) |
|
amendment or modification of the certificate of incorporation or the bylaws of the Company or any subsidiary of the Company; |
|
(iii) |
|
reorganization of the Company or reclassification of any of its securities; and |
|
(iv) |
|
waiver of preemptive rights in connection with a strategic investment in the Company by any person. |
In addition to any vote by holders of common stock required under Delaware law, a vote of holders of at least 70% of the issued and outstanding shares of Class A Common Stock and holders of at least 70% of the issued and outstanding shares of Class B Common Stock (in the case of the Class B Common Stock, until shares of Class B Common Stock are converted into shares of Class C Common Stock or shares of Class D Common Stock or unless the contemplated merger or other transaction would, as a condition to the consummation thereof, result in, and does result in, the full pay-off and termination of the Commodity Supply Facility) is required to approve any merger, consolidation or other business combination involving the Company or any of its subsidiaries (other than mergers of wholly owned subsidiaries of the Company with each other or the Company) or any transaction having the effect (economic or otherwise) of a sale of all or substantially all of the assets of the Company or any of its subsidiaries (other than transfers of assets of wholly owned subsidiaries of the Company to each other or the Company).
Pursuant to the Stockholders Agreement, the Board of Directors consists of nine directors, elected as follows:
· Holders of the Class A Common Stock are entitled to nominate five Class A Directors, at least two of whom shall be independent and qualify as a “financial expert.”
· Holders of the Class B Common Stock are entitled to nominate and elect one Class B Director until the shares of Class B Common Stock have been converted and are no longer outstanding. At such time as the shares of Class B Common Stock have been converted and are no longer outstanding, the Class B Director position will be filled by the vote of a plurality of all holders of Common Stock voting as a single class at any meeting of the stockholders of the Company at which the Class B Director would otherwise have been permitted to be elected, or as otherwise permitted under the Bylaws, and the Class B Director will be required to be independent and qualify as a “financial expert.”
· Holders of the Class C Common Stock are entitled to nominate and elect two Class C Directors.
· The ninth Director will be the Company’s president and chief executive officer, who initially, shall be Jeffrey A. Mayer.
Following the conversion of the shares of Class A Common Stock, Class B Common Stock (if applicable) and Class C Common Stock into shares of Class D Common Stock in connection with an IPO, the Board of Directors will consist of such number of directors as will be determined by the Board of Directors from time to time, which number will not be less than seven (7) nor more than fifteen (15) directors, and directors will be elected by holders of shares of common stock, voting as a single class at any meeting of the stockholders of the Company at which directors are permitted to be elected, or as otherwise permitted under the Bylaws, provided, however, that, for so long as the shares of Class B Common Stock are outstanding and have not been converted into shares of Class C Common Stock or into shares of Class D Common Stock, the Board of Directors will include one director nominated and elected by holders of shares of Class B Common Stock.
In order to conduct meetings of the Board of Directors, a quorum requires the presence of (i) a majority of the directors then in office, and (ii) prior to the conversion of shares of Class A Common Stock, Class B Common Stock (if applicable) and Class C Common Stock into shares of Class D Common Stock, (A) a majority of the Class A Directors then in office, (B) the Class B Director and (C) a Class C Director, provided, however, that if a meeting for which notice has been duly given or waived in accordance with the Bylaws is adjourned due to the failure of either the Class B Director or a Class C Director to be in attendance, then so long as notice is duly delivered of the time and place of the reconvened meeting in accordance with the Bylaws, the presence of either the Class B Director or a Class C Director at the reconvened meeting will not be required to establish quorum.
Class A Voting Agreement and Class C Voting Agreement
In addition, on September 22, 2009, holders of Class A Common Stock entered into a Class A Voting Agreement (the “Class A Voting Agreement”) that governs their rights to nominate and elect the Class A Directors and certain related matters and holders of Class C Common Stock entered into a Class C Voting Agreement (the “Class C Voting Agreement”) that governs their rights to nominate and elect the Class C Directors and certain related matters. The Class A Voting Agreement also provides that so long as AIG Global Investment Corp., as the investment advisor (or any asset management entity successor thereto) for certain entities that will hold shares of Class A Common Stock (“AIG”), Camulos Capital LP, as the investment manager for certain entities that will hold shares of Class A Common Stock (“Camulos”), and/or Taconic Capital Advisors LP (“Taconic”), as the investment manager for certain entities that will hold shares of Class A Common Stock, hold at least 35% of the Class A Common Stock held by it on September 22, 2009 (after giving effect to stock splits or combinations or similar events), such stockholder (each a “Designating Stockholder” and, collectively, the “Designating Stockholders”) shall be entitled to designate one of the Class A Directors. The fourth and fifth Class A Directors will be designated by the Designating Stockholders by mutual agreement and will be independent and qualify as “financial experts.” If any Designating Stockholder loses its right to designate a Class A Director, thereafter the stockholders that retain the designation right will, by mutual agreement, designate the Class A Director and such Class A Director position will be elected by a plurality vote of the shares of Class A Common Stock. As of April 7, 2010, Taconic no longer held 35% of the Class A Common Stock held by it on September 22, 2009, and accordingly, it no longer has the right to designate a Class A Director.
The Class C Voting Agreement provides that one of the Class C Directors shall be designated by Charterhouse so long as Charterhouse holds at least 35% of the outstanding shares of Class C Common Stock held by it on September 22, 2009 (after giving effect to stock splits or combinations or similar events), and the other Class C Director shall be designated by Denham so long as Denham holds at least 35% of the outstanding shares of Class C Common Stock held by it on September 22, 2009 (after giving effect to stock splits or combinations or similar events). If either Charterhouse or Denham loses its right to designate a Class C Director, thereafter such Class C Director position will be elected by a plurality vote of the shares of Class C Common Stock.
Denham Credit Facility
Denham is a significant stockholder of the Company. Stuart Porter, a principal of Denham Capital Management LP and Chief Investment Officer for Denham, was a director of Holdings until May 13, 2010. As of June 30, 2009, the Company had borrowed the entire $12.0 million available line under the Denham Credit Facility, which bore interest at 9% per annum. In connection with
the Restructuring, the entire outstanding balance under the Denham Credit Facility was repaid, including accrued and unpaid interest, and the facility was terminated on September 22, 2009.
Legal Services
Daniel Bergstein, a former director of Holdings and a current stockholder of the Company, is senior counsel to Paul, Hastings, Janofsky & Walker LLP, a law firm that provides legal services to the Company. Paul Hastings provides the Company with general legal services, including legal services associated with the Restructuring and amendments to the Revolving Credit Facility and Hedge Facility. Paul Hastings is expected to continue to provide legal services to the Company in future periods.
Financial Advisory Services
Prior to the consummation of the Restructuring, the Company had a financial advisory services agreement with Greenhill & Co., LLC (“Greenhill”), an affiliate of Greenhill Capital Partners, a significant stockholder of the Company (the “Greenhill Agreement”). Under the Greenhill Agreement, Greenhill provided advisory services in connection with liquidity options considered during the Restructuring. The Greenhill Agreement was terminated effective September 22, 2009.
Management Fees
As of June 30, 2009, the Company had agreed to pay Denham, Charter Mx LLC, a significant stockholder of the Company, and Daniel Bergstein an aggregate annual fee of $0.9 million, payable in equal quarterly amounts, for management consulting services provided to the Company. Following the Restructuring, the Company terminated its agreements with Denham, Charter Mx LLC and Mr. Bergstein.
Effective September 23, 2009, the Company’s Board of Directors approved an arrangement under which Mr. Bergstein will be paid annual fees of $50,000 for management consulting services provided to the Company. In addition, the Company granted RSUs to Mr. Bergstein in January 2010, which will vest ratably from January 15, 2010 through October 1, 2010.
Original Notes Held by Holders of Class A Common Stock and Class C Common Stock
In connection with the Restructuring, Denham, Camulos Capital LP, Mr. Mayer, Mr. Parikh and Ms. Artman-Hodge, Holdings’ former EVP, all of whom were issued shares of Class C Common Stock, also acquired 6,476,733 shares, 2,066,715 shares, 258,339 shares, 258,339 shares and 103,336 shares, respectively, of Class A Common Stock and Original Notes in the aggregate amount of $6.3 million, $2.0 million, $0.3 million, $0.3 million and $0.1 million, respectively.
Independence of Directors
As of July 27, 2010, the Board of Directors has determined that each of Messrs. Bernstein, Carte, Chapman, Hamilton, Landuyt, Maffett and Moore has no material relationship with the Company and has no current or prior relationship with the Company, any holder of shares of any class of common stock or any member of management of the Company that might cause such director to act other than in an entirely independent manner with respect to all issues that come before the Board of Directors, and accordingly, each is independent. Mr. Mayer is not deemed to be independent because the Company currently employs him. Ms. Mitchell is not an independent director as a result of her affiliation with RBS Sempra, a significant stockholder of the Company and the lender and counterparty under the Commodity Supply Facility.
ITEM 14. PRINCIPAL ACCOUNTANT FEES AND SERVICES
The total fees and expenses for professional services provided by our independent registered public accounting firm, Ernst & Young LLP are presented in the table below:
|
|
|
Year ended June 30, |
|
||||
|
|
|
2010 |
|
2009 |
|
||
|
|
|
(in thousands) |
|
||||
|
|
|
|
|
|
|
||
|
Audit fees |
|
$ |
1,481 |
|
$ |
1,500 |
|
|
Tax fees |
|
173 |
|
57 |
|
||
|
Total |
|
$ |
1,654 |
|
$ |
1,557 |
|
Audit Fees consist primarily of: (1) fees billed for the audit of the consolidated financial statements and review of other financial information included in our Annual Report on Form 10-K for fiscal years 2009 and 2008; (2) reviews of our Quarterly Reports on Form 10-Q; (3) review of our compliance with new U.S. GAAP pronouncements, including SEC regulations; (4) review our accounting and reporting methodology for certain specific transactions; and (5) review of our financial and other records and issuance of a comfort letter associated with the exchange of bonds that occurred pursuant to the Restructuring.
Tax Fees consist of fees for tax compliance, tax advice and tax planning.
The Audit Committee has the responsibility to consider the compatibility of non-audit services provided by its independent auditors with maintaining the auditors’ independence. There were no such non-audit services performed by the independent registered public accounting firm during the fiscal year ended June 30, 2010.
Pre-Approval Policy
The services performed by the independent registered public accounting firm during the fiscal year ended June 30, 2010 were pre-approved by the Audit Committee, in accordance with the Audit Committee’s independent registered public accounting firm pre-approval policy. This policy describes the permitted audit, audit-related and tax services (collectively, referred to as the disclosure categories) that the independent registered public accounting firm may perform up to a pre-determined dollar limit per project. The policy requires a description of the material services (referred to as the standard services list) expected to be performed by the independent registered public accounting firm in each of the disclosure categories presented to the audit committee for approval.
Any requests for audit, audit-related and tax services not contemplated on the standard services list or exceeding the pre-determined dollar limit per project must be submitted to the Audit Committee for specific pre-approval and cannot commence until such approval has been granted. Normally, pre-approval is provided on an informal, as-needed basis. The Audit Committee may delegate pre-approval authority to one of its members, who shall initially be the chairman of the Audit Committee. The decisions of any Audit Committee member to whom pre-approval authority is delegated must be presented to the full Audit Committee at its next scheduled meeting.
ITEM 15. EXHIBITS AND FINANCIAL STATEMENT SCHEDULES
The following documents are filed as part of this Annual Report:
|
(1) |
|
Financial Statements. See Index to Financial Statements under “Item 8. Financial Statements and Supplementary Data.” |
|
(2) |
|
Financial Statement Schedules. Schedules are omitted as the required information is inapplicable or the information is presented in the consolidated financial statements or related notes under “Item 8. Financial Statements and Supplementary Data.” |
|
(3) |
|
Exhibits. The exhibits filed as part of this Annual Report are listed in the exhibit index immediately preceding such exhibits. Such index is incorporated herein by reference. |
Pursuant to the requirements of Section 13 or 15(d) of the Securities Exchange Act of 1934, the Registrant has duly caused this Form 10-K/A to be signed on its behalf by the undersigned, thereunto duly authorized.
|
|
|
MXENERGY HOLDINGS INC. |
||
|
|
|
|
|
|
|
Date: September 29, 2010 |
|
By: |
/s/ JEFFREY A. MAYER |
|
|
|
|
|
Jeffrey A. Mayer |
|
|
|
|
|
President and Chief Executive Officer |
|
Index to Exhibits
|
Exhibit |
|
Title |
|
3.1 |
|
Third Amended and Restated Certificate of Incorporation of MXenergy Holdings Inc. (25) |
|
3.13 |
|
Fourth Amended and Restated Bylaws of MXenergy Holdings Inc. (25) |
|
4.1 |
|
Indenture, dated as of August 4, 2006, by and among MXenergy Holdings Inc., Law Debenture Trust Company of New York, as trustee, and Deutsche Bank Trust Company Americas, as registrar and paying agent, related to MXenergy’s Floating Rate Senior Notes due 2011 (1) |
|
4.2 |
|
Supplemental Indenture, dated as of August 1, 2007, by and among MXenergy Holdings Inc., Law Debenture Trust Company of New York, as trustee, and Deutsche Bank Trust Company Americas, as registrar and paying agent, related to MXenergy’s Floating Rate Senior Notes due 2011 (3) |
|
4.3 |
|
Second Supplemental Indenture, dated as of September 22, 2009, by and among MXenergy Holdings Inc., the subsidiary guarantors party thereto and Law Debenture Trust Company of New York, as trustee, related to MXenergy’s Floating Rate Senior Notes due 2011 (19) |
|
4.4 |
|
Form of Senior Floating Rate Note due 2011 (included in Exhibit 4.1) (1) |
|
4.5 |
|
Registration Rights Agreement, dated as of August 4, 2006, by and among MXenergy Holdings Inc., the guarantors named therein and Deutsche Bank Securities Inc. and Morgan Stanley & Co. Incorporated, as initial purchasers (1) |
|
4.6 |
|
Registration Rights Agreement dated as of June 25, 2004, by and among MXenergy Inc., Denham Commodity Partners Fund LP (formerly known as Sowood Commodity Partners Fund LP) (as successor to Lathi LLC), Charter Mx LLC, Greenhill Capital Partners, L.P., Greenhill Capital Partners (Cayman), L.P., Greenhill Capital Partners (Executives), L.P., Greenhill Capital, L.P., Jeffrey A. Mayer, Carole R. Artman-Hodge and Daniel P. Burke, Sr. (1) |
|
4.7 |
|
Indenture, dated as of September 22, 2009, by and among MXenergy Holdings Inc., the subsidiary guarantors party thereto and Law Debenture Trust Company of New York, as trustee, related to MXenergy’s 13.25% Senior Subordinated Secured Notes due 2014 (19) |
|
4.8 |
|
Form of 13.25% Senior Subordinated Secured Note due 2014 (included in Exhibit 4.7) (19) |
|
4.9 |
|
Intercreditor and Subordination Agreement, dated as of September 22, 2009, by and among MXenergy Holdings Inc., Sempra Energy Trading LLC, as facility agent, the other pledgors from time to time party thereto and Law Debenture Trust Company of New York, as trustee (19) |
|
4.10 |
|
Notes Registration Rights Agreement, dated as of September 22, 2009, by and among MXenergy Holdings Inc., the subsidiary guarantors party thereto and the holders of 13.25% Senior Subordinated Secured Notes due 2014 party thereto (19) |
|
4.11 |
|
Equity Registration Rights Agreement, dated as of September 22, 2009, by and among MXenergy Holdings Inc. and the stockholders of MXenergy Holdings Inc. party thereto (19) |
|
9.1 |
|
Class A Voting Agreement, dated as of September 22, 2009, by and among the holders of Class A common stock party thereto (19) |
|
9.2 |
|
Class C Voting Agreement, dated as of September 22, 2009, by and among the holders of Class C common stock party thereto (19) |
|
10.1 |
|
Third Amended and Restated Credit Agreement, dated as of November 17, 2008, by and among MXenergy Inc. and MXenergy Electric Inc., as borrowers, MXenergy Holdings Inc. and certain subsidiaries thereof, as guarantors, and lenders party thereto (9) |
|
10.2 |
|
First Amendment to Third Amended and Restated Credit Agreement, dated as of March 11, 2009, by and among MXenergy Inc. and MXenergy Electric Inc., as borrowers, MXenergy Holdings Inc. and certain subsidiaries thereof, as guarantors, and lenders party thereto (10) |
|
10.3 |
|
Second Amendment to Third Amended and Restated Credit Agreement, dated as of May 15, 2009, by and among MXenergy Inc. and MXenergy Electric Inc., as borrowers, MXenergy Holdings Inc. and certain subsidiaries thereof, as guarantors, and lenders party thereto (11) |
|
10.4 |
|
Third Amendment and Waiver to Third Amended and Restated Credit Agreement, dated as of May 29, 2009, by and among MXenergy Inc. and MXenergy Electric Inc., as borrowers, MXenergy Holdings Inc. and certain subsidiaries thereof, as guarantors, the lenders party thereto and Société Générale, as administrative agent (12) |
|
10.5 |
|
Fourth Amendment and Waiver to the Third Amended and Restated Credit Agreement, dated as of June 8, 2009, by and among MXenergy Inc. and MXenergy Electric Inc., as borrowers, MXenergy Holdings Inc. and certain subsidiaries thereof, as guarantors, the lenders party thereto and Société Générale, as administrative agent (13) |
|
10.6 |
|
Fifth Amendment to the Third Amended and Restated Credit Agreement, dated as of June 15, 2009, by and among MXenergy Inc. and MXenergy Electric Inc., as borrowers, MXenergy Holdings Inc. and certain subsidiaries thereof, as guarantors, the lenders party thereto and Société Générale, as administrative agent (14) |
|
10.7 |
|
Sixth Amendment, Waiver and Consent to the Third Amended and Restated Credit Agreement, dated as of July 31, 2009, by and among MXenergy Inc. and MXenergy Electric Inc., as borrowers, MXenergy Holdings Inc. and certain subsidiaries thereof, as guarantors, the lenders party thereto and Société Générale, as administrative agent (15) |
|
10.8 |
|
Seventh Amendment and Waiver to the Third Amended and Restated Credit Agreement, dated as of August 14, 2009, by and among MXenergy Inc. and MXenergy Electric Inc., as borrowers, MXenergy Holdings Inc. and certain subsidiaries thereof, as guarantors, the lenders party thereto and Société Générale, as administrative agent (16) |
|
10.9 |
|
Eighth Amendment and Waiver to the Third Amended and Restated Credit Agreement, dated as of August 31, 2009, by and among MXenergy Inc. and MXenergy Electric Inc., as borrowers, MXenergy Holdings Inc. and certain subsidiaries thereof, as guarantors, the lenders party thereto and Société Générale, as administrative agent (17) |
|
10.10 |
|
Ninth Amendment and Waiver to the Third Amended and Restated Credit Agreement, dated as of September 14, 2009, by |
|
|
|
and among MXenergy Inc. and MXenergy Electric Inc., as borrowers, MXenergy Holdings Inc. and certain subsidiaries thereof, as guarantors, the lenders party thereto and Société Générale, as administrative agent (18) |
|
10.11 |
|
First Amended and Restated Pledge Agreement, dated as of August 1, 2006, by and among MXenergy Inc. and MXenergy Electric Inc., as borrowers, MXenergy Holdings Inc. and certain subsidiaries thereof, as guarantors, and Société Générale (1) |
|
10.12 |
|
First Amended and Restated Security Agreement, dated as of August 1, 2006, by and among MXenergy Inc. and MXenergy Electric Inc., as borrowers, MXenergy Holdings Inc. and certain subsidiaries thereof, as guarantors, and Société Générale (1) |
|
10.13 |
|
Subordination and Intercreditor Agreement, dated as of December 19, 2005, by and among Société Générale and certain counterparties, Denham Commodity Partners Fund LP (formerly known as Sowood Commodity Partners Fund LP), MXenergy Holdings Inc., MXenergy Inc., MXenergy Electric Inc. and certain of their respective subsidiaries and Virginia Power Energy Marketing, Inc. (1) |
|
10.14 |
|
Amendment No. 1, dated as of August 1, 2006, to the Subordination and Intercreditor Agreement, dated as of December 19, 2005, by and among Société Générale and certain counterparties, Denham Commodity Partners Fund LP (formerly known as Sowood Commodity Partners Fund LP), MXenergy Holdings Inc., MXenergy Inc. and certain of their respective subsidiaries (1) |
|
10.15 |
|
Amendment No. 2, dated as of November 7, 2008, to the Subordination and Intercreditor Agreement dated as of December 19, 2005, by and among Société Générale (as Administrative Agent for various secured counterparties), Denham Commodity Partners Fund LP, MXenergy Holdings Inc., MXenergy Inc., MXenergy Electric Inc. and certain of their respective subsidiaries (23) |
|
10.16 |
|
Amendment No. 3, dated as of June 8, 2009, to the Subordination and Intercreditor Agreement dated as of December 19, 2005, by and among Société Générale, Denham Commodity Partners Fund LP, MXenergy Holdings Inc., MXenergy Inc., MXenergy Electric Inc. and certain of their respective subsidiaries (13) |
|
10.17 |
|
Master Transaction Agreement, dated as of August 1, 2006, by and among MXenergy Inc., MXenergy Holdings Inc. and certain subsidiaries thereof, as guarantors, and Société Générale (1) |
|
10.18 |
|
First Amendment to Master Transaction Agreement, dated as of April 6, 2007, by and among MXenergy Inc., MXenergy Holdings Inc. and certain subsidiaries thereof, as guarantors, and Société Générale (1) |
|
10.19 |
|
Second Amendment to Master Transaction Agreement, dated as of December 17, 2007, by and among MXenergy Inc., MXenergy Holdings Inc. and certain subsidiaries thereof, as guarantors, and Société Générale (4) |
|
10.20 |
|
Third Amendment to Master Transaction Agreement, dated as of May 12, 2008, by and among MXenergy Inc., MXenergy Holdings Inc. and certain subsidiaries thereof, as guarantors, and Société Générale (5) |
|
10.21 |
|
Fourth Amendment to Master Transaction Agreement, dated as of July 31, 2008, by and among MXenergy Inc., MXenergy Holdings Inc. and certain subsidiaries thereof, as guarantors, and Société Générale (7) |
|
10.22 |
|
Fifth Amendment to Master Transaction Agreement, dated as of September 30, 2008, by and among MXenergy Inc., MXenergy Holdings Inc. and certain subsidiaries thereof, as guarantors, and Société Générale (6) |
|
10.23 |
|
Sixth Amendment to Master Transaction Agreement, dated as of November 5, 2008, by and among MXenergy Inc., MXenergy Holdings Inc. and certain subsidiaries thereof, as guarantors, and Société Générale (8) |
|
10.24 |
|
Seventh Amendment to Master Transaction Agreement, dated as of November 7, 2008, by and among MXenergy Inc., MXenergy Holdings Inc. and certain subsidiaries thereof, as guarantors, and Société Générale (8) |
|
10.25 |
|
Eighth Amendment to Master Transaction Agreement, dated as of November 17, 2008, by and among MXenergy Inc., MXenergy Holdings Inc. and certain subsidiaries thereof, as guarantors, and Société Générale (9) |
|
10.26 |
|
Ninth Amendment to Master Transaction Agreement, dated as of March 16, 2009, by and among MXenergy Inc., MXenergy Holdings Inc. and certain subsidiaries thereof, as guarantors, and Société Générale (10) |
|
10.27 |
|
Tenth Amendment to Master Transaction Agreement, dated as of May 15, 2009, by and among MXenergy Inc., MXenergy Holdings Inc. and certain subsidiaries thereof, as guarantors, and Société Générale (11) |
|
10.28 |
|
Eleventh Amendment to Master Transaction Agreement, dated as of May 29, 2009, by and among MXenergy Inc., MXenergy Holdings Inc. and certain subsidiaries thereof, as guarantors, and Société Générale, as hedge provider (12) |
|
10.29 |
|
Twelfth Amendment to the Master Transaction Agreement, dated as of June 8, 2009, by and among MXenergy Inc., MXenergy Holdings Inc. and certain subsidiaries thereof, as guarantors, and Société Générale, as hedge provider (13) |
|
10.30 |
|
Thirteenth Amendment to the Master Transaction Agreement, dated as of July 31, 2009, by and among MXenergy Inc., MXenergy Holdings Inc. and certain subsidiaries thereof, as guarantors, and Société Générale, as hedge provider (15) |
|
10.31 |
|
Fourteenth Amendment to the Master Transaction Agreement, dated as of August 14, 2009, by and among MXenergy Inc., MXenergy Holdings Inc. and certain subsidiaries thereof, as guarantors, and Société Générale, as hedge provider (16) |
|
10.32 |
|
Fifteenth Amendment to the Master Transaction Agreement, dated as of August 31, 2009, by and among MXenergy Inc., MXenergy Holdings Inc. and certain subsidiaries thereof, as guarantors, and Société Générale, as hedge provider (17) |
|
10.33 |
|
Sixteenth Amendment to the Master Transaction Agreement, dated as of September 3, 2009, by and among MXenergy Inc., MXenergy Holdings Inc. and certain subsidiaries thereof, as guarantors, and Société Générale, as hedge provider (23) |
|
10.34 |
|
Seventeenth Amendment and Waiver to the Master Transaction Agreement, dated as of September 14, 2009, by and among MXenergy Inc., MXenergy Holdings Inc. and certain subsidiaries thereof, as guarantors, and Société Générale, as hedge provider (18) |
|
10.35 |
|
Employment Agreement, dated as of February 13, 2008, by and between MXenergy Holdings Inc. and Jeffrey Mayer # (4) |
|
10.36 |
|
Employment Agreement, dated as of April 1, 1999, by and between MXenergy Holdings Inc. and Carole R. (“Robi”) Artman- Hodge # (1) |
|
10.37 |
|
Severance Agreement, dated May 14, 2010, by and between MXenergy Holdings Inc. and Carole R. Artman-Hodge # (21) |
|
10.38 |
|
Employment Agreement, dated as of February 13, 2008, by and between MXenergy Holdings Inc. and Chaitu Parikh # (4) |
|
10.39 |
|
Relocation Agreement, dated May 10, 2010, by and between MXenergy Holdings Inc. and Chaitu Parikh # (21) |
|
10.40 |
|
First Amendment to Employment Agreement, dated as of May 14, 2010, by and between MXenergy Holdings Inc. and Chaitu Parikh # (22) |
|
10.41 |
|
Employment Agreement, dated as of June 13, 2007, by and between MXenergy Inc. and Gina Goldberg # (2) |
|
10.42 |
|
Amendment to the Employment Agreement, dated as of December 31, 2008, by and between MXenergy Holdings Inc. and |
|
|
|
Gina Goldberg # (26) |
|
10.43 |
|
Employment Letter Agreement, dated as of March 27, 2001, by and between MXenergy Inc. and Robert Blake # (26) |
|
10.44 |
|
Amendment to Employment Letter Agreement, dated as of December 30, 2009, by and between MXenergy Inc. and Robert Blake # (26) |
|
10.45 |
|
Employment Agreement, dated as of April 1, 2010, by and between MXenergy Inc. and Robert Werner # (26) |
|
10.46 |
|
MXenergy Holdings Inc. 2010 Stock Incentive Plan # (20) |
|
10.47 |
|
Form of Restricted Stock Award Agreement: Officers under the 2010 Stock Incentive Plan # (20) |
|
10.48 |
|
Form of Restricted Stock Award Agreement: Non-Employee Directors under the 2010 Stock Incentive Plan # (20) |
|
10.49 |
|
ISDA Master Agreement, dated as of September 22, 2009, between Sempra Energy Trading LLC and MXenergy Inc. (including the schedule thereto) (19) |
|
10.50 |
|
ISDA Master Agreement, dated as of September 22, 2009, between Sempra Energy Trading LLC and MXenergy Electric Inc. (including the schedule thereto) (19) |
|
10.51 |
|
Letter of Agreement, dated as of March 1, 2010, by and among MXenergy Inc. and Sempra Energy Trading LLC (21) |
|
10.52 |
|
Second Amendment to the ISDA Master Agreement, dated as of December 21, 2009, between Sempra Energy Trading LLC and MXenergy Inc. (20) |
|
10.53 |
|
Third Amendment, dated as of May 28, 2010, to the ISDA Master Agreement, dated as of September 22, 2009, among Sempra Energy Trading LLC, MXenergy Inc. and the Specified Entities Party Thereto (24) |
|
10.54 |
|
Second Amendment, dated as of May 28, 2010, to the ISDA Master Agreement, dated as of September 22, 2009, among Sempra Energy Trading LLC, MXenergy Electric Inc. and the Specified Entities Party Thereto (24) |
|
10.55 |
|
Guarantee and Collateral Agreement, dated as of September 22, 2009, among MXenergy Holdings Inc., MXenergy Electric Inc., MXenergy Inc. and the other subsidiaries of MXenergy Holdings Inc. party thereto, as grantors, and Sempra Energy Trading LLC, as secured party (19) |
|
10.56 |
|
First Amendment, dated as of May 28, 2010, to the Guarantee and Collateral Agreement, dated as of September 22, 2009, among MXenergy Holdings Inc., MXenergy Electric Inc., MXenergy Inc. and the Other Parties Thereto, as Grantors, and Sempra Energy Trading LLC, as Secured Party (24) |
|
10.57 |
|
Stockholders Agreement, dated as of September 22, 2009, by and among MXenergy Holdings Inc. and the stockholders of MXenergy Holdings Inc. party thereto (19) |
|
10.58 |
|
Amendment No. 1 to the Stockholders Agreement, dated as of July 26, 2010, by and among MXenergy Holdings Inc. and the stockholders of MXenergy Holdings Inc. party thereto (25) |
|
10.59 |
|
Amendment and Waiver Agreement, dated as of September 22, 2009, among MXenergy Holdings Inc. and the stockholders of MXenergy Holdings Inc. party thereto (19) |
|
10.60 |
|
Second Lien Collateral Agreement, dated as of September 22, 2009, by and among MXenergy Holdings Inc., the subsidiary guarantors party thereto and Law Debenture Trust Company of New York, as collateral agent (19) |
|
10.61 |
|
Notes Escrow and Security Agreement, dated as of September 22, 2009, by and among MXenergy Holdings Inc., Law Debenture Trust Company of New York, as trustee, and Law Debenture Trust Company of New York, as collateral agent (19) |
|
10.62 |
|
Form of Guarantee of 13.25% Senior Subordinated Notes due 2014 (included in Exhibit 4.7) (19) |
|
21 |
|
Subsidiaries of MXenergy Holdings Inc. (26) |
|
31.1 |
|
Certification as adopted pursuant to Section 302 of the Sarbanes-Oxley Act of 2002 * |
|
31.2 |
|
Certification as adopted pursuant to Section 302 of the Sarbanes-Oxley Act of 2002 * |
|
32 |
|
Certification required by 18 United States Code Section 1350, as adopted pursuant to Section 906 of the Sarbanes-Oxley Act of 2002 * † |
|
* |
|
Filed herewith. |
|
|
|
|
|
† |
|
Pursuant to Securities and Exchange Commission Release No. 33-8238, this certification will be treated as “accompanying” this Annual Report on Form 10-K and not “filed” as part of such report for purposes of Section 18 of the Securities Exchange Act of 1934, or otherwise subject to the liability of Section 18 of the Securities Exchange Act of 1934 and this certification will not be deemed to be incorporated by reference into any filing under the Securities Act of 1933 or the Securities Exchange Act of 1934, except to the extent that the registrant specifically incorporates it by reference. |
|
|
|
|
|
# |
|
Material compensation contract. |
|
|
|
|
|
(1) |
|
Filed with the Company’s Registration Statement on Form S-4 (File No. 333-138425) declared effective on April 30, 2007. |
|
|
|
|
|
(2) |
|
Filed with the Company’s Annual Report on Form 10-K for the fiscal year ended June 30, 2007. |
|
|
|
|
|
(3) |
|
Filed with the Company’s Current Report on Form 8-K filed on August 1, 2007. |
|
|
|
|
|
(4) |
|
Filed with the Company’s Quarterly Report on Form 10-Q for the quarterly period ended December 31, 2007. |
|
|
|
|
|
(5) |
|
Filed with the Company’s Quarterly Report on Form 10-Q for the quarterly period ended March 31, 2008. |
|
|
|
|
|
(6) |
|
Filed with the Company’s Annual Report on Form 10-K for the fiscal year ended June 30, 2008. |
|
|
|
|
|
(7) |
|
Filed with the Company’s Current Report on Form 8-K filed on August 1, 2008. |
|
|
|
|
|
(8) |
|
Filed with the Company’s Current Report on Form 8-K filed on November 12, 2008. |
|
(9) |
|
Filed with the Company’s Quarterly Report on Form 10-Q for the quarterly period ended September 30, 2008. |
|
|
|
|
|
(10) |
|
Filed with the Company’s Current Report on Form 8-K filed on March 18, 2009. |
|
|
|
|
|
(11) |
|
Filed with the Company’s Quarterly Report on Form 10-Q for the quarterly period ended March 31, 2009. |
|
|
|
|
|
(12) |
|
Filed with the Company’s Current Report on Form 8-K filed on June 3, 2009. |
|
|
|
|
|
(13) |
|
Filed with the Company’s Current Report on Form 8-K filed on June 12, 2009. |
|
|
|
|
|
(14) |
|
Filed with the Company’s Current Report on Form 8-K filed on June 18, 2009. |
|
|
|
|
|
(15) |
|
Filed with the Company’s Current Report on Form 8-K filed on August 3, 2009. |
|
|
|
|
|
(16) |
|
Filed with the Company’s Current Report on Form 8-K filed on August 18, 2009. |
|
|
|
|
|
(17) |
|
Filed with the Company’s Current Report on Form 8-K filed on September 3, 2009. |
|
|
|
|
|
(18) |
|
Filed with the Company’s Current Report on Form 8-K filed on September 16, 2009. |
|
|
|
|
|
(19) |
|
Filed with the Company’s Current Report on Form 8-K filed on September 28, 2009. |
|
|
|
|
|
(20) |
|
Filed with the Company’s Quarterly Report on Form 10-Q for the quarterly period ended December 31, 2009. |
|
|
|
|
|
(21) |
|
Filed with the Company’s Quarterly Report on Form 10-Q for the quarterly period ended March 31, 2010. |
|
|
|
|
|
(22) |
|
Filed with the Company’s Current Report on Form 8-K filed on May 27, 2010. |
|
|
|
|
|
(23) |
|
Filed with the Company’s Annual Report on Form 10-K for the fiscal year ended June 30, 2009. |
|
|
|
|
|
(24) |
|
Filed with the Company’s Current Report on Form 8-K filed on June 3, 2010. |
|
|
|
|
|
(25) |
|
Filed with the Company’s Current Report on Form 8-K filed on July 28, 2010. |
|
|
|
|
|
(26) |
|
Filed with the Company’s Annual Report on Form 10-K for the fiscal year ended June 30, 2010. |